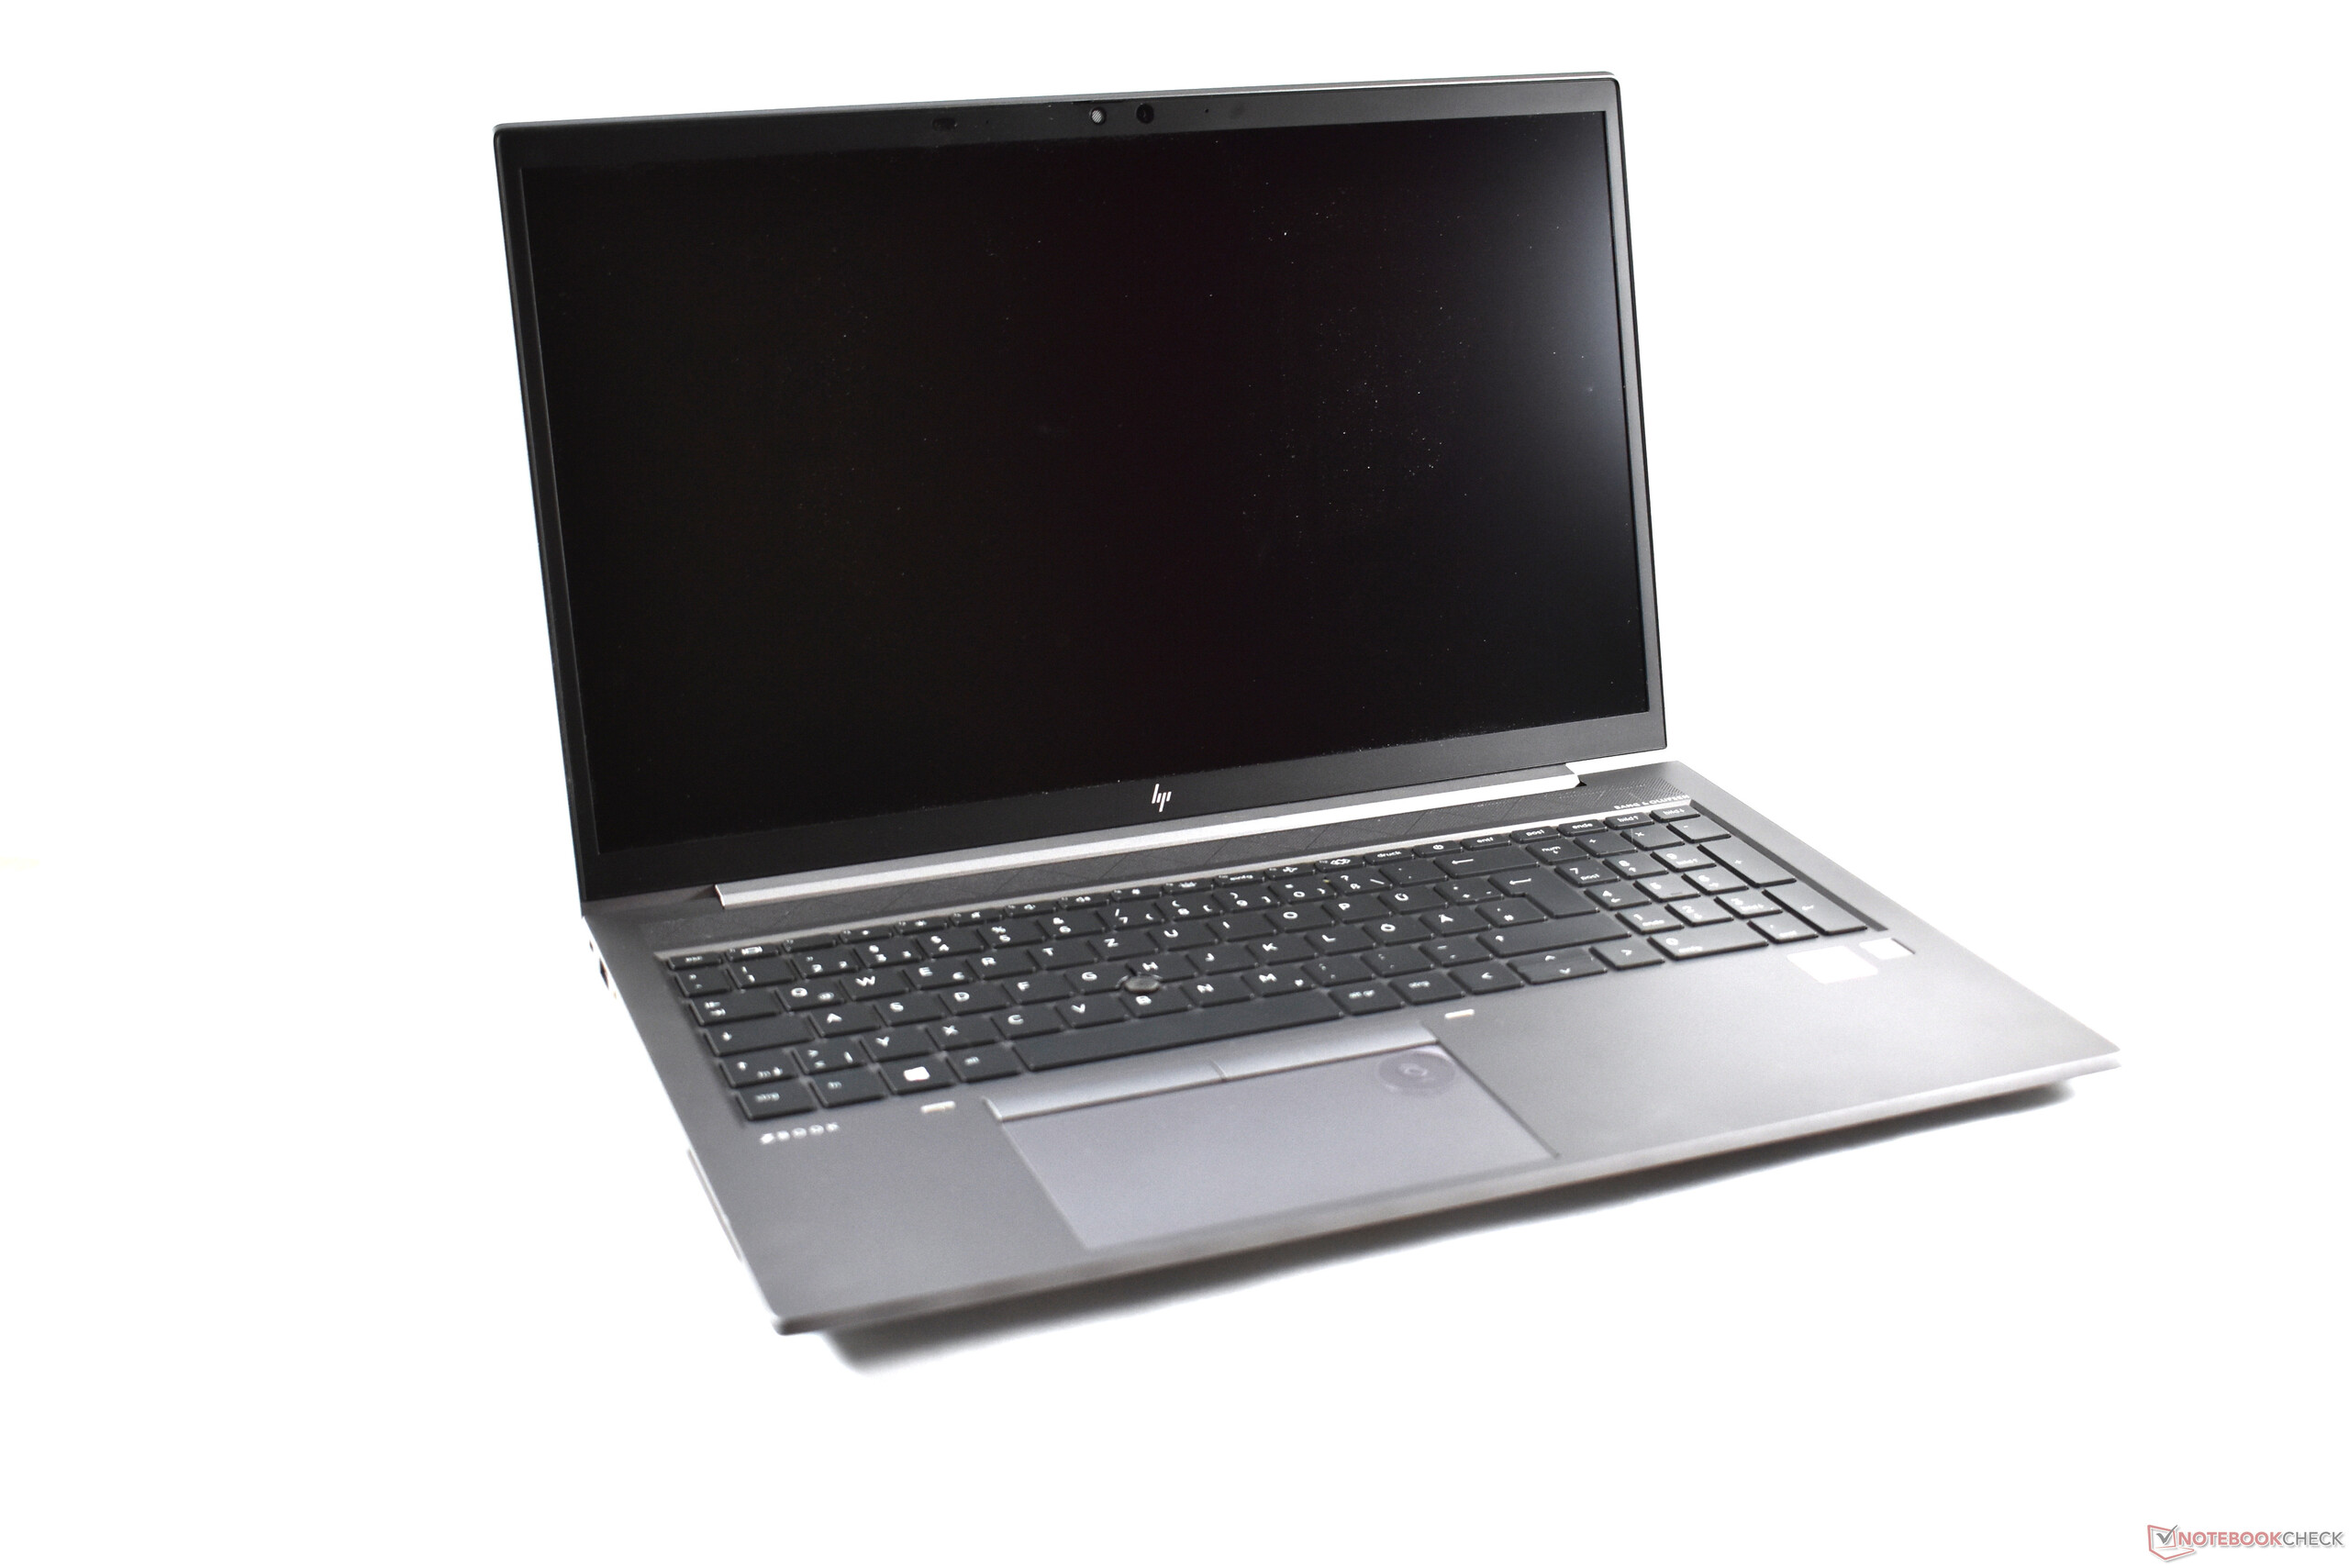
Breve Análise do Portátil HP ZBook Firefly 15 G7: Já desatualizado por um Intel Comet Lake e Nvidia Pascal mesmo sem um sucessor
Avaliação | Data | Modelo | Peso | Altura | Size | Resolução | Preço |
|---|---|---|---|---|---|---|---|
| 82.7 % v7 (old) | 10/2020 | HP ZBook Firefly 15 G7 i7-10610U, Quadro P520 | 1.8 kg | 19.2 mm | 15.60" | 3840x2160 | |
| 80.8 % v7 (old) | 10/2019 | HP ZBook 15u G6 6TP54EA i7-8565U, Radeon Pro WX 3200 | 1.6 kg | 19 mm | 15.60" | 3840x2160 | |
| 81.2 % v7 (old) | 11/2019 | Lenovo ThinkPad P53s-20N6001NGE i7-8565U, Quadro P520 | 1.9 kg | 19.95 mm | 15.60" | 1920x1080 | |
| 86.3 % v7 (old) | 08/2020 | Dell Precision 5550 P91F i7-10875H, Quadro T2000 Max-Q | 2 kg | 18 mm | 15.60" | 3840x2400 |


| |||||||||||||||||||||||||
iluminação: 92 %
iluminação com acumulador: 389 cd/m²
Contraste: 1814:1 (Preto: 0.21 cd/m²)
ΔE ColorChecker Calman: 3 | ∀{0.5-29.43 Ø4.71}
calibrated: 1.5
ΔE Greyscale Calman: 3.5 | ∀{0.09-98 Ø4.96}
97.5% sRGB (Argyll 1.6.3 3D)
64.3% AdobeRGB 1998 (Argyll 1.6.3 3D)
69.8% AdobeRGB 1998 (Argyll 3D)
97.7% sRGB (Argyll 3D)
68.8% Display P3 (Argyll 3D)
Gamma: 2.26
CCT: 7254 K
| HP ZBook Firefly 15 G7 LGD064F, IPS LED, 3840x2160, 15.6" | HP ZBook 15u G6 6TP54EA AU Optronics AUO30EB, IPS, 3840x2160, 15.6" | Lenovo ThinkPad P53s-20N6001NGE Lenovo LEN40BA, IPS, 1920x1080, 15.6" | Dell Precision 5550 P91F Sharp LQ156R1, IPS, 3840x2400, 15.6" | Lenovo ThinkPad T15 Gen1-20S7S02U00 NE156QUM-N66, IPS LED, 3840x2160, 15.6" | |
|---|---|---|---|---|---|
| Display | 0% | -41% | 25% | 18% | |
| Display P3 Coverage (%) | 68.8 | 69.2 1% | 39.58 -42% | 89.9 31% | 80.7 17% |
| sRGB Coverage (%) | 97.7 | 97.1 -1% | 57.6 -41% | 100 2% | 98.1 0% |
| AdobeRGB 1998 Coverage (%) | 69.8 | 69.7 0% | 40.89 -41% | 99.9 43% | 95.5 37% |
| Response Times | -26% | -13% | -8% | 18% | |
| Response Time Grey 50% / Grey 80% * (ms) | 44 ? | 68.8 ? -56% | 51.2 ? -16% | 46 ? -5% | 42 ? 5% |
| Response Time Black / White * (ms) | 30.8 ? | 29.6 4% | 33.6 ? -9% | 34 ? -10% | 21.6 ? 30% |
| PWM Frequency (Hz) | |||||
| Screen | -12% | -67% | -38% | 3% | |
| Brightness middle (cd/m²) | 381 | 451 18% | 260 -32% | 469.8 23% | 489 28% |
| Brightness (cd/m²) | 382 | 434 14% | 243 -36% | 464 21% | 501 31% |
| Brightness Distribution (%) | 92 | 89 -3% | 88 -4% | 85 -8% | 91 -1% |
| Black Level * (cd/m²) | 0.21 | 0.25 -19% | 0.18 14% | 0.42 -100% | 0.35 -67% |
| Contrast (:1) | 1814 | 1804 -1% | 1444 -20% | 1119 -38% | 1397 -23% |
| Colorchecker dE 2000 * | 3 | 4.4 -47% | 6 -100% | 5.16 -72% | 3 -0% |
| Colorchecker dE 2000 max. * | 5.2 | 6.7 -29% | 19.2 -269% | 9.33 -79% | 5.1 2% |
| Colorchecker dE 2000 calibrated * | 1.5 | 1.8 -20% | 4.3 -187% | 3.75 -150% | 0.8 47% |
| Greyscale dE 2000 * | 3.5 | 5 -43% | 4.2 -20% | 5.5 -57% | 4 -14% |
| Gamma | 2.26 97% | 2.31 95% | 2.49 88% | 2 110% | 2.24 98% |
| CCT | 7254 90% | 7717 84% | 6865 95% | 6198 105% | 7400 88% |
| Color Space (Percent of AdobeRGB 1998) (%) | 64.3 | 63 -2% | 37.6 -42% | 89.2 39% | 84.7 32% |
| Color Space (Percent of sRGB) (%) | 97.5 | 97 -1% | 59.2 -39% | 100 3% | 98.1 1% |
| Média Total (Programa/Configurações) | -13% /
-12% | -40% /
-55% | -7% /
-22% | 13% /
8% |
* ... menor é melhor
Exibir tempos de resposta
| ↔ Tempo de resposta preto para branco | ||
|---|---|---|
| 30.8 ms ... ascensão ↗ e queda ↘ combinadas | ↗ 16.4 ms ascensão | 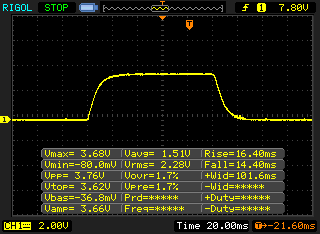 |
| ↘ 14.4 ms queda | ||
| A tela mostra taxas de resposta lentas em nossos testes e será insatisfatória para os jogadores. Em comparação, todos os dispositivos testados variam de 0.1 (mínimo) a 240 (máximo) ms. » 83 % de todos os dispositivos são melhores. Isso significa que o tempo de resposta medido é pior que a média de todos os dispositivos testados (19.8 ms). | ||
| ↔ Tempo de resposta 50% cinza a 80% cinza | ||
| 44 ms ... ascensão ↗ e queda ↘ combinadas | ↗ 21.2 ms ascensão | 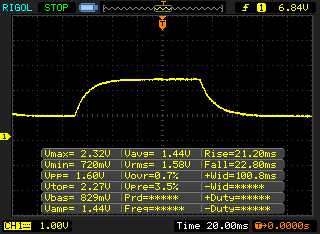 |
| ↘ 22.8 ms queda | ||
| A tela mostra taxas de resposta lentas em nossos testes e será insatisfatória para os jogadores. Em comparação, todos os dispositivos testados variam de 0.165 (mínimo) a 636 (máximo) ms. » 73 % de todos os dispositivos são melhores. Isso significa que o tempo de resposta medido é pior que a média de todos os dispositivos testados (31 ms). | ||
Cintilação da tela / PWM (modulação por largura de pulso)
| Tela tremeluzindo / PWM não detectado | 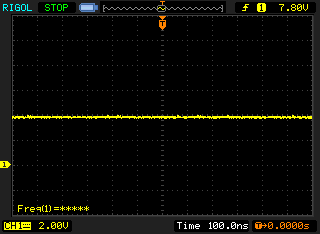 | ||
[pwm_comparison] Em comparação: 52 % de todos os dispositivos testados não usam PWM para escurecer a tela. Se PWM foi detectado, uma média de 7757 (mínimo: 5 - máximo: 343500) Hz foi medida. | |||
Cinebench R20: CPU (Multi Core) | CPU (Single Core)
Blender: v2.79 BMW27 CPU
7-Zip 18.03: 7z b 4 -mmt1 | 7z b 4
Geekbench 5.5: Single-Core | Multi-Core
HWBOT x265 Benchmark v2.2: 4k Preset
LibreOffice : 20 Documents To PDF
R Benchmark 2.5: Overall mean
| Cinebench R15 / CPU Multi 64Bit | |
| Média da turma Workstation (2489 - 5810, n=23, últimos 2 anos) | |
| Dell Precision 5550 P91F | |
| Lenovo ThinkPad T14s-20UJS00K00 | |
| Lenovo ThinkPad T15 Gen1-20S7S02U00 | |
| Lenovo ThinkPad P53s-20N6001NGE | |
| HP ZBook Firefly 15 G7 | |
| Média Intel Core i7-10610U (548 - 738, n=6) | |
| HP ZBook 15u G6 6TP54EA | |
| Cinebench R15 / CPU Single 64Bit | |
| Média da turma Workstation (191.4 - 328, n=23, últimos 2 anos) | |
| Dell Precision 5550 P91F | |
| HP ZBook Firefly 15 G7 | |
| Lenovo ThinkPad T15 Gen1-20S7S02U00 | |
| Lenovo ThinkPad T14s-20UJS00K00 | |
| Lenovo ThinkPad P53s-20N6001NGE | |
| Média Intel Core i7-10610U (133 - 200, n=6) | |
| HP ZBook 15u G6 6TP54EA | |
| Cinebench R20 / CPU (Multi Core) | |
| Média da turma Workstation (5760 - 15043, n=23, últimos 2 anos) | |
| Dell Precision 5550 P91F | |
| Lenovo ThinkPad T14s-20UJS00K00 | |
| Lenovo ThinkPad T15 Gen1-20S7S02U00 | |
| HP ZBook Firefly 15 G7 | |
| Média Intel Core i7-10610U (1271 - 1663, n=6) | |
| Cinebench R20 / CPU (Single Core) | |
| Média da turma Workstation (671 - 857, n=23, últimos 2 anos) | |
| Dell Precision 5550 P91F | |
| Lenovo ThinkPad T15 Gen1-20S7S02U00 | |
| HP ZBook Firefly 15 G7 | |
| Lenovo ThinkPad T14s-20UJS00K00 | |
| Média Intel Core i7-10610U (349 - 482, n=6) | |
| Blender / v2.79 BMW27 CPU | |
| HP ZBook 15u G6 6TP54EA | |
| Média Intel Core i7-10610U (641 - 816, n=6) | |
| Lenovo ThinkPad P53s-20N6001NGE | |
| Lenovo ThinkPad T15 Gen1-20S7S02U00 | |
| HP ZBook Firefly 15 G7 | |
| Lenovo ThinkPad T14s-20UJS00K00 | |
| Dell Precision 5550 P91F | |
| Média da turma Workstation (91 - 222, n=23, últimos 2 anos) | |
| 7-Zip 18.03 / 7z b 4 -mmt1 | |
| Média da turma Workstation (5126 - 6960, n=23, últimos 2 anos) | |
| Dell Precision 5550 P91F | |
| Lenovo ThinkPad P53s-20N6001NGE | |
| Lenovo ThinkPad T15 Gen1-20S7S02U00 | |
| HP ZBook Firefly 15 G7 | |
| HP ZBook 15u G6 6TP54EA | |
| Lenovo ThinkPad T14s-20UJS00K00 | |
| Média Intel Core i7-10610U (3653 - 4853, n=6) | |
| 7-Zip 18.03 / 7z b 4 | |
| Média da turma Workstation (60489 - 116969, n=23, últimos 2 anos) | |
| Lenovo ThinkPad T14s-20UJS00K00 | |
| Dell Precision 5550 P91F | |
| HP ZBook Firefly 15 G7 | |
| Lenovo ThinkPad P53s-20N6001NGE | |
| Média Intel Core i7-10610U (15369 - 20332, n=6) | |
| Lenovo ThinkPad T15 Gen1-20S7S02U00 | |
| HP ZBook 15u G6 6TP54EA | |
| Geekbench 5.5 / Single-Core | |
| Média da turma Workstation (1783 - 2183, n=23, últimos 2 anos) | |
| Dell Precision 5550 P91F | |
| HP ZBook Firefly 15 G7 | |
| Lenovo ThinkPad T15 Gen1-20S7S02U00 | |
| Média Intel Core i7-10610U (1155 - 1261, n=6) | |
| Lenovo ThinkPad T14s-20UJS00K00 | |
| Geekbench 5.5 / Multi-Core | |
| Média da turma Workstation (11542 - 25554, n=23, últimos 2 anos) | |
| Dell Precision 5550 P91F | |
| Lenovo ThinkPad T14s-20UJS00K00 | |
| HP ZBook Firefly 15 G7 | |
| Média Intel Core i7-10610U (3731 - 4622, n=6) | |
| Lenovo ThinkPad T15 Gen1-20S7S02U00 | |
| HWBOT x265 Benchmark v2.2 / 4k Preset | |
| Média da turma Workstation (17.8 - 40.5, n=23, últimos 2 anos) | |
| Dell Precision 5550 P91F | |
| Lenovo ThinkPad T14s-20UJS00K00 | |
| HP ZBook Firefly 15 G7 | |
| Lenovo ThinkPad P53s-20N6001NGE | |
| Lenovo ThinkPad T15 Gen1-20S7S02U00 | |
| Média Intel Core i7-10610U (4.54 - 5.66, n=6) | |
| HP ZBook 15u G6 6TP54EA | |
| LibreOffice / 20 Documents To PDF | |
| Média Intel Core i7-10610U (56.1 - 106, n=6) | |
| HP ZBook Firefly 15 G7 | |
| Lenovo ThinkPad T14s-20UJS00K00 | |
| Lenovo ThinkPad T15 Gen1-20S7S02U00 | |
| Média da turma Workstation (37.1 - 74.7, n=23, últimos 2 anos) | |
| Dell Precision 5550 P91F | |
| R Benchmark 2.5 / Overall mean | |
| Média Intel Core i7-10610U (0.637 - 0.855, n=6) | |
| Lenovo ThinkPad T15 Gen1-20S7S02U00 | |
| HP ZBook Firefly 15 G7 | |
| Lenovo ThinkPad T14s-20UJS00K00 | |
| Dell Precision 5550 P91F | |
| Média da turma Workstation (0.3825 - 0.603, n=23, últimos 2 anos) | |
* ... menor é melhor
| PCMark 8 Home Score Accelerated v2 | 3311 pontos | |
| PCMark 8 Creative Score Accelerated v2 | 3781 pontos | |
| PCMark 8 Work Score Accelerated v2 | 4298 pontos | |
| PCMark 10 Score | 4096 pontos | |
Ajuda | ||
| DPC Latencies / LatencyMon - interrupt to process latency (max), Web, Youtube, Prime95 | |
| HP ZBook Firefly 15 G7 | |
* ... menor é melhor
| HP ZBook Firefly 15 G7 Toshiba XG6 KXG60ZNV1T02 | HP ZBook 15u G6 6TP54EA Samsung SSD PM981 MZVLB512HAJQ | Lenovo ThinkPad P53s-20N6001NGE Intel SSD 760p SSDPEKKW256G8 | Dell Precision 5550 P91F SK Hynix PC601A NVMe 1TB | Média Toshiba XG6 KXG60ZNV1T02 | |
|---|---|---|---|---|---|
| CrystalDiskMark 5.2 / 6 | -13% | 7% | -9% | -3% | |
| Write 4K (MB/s) | 133.1 | 156 17% | 195.9 47% | 122.6 -8% | 136.3 ? 2% |
| Read 4K (MB/s) | 51.6 | 45.73 -11% | 74.9 45% | 42.4 -18% | 50.7 ? -2% |
| Write Seq (MB/s) | 1986 | 1158 -42% | 1194 -40% | 2167 9% | 1869 ? -6% |
| Read Seq (MB/s) | 2208 | 1132 -49% | 2309 5% | 1747 -21% | 1984 ? -10% |
| Write 4K Q32T1 (MB/s) | 462.3 | 369.2 -20% | 507 10% | 388.8 -16% | 435 ? -6% |
| Read 4K Q32T1 (MB/s) | 400.2 | 573 43% | 624 56% | 367.3 -8% | 439 ? 10% |
| Write Seq Q32T1 (MB/s) | 3074 | 1969 -36% | 1206 -61% | 2629 -14% | 3019 ? -2% |
| Read Seq Q32T1 (MB/s) | 3268 | 3138 -4% | 3091 -5% | 3460 6% | 3016 ? -8% |

Continuous load read: DiskSpd Read Loop, Queue Depth 8
| 3DMark 11 Performance | 4495 pontos | |
| 3DMark Cloud Gate Standard Score | 14333 pontos | |
| 3DMark Fire Strike Score | 2957 pontos | |
| 3DMark Time Spy Score | 1121 pontos | |
Ajuda | ||
| baixo | média | alto | ultra | 4K | |
|---|---|---|---|---|---|
| The Witcher 3 (2015) | 57 | 32.6 | 19.1 | 10.8 | |
| Dota 2 Reborn (2015) | 141 | 120 | 67 | 60.4 | 21.8 |
| X-Plane 11.11 (2018) | 71.1 | 53.2 | 48 | 21.3 | |
| Shadow of the Tomb Raider (2018) | 51.2 | 19.3 | |||
| Total War: Three Kingdoms (2019) | 71.2 | 20.9 | 12.2 |
Barulho
| Ocioso |
| 29.3 / 29.3 / 30 dB |
| Carga |
| 32.8 / 32.8 dB |
 | ||
30 dB silencioso 40 dB(A) audível 50 dB(A) ruidosamente alto |
||
min: | ||
(-) A temperatura máxima no lado superior é 51.5 °C / 125 F, em comparação com a média de 38.2 °C / 101 F , variando de 22.2 a 69.8 °C para a classe Workstation.
(-) A parte inferior aquece até um máximo de 60.3 °C / 141 F, em comparação com a média de 41.1 °C / 106 F
(+) Em uso inativo, a temperatura média para o lado superior é 25.9 °C / 79 F, em comparação com a média do dispositivo de 32 °C / ### class_avg_f### F.
(+) Os apoios para as mãos e o touchpad estão atingindo a temperatura máxima da pele (35 °C / 95 F) e, portanto, não estão quentes.
(-) A temperatura média da área do apoio para as mãos de dispositivos semelhantes foi 27.8 °C / 82 F (-7.2 °C / -13 F).
HP ZBook Firefly 15 G7 análise de áudio
(-) | alto-falantes não muito altos (###valor### dB)
Graves 100 - 315Hz
(±) | graves reduzidos - em média 14.2% menor que a mediana
(±) | a linearidade dos graves é média (13.7% delta para a frequência anterior)
Médios 400 - 2.000 Hz
(+) | médios equilibrados - apenas 1.4% longe da mediana
(+) | médios são lineares (4.1% delta para frequência anterior)
Altos 2 - 16 kHz
(+) | agudos equilibrados - apenas 3.1% longe da mediana
(+) | os máximos são lineares (4.1% delta da frequência anterior)
Geral 100 - 16.000 Hz
(±) | a linearidade do som geral é média (18.3% diferença em relação à mediana)
Comparado com a mesma classe
» 60% de todos os dispositivos testados nesta classe foram melhores, 10% semelhantes, 30% piores
» O melhor teve um delta de 7%, a média foi 17%, o pior foi 35%
Comparado com todos os dispositivos testados
» 40% de todos os dispositivos testados foram melhores, 8% semelhantes, 52% piores
» O melhor teve um delta de 4%, a média foi 23%, o pior foi 134%
Dell Precision 5550 P91F análise de áudio
(+) | os alto-falantes podem tocar relativamente alto (###valor### dB)
Graves 100 - 315Hz
(±) | graves reduzidos - em média 5.7% menor que a mediana
(±) | a linearidade dos graves é média (7.7% delta para a frequência anterior)
Médios 400 - 2.000 Hz
(+) | médios equilibrados - apenas 2.9% longe da mediana
(+) | médios são lineares (4.2% delta para frequência anterior)
Altos 2 - 16 kHz
(+) | agudos equilibrados - apenas 2.3% longe da mediana
(+) | os máximos são lineares (2.6% delta da frequência anterior)
Geral 100 - 16.000 Hz
(+) | o som geral é linear (6.7% diferença em relação à mediana)
Comparado com a mesma classe
» 0% de todos os dispositivos testados nesta classe foram melhores, 1% semelhantes, 99% piores
» O melhor teve um delta de 7%, a média foi 17%, o pior foi 35%
Comparado com todos os dispositivos testados
» 1% de todos os dispositivos testados foram melhores, 0% semelhantes, 99% piores
» O melhor teve um delta de 4%, a média foi 23%, o pior foi 134%
| desligado | |
| Ocioso | |
| Carga |
|
Key:
min: | |
| HP ZBook Firefly 15 G7 i7-10610U, Quadro P520, Toshiba XG6 KXG60ZNV1T02, IPS LED, 3840x2160, 15.6" | HP ZBook 15u G6 6TP54EA i7-8565U, Radeon Pro WX 3200, Samsung SSD PM981 MZVLB512HAJQ, IPS, 3840x2160, 15.6" | Lenovo ThinkPad P53s-20N6001NGE i7-8565U, Quadro P520, Intel SSD 760p SSDPEKKW256G8, IPS, 1920x1080, 15.6" | Dell Precision 5550 P91F i7-10875H, Quadro T2000 Max-Q, SK Hynix PC601A NVMe 1TB, IPS, 3840x2400, 15.6" | Lenovo ThinkPad T15 Gen1-20S7S02U00 i7-10510U, GeForce MX330, Toshiba XG6 KXG6AZNV1T02, IPS LED, 3840x2160, 15.6" | Média NVIDIA Quadro P520 | Média da turma Workstation | |
|---|---|---|---|---|---|---|---|
| Power Consumption | -22% | 6% | -77% | -36% | -2% | -115% | |
| Idle Minimum * (Watt) | 3.5 | 5.5 -57% | 2.74 22% | 5.6 -60% | 4.3 -23% | 3.14 ? 10% | 9.11 ? -160% |
| Idle Average * (Watt) | 6.7 | 9.8 -46% | 6.4 4% | 11.2 -67% | 13.8 -106% | 7.3 ? -9% | 13.8 ? -106% |
| Idle Maximum * (Watt) | 9.6 | 12 -25% | 9.7 -1% | 18.4 -92% | 16.2 -69% | 10.4 ? -8% | 17.9 ? -86% |
| Load Average * (Watt) | 60 | 59 2% | 55.2 8% | 114 -90% | 66 -10% | 60.7 ? -1% | 96 ? -60% |
| Witcher 3 ultra * (Watt) | 49.3 | 51 -3% | 76.7 -56% | 53 -8% | |||
| Load Maximum * (Watt) | 68.6 | 70 -2% | 69.4 -1% | 134.2 -96% | 67.4 2% | 68.9 ? -0% | 180.3 ? -163% |
* ... menor é melhor
| HP ZBook Firefly 15 G7 i7-10610U, Quadro P520, 53 Wh | HP ZBook 15u G6 6TP54EA i7-8565U, Radeon Pro WX 3200, 56 Wh | Lenovo ThinkPad P53s-20N6001NGE i7-8565U, Quadro P520, 57 Wh | Dell Precision 5550 P91F i7-10875H, Quadro T2000 Max-Q, 86 Wh | Lenovo ThinkPad T15 Gen1-20S7S02U00 i7-10510U, GeForce MX330, 57 Wh | Média da turma Workstation | |
|---|---|---|---|---|---|---|
| Duração da bateria | -5% | 6% | -16% | -32% | -17% | |
| H.264 (h) | 12.2 | 11.8 -3% | 8.1 -34% | 10.1 ? -17% | ||
| WiFi v1.3 (h) | 9.1 | 6.9 -24% | 8.6 -5% | 9 -1% | 7.1 -22% | 8.55 ? -6% |
| Load (h) | 2 | 2.3 15% | 2.5 25% | 1.4 -30% | 1.2 -40% | 1.441 ? -28% |
| Reader / Idle (h) | 12.4 | 25.2 | 22.6 | 26.1 ? |
Pro
Contra
Veredicto: O HP ZBook Firefly é bom, mas não o suficiente
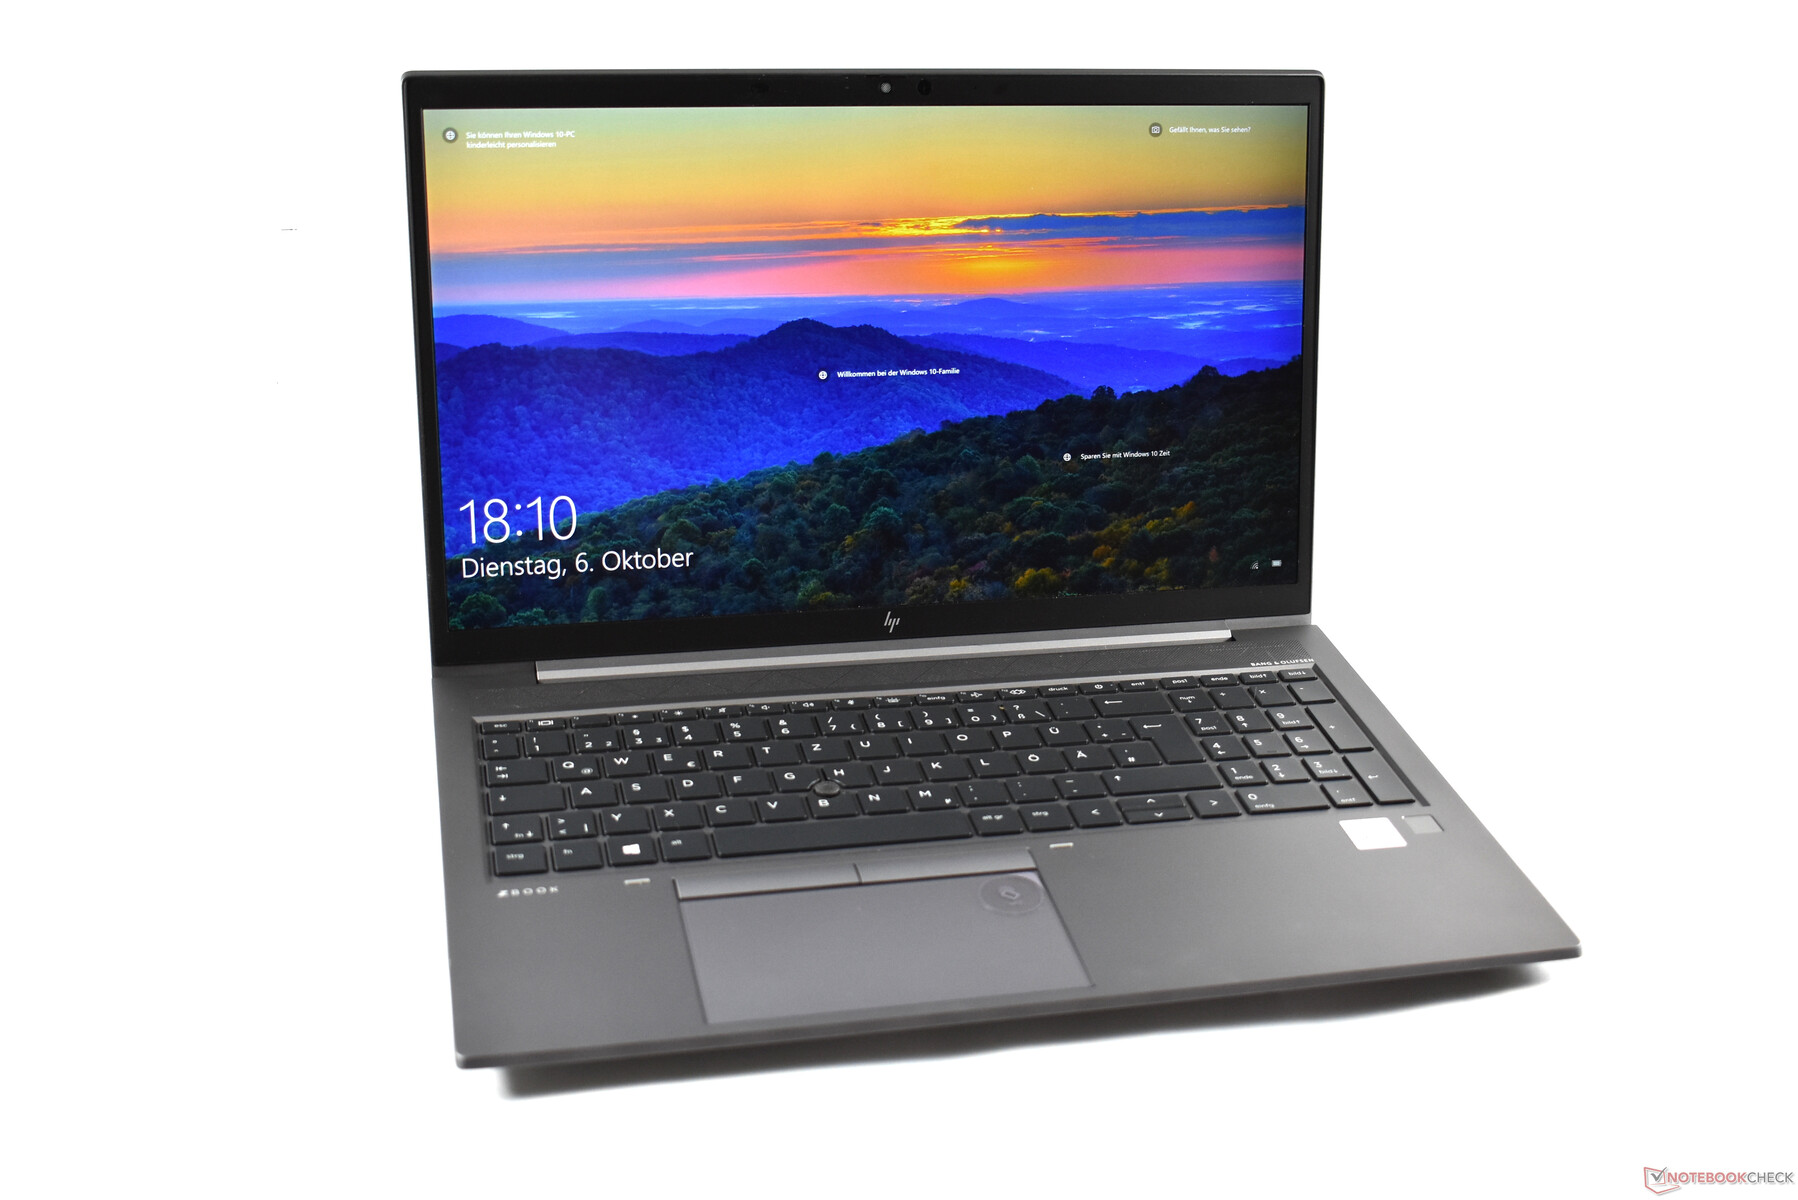
Um novo nome por si só não traz uma revolução - é por isso que a HP também deu ao seu workstation ultrabook ZBook Firefly 15 G7 um novo design, que tem pontos fortes e fracos.
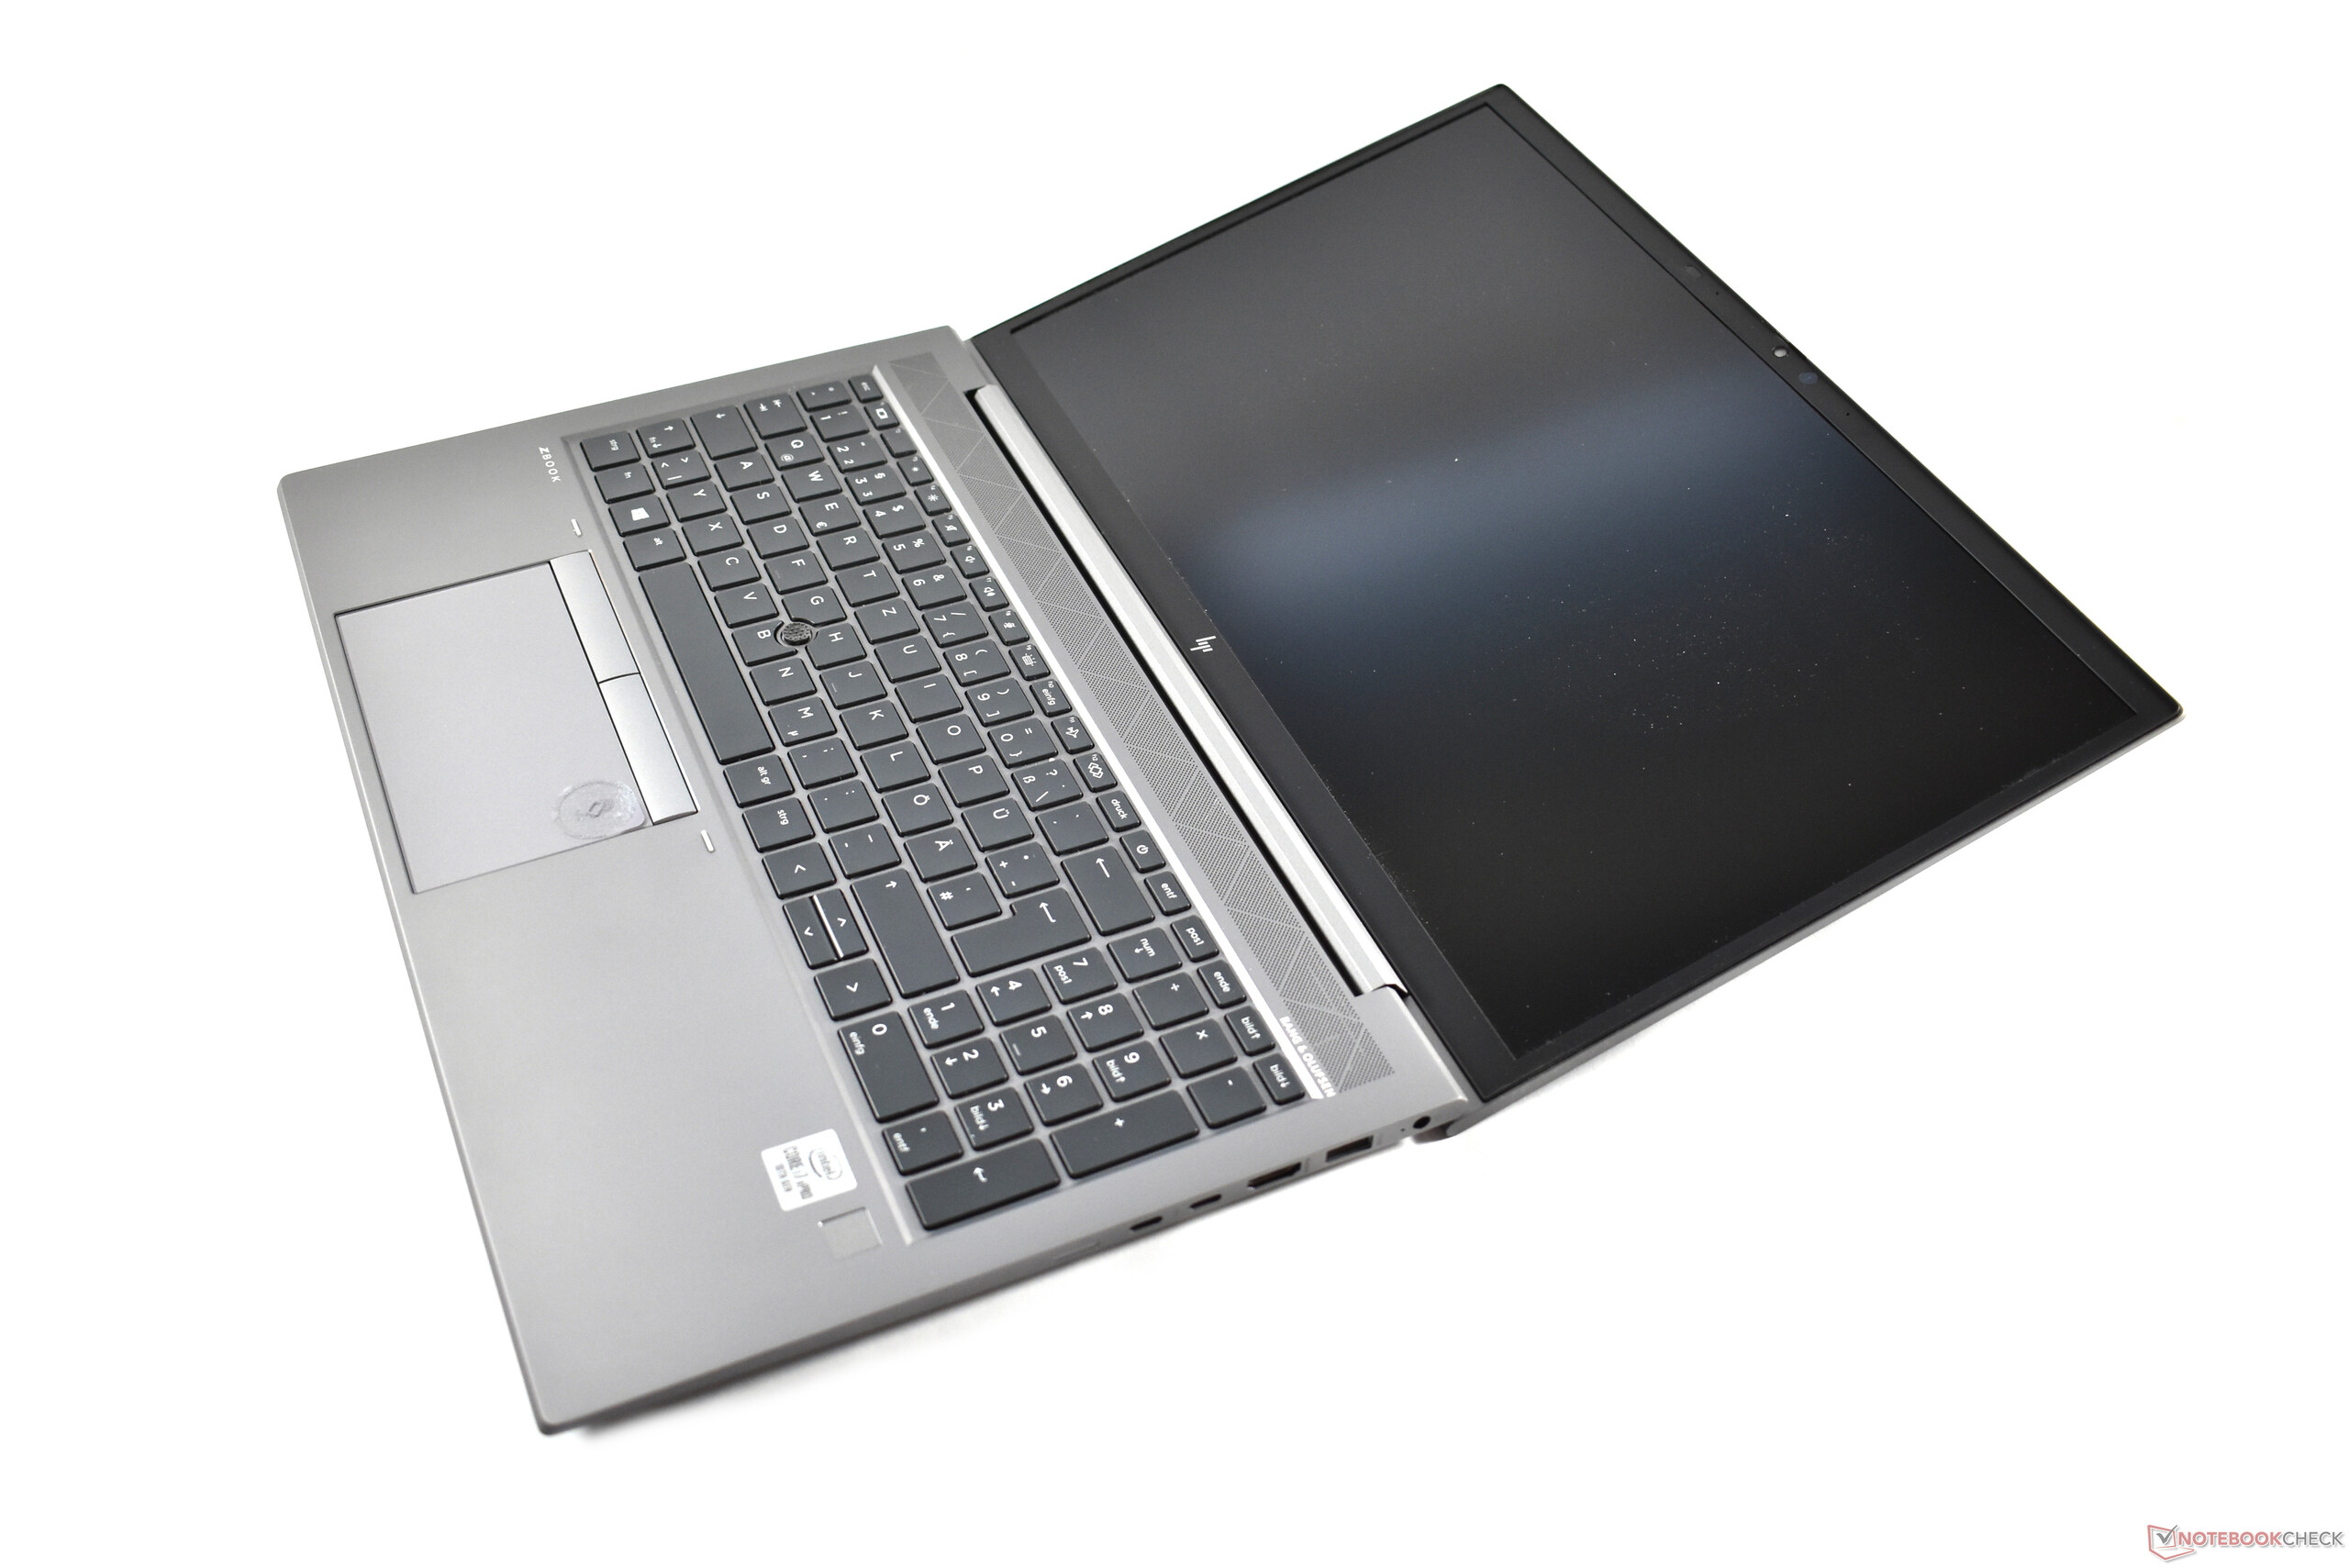
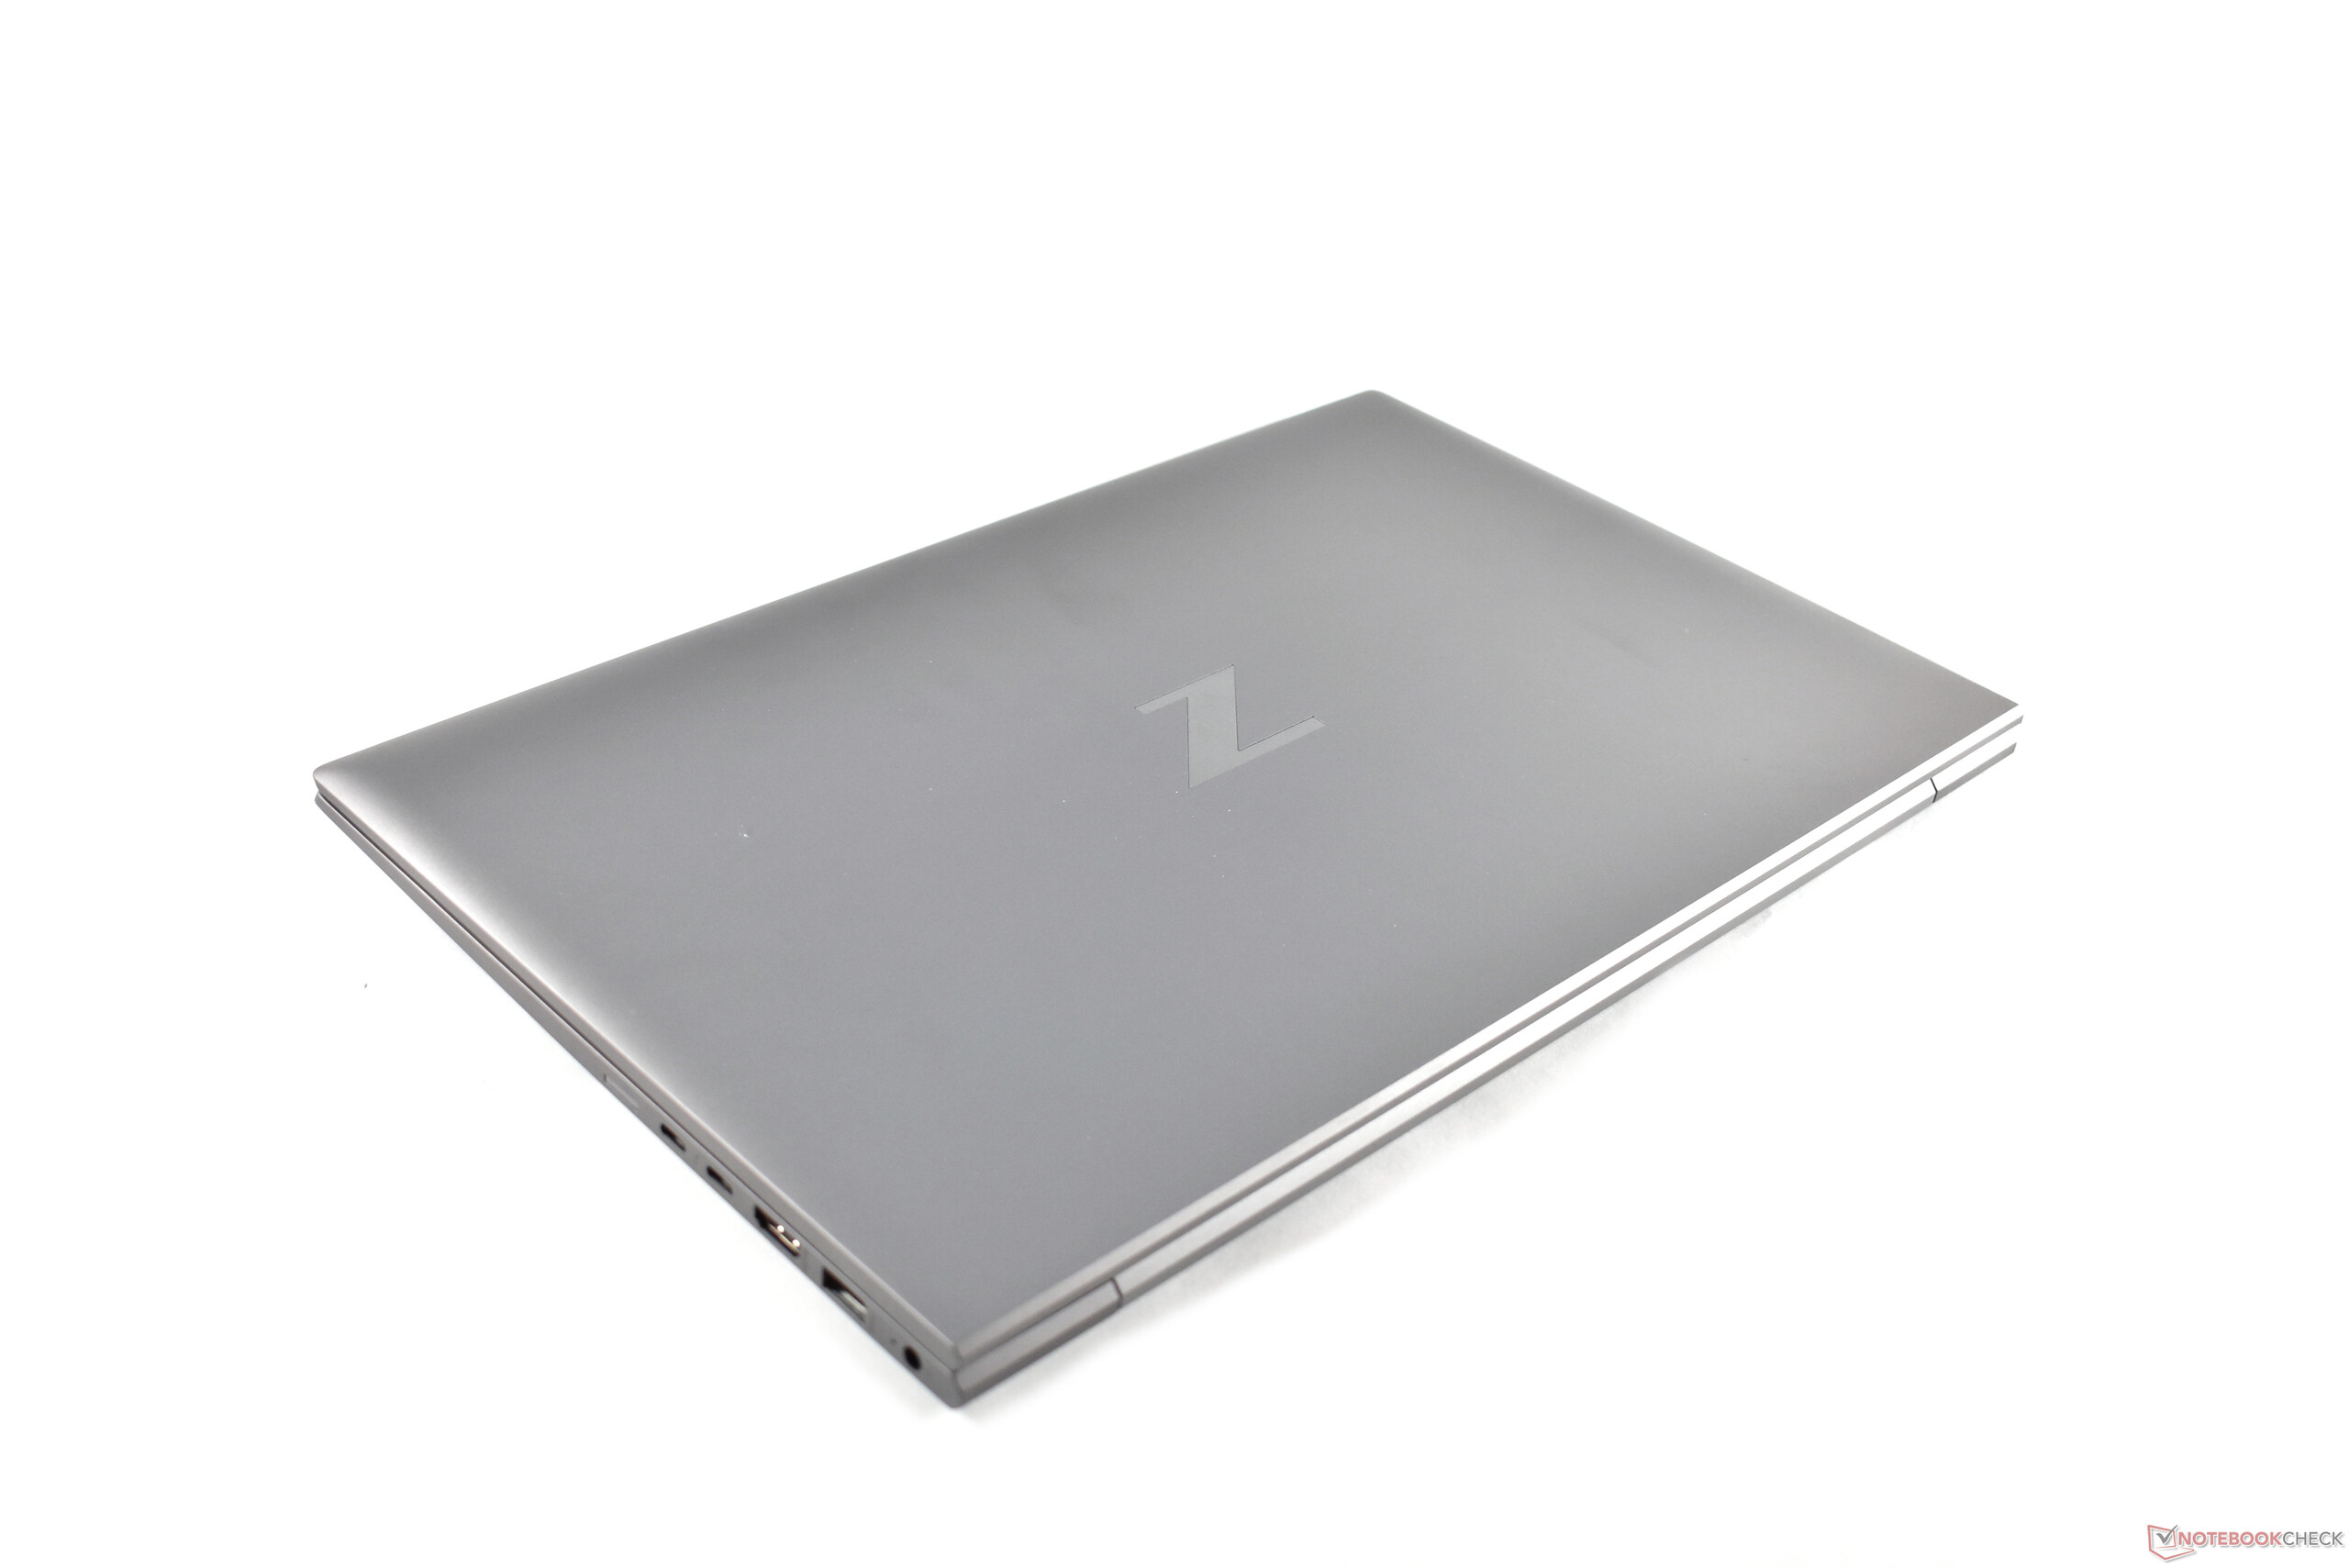
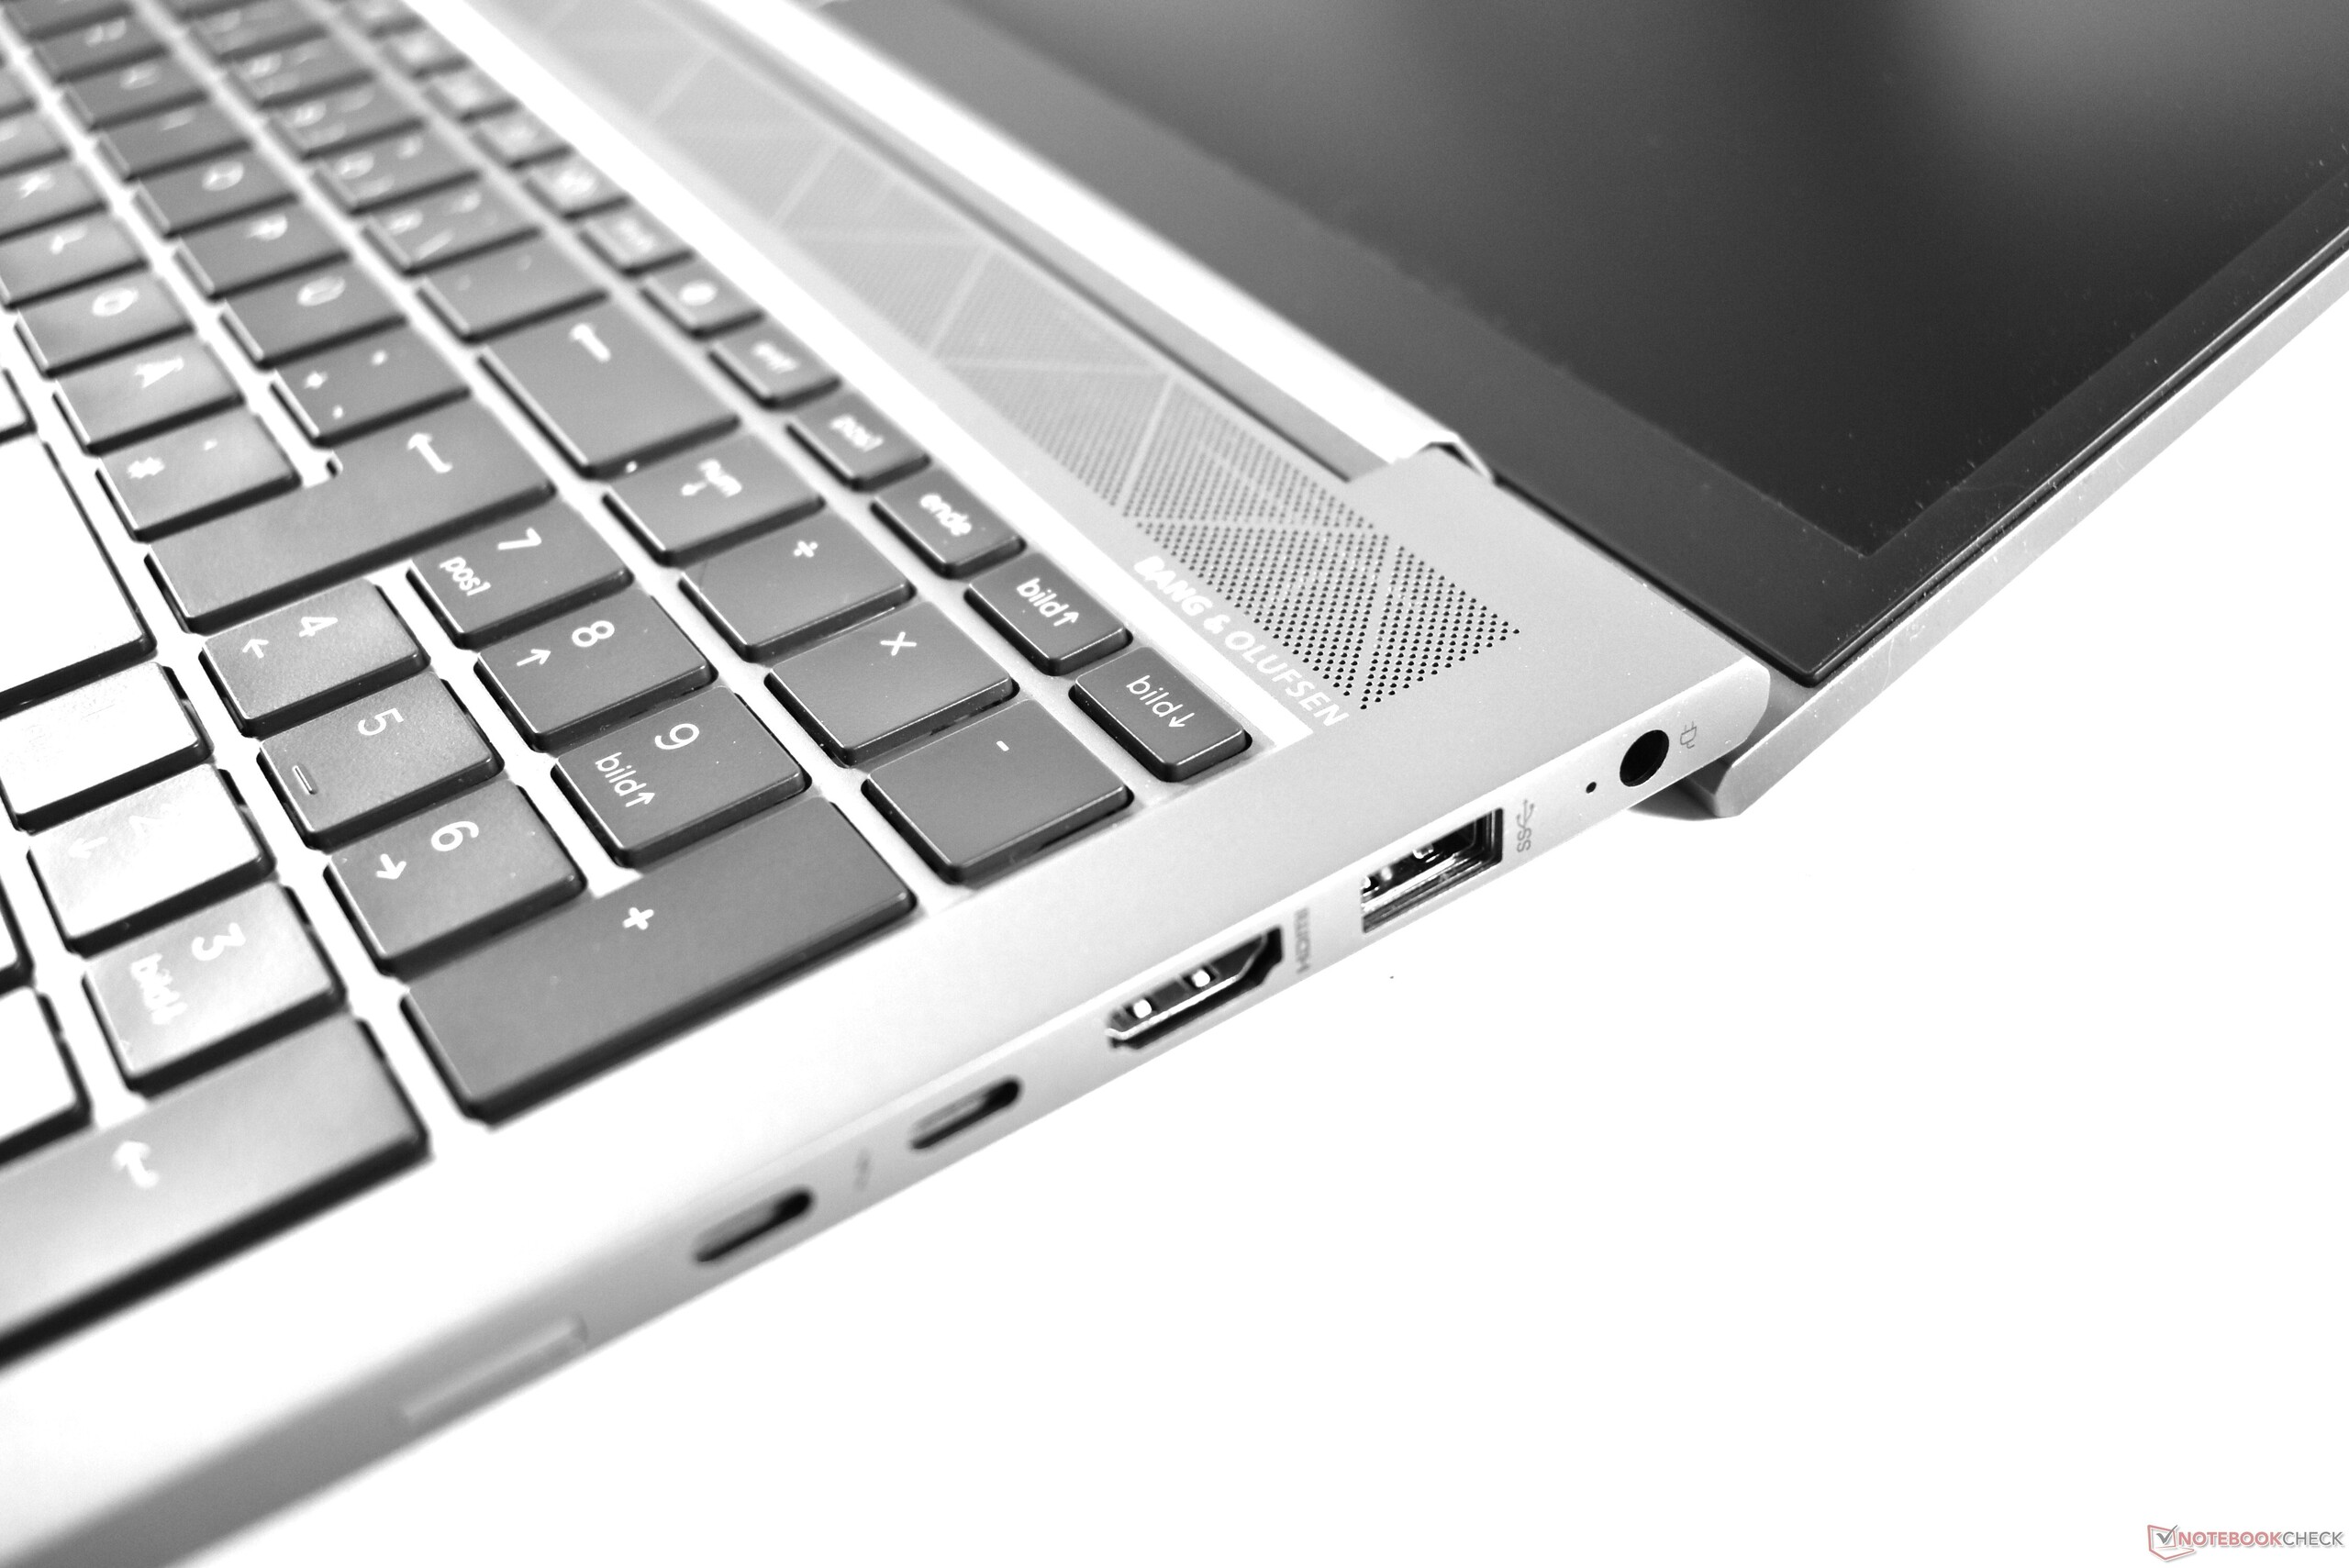
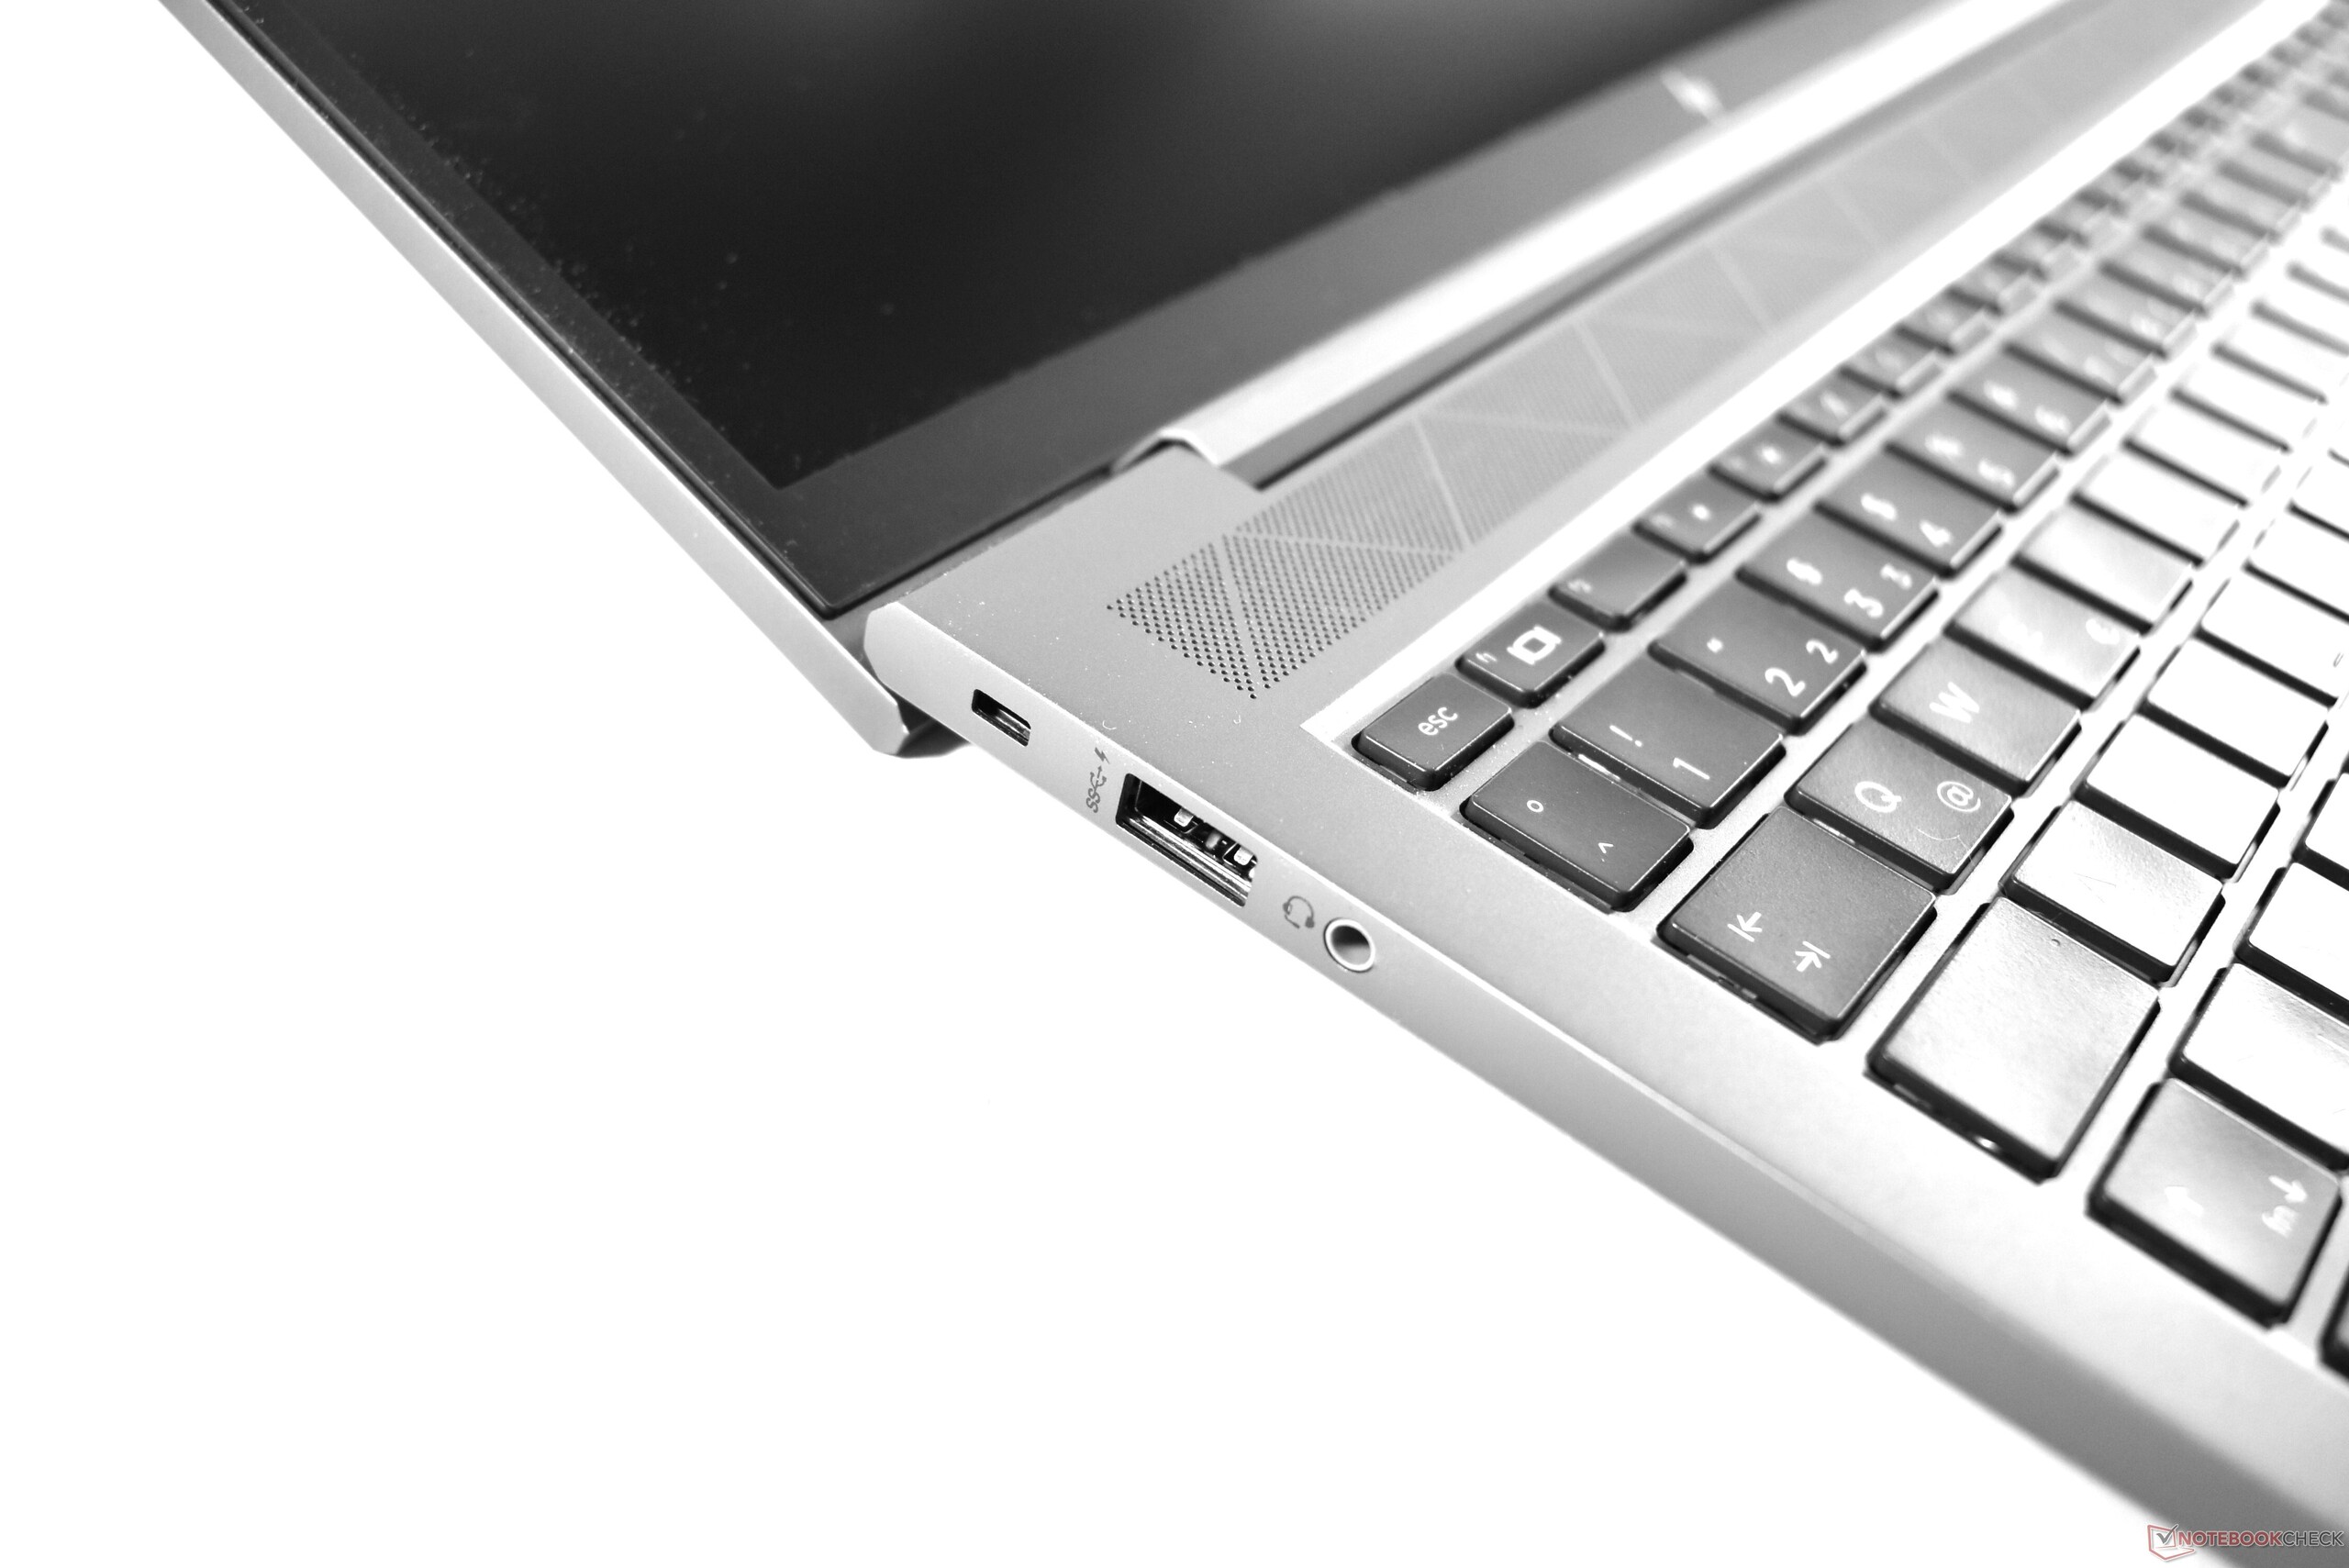
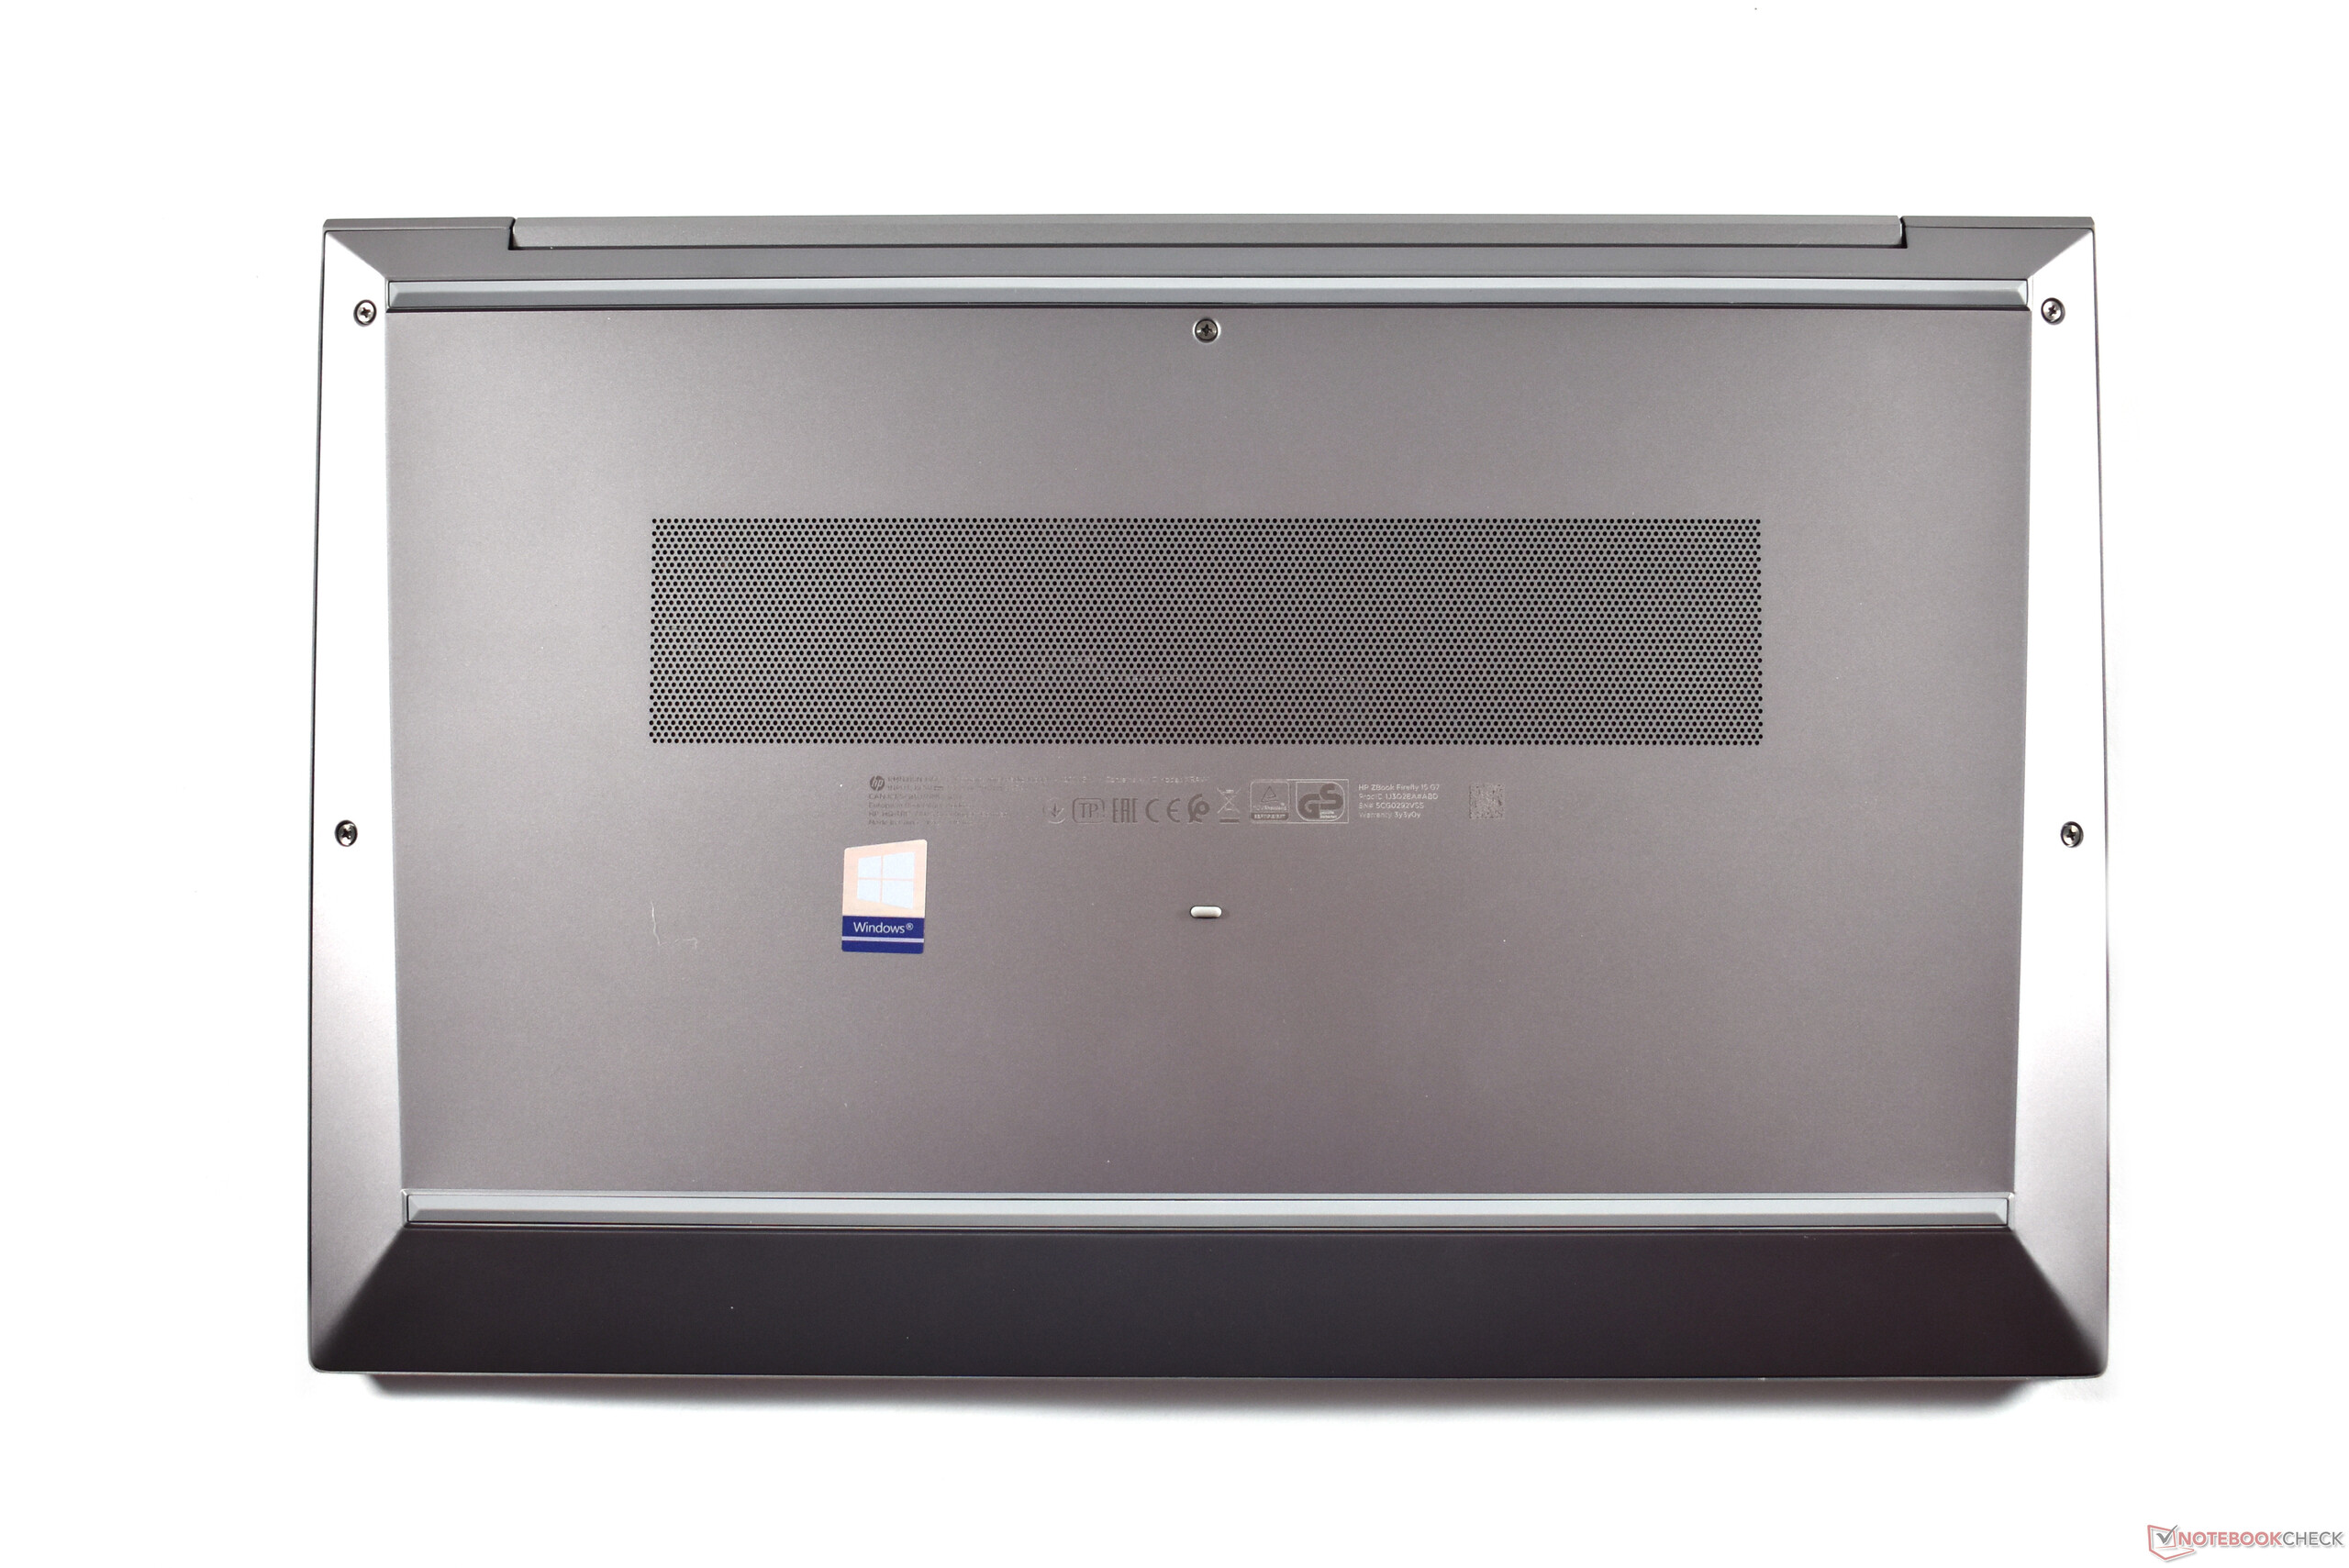
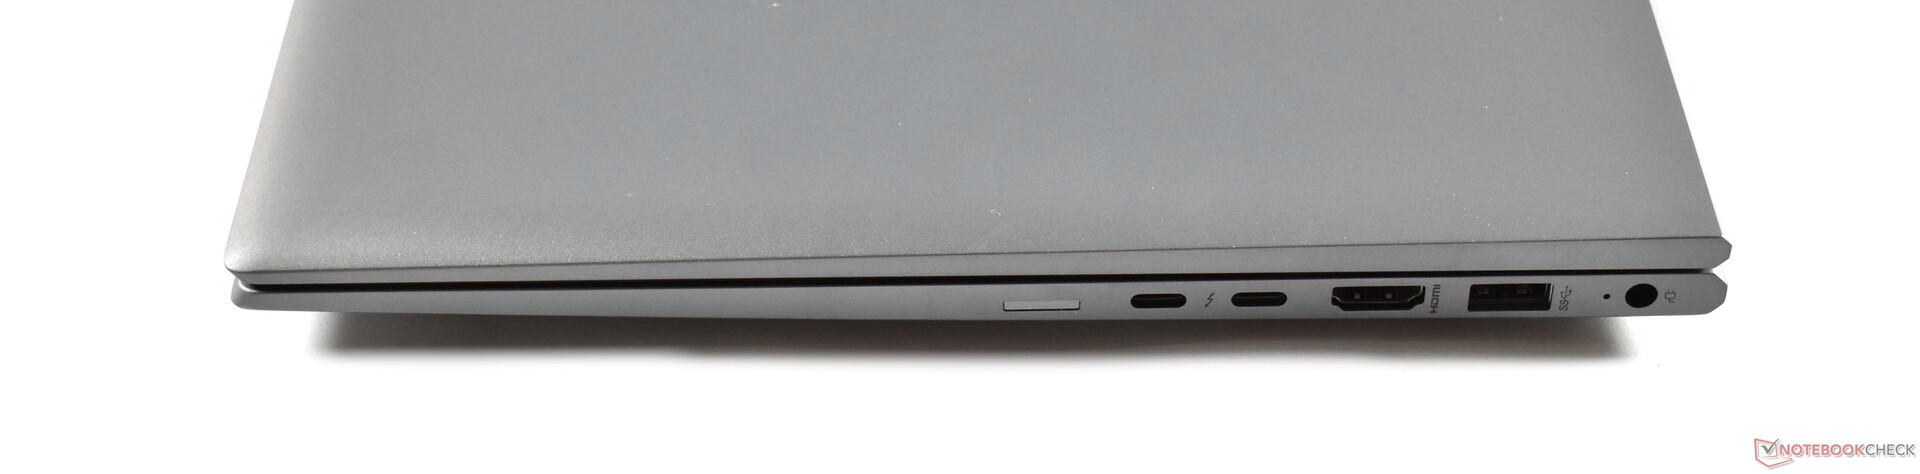
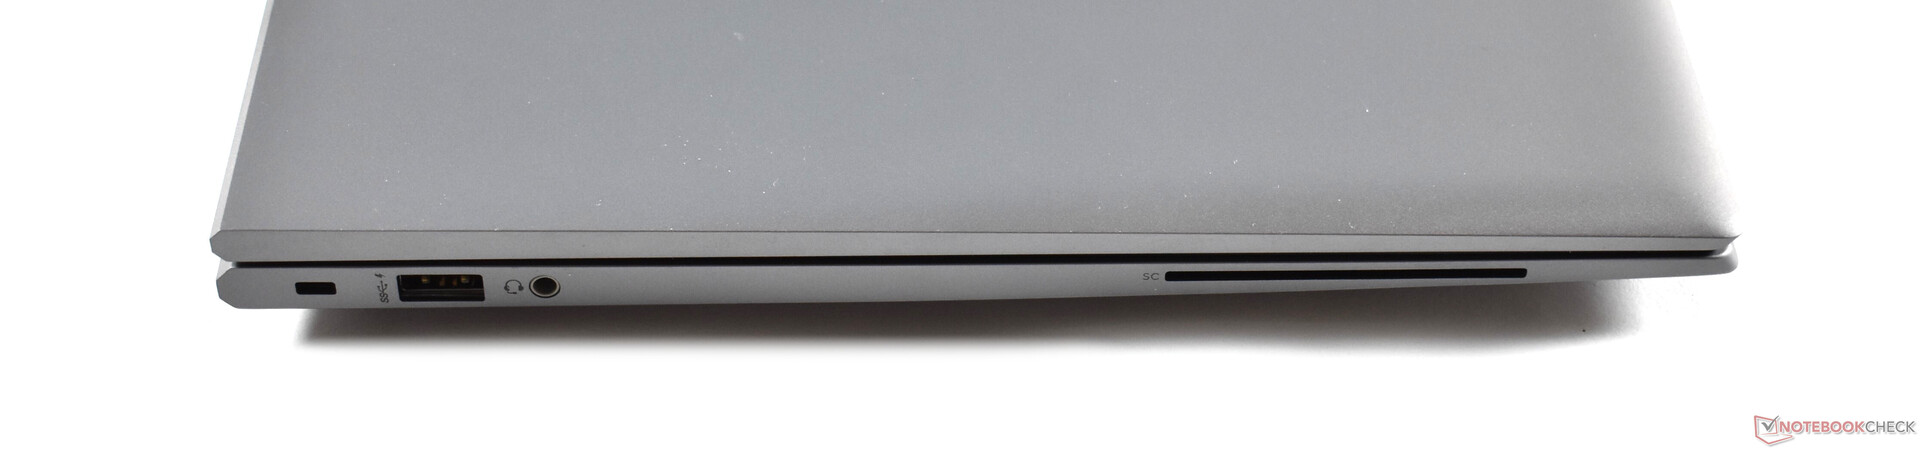
A maior melhoria: A nova carcaça é muito mais compacta. Por outro lado, você perde a porta docking dedicada e a Ethernet RJ45. Para compensar, há mais uma porta Thunderbolt 3, mas ainda falta um leitor de cartão (micro) SD. Não há mudança qualitativa no que diz respeito aos dispositivos de entrada, a carcaça de metal e a tela 4K - o ZBook Firefly está em um nível de alta qualidade em todas as três áreas, inclusive quando a LCD 4K infelizmente não é um painel de gama ampla.
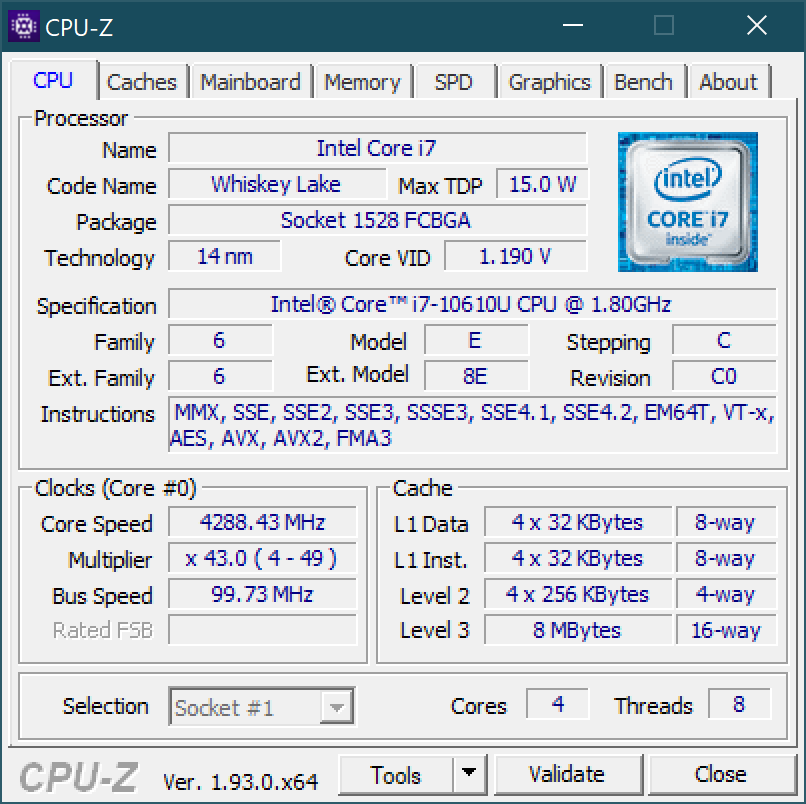
Em termos de componentes, os dois slots de RAM devem ser elogiados, pois permitem até 64 GB. A CPU e GPU causam menos entusiasmo: Nenhum dos componentes está abaixo da concorrência direta quando se trata de desempenho, mas eles estão simplesmente muito desatualizados agora. Quanto às CPUs, gostaríamos de ver a série Ryzen 4000 da AMD sendo usada, enquanto a Quadro P520 precisaria urgentemente ser substituída por uma nova versão baseada na GeForce MX450. Podemos, pelo menos, elogiar o baixo nível de ruído, bem como a boa duração da bateria, enquanto o desenvolvimento da temperatura na carcaça é um pouco alto para o nosso gosto.
Bom, mas caro e internamente um tanto desatualizado sem uma opção AMD: O HP ZBook Firefly 15 G7
Em suma, a HP ZBook Firefly 15 G7 é um bom workstation para tarefas CAD leves. Se você, como cliente corporativo, tem um contrato com a HP e precisa de portáteis para essa área de trabalho, comprar o portátil HP não será um erro. Mas todos os outros clientes deveriam procurar portáteis com CPUs AMD Ryzen 4000 - ou esperar por uma versão com Intel Tiger Lake e uma GPU Quadro mais recente.
HP ZBook Firefly 15 G7
- 10/14/2020 v7 (old)
Benjamin Herzig
Price comparison
