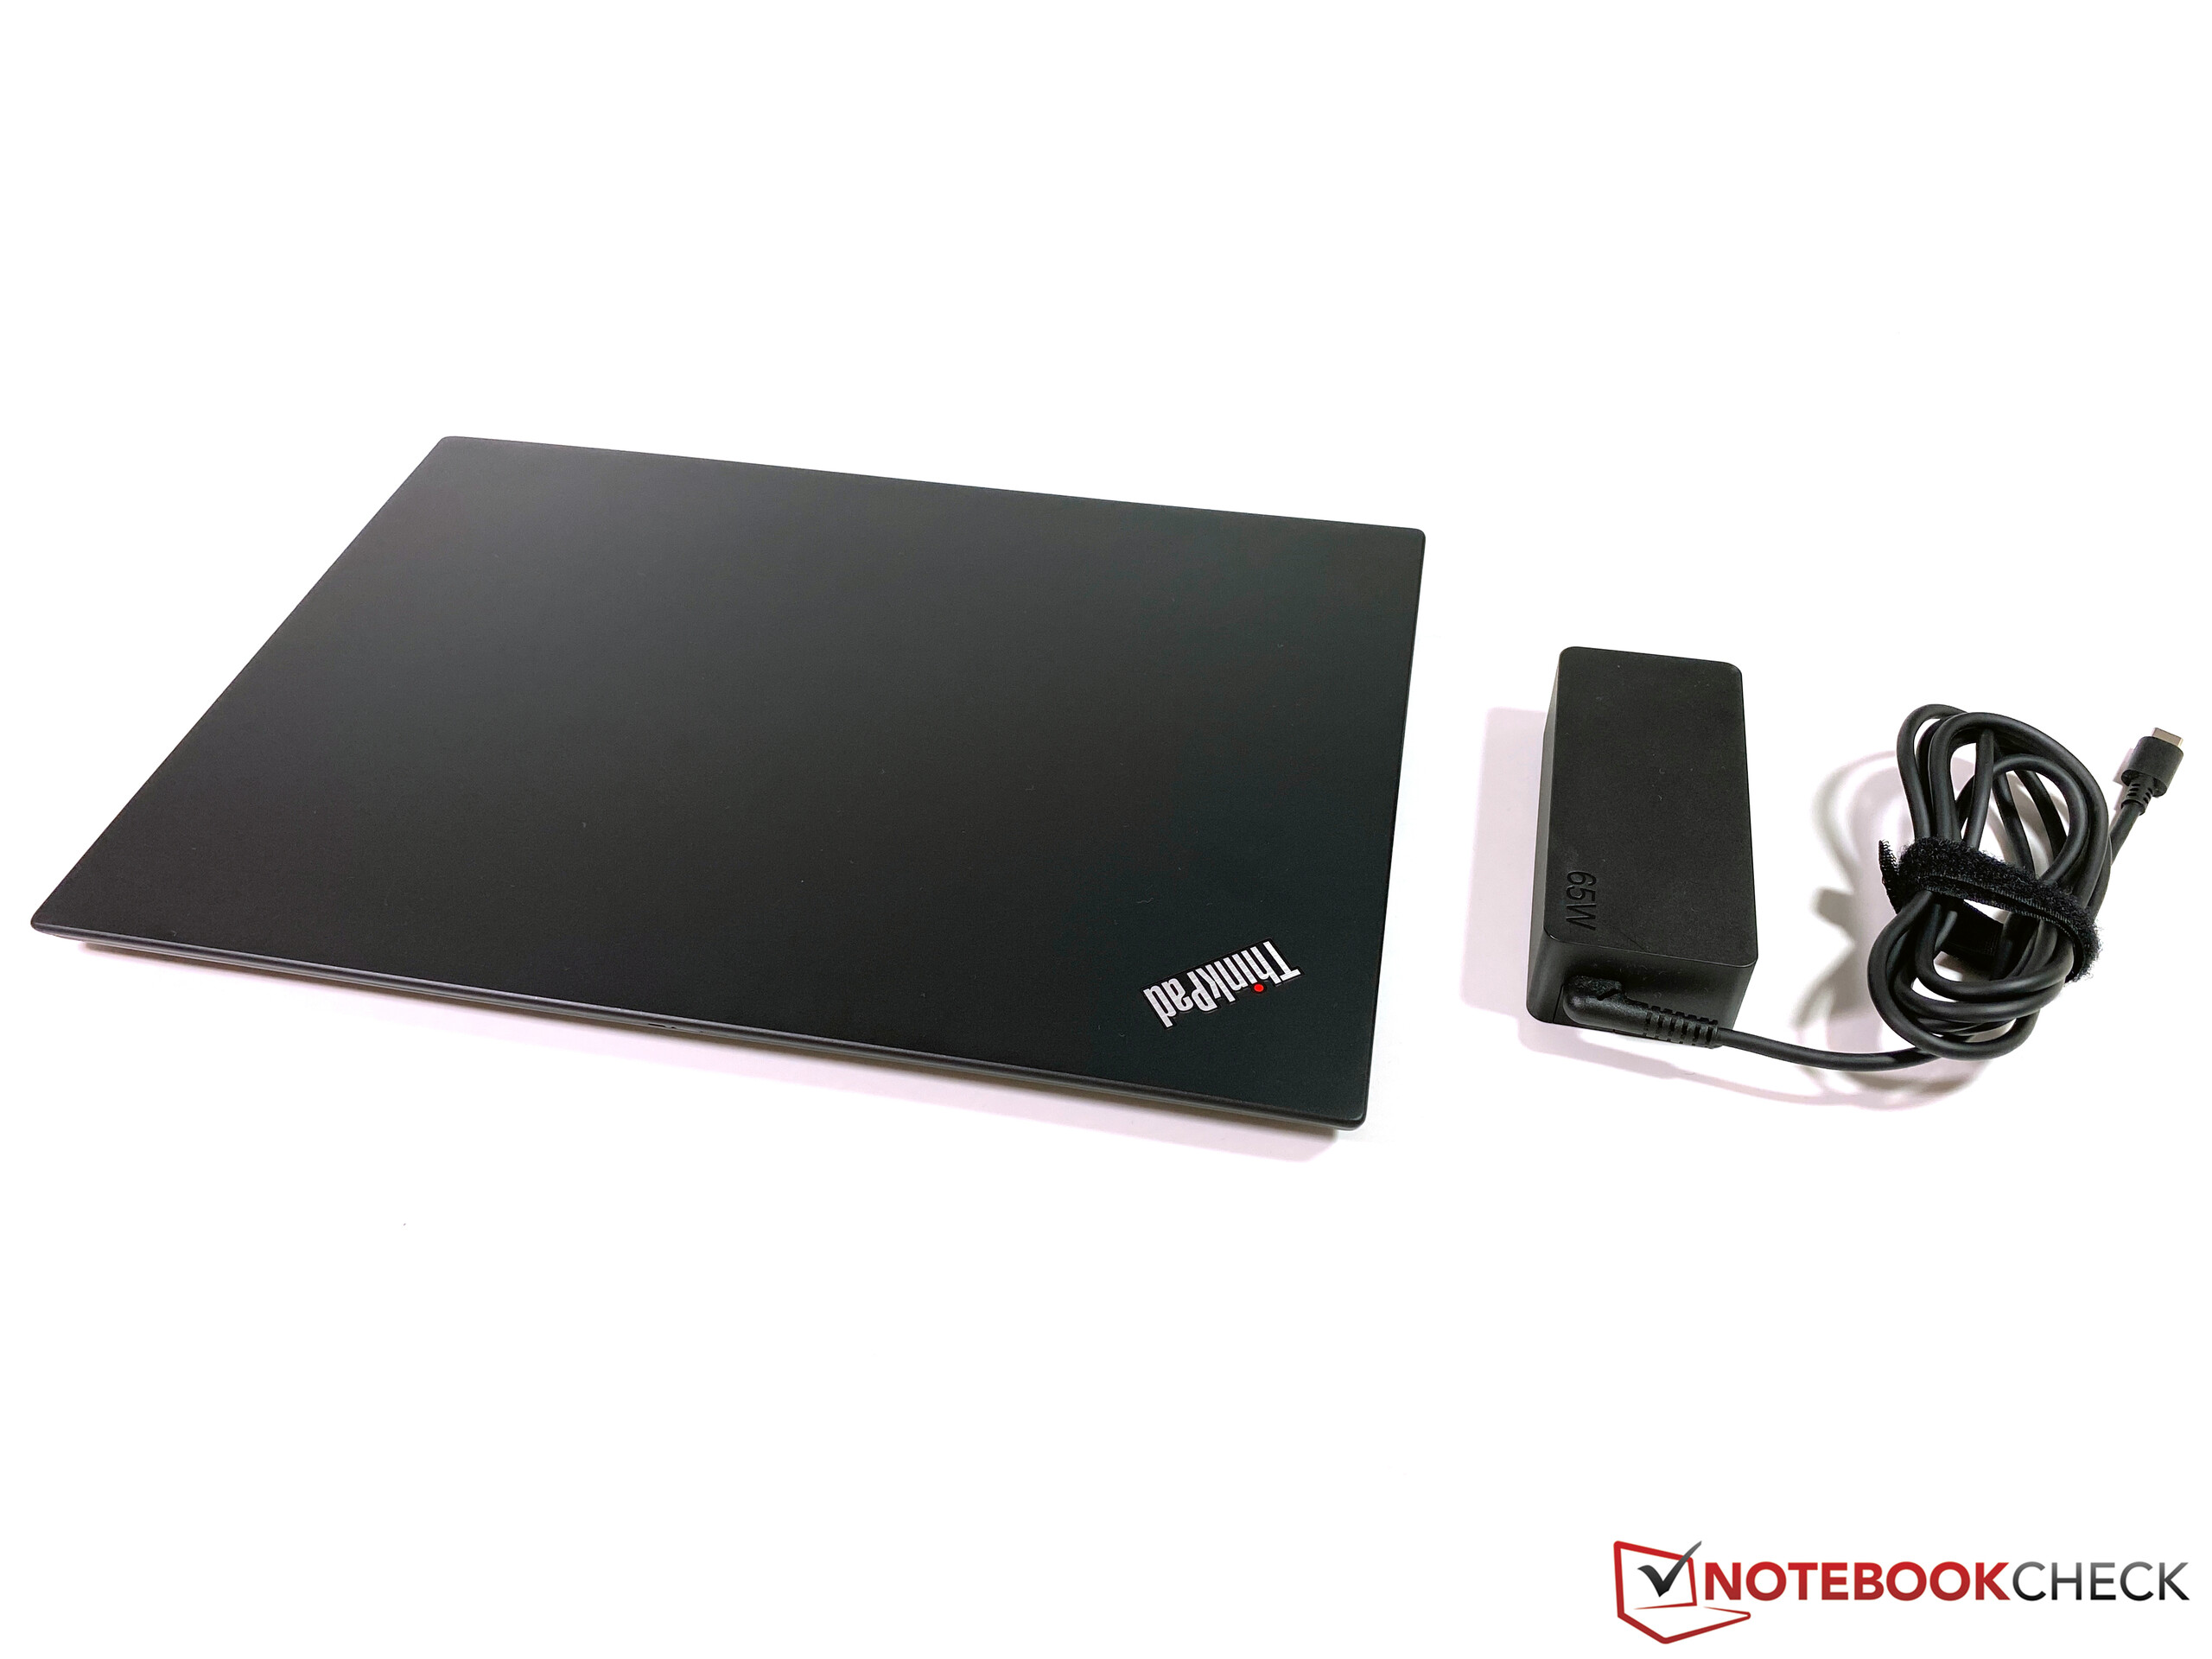
Breve Análise do Lenovo ThinkPad T14s: Portátil empresarial é melhor com AMD
Avaliação | Data | Modelo | Peso | Altura | Size | Resolução | Preço |
|---|---|---|---|---|---|---|---|
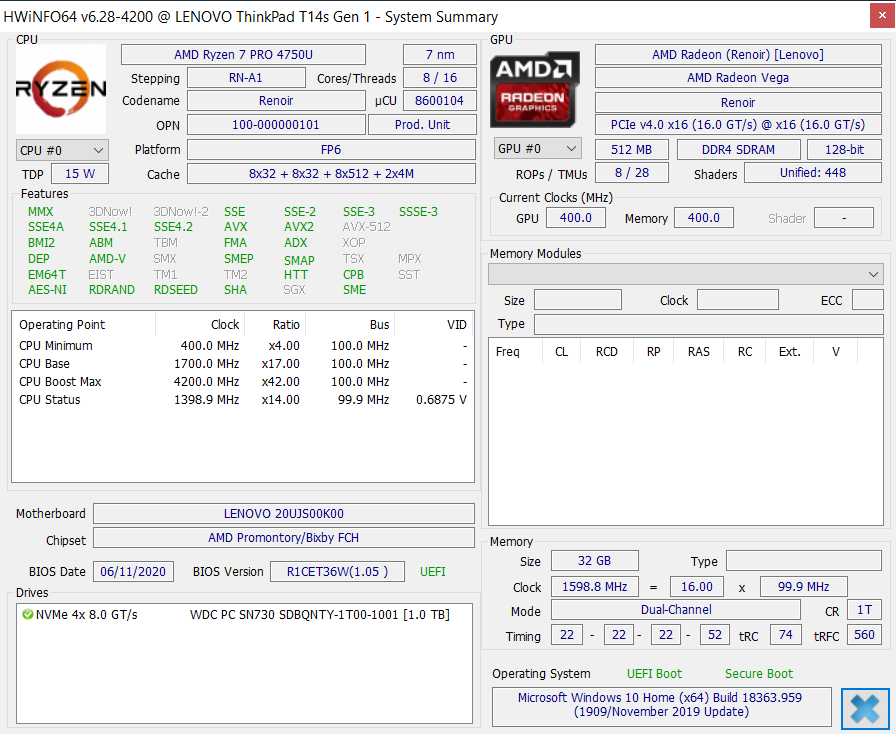
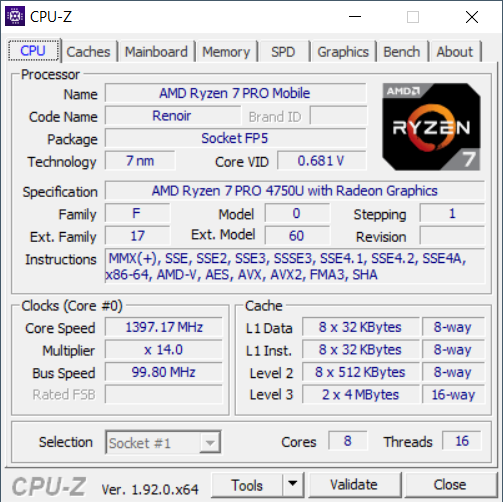
| 90.5 % v7 (old) | 08/2020 | Lenovo ThinkPad T14s-20UJS00K00 R7 PRO 4750U, Vega 7 | 1.3 kg | 16.1 mm | 14.00" | 1920x1080 | |
| 88.8 % v7 (old) | 08/2020 | Lenovo ThinkPad T14s-20T00044GE i5-10210U, UHD Graphics 620 | 1.3 kg | 16.1 mm | 14.00" | 1920x1080 | |
| 88.4 % v7 (old) | 09/2019 | Lenovo ThinkPad T495s-20QKS01E00 R7 PRO 3700U, Vega 10 | 1.3 kg | 16.1 mm | 14.00" | 1920x1080 | |
| 88.9 % v7 (old) | 07/2020 | Dell Latitude 7410 i7-10610U, UHD Graphics 620 | 1.4 kg | 19.3 mm | 14.00" | 3840x2160 | |
| 90.2 % v7 (old) | 07/2020 | Lenovo ThinkPad X1 Carbon 2020-20UAS04T00 i7-10510U, UHD Graphics 620 | 1.1 kg | 14.9 mm | 14.00" | 1920x1080 |


| SD Card Reader | |
| average JPG Copy Test (av. of 3 runs) | |
| Dell Latitude 7410 (Toshiba Exceria Pro M501 64 GB UHS-II) | |
| Lenovo ThinkPad T495s-20QKS01E00 (Toshiba Exceria Pro M501 64 GB UHS-II) | |
| Lenovo ThinkPad T14s-20UJS00K00 (Toshiba Exceria Pro M501 64 GB UHS-II) | |
| Média da turma Office (19.8 - 198.5, n=22, últimos 2 anos) | |
| Lenovo ThinkPad T14s-20T00044GE (Toshiba Exceria Pro M501 64 GB UHS-II) | |
| maximum AS SSD Seq Read Test (1GB) | |
| Dell Latitude 7410 (Toshiba Exceria Pro M501 64 GB UHS-II) | |
| Lenovo ThinkPad T495s-20QKS01E00 (Toshiba Exceria Pro M501 64 GB UHS-II) | |
| Lenovo ThinkPad T14s-20UJS00K00 (Toshiba Exceria Pro M501 64 GB UHS-II) | |
| Média da turma Office (27.4 - 249, n=21, últimos 2 anos) | |
| Lenovo ThinkPad T14s-20T00044GE (Toshiba Exceria Pro M501 64 GB UHS-II) | |


| |||||||||||||||||||||||||
iluminação: 88 %
iluminação com acumulador: 403 cd/m²
Contraste: 1188:1 (Preto: 0.34 cd/m²)
ΔE ColorChecker Calman: 1.4 | ∀{0.5-29.43 Ø4.72}
calibrated: 0.8
ΔE Greyscale Calman: 1.6 | ∀{0.09-98 Ø4.97}
97.9% sRGB (Argyll 1.6.3 3D)
63% AdobeRGB 1998 (Argyll 1.6.3 3D)
69% AdobeRGB 1998 (Argyll 3D)
97.9% sRGB (Argyll 3D)
66.8% Display P3 (Argyll 3D)
Gamma: 2.13
CCT: 6480 K
| Lenovo ThinkPad T14s-20UJS00K00 N140HCG-GQ2, IPS , 1920x1080, 14" | Lenovo ThinkPad T14s-20T00044GE B140HAN05.7, LTPS AHVA-IPS LED, 1920x1080, 14" | Lenovo ThinkPad T495s-20QKS01E00 B140HAN05.7, IPS, 1920x1080, 14" | Dell Latitude 7410 AU Optronics B140ZAN, IPS, 3840x2160, 14" | Lenovo ThinkPad X1 Carbon 2020-20UAS04T00 BOE NE140FHM-N61, IPS, 1920x1080, 14" | |
|---|---|---|---|---|---|
| Display | -1% | -1% | 4% | -2% | |
| Display P3 Coverage (%) | 66.8 | 66.6 0% | 67 0% | 71.8 7% | 68.9 3% |
| sRGB Coverage (%) | 97.9 | 96.8 -1% | 96.8 -1% | 99.3 1% | 91.6 -6% |
| AdobeRGB 1998 Coverage (%) | 69 | 67.6 -2% | 68.3 -1% | 72.4 5% | 67.1 -3% |
| Response Times | -90% | -118% | -34% | -100% | |
| Response Time Grey 50% / Grey 80% * (ms) | 32.4 ? | 63.2 ? -95% | 60.8 ? -88% | 39.2 ? -21% | 64.8 ? -100% |
| Response Time Black / White * (ms) | 15.2 ? | 28 ? -84% | 37.6 ? -147% | 22.4 ? -47% | 30.4 ? -100% |
| PWM Frequency (Hz) | 26040 ? | 2404 ? | |||
| Screen | -21% | -38% | -68% | -77% | |
| Brightness middle (cd/m²) | 404 | 404 0% | 380 -6% | 388.6 -4% | 422 4% |
| Brightness (cd/m²) | 371 | 397 7% | 381 3% | 365 -2% | 395 6% |
| Brightness Distribution (%) | 88 | 92 5% | 87 -1% | 82 -7% | 90 2% |
| Black Level * (cd/m²) | 0.34 | 0.21 38% | 0.22 35% | 0.35 -3% | 0.27 21% |
| Contrast (:1) | 1188 | 1924 62% | 1727 45% | 1110 -7% | 1563 32% |
| Colorchecker dE 2000 * | 1.4 | 3.1 -121% | 4 -186% | 4.04 -189% | 4.7 -236% |
| Colorchecker dE 2000 max. * | 3.2 | 4.7 -47% | 5.7 -78% | 9.2 -187% | 10 -213% |
| Colorchecker dE 2000 calibrated * | 0.8 | 1.3 -63% | 1.2 -50% | 1.25 -56% | 2 -150% |
| Greyscale dE 2000 * | 1.6 | 3.4 -113% | 4.4 -175% | 6.4 -300% | 6.4 -300% |
| Gamma | 2.13 103% | 2.38 92% | 2.54 87% | 2.3 96% | 2.12 104% |
| CCT | 6480 100% | 7070 92% | 6963 93% | 6957 93% | 7106 91% |
| Color Space (Percent of AdobeRGB 1998) (%) | 63 | 61.8 -2% | 62.2 -1% | 66.4 5% | 59.5 -6% |
| Color Space (Percent of sRGB) (%) | 97.9 | 96.6 -1% | 96.6 -1% | 99.4 2% | 91.5 -7% |
| Média Total (Programa/Configurações) | -37% /
-26% | -52% /
-41% | -33% /
-50% | -60% /
-66% |
* ... menor é melhor
Exibir tempos de resposta
| ↔ Tempo de resposta preto para branco | ||
|---|---|---|
| 15.2 ms ... ascensão ↗ e queda ↘ combinadas | ↗ 6.8 ms ascensão | 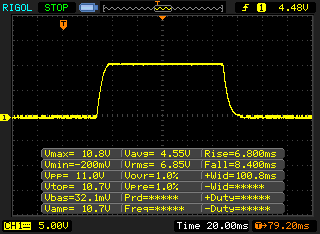 |
| ↘ 8.4 ms queda | ||
| A tela mostra boas taxas de resposta em nossos testes, mas pode ser muito lenta para jogadores competitivos. Em comparação, todos os dispositivos testados variam de 0.1 (mínimo) a 240 (máximo) ms. » 36 % de todos os dispositivos são melhores. Isso significa que o tempo de resposta medido é melhor que a média de todos os dispositivos testados (19.8 ms). | ||
| ↔ Tempo de resposta 50% cinza a 80% cinza | ||
| 32.4 ms ... ascensão ↗ e queda ↘ combinadas | ↗ 16.4 ms ascensão | 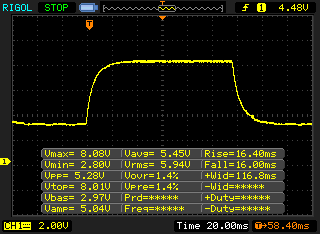 |
| ↘ 16 ms queda | ||
| A tela mostra taxas de resposta lentas em nossos testes e será insatisfatória para os jogadores. Em comparação, todos os dispositivos testados variam de 0.165 (mínimo) a 636 (máximo) ms. » 44 % de todos os dispositivos são melhores. Isso significa que o tempo de resposta medido é semelhante à média de todos os dispositivos testados (31 ms). | ||
Cintilação da tela / PWM (modulação por largura de pulso)
| Tela tremeluzindo/PWM detectado | 26040 Hz | ≤ 50 % configuração de brilho | 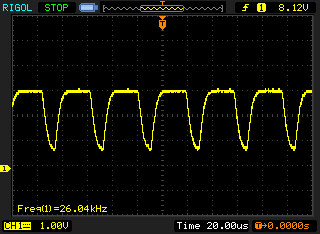 |
A luz de fundo da tela pisca em 26040 Hz (pior caso, por exemplo, utilizando PWM) Cintilação detectada em uma configuração de brilho de 50 % e abaixo. Não deve haver cintilação ou PWM acima desta configuração de brilho. A frequência de 26040 Hz é bastante alta, então a maioria dos usuários sensíveis ao PWM não deve notar nenhuma oscilação. [pwm_comparison] Em comparação: 52 % de todos os dispositivos testados não usam PWM para escurecer a tela. Se PWM foi detectado, uma média de 7778 (mínimo: 5 - máximo: 343500) Hz foi medida. | |||
Cinebench R15: CPU Single 64Bit | CPU Multi 64Bit
Blender: v2.79 BMW27 CPU
7-Zip 18.03: 7z b 4 -mmt1 | 7z b 4
Geekbench 5.5: Single-Core | Multi-Core
HWBOT x265 Benchmark v2.2: 4k Preset
LibreOffice : 20 Documents To PDF
R Benchmark 2.5: Overall mean
| Cinebench R20 / CPU (Single Core) | |
| Média da turma Office (345 - 816, n=73, últimos 2 anos) | |
| Média AMD Ryzen 7 PRO 4750U (461 - 479, n=5) | |
| Lenovo ThinkPad T14s-20UJS00K00 | |
| Lenovo ThinkPad X1 Carbon 2020-20UAS04T00 | |
| Lenovo ThinkPad T14s-20T00044GE | |
| Dell Latitude 7410 | |
| Cinebench R20 / CPU (Multi Core) | |
| Média da turma Office (648 - 8840, n=73, últimos 2 anos) | |
| Média AMD Ryzen 7 PRO 4750U (2935 - 3302, n=5) | |
| Lenovo ThinkPad T14s-20UJS00K00 | |
| Lenovo ThinkPad X1 Carbon 2020-20UAS04T00 | |
| Lenovo ThinkPad T14s-20T00044GE | |
| Dell Latitude 7410 | |
| Cinebench R15 / CPU Single 64Bit | |
| Média da turma Office (99.5 - 312, n=75, últimos 2 anos) | |
| Lenovo ThinkPad X1 Carbon 2020-20UAS04T00 | |
| Média AMD Ryzen 7 PRO 4750U (180 - 184, n=5) | |
| Lenovo ThinkPad T14s-20UJS00K00 | |
| Dell Latitude 7410 | |
| Lenovo ThinkPad T14s-20T00044GE | |
| Lenovo ThinkPad T495s-20QKS01E00 | |
| Cinebench R15 / CPU Multi 64Bit | |
| Média da turma Office (250 - 3380, n=75, últimos 2 anos) | |
| Média AMD Ryzen 7 PRO 4750U (1287 - 1417, n=5) | |
| Lenovo ThinkPad T14s-20UJS00K00 | |
| Lenovo ThinkPad X1 Carbon 2020-20UAS04T00 | |
| Lenovo ThinkPad T495s-20QKS01E00 | |
| Lenovo ThinkPad T14s-20T00044GE | |
| Dell Latitude 7410 | |
| Blender / v2.79 BMW27 CPU | |
| Dell Latitude 7410 | |
| Lenovo ThinkPad T14s-20T00044GE | |
| Lenovo ThinkPad T495s-20QKS01E00 | |
| Lenovo ThinkPad X1 Carbon 2020-20UAS04T00 | |
| Lenovo ThinkPad T14s-20UJS00K00 | |
| Média da turma Office (158 - 1940, n=74, últimos 2 anos) | |
| Média AMD Ryzen 7 PRO 4750U (340 - 403, n=5) | |
| 7-Zip 18.03 / 7z b 4 -mmt1 | |
| Média da turma Office (3387 - 6469, n=75, últimos 2 anos) | |
| Dell Latitude 7410 | |
| Lenovo ThinkPad X1 Carbon 2020-20UAS04T00 | |
| Lenovo ThinkPad T14s-20UJS00K00 | |
| Média AMD Ryzen 7 PRO 4750U (4413 - 4467, n=5) | |
| Lenovo ThinkPad T14s-20T00044GE | |
| Lenovo ThinkPad T495s-20QKS01E00 | |
| 7-Zip 18.03 / 7z b 4 | |
| Média da turma Office (7098 - 76886, n=75, últimos 2 anos) | |
| Média AMD Ryzen 7 PRO 4750U (37081 - 42173, n=5) | |
| Lenovo ThinkPad T14s-20UJS00K00 | |
| Lenovo ThinkPad X1 Carbon 2020-20UAS04T00 | |
| Lenovo ThinkPad T14s-20T00044GE | |
| Dell Latitude 7410 | |
| Lenovo ThinkPad T495s-20QKS01E00 | |
| Geekbench 5.5 / Single-Core | |
| Média da turma Office (811 - 2128, n=71, últimos 2 anos) | |
| Dell Latitude 7410 | |
| Lenovo ThinkPad X1 Carbon 2020-20UAS04T00 | |
| Lenovo ThinkPad T14s-20UJS00K00 | |
| Média AMD Ryzen 7 PRO 4750U (1117 - 1157, n=5) | |
| Lenovo ThinkPad T14s-20T00044GE | |
| Geekbench 5.5 / Multi-Core | |
| Média da turma Office (1483 - 16999, n=71, últimos 2 anos) | |
| Lenovo ThinkPad T14s-20UJS00K00 | |
| Média AMD Ryzen 7 PRO 4750U (5456 - 6609, n=5) | |
| Lenovo ThinkPad X1 Carbon 2020-20UAS04T00 | |
| Lenovo ThinkPad T14s-20T00044GE | |
| Dell Latitude 7410 | |
| HWBOT x265 Benchmark v2.2 / 4k Preset | |
| Média da turma Office (2.21 - 26, n=74, últimos 2 anos) | |
| Lenovo ThinkPad T14s-20UJS00K00 | |
| Média AMD Ryzen 7 PRO 4750U (8.33 - 10.3, n=5) | |
| Lenovo ThinkPad X1 Carbon 2020-20UAS04T00 | |
| Lenovo ThinkPad T14s-20T00044GE | |
| Dell Latitude 7410 | |
| Lenovo ThinkPad T495s-20QKS01E00 | |
| LibreOffice / 20 Documents To PDF | |
| Média AMD Ryzen 7 PRO 4750U (58.4 - 73.4, n=5) | |
| Lenovo ThinkPad T14s-20UJS00K00 | |
| Média da turma Office (39.9 - 102.3, n=74, últimos 2 anos) | |
| Dell Latitude 7410 | |
| Lenovo ThinkPad T14s-20T00044GE | |
| Lenovo ThinkPad X1 Carbon 2020-20UAS04T00 | |
| R Benchmark 2.5 / Overall mean | |
| Lenovo ThinkPad T14s-20T00044GE | |
| Lenovo ThinkPad X1 Carbon 2020-20UAS04T00 | |
| Dell Latitude 7410 | |
| Lenovo ThinkPad T14s-20UJS00K00 | |
| Média AMD Ryzen 7 PRO 4750U (0.61 - 0.621, n=5) | |
| Média da turma Office (0.4098 - 0.888, n=74, últimos 2 anos) | |
* ... menor é melhor
| PCMark 8 Home Score Accelerated v2 | 4640 pontos | |
| PCMark 8 Creative Score Accelerated v2 | 5813 pontos | |
| PCMark 8 Work Score Accelerated v2 | 5570 pontos | |
| PCMark 10 Score | 4890 pontos | |
Ajuda | ||
| DPC Latencies / LatencyMon - interrupt to process latency (max), Web, Youtube, Prime95 | |
| Lenovo ThinkPad T14s-20T00044GE | |
| Lenovo ThinkPad T14s-20UJS00K00 | |
| Dell Latitude 7410 | |
| Lenovo ThinkPad X1 Carbon 2020-20UAS04T00 | |
* ... menor é melhor
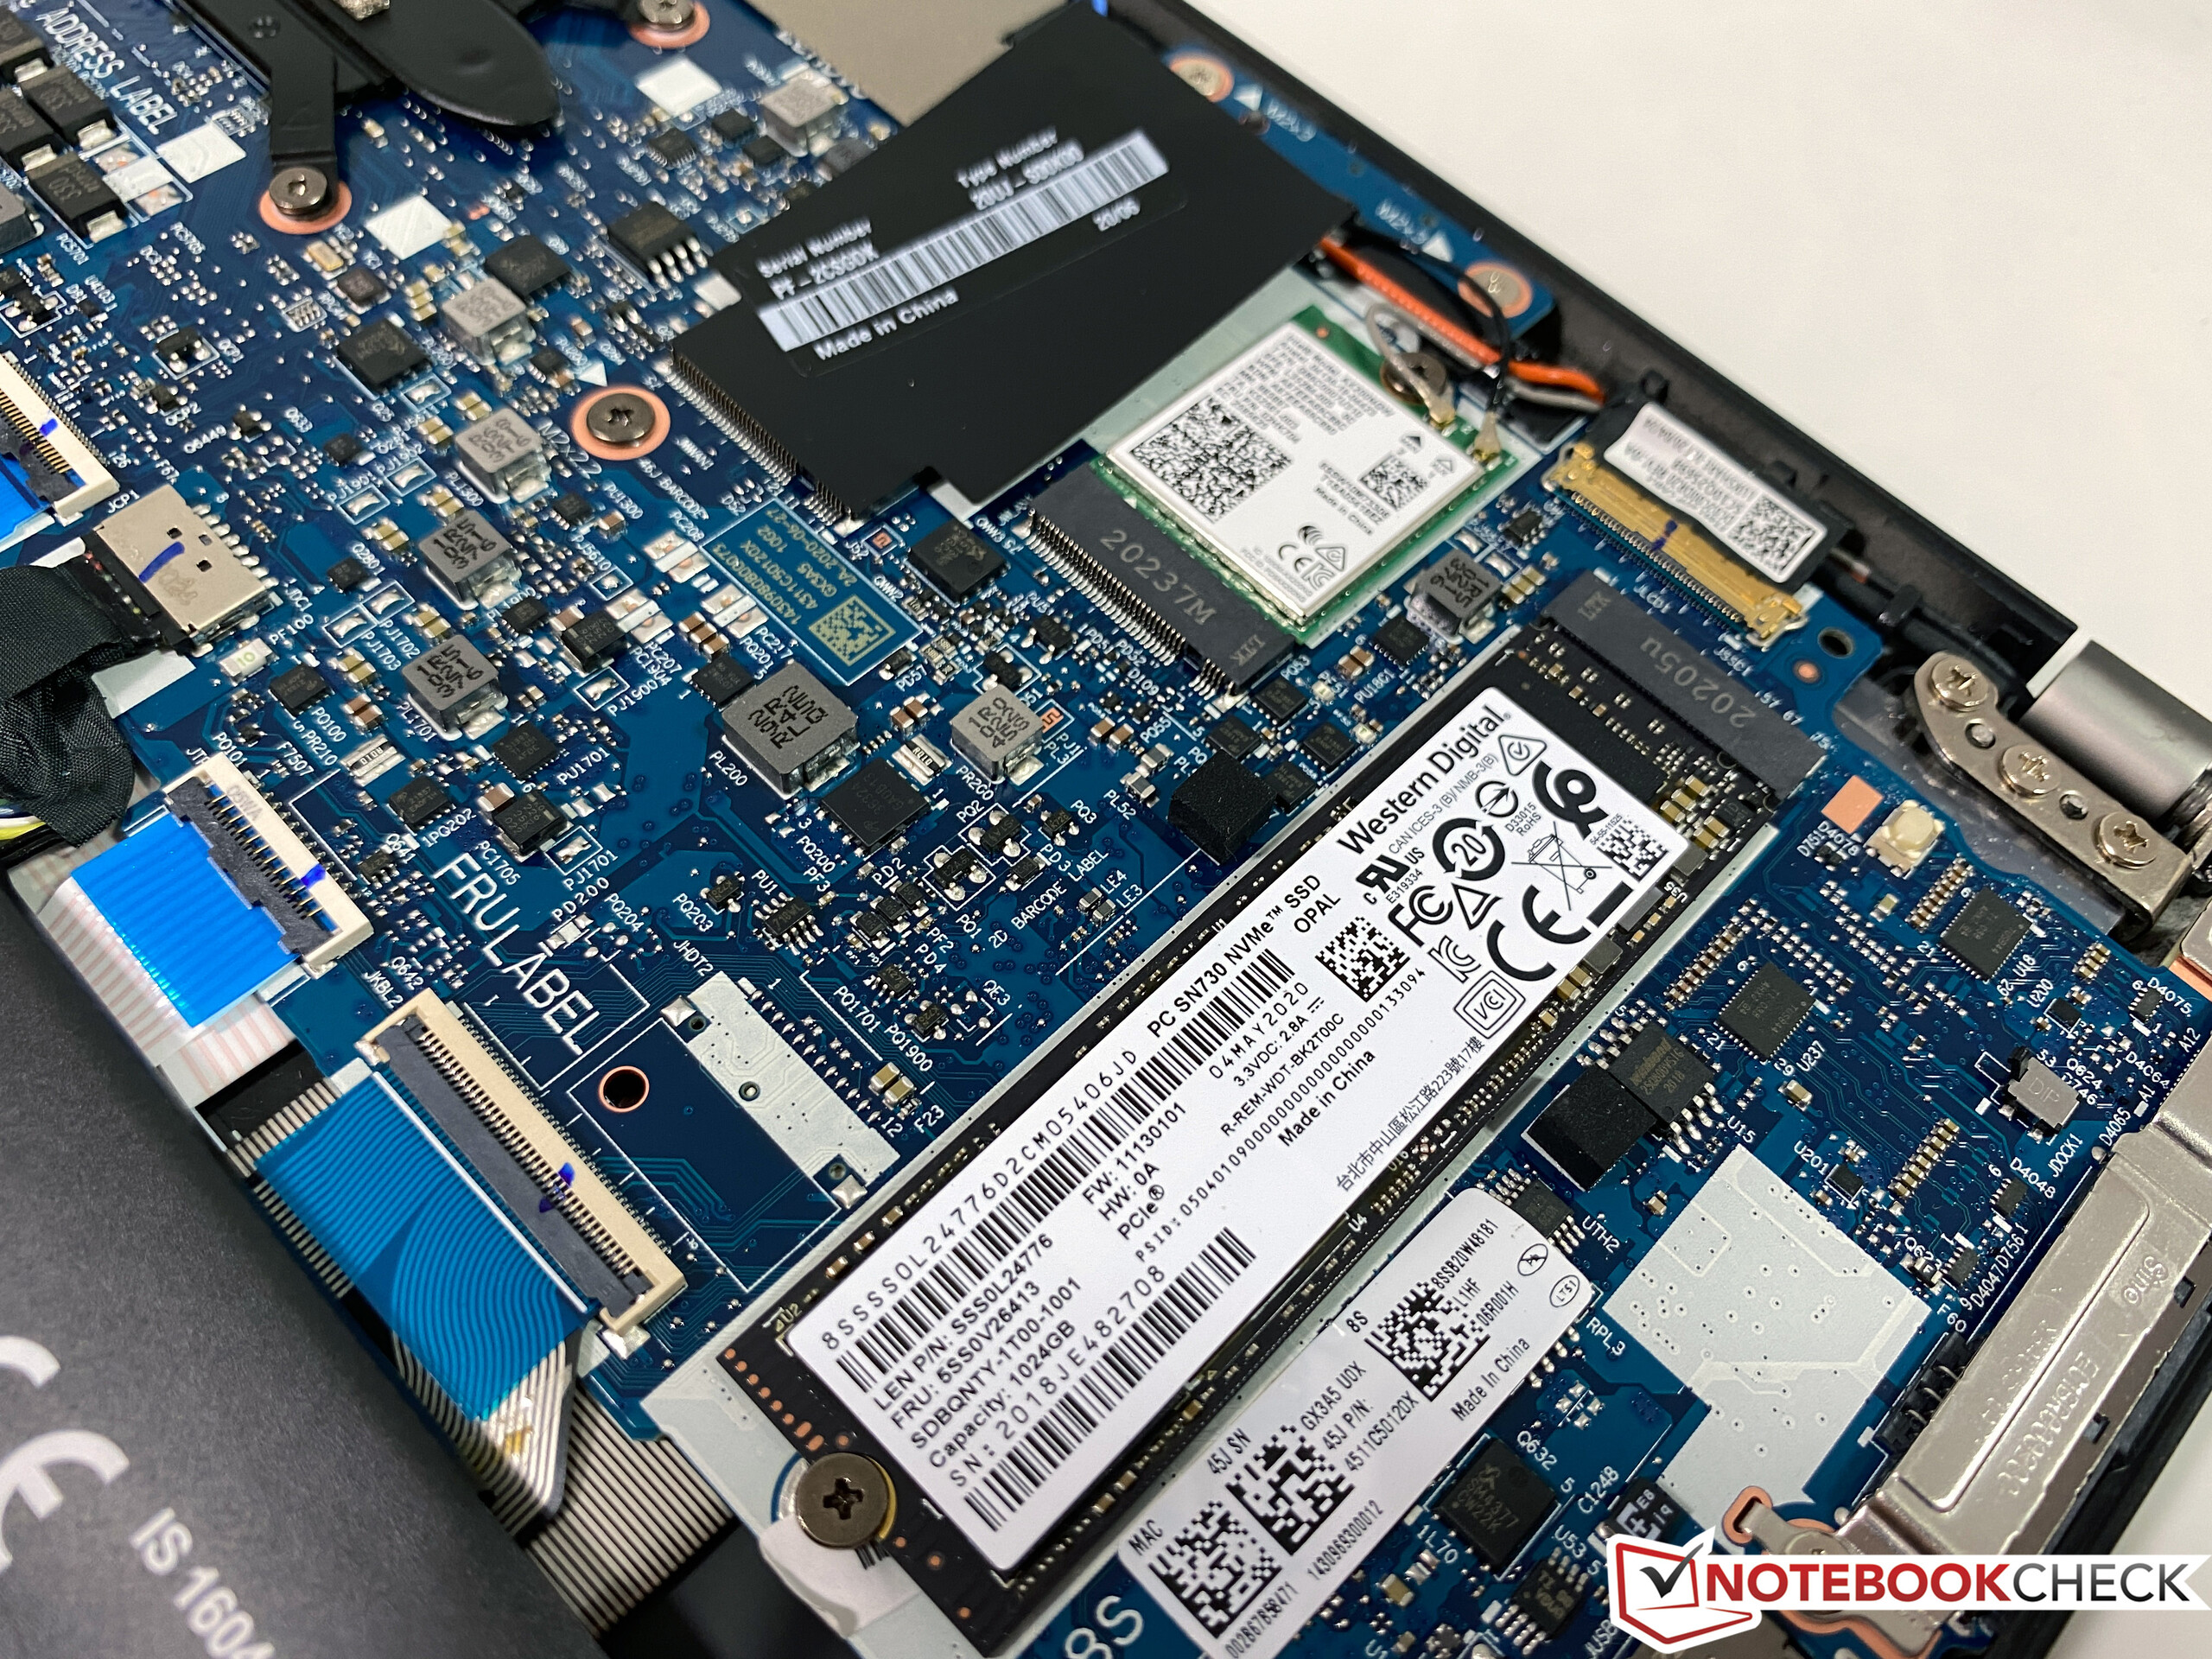
| Lenovo ThinkPad T14s-20UJS00K00 WDC PC SN730 SDBPNTY-1T00 | Lenovo ThinkPad T14s-20T00044GE Samsung SSD PM981a MZVLB256HBHQ | Lenovo ThinkPad T495s-20QKS01E00 Samsung PM981a MZVLB1T0HBLR | Dell Latitude 7410 Toshiba XG6 KXG60ZNV512G | Lenovo ThinkPad X1 Carbon 2020-20UAS04T00 Samsung SSD PM981a MZVLB512HBJQ | Média WDC PC SN730 SDBPNTY-1T00 | |
|---|---|---|---|---|---|---|
| CrystalDiskMark 5.2 / 6 | -7% | 1% | 2% | 14% | 10% | |
| Write 4K (MB/s) | 108 | 117.5 9% | 142.3 32% | 133.4 24% | 185 71% | 139.9 ? 30% |
| Read 4K (MB/s) | 39.82 | 40.81 2% | 46.69 17% | 51.3 29% | 50.6 27% | 44.5 ? 12% |
| Write Seq (MB/s) | 2028 | 2031 0% | 1897 -6% | 1543 -24% | 2346 ? 16% | |
| Read Seq (MB/s) | 1826 | 1970 8% | 2202 21% | 1509 -17% | 2102 ? 15% | |
| Write 4K Q32T1 (MB/s) | 570 | 395.5 -31% | 268.3 -53% | 384.9 -32% | 488.8 -14% | 442 ? -22% |
| Read 4K Q32T1 (MB/s) | 401.5 | 361.4 -10% | 359.6 -10% | 318.7 -21% | 579 44% | 460 ? 15% |
| Write Seq Q32T1 (MB/s) | 3091 | 2330 -25% | 3033 -2% | 2866 -7% | 2986 -3% | 3049 ? -1% |
| Read Seq Q32T1 (MB/s) | 2872 | 2530 -12% | 3561 24% | 3122 9% | 3555 24% | 3285 ? 14% |
| Write 4K Q8T8 (MB/s) | 1491 | 1012 ? | ||||
| Read 4K Q8T8 (MB/s) | 1499 | 1300 ? | ||||
| AS SSD | -20% | 8% | -28% | 23% | 2% | |
| Seq Read (MB/s) | 2291 | 2631 15% | 2661 16% | 1837 -20% | 2659 16% | 2606 ? 14% |
| Seq Write (MB/s) | 1343 | 1191 -11% | 2314 72% | 1438 7% | 2551 90% | 1935 ? 44% |
| 4K Read (MB/s) | 42.56 | 44.76 5% | 45.52 7% | 48.1 13% | 56.4 33% | 42.9 ? 1% |
| 4K Write (MB/s) | 132.2 | 124.7 -6% | 105.3 -20% | 132.1 0% | 158 20% | 129.1 ? -2% |
| 4K-64 Read (MB/s) | 850 | 756 -11% | 1806 112% | 660 -22% | 1317 55% | 1361 ? 60% |
| 4K-64 Write (MB/s) | 2262 | 1300 -43% | 1650 -27% | 1163 -49% | 1786 -21% | 1920 ? -15% |
| Access Time Read * (ms) | 0.05 | 0.089 -78% | 0.04 20% | 0.059 -18% | 0.047 6% | 0.0689 ? -38% |
| Access Time Write * (ms) | 0.028 | 0.03 -7% | 0.041 -46% | 0.096 -243% | 0.024 14% | 0.06215 ? -122% |
| Score Read (Points) | 1121 | 1064 -5% | 2118 89% | 891 -21% | 1640 46% | 1664 ? 48% |
| Score Write (Points) | 2529 | 1544 -39% | 1986 -21% | 1439 -43% | 2199 -13% | 2242 ? -11% |
| Score Total (Points) | 4185 | 3090 -26% | 5169 24% | 2780 -34% | 4682 12% | 4726 ? 13% |
| Copy ISO MB/s (MB/s) | 2546 | 1813 -29% | 1131 -56% | 2089 -18% | 2041 ? -20% | |
| Copy Program MB/s (MB/s) | 428.6 | 524 22% | 267.1 -38% | 548 28% | 552 ? 29% | |
| Copy Game MB/s (MB/s) | 943 | 350.5 -63% | 691 -27% | 1226 30% | 1183 ? 25% | |
| Média Total (Programa/Configurações) | -14% /
-15% | 5% /
6% | -13% /
-17% | 19% /
19% | 6% /
5% |
* ... menor é melhor

Continuous Performance Read: DiskSpd Read Loop, Queue Depth 8
| 3DMark Vantage P Result | 17399 pontos | |
| 3DMark 11 Performance | 5705 pontos | |
| 3DMark Fire Strike Score | 3267 pontos | |
Ajuda | ||
| baixo | média | alto | ultra | |
|---|---|---|---|---|
| The Witcher 3 (2015) | 64.9 | 20.7 | ||
| Dota 2 Reborn (2015) | 100 | 82.7 | 52.5 | 48.9 |
| Rise of the Tomb Raider (2016) | 68.2 | 21.8 | ||
| X-Plane 11.11 (2018) | 42.4 | 34.1 | 29.8 | |
| Far Cry 5 (2018) | 37 | 18 | 17 | |
| F1 2020 (2020) | 81 | 40 | 30 | 21 |
Barulho
| Ocioso |
| 29.2 / 29.2 / 29.6 dB |
| Carga |
| 30.2 / 32.3 dB |
 | ||
30 dB silencioso 40 dB(A) audível 50 dB(A) ruidosamente alto |
||
min: | ||
| Lenovo ThinkPad T14s-20UJS00K00 Vega 7, R7 PRO 4750U, WDC PC SN730 SDBPNTY-1T00 | Lenovo ThinkPad T14s-20T00044GE UHD Graphics 620, i5-10210U, Samsung SSD PM981a MZVLB256HBHQ | Lenovo ThinkPad T495s-20QKS01E00 Vega 10, R7 PRO 3700U, Samsung PM981a MZVLB1T0HBLR | Dell Latitude 7410 UHD Graphics 620, i7-10610U, Toshiba XG6 KXG60ZNV512G | Lenovo ThinkPad X1 Carbon 2020-20UAS04T00 UHD Graphics 620, i7-10510U, Samsung SSD PM981a MZVLB512HBJQ | |
|---|---|---|---|---|---|
| Noise | 2% | -1% | -1% | -2% | |
| desligado / ambiente * (dB) | 29.2 | 29.3 -0% | 28.9 1% | 28.1 4% | 29.5 -1% |
| Idle Minimum * (dB) | 29.2 | 29.3 -0% | 28.9 1% | 28.1 4% | 29.5 -1% |
| Idle Average * (dB) | 29.2 | 29.3 -0% | 28.9 1% | 28.1 4% | 29.5 -1% |
| Idle Maximum * (dB) | 29.6 | 29.3 1% | 28.9 2% | 28.1 5% | 29.5 -0% |
| Load Average * (dB) | 30.2 | 30 1% | 31.5 -4% | 30 1% | 31.6 -5% |
| Witcher 3 ultra * (dB) | 32.3 | ||||
| Load Maximum * (dB) | 32.3 | 30 7% | 33.8 -5% | 39.3 -22% | 33.9 -5% |
* ... menor é melhor
(±) A temperatura máxima no lado superior é 44.7 °C / 112 F, em comparação com a média de 34.3 °C / 94 F , variando de 21.2 a 62.5 °C para a classe Office.
(±) A parte inferior aquece até um máximo de 44.6 °C / 112 F, em comparação com a média de 36.8 °C / 98 F
(+) Em uso inativo, a temperatura média para o lado superior é 24.5 °C / 76 F, em comparação com a média do dispositivo de 29.5 °C / ### class_avg_f### F.
(+) Os apoios para as mãos e o touchpad são mais frios que a temperatura da pele, com um máximo de 31.3 °C / 88.3 F e, portanto, são frios ao toque.
(-) A temperatura média da área do apoio para as mãos de dispositivos semelhantes foi 27.5 °C / 81.5 F (-3.8 °C / -6.8 F).
| desligado | |
| Ocioso | |
| Carga |
|
Key:
min: | |
| Lenovo ThinkPad T14s-20UJS00K00 R7 PRO 4750U, Vega 7, WDC PC SN730 SDBPNTY-1T00, IPS , 1920x1080, 14" | Lenovo ThinkPad T14s-20T00044GE i5-10210U, UHD Graphics 620, Samsung SSD PM981a MZVLB256HBHQ, LTPS AHVA-IPS LED, 1920x1080, 14" | Lenovo ThinkPad T495s-20QKS01E00 R7 PRO 3700U, Vega 10, Samsung PM981a MZVLB1T0HBLR, IPS, 1920x1080, 14" | Dell Latitude 7410 i7-10610U, UHD Graphics 620, Toshiba XG6 KXG60ZNV512G, IPS, 3840x2160, 14" | Lenovo ThinkPad X1 Carbon 2020-20UAS04T00 i7-10510U, UHD Graphics 620, Samsung SSD PM981a MZVLB512HBJQ, IPS, 1920x1080, 14" | Média AMD Radeon RX Vega 7 | Média da turma Office | |
|---|---|---|---|---|---|---|---|
| Power Consumption | 20% | 4% | 3% | 5% | 3% | -2% | |
| Idle Minimum * (Watt) | 5.7 | 2.6 54% | 4.7 18% | 3.7 35% | 2.96 48% | 4.79 ? 16% | 4.41 ? 23% |
| Idle Average * (Watt) | 8.9 | 5.5 38% | 7.28 18% | 6.2 30% | 5.9 34% | 7.72 ? 13% | 7.37 ? 17% |
| Idle Maximum * (Watt) | 11 | 7.5 32% | 9.48 14% | 7 36% | 9.1 17% | 9.12 ? 17% | 8.58 ? 22% |
| Load Average * (Watt) | 38.2 | 28.2 26% | 35.3 8% | 43.2 -13% | 42.1 -10% | 38.4 ? -1% | 43 ? -13% |
| Load Maximum * (Watt) | 40.2 | 59.6 -48% | 55.5 -38% | 68.6 -71% | 65.1 -62% | 51.7 ? -29% | 64.6 ? -61% |
* ... menor é melhor
| Lenovo ThinkPad T14s-20UJS00K00 R7 PRO 4750U, Vega 7, 57 Wh | Lenovo ThinkPad T14s-20T00044GE i5-10210U, UHD Graphics 620, 57 Wh | Lenovo ThinkPad T495s-20QKS01E00 R7 PRO 3700U, Vega 10, 57 Wh | Dell Latitude 7410 i7-10610U, UHD Graphics 620, 68 Wh | Lenovo ThinkPad X1 Carbon 2020-20UAS04T00 i7-10510U, UHD Graphics 620, 51 Wh | Média da turma Office | |
|---|---|---|---|---|---|---|
| Duração da bateria | 7% | 3% | 23% | -9% | 8% | |
| H.264 (h) | 13.2 | 14.7 11% | 12.5 -5% | 12.8 -3% | 15 ? 14% | |
| WiFi v1.3 (h) | 10.2 | 13.2 29% | 11.3 11% | 11 8% | 10.1 -1% | 12.9 ? 26% |
| Load (h) | 2.1 | 1.7 -19% | 2.9 38% | 1.6 -24% | 1.794 ? -15% | |
| Reader / Idle (h) | 31.3 | 23.7 ? |
Pro
Contra
Veredicto - AMD com muitas vantagens
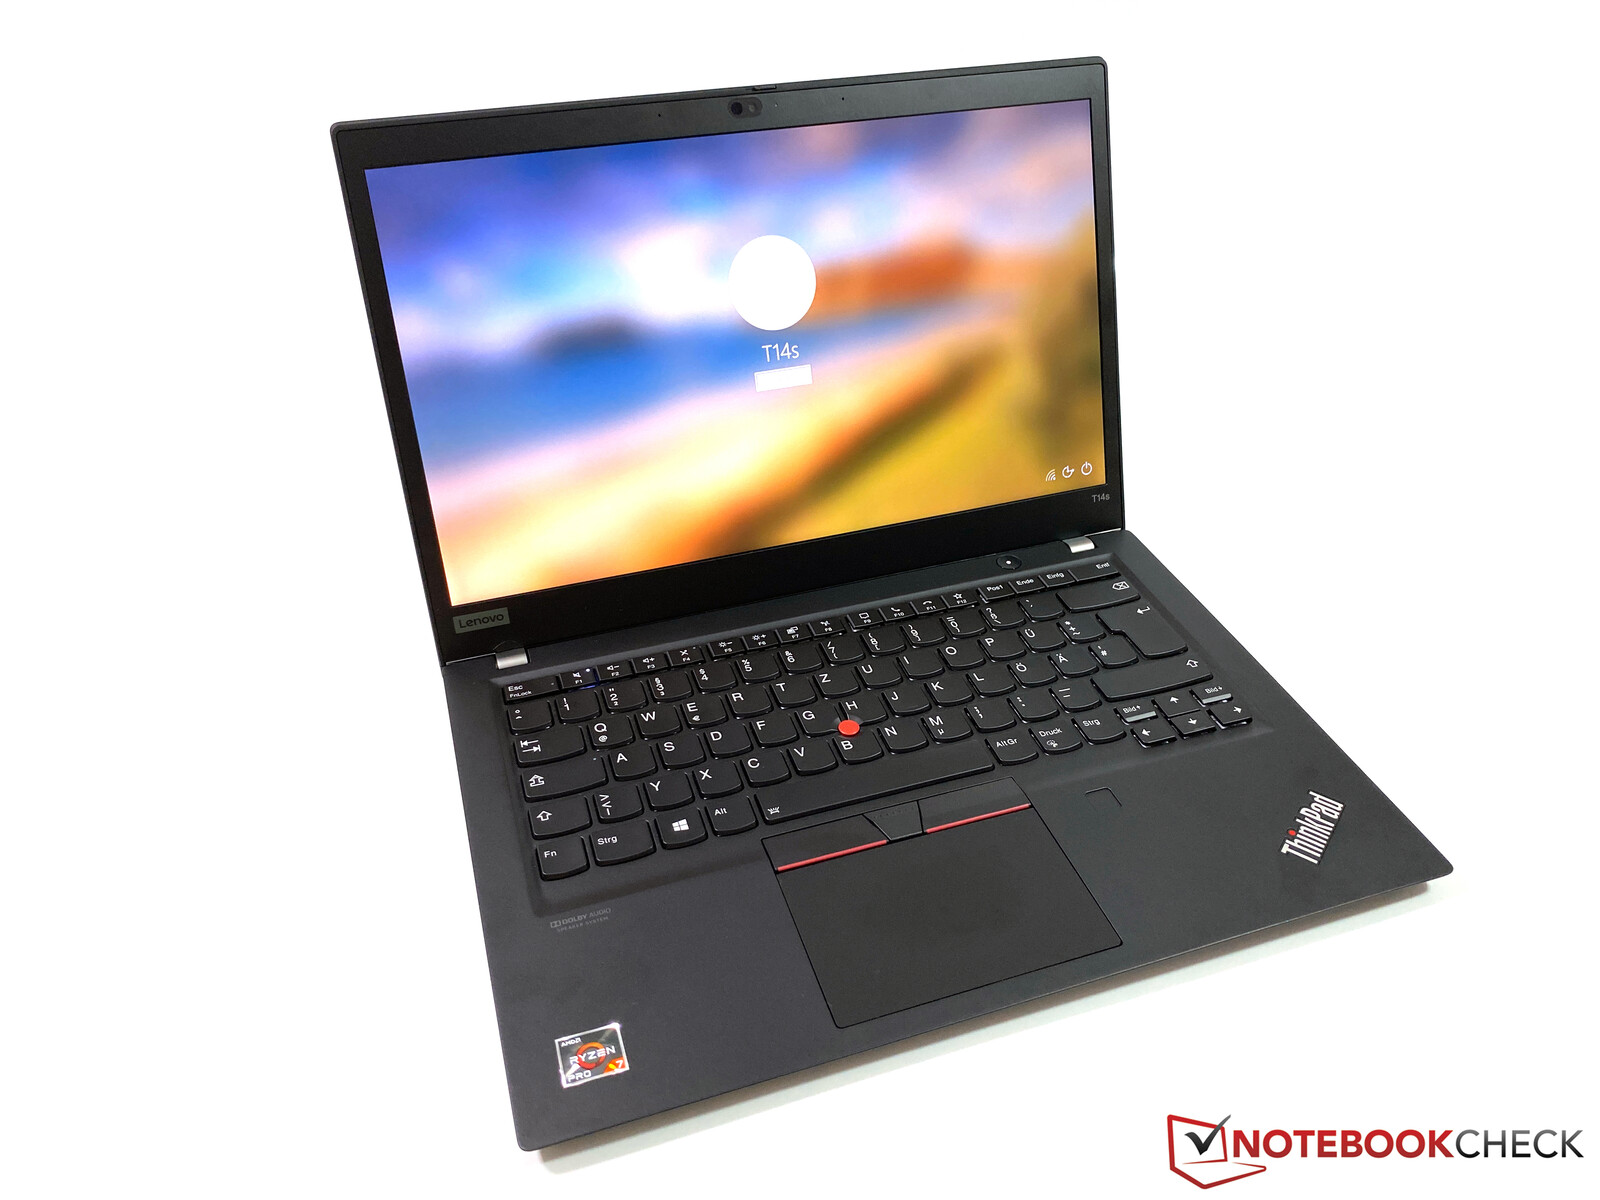
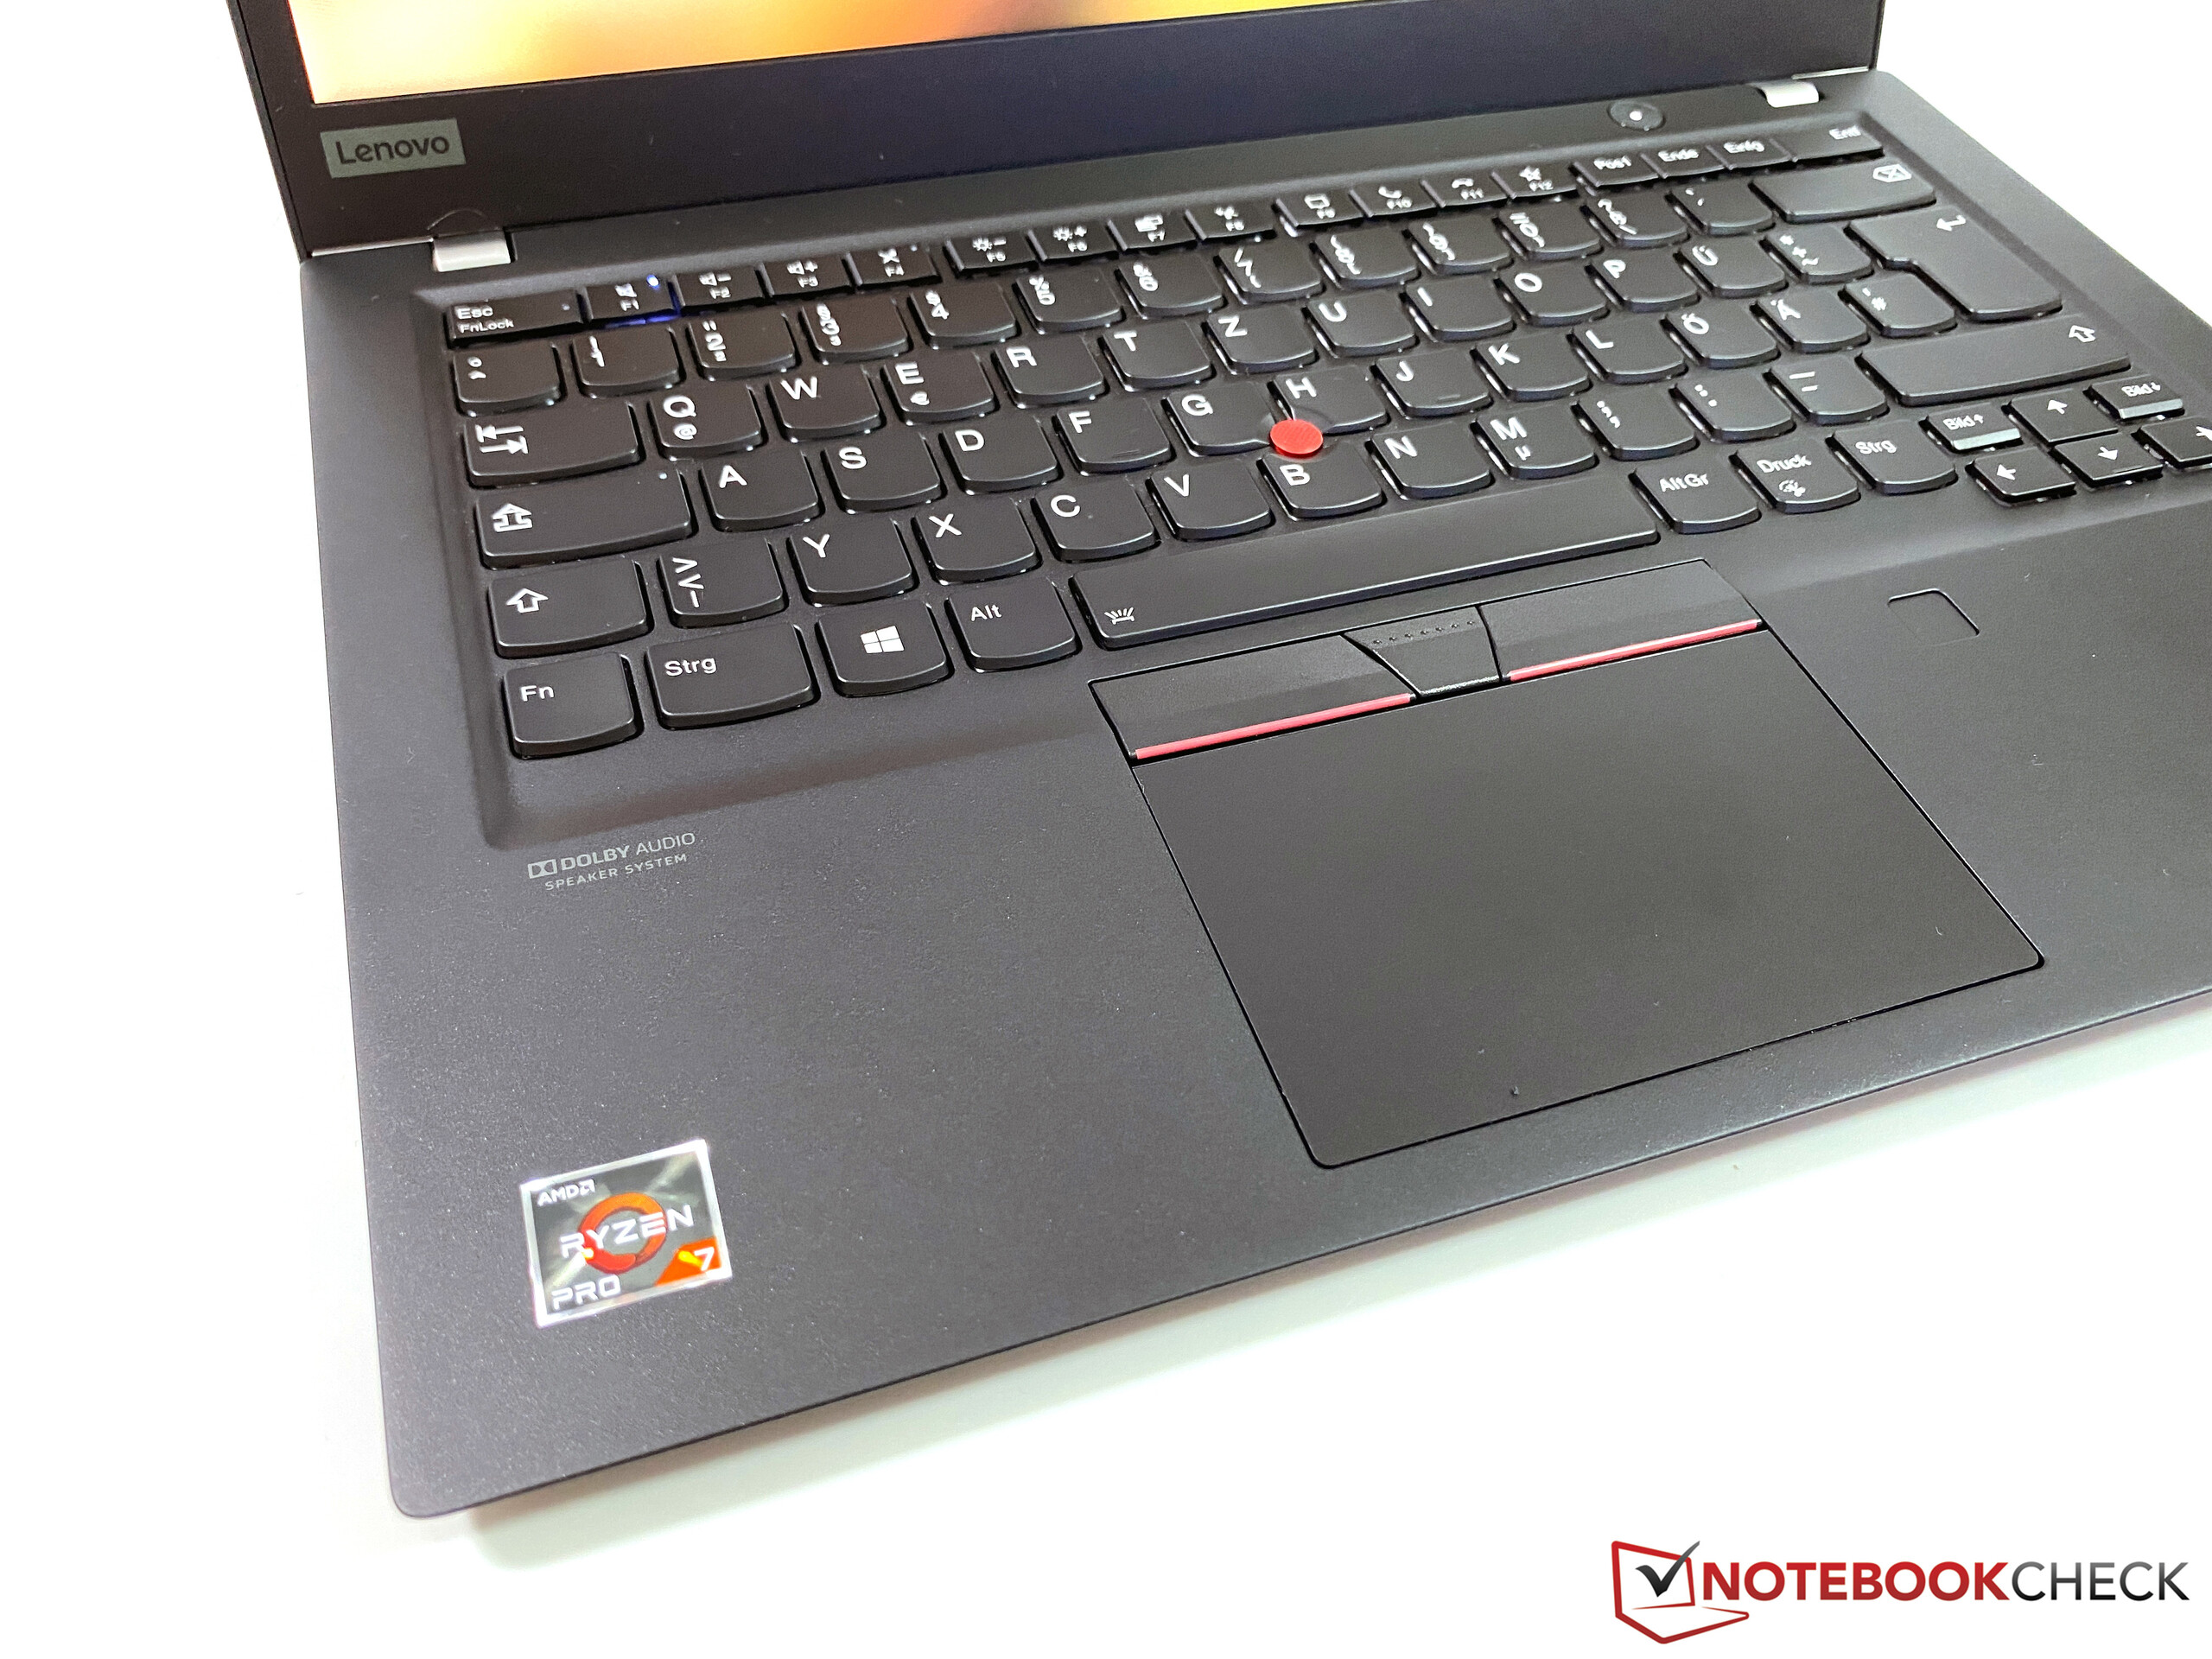
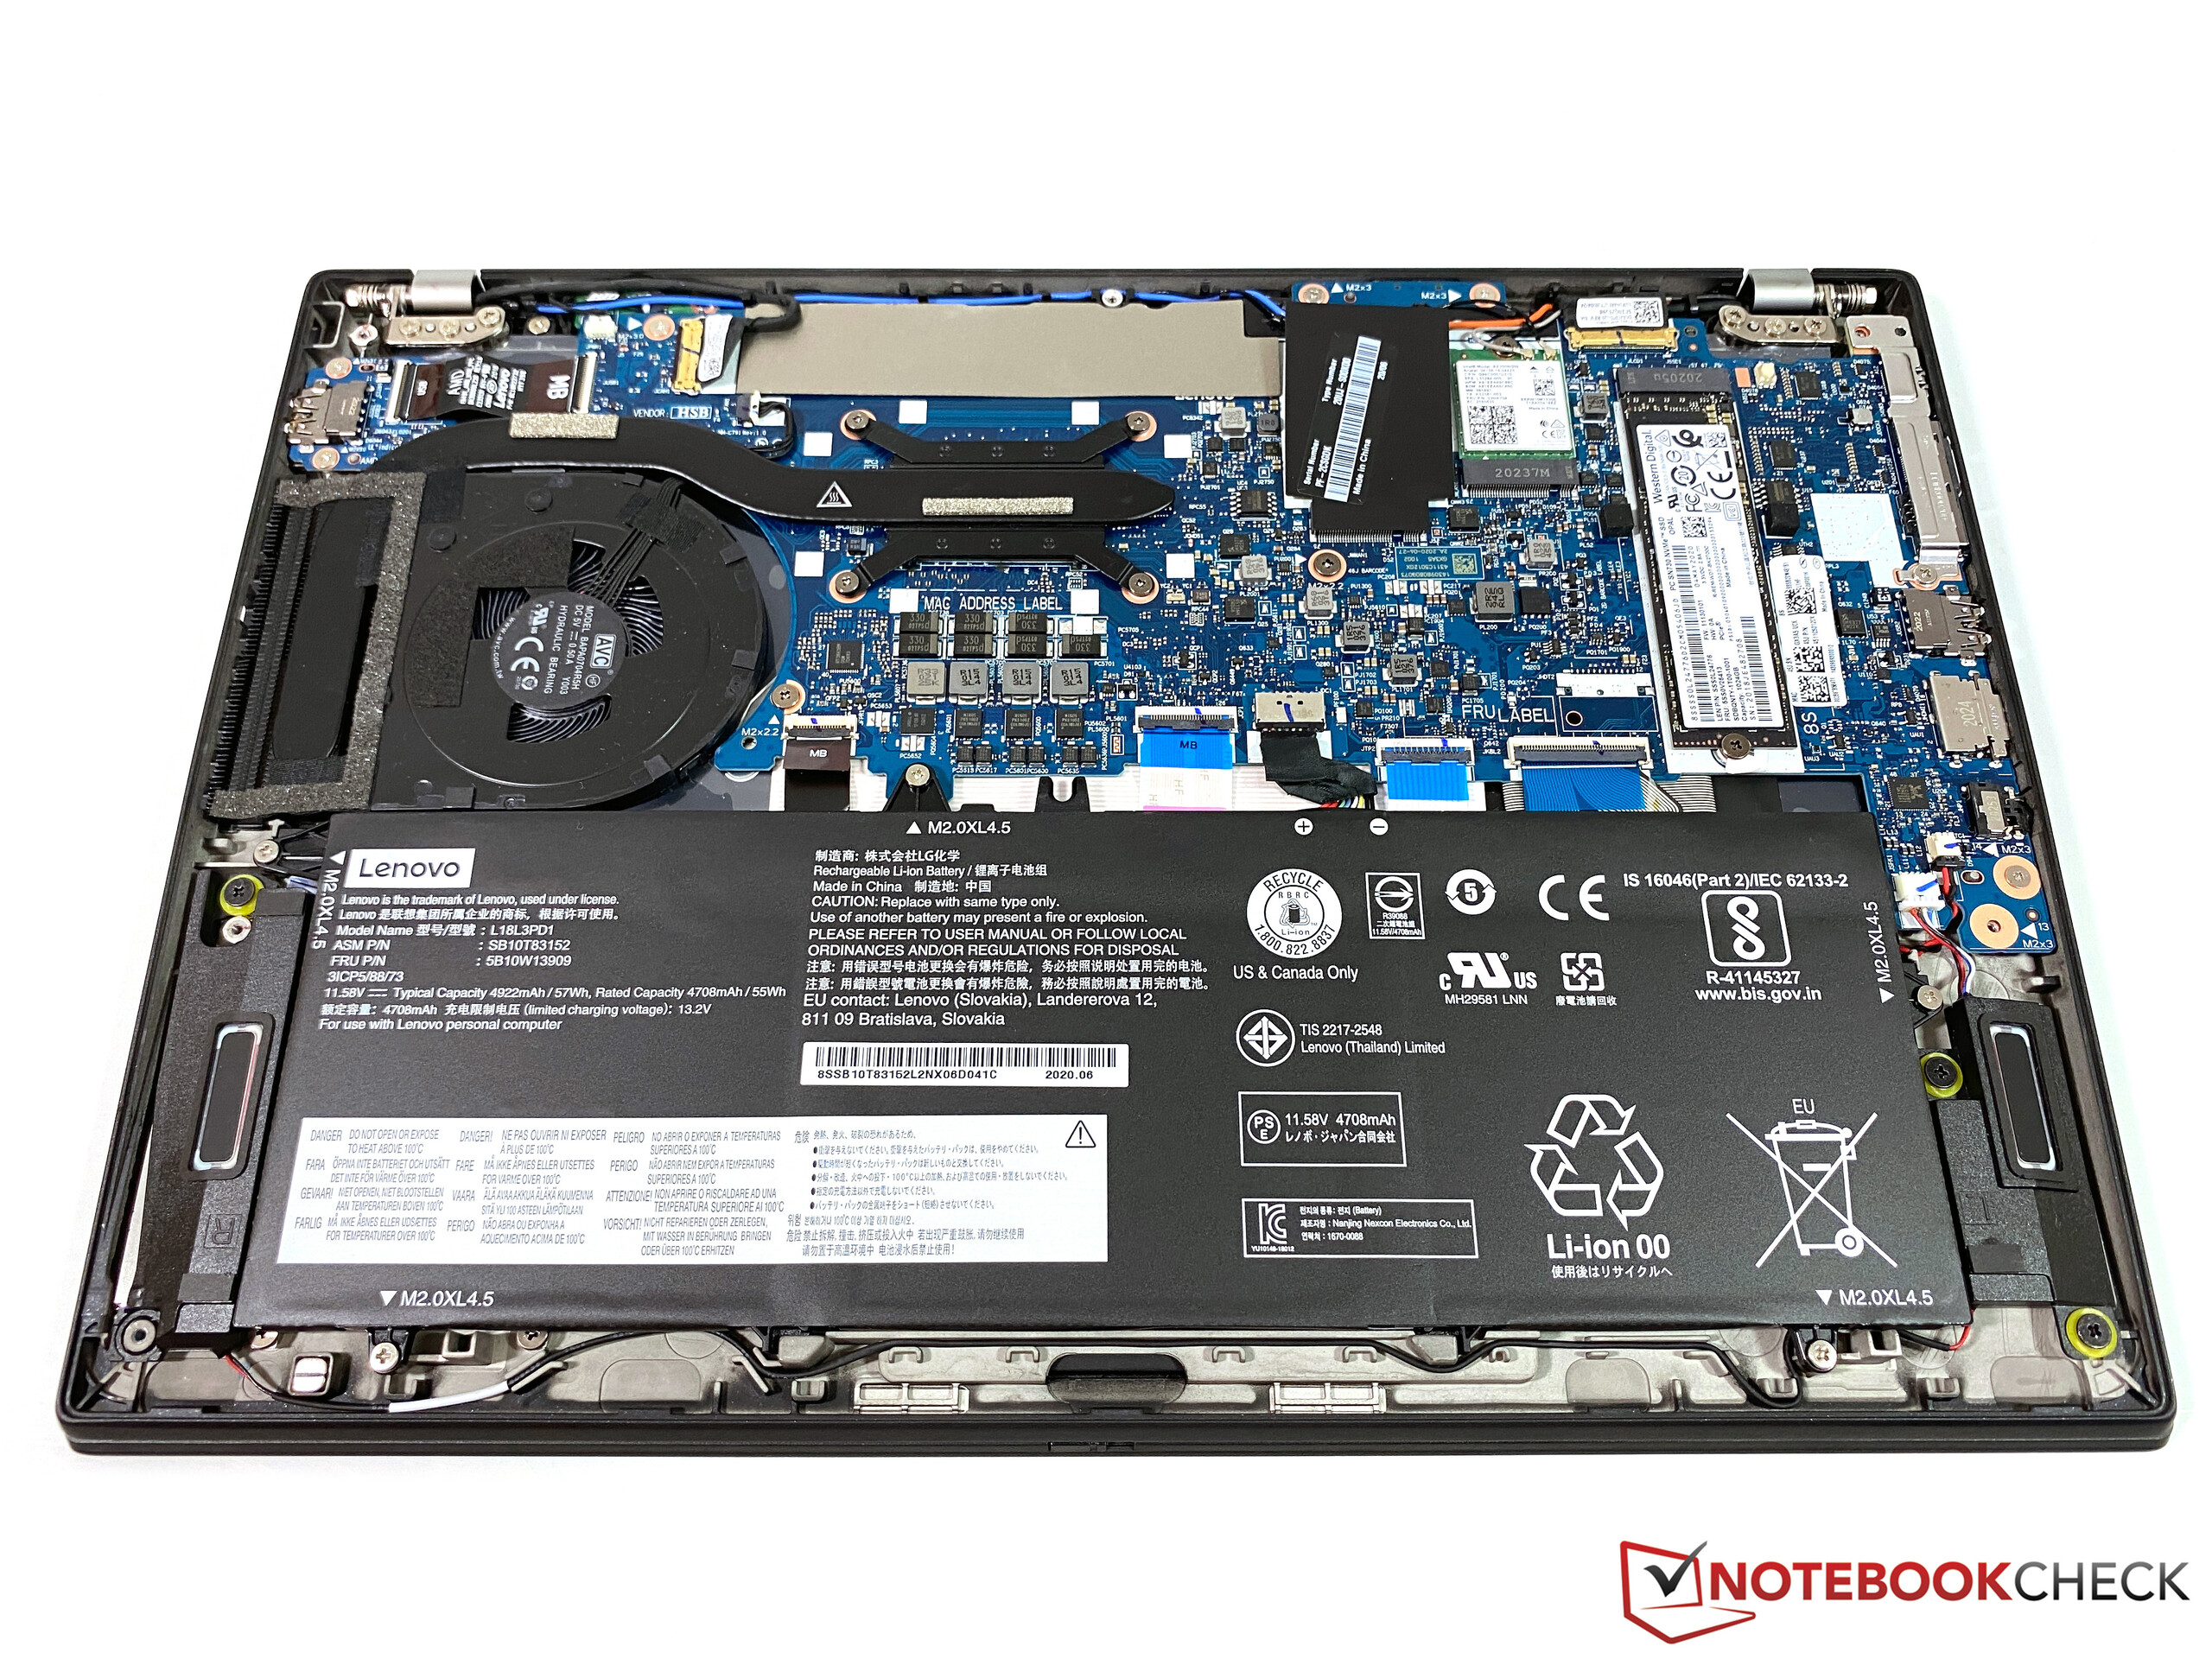
O ThinkPad T14s da Lenovo agora vem com processadores AMD e Intel, por isso é muito interessante comparar os dispositivos. A carcaça e os (muito bons) dispositivos de entrada são idênticos em ambas as máquinas, assim como a boa tela LowPower 1080p. No entanto, mais uma vez temos que mencionar que a Lenovo usa quatro fornecedores diferentes para a tela e você não sabe qual delas obterá. A tela de 4K, por outro lado, é limitada para modelos Intel.
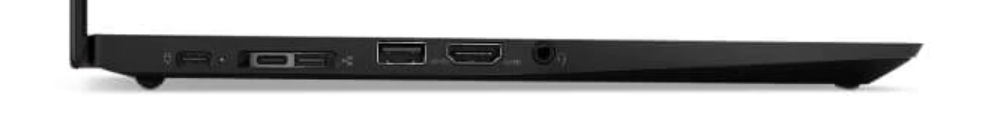
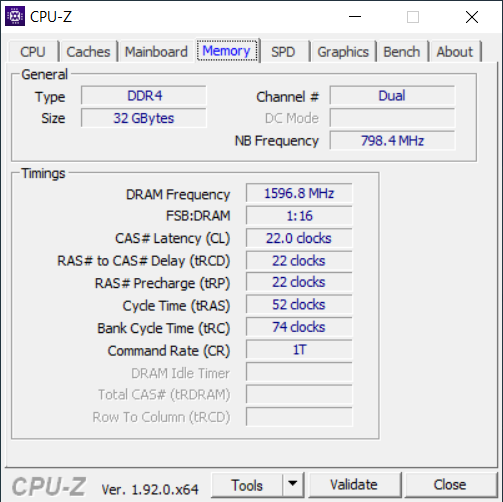
Também existem diferenças em termos de portas, porque o SKU AMD não tem Thunderbolt 3. No entanto, isso só deve ser importante se você quiser usar uma placa gráfica externa. O modelo AMD tem algumas vantagens em termos de recursos como HDMI 2.0, Bluetooth 5.1 e RAM mais rápida.
A maior diferença é o desempenho. Portáteis empresariais ainda estão usando os chips Comet-Lake-U da Intel devido ao suporte para vPro, então nem a CPU nem as GPUs integradas têm chance contra as novas CPUs móveis da AMD. Você obtém quase o dobro do desempenho da CPU e até mesmo alguns jogos são possíveis no ThinkPad.
Muito mais desempenho e mais barato: O ThinkPad T14s com o processador AMD deixa uma impressão geral melhor. O modelo educacional em particular é extremamente bem equipado e oferece uma ótima relação custo-benefício.
Existem mais duas desvantagens em comparação com o modelo Intel: O ventilador é um pouco mais barulhento sob uso intenso, e o consumo no modo inativo também é um pouco maior. Talvez o T14s AMD ainda precise de alguma otimização, o que poderia ser alcançado com as próximas atualizações do BIOS. Ainda assim, o tempo de duração da bateria não é ruim de forma alguma. Depois, está o preço, e é aí que a AMD definitivamente leva vantagem. As unidades TopSeller mais baratas têm uma diferença de preço de 150 euros (~$ 178), e a diferença fica maior quando você deseja obter um SKU Core i7. O modelo educacional que testamos com o Ryzen 7 Pro, 32 GB de RAM e um SSD PCIe de 1 TB, oferece uma excelente relação preço-desempenho por 1.399 Euros (~$ 1.657).
Se você não precisa do Thunderbolt 3 e pode viver com uma duração de bateria de 10 horas, será melhor com o ThinkPad T14s baseado em AMD. Graças ao teclado um pouco melhor e ao desempenho muito superior, também preferimos o T14s AMD sobre a geração ThinkPad X1 Carbon atual.
Lenovo ThinkPad T14s-20UJS00K00
- 08/11/2020 v7 (old)
Andreas Osthoff
Price comparison
