Breve Análise do Portátil HP Pavilion Gaming 15 (i7-8750H, GTX 1050 Ti, Optane Memory, FHD)
| SD Card Reader | |
| average JPG Copy Test (av. of 3 runs) | |
| Média da turma Gaming (20.9 - 210, n=54, últimos 2 anos) | |
| Acer Nitro 5 AN515-52-74DR (Toshiba Exceria Pro SDXC 64 GB UHS-II) | |
| HP Pavilion Gaming 15t-cx0000 (Toshiba Exceria Pro SDXC 64 GB UHS-II) | |
| Medion Erazer P6705-MD61131 (Toshiba Exceria Pro SDXC 64 GB UHS-II) | |
| HP Pavilion Gaming 15-cx0003ng (Toshiba Exceria Pro SDXC 64 GB UHS-II) | |
| Acer Nitro 5 AN515-42-R6V0 (Toshiba Exceria Pro SDXC 64 GB UHS-II) | |
| maximum AS SSD Seq Read Test (1GB) | |
| Média da turma Gaming (25.5 - 261, n=51, últimos 2 anos) | |
| Medion Erazer P6705-MD61131 (Toshiba Exceria Pro SDXC 64 GB UHS-II) | |
| Acer Nitro 5 AN515-52-74DR (Toshiba Exceria Pro SDXC 64 GB UHS-II) | |
| Acer Nitro 5 AN515-42-R6V0 (Toshiba Exceria Pro SDXC 64 GB UHS-II) | |
| HP Pavilion Gaming 15t-cx0000 (Toshiba Exceria Pro SDXC 64 GB UHS-II) | |
| HP Pavilion Gaming 15-cx0003ng (Toshiba Exceria Pro SDXC 64 GB UHS-II) | |
| Networking | |
| iperf3 transmit AX12 | |
| Acer Nitro 5 AN515-52-74DR | |
| HP Pavilion Gaming 15-cx0003ng | |
| Medion Erazer P6705-MD61131 | |
| Lenovo Legion Y530-15ICH | |
| HP Pavilion Gaming 15t-cx0000 | |
| Acer Nitro 5 AN515-42-R6V0 | |
| iperf3 receive AX12 | |
| Medion Erazer P6705-MD61131 | |
| Acer Nitro 5 AN515-42-R6V0 | |
| HP Pavilion Gaming 15t-cx0000 | |
| Acer Nitro 5 AN515-52-74DR | |
| Lenovo Legion Y530-15ICH | |
| HP Pavilion Gaming 15-cx0003ng | |
| |||||||||||||||||||||||||
iluminação: 75 %
iluminação com acumulador: 208 cd/m²
Contraste: 1607:1 (Preto: 0.15 cd/m²)
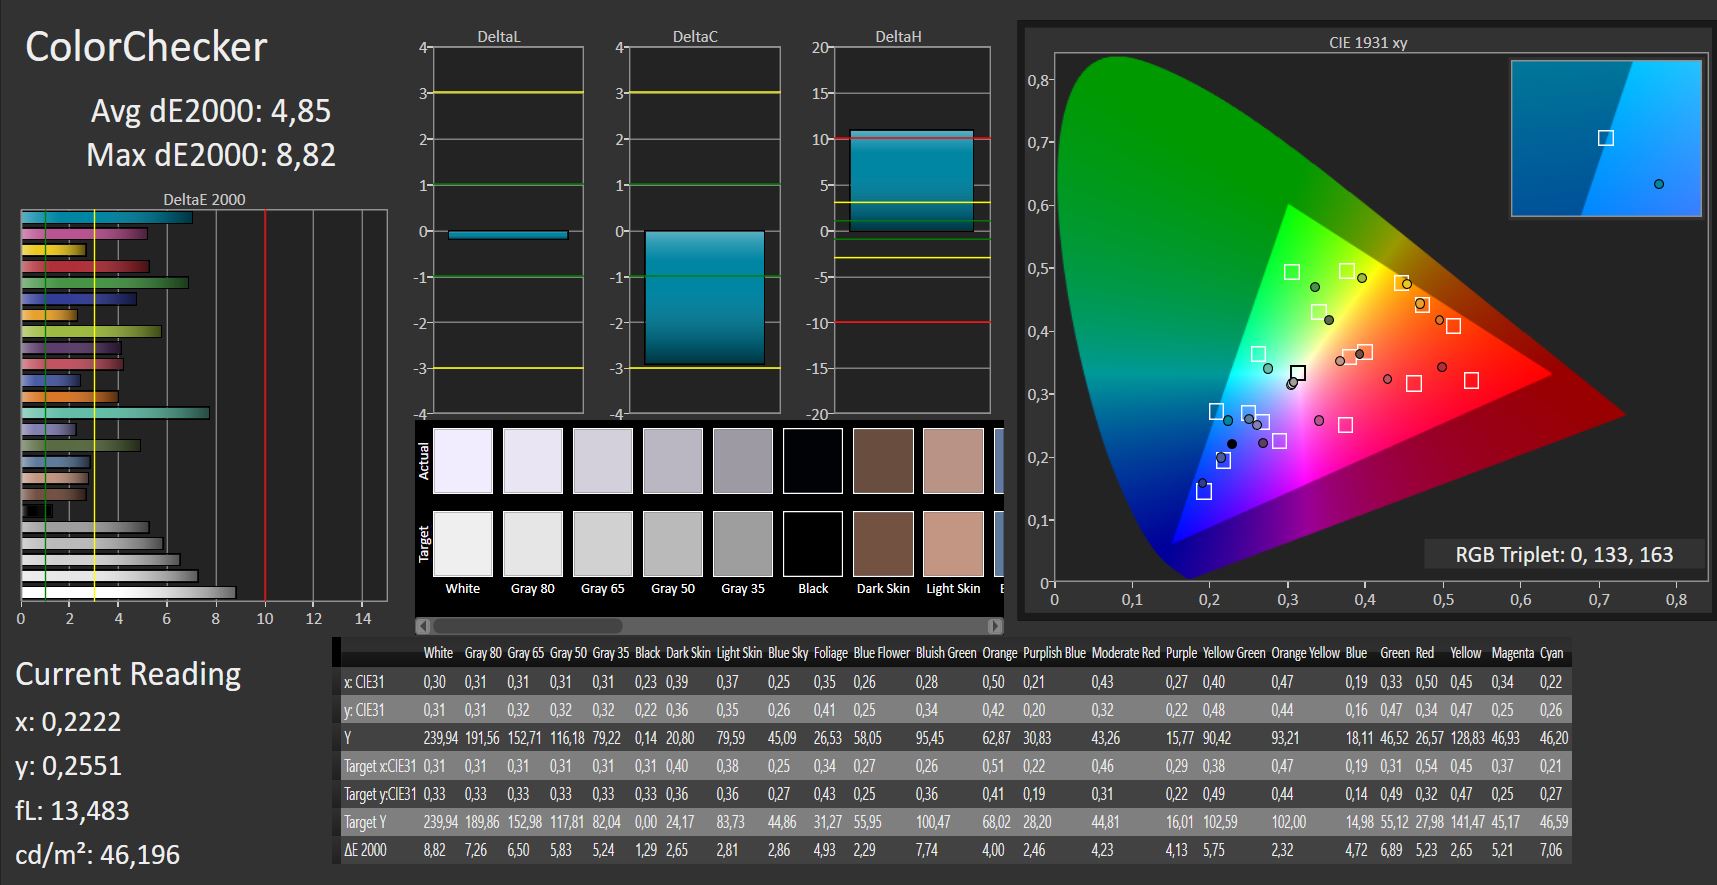
ΔE ColorChecker Calman: 4.85 | ∀{0.5-29.43 Ø4.71}
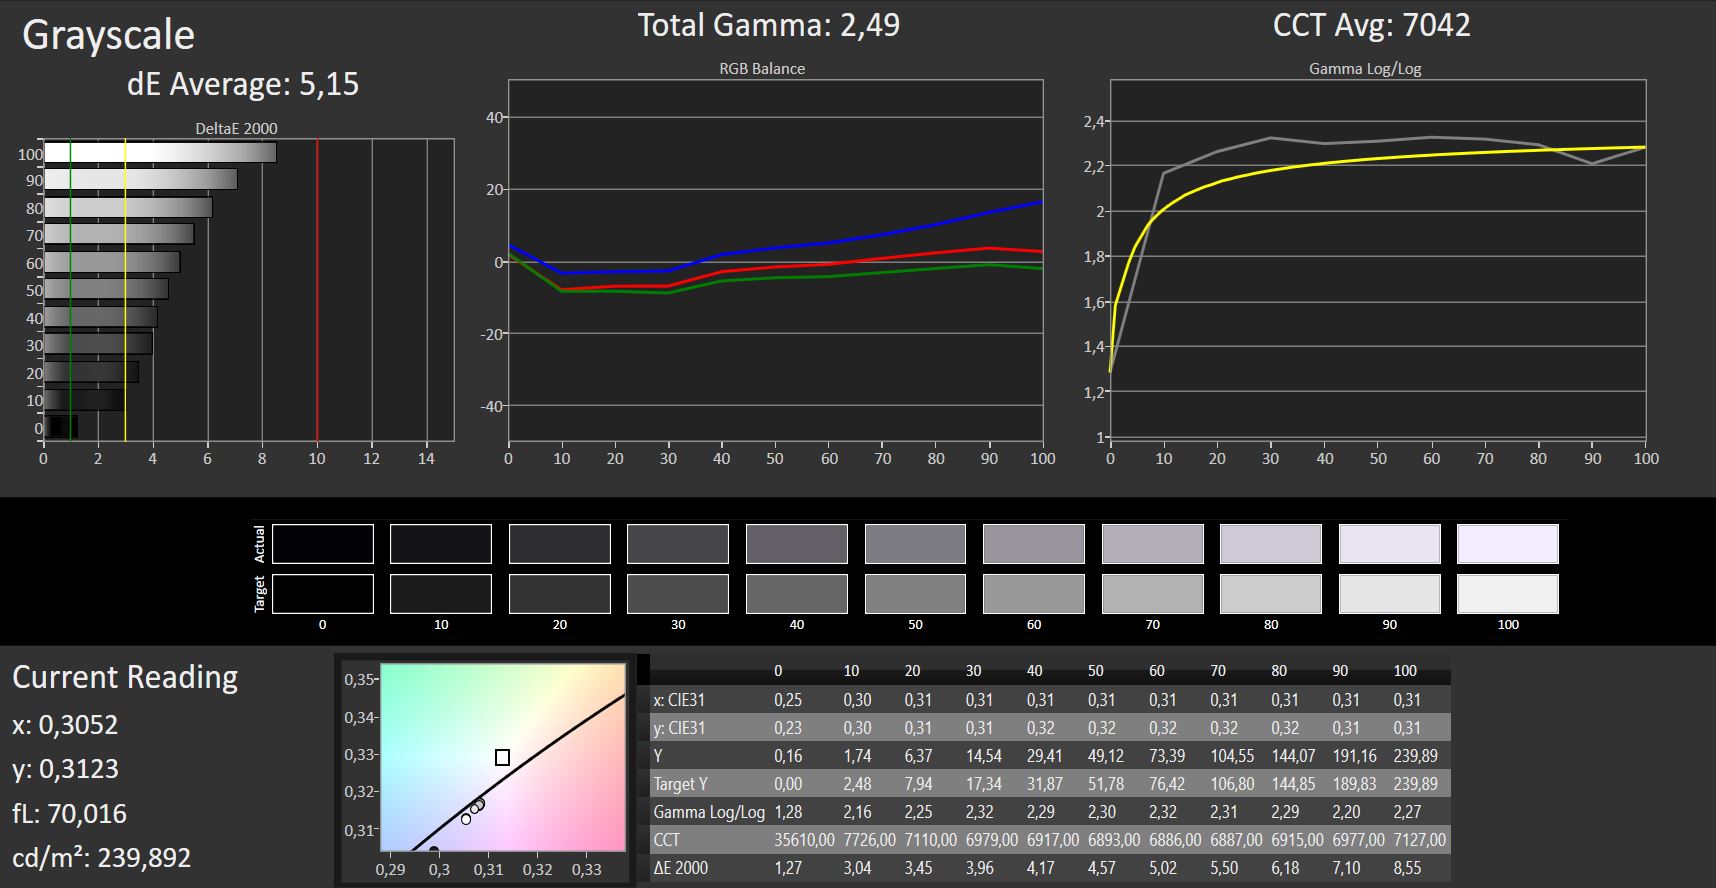
ΔE Greyscale Calman: 5.15 | ∀{0.09-98 Ø4.96}
59% sRGB (Argyll 1.6.3 3D)
38% AdobeRGB 1998 (Argyll 1.6.3 3D)
41.04% AdobeRGB 1998 (Argyll 3D)
59.3% sRGB (Argyll 3D)
39.72% Display P3 (Argyll 3D)
Gamma: 2.49
CCT: 7042 K
| HP Pavilion Gaming 15-cx0003ng IPS, 1920x1080, 15.6" | Acer Nitro 5 AN515-42-R6V0 IPS, 1920x1080, 15.6" | Acer Nitro 5 AN515-52-74DR IPS, 1920x1080, 15.6" | HP Pavilion Gaming 15t-cx0000 IPS, 1920x1080, 15.6" | Medion Erazer P6705-MD61131 TN, 1920x1080, 15.6" | Lenovo Legion Y530-15ICH IPS, 1920x1080, 15.6" | |
|---|---|---|---|---|---|---|
| Display | 54% | 0% | 62% | -8% | -4% | |
| Display P3 Coverage (%) | 39.72 | 63.4 60% | 39.59 0% | 66.5 67% | 36.4 -8% | 38.31 -4% |
| sRGB Coverage (%) | 59.3 | 87.4 47% | 59.5 0% | 91.7 55% | 54.8 -8% | 57.3 -3% |
| AdobeRGB 1998 Coverage (%) | 41.04 | 64 56% | 40.92 0% | 67.1 63% | 37.61 -8% | 39.58 -4% |
| Response Times | -5% | 24% | 64% | 27% | 1% | |
| Response Time Grey 50% / Grey 80% * (ms) | 47 ? | 48.4 ? -3% | 38 ? 19% | 17.6 ? 63% | 44.8 ? 5% | 43.6 ? 7% |
| Response Time Black / White * (ms) | 31 ? | 32.8 ? -6% | 22 ? 29% | 11.2 ? 64% | 16 ? 48% | 32.4 ? -5% |
| PWM Frequency (Hz) | 208 ? | |||||
| Screen | 10% | 1% | 11% | -68% | -28% | |
| Brightness middle (cd/m²) | 241 | 299 24% | 252 5% | 357.5 48% | 200 -17% | 282.8 17% |
| Brightness (cd/m²) | 236 | 284 20% | 237 0% | 351 49% | 186 -21% | 264 12% |
| Brightness Distribution (%) | 75 | 88 17% | 86 15% | 85 13% | 85 13% | 88 17% |
| Black Level * (cd/m²) | 0.15 | 0.24 -60% | 0.21 -40% | 0.36 -140% | 0.43 -187% | 0.42 -180% |
| Contrast (:1) | 1607 | 1246 -22% | 1200 -25% | 993 -38% | 465 -71% | 673 -58% |
| Colorchecker dE 2000 * | 4.85 | 4.98 -3% | 4.42 9% | 4.19 14% | 11.39 -135% | 4.93 -2% |
| Colorchecker dE 2000 max. * | 8.82 | 7.67 13% | 7.21 18% | 6.97 21% | 19.36 -120% | 17.65 -100% |
| Greyscale dE 2000 * | 5.15 | 4.58 11% | 3.74 27% | 3.5 32% | 11.73 -128% | 3.8 26% |
| Gamma | 2.49 88% | 2.55 86% | 2.34 94% | 2.324 95% | 1.97 112% | 2.449 90% |
| CCT | 7042 92% | 6397 102% | 7291 89% | 7028 92% | 12614 52% | 6112 106% |
| Color Space (Percent of AdobeRGB 1998) (%) | 38 | 57 50% | 38 0% | 60 58% | 35 -8% | 36 -5% |
| Color Space (Percent of sRGB) (%) | 59 | 87 47% | 59 0% | 91 54% | 55 -7% | 57 -3% |
| Colorchecker dE 2000 calibrated * | 3.7 | 3.08 | 3.2 | 3.05 | 4.07 | |
| Média Total (Programa/Configurações) | 20% /
17% | 8% /
4% | 46% /
28% | -16% /
-43% | -10% /
-19% |
* ... menor é melhor
Cintilação da tela / PWM (modulação por largura de pulso)
| Tela tremeluzindo/PWM detectado | 208 Hz | ≤ 90 % configuração de brilho | 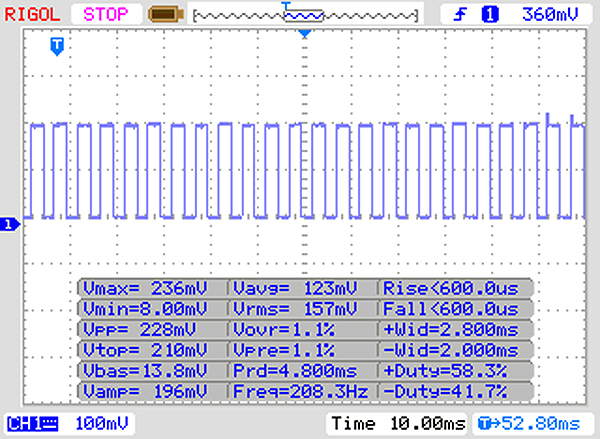 |
A luz de fundo da tela pisca em 208 Hz (pior caso, por exemplo, utilizando PWM) Cintilação detectada em uma configuração de brilho de 90 % e abaixo. Não deve haver cintilação ou PWM acima desta configuração de brilho. A frequência de 208 Hz é relativamente baixa, portanto, usuários sensíveis provavelmente notarão cintilação e sentirão fadiga ocular na configuração de brilho indicada e abaixo. [pwm_comparison] Em comparação: 52 % de todos os dispositivos testados não usam PWM para escurecer a tela. Se PWM foi detectado, uma média de 7754 (mínimo: 5 - máximo: 343500) Hz foi medida. | |||
Exibir tempos de resposta
| ↔ Tempo de resposta preto para branco | ||
|---|---|---|
| 31 ms ... ascensão ↗ e queda ↘ combinadas | ↗ 17 ms ascensão | 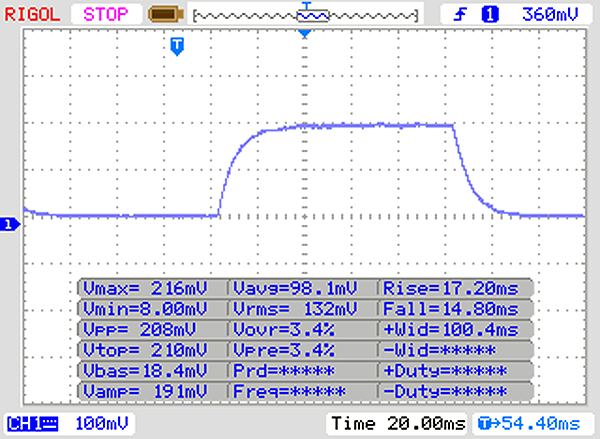 |
| ↘ 14 ms queda | ||
| A tela mostra taxas de resposta lentas em nossos testes e será insatisfatória para os jogadores. Em comparação, todos os dispositivos testados variam de 0.1 (mínimo) a 240 (máximo) ms. » 84 % de todos os dispositivos são melhores. Isso significa que o tempo de resposta medido é pior que a média de todos os dispositivos testados (19.8 ms). | ||
| ↔ Tempo de resposta 50% cinza a 80% cinza | ||
| 47 ms ... ascensão ↗ e queda ↘ combinadas | ↗ 23 ms ascensão |  |
| ↘ 24 ms queda | ||
| A tela mostra taxas de resposta lentas em nossos testes e será insatisfatória para os jogadores. Em comparação, todos os dispositivos testados variam de 0.165 (mínimo) a 636 (máximo) ms. » 81 % de todos os dispositivos são melhores. Isso significa que o tempo de resposta medido é pior que a média de todos os dispositivos testados (31 ms). | ||
| Cinebench R11.5 | |
| CPU Multi 64Bit | |
| Média da turma Gaming (29.8 - 76.7, n=9, últimos 2 anos) | |
| Acer Nitro 5 AN515-52-74DR | |
| Média Intel Core i7-8750H (9.54 - 13.5, n=41) | |
| Medion Erazer P6705-MD61131 | |
| HP Pavilion Gaming 15-cx0003ng | |
| HP Pavilion Gaming 15t-cx0000 | |
| Acer Nitro 5 AN515-42-R6V0 | |
| CPU Single 64Bit | |
| Média da turma Gaming (3.3 - 4.16, n=9, últimos 2 anos) | |
| Acer Nitro 5 AN515-52-74DR | |
| HP Pavilion Gaming 15t-cx0000 | |
| HP Pavilion Gaming 15-cx0003ng | |
| Média Intel Core i7-8750H (1.89 - 2, n=40) | |
| Medion Erazer P6705-MD61131 | |
| Acer Nitro 5 AN515-42-R6V0 | |
| Cinebench R10 | |
| Rendering Multiple CPUs 32Bit | |
| Média da turma Gaming (42932 - 102066, n=9, últimos 2 anos) | |
| Média Intel Core i7-8750H (29664 - 35307, n=25) | |
| HP Pavilion Gaming 15-cx0003ng | |
| Rendering Single 32Bit | |
| Média da turma Gaming (7457 - 12575, n=9, últimos 2 anos) | |
| HP Pavilion Gaming 15-cx0003ng | |
| Média Intel Core i7-8750H (6236 - 6645, n=25) | |
| Geekbench 3 | |
| 32 Bit Multi-Core Score | |
| Média Intel Core i7-8750H (20725 - 22665, n=13) | |
| HP Pavilion Gaming 15-cx0003ng | |
| 32 Bit Single-Core Score | |
| Média Intel Core i7-8750H (3734 - 4163, n=13) | |
| HP Pavilion Gaming 15-cx0003ng | |
| Geekbench 4.0 | |
| 64 Bit Multi-Core Score | |
| Média da turma Gaming (40469 - 76142, n=4, últimos 2 anos) | |
| Média Intel Core i7-8750H (17048 - 22006, n=8) | |
| HP Pavilion Gaming 15-cx0003ng | |
| 64 Bit Single-Core Score | |
| Média da turma Gaming (7589 - 9053, n=4, últimos 2 anos) | |
| HP Pavilion Gaming 15-cx0003ng | |
| Média Intel Core i7-8750H (4548 - 4997, n=8) | |
| Geekbench 4.4 | |
| 64 Bit Multi-Core Score | |
| Média da turma Gaming (89200 - 101054, n=3, últimos 2 anos) | |
| Média Intel Core i7-8750H (17709 - 23313, n=17) | |
| HP Pavilion Gaming 15-cx0003ng | |
| 64 Bit Single-Core Score | |
| Média da turma Gaming (9335 - 9775, n=3, últimos 2 anos) | |
| HP Pavilion Gaming 15-cx0003ng | |
| Média Intel Core i7-8750H (4669 - 5146, n=17) | |
| Mozilla Kraken 1.1 - Total | |
| Média Intel Core i7-8750H (695 - 1272, n=50) | |
| HP Pavilion Gaming 15-cx0003ng | |
| Lenovo Legion Y530-15ICH (Microsoft Edge 42.17134.1.0) | |
| Média da turma Gaming (391 - 590, n=100, últimos 2 anos) | |
| Octane V2 - Total Score | |
| Média da turma Gaming (93292 - 139447, n=27, últimos 2 anos) | |
| HP Pavilion Gaming 15-cx0003ng | |
| Lenovo Legion Y530-15ICH (Microsoft Edge 42.17134.1.0) | |
| Média Intel Core i7-8750H (27460 - 44549, n=47) | |
| JetStream 1.1 - 1.1 Total | |
| Média da turma Gaming (549 - 647, n=3, últimos 2 anos) | |
| Lenovo Legion Y530-15ICH (Microsoft Edge 42.17134.1.0) | |
| HP Pavilion Gaming 15-cx0003ng (Edge 44) | |
| Média Intel Core i7-8750H (205 - 299, n=49) | |
* ... menor é melhor
| PCMark 7 Score | 6418 pontos | |
| PCMark 8 Home Score Accelerated v2 | 4259 pontos | |
| PCMark 8 Creative Score Accelerated v2 | 4820 pontos | |
| PCMark 8 Work Score Accelerated v2 | 5249 pontos | |
| PCMark 10 Score | 4732 pontos | |
Ajuda | ||
| PCMark 8 | |
| Home Score Accelerated v2 | |
| Média da turma Gaming (n=1últimos 2 anos) | |
| HP Pavilion Gaming 15t-cx0000 | |
| Acer Nitro 5 AN515-52-74DR | |
| HP Pavilion Gaming 15-cx0003ng | |
| Média Intel Core i7-8750H, NVIDIA GeForce GTX 1050 Ti Mobile (3894 - 4371, n=10) | |
| Lenovo Legion Y530-15ICH | |
| Medion Erazer P6705-MD61131 | |
| Acer Nitro 5 AN515-42-R6V0 | |
| Work Score Accelerated v2 | |
| Acer Nitro 5 AN515-52-74DR | |
| Lenovo Legion Y530-15ICH | |
| Medion Erazer P6705-MD61131 | |
| Média Intel Core i7-8750H, NVIDIA GeForce GTX 1050 Ti Mobile (4973 - 5461, n=10) | |
| HP Pavilion Gaming 15t-cx0000 | |
| HP Pavilion Gaming 15-cx0003ng | |
| Acer Nitro 5 AN515-42-R6V0 | |
| Média da turma Gaming (n=1últimos 2 anos) | |

| HP Pavilion Gaming 15-cx0003ng Intel Optane 16 GB MEMPEK1J016GAH + HGST HTS721010A9E630 1 TB HDD | Acer Nitro 5 AN515-42-R6V0 SK Hynix HFS128G39TND | Acer Nitro 5 AN515-52-74DR Intel SSD 600p SSDPEKKW512G7 | HP Pavilion Gaming 15t-cx0000 Samsung SSD PM981 MZVLB512HAJQ | Medion Erazer P6705-MD61131 Samsung SSD PM981 MZVLB256HAHQ | Lenovo Legion Y530-15ICH Toshiba KBG30ZMT128G | Média Intel Optane 16 GB MEMPEK1J016GAH + HGST HTS721010A9E630 1 TB HDD | |
|---|---|---|---|---|---|---|---|
| CrystalDiskMark 5.2 / 6 | -25% | 80% | 298% | 266% | 9% | 0% | |
| Write 4K (MB/s) | 59.2 | 73 23% | 78.8 33% | 129.5 119% | 107 81% | 71.8 21% | 59.2 ? 0% |
| Read 4K (MB/s) | 91.3 | 29.16 -68% | 29.51 -68% | 44.61 -51% | 39.91 -56% | 41.03 -55% | 91.3 ? 0% |
| Write Seq (MB/s) | 158.3 | 135.9 -14% | 581 267% | 1268 701% | 1439 809% | 349 120% | 158.3 ? 0% |
| Read Seq (MB/s) | 880 | 498.5 -43% | 934 6% | 992 13% | 2011 129% | 736 -16% | 880 ? 0% |
| Write 4K Q32T1 (MB/s) | 161.8 | 135.4 -16% | 280.8 74% | 535 231% | 282.1 74% | 105.3 -35% | 161.8 ? 0% |
| Read 4K Q32T1 (MB/s) | 286.5 | 215.6 -25% | 335.6 17% | 601 110% | 326.6 14% | 308 8% | 287 ? 0% |
| Write Seq Q32T1 (MB/s) | 159.8 | 135.7 -15% | 571 257% | 1938 1113% | 1441 802% | 151.4 -5% | 159.8 ? 0% |
| Read Seq Q32T1 (MB/s) | 929 | 512 -45% | 1389 50% | 2306 148% | 3516 278% | 1262 36% | 929 ? 0% |
| AS SSD | -17% | 217% | 649% | 310% | 21% | 0% | |
| Seq Read (MB/s) | 854 | 470.8 -45% | 1321 55% | 1235 45% | 2724 219% | 1231 44% | 854 ? 0% |
| Seq Write (MB/s) | 147 | 126.8 -14% | 554 277% | 1829 1144% | 1365 829% | 131.6 -10% | 147 ? 0% |
| 4K Read (MB/s) | 105.1 | 23.64 -78% | 32.38 -69% | 35.03 -67% | 46.14 -56% | 38.71 -63% | 105.1 ? 0% |
| 4K Write (MB/s) | 59.5 | 54.5 -8% | 94.5 59% | 95.9 61% | 102.6 72% | 35.74 -40% | 59.5 ? 0% |
| 4K-64 Read (MB/s) | 42.09 | 203.1 383% | 505 1100% | 1160 2656% | 567 1247% | 335.3 697% | 42.1 ? 0% |
| 4K-64 Write (MB/s) | 137.3 | 127.1 -7% | 511 272% | 1808 1217% | 459.8 235% | 78.9 -43% | 137.3 ? 0% |
| Access Time Read * (ms) | 14.99 | 0.121 99% | 0.12 99% | 0.051 100% | 0.08 99% | 0.626 96% | 15 ? -0% |
| Access Time Write * (ms) | 0.043 | 0.269 -526% | 0.039 9% | 0.038 12% | 0.037 14% | 0.287 -567% | 0.043 ? -0% |
| Score Read (Points) | 233 | 274 18% | 670 188% | 1319 466% | 886 280% | 497 113% | 233 ? 0% |
| Score Write (Points) | 211 | 194 -8% | 661 213% | 2087 889% | 699 231% | 128 -39% | 211 ? 0% |
| Score Total (Points) | 577 | 600 4% | 1643 185% | 4113 613% | 1983 244% | 838 45% | 577 ? 0% |
| Copy ISO MB/s (MB/s) | 110.1 | 110.1 ? 0% | |||||
| Copy Program MB/s (MB/s) | 94.1 | 94.1 ? 0% | |||||
| Copy Game MB/s (MB/s) | 81.7 | 81.7 ? 0% | |||||
| Média Total (Programa/Configurações) | -21% /
-20% | 149% /
159% | 474% /
501% | 288% /
292% | 15% /
16% | 0% /
0% |
* ... menor é melhor
| 3DMark 06 Standard Score | 33957 pontos | |
| 3DMark 11 Performance | 8501 pontos | |
| 3DMark Ice Storm Standard Score | 87964 pontos | |
| 3DMark Cloud Gate Standard Score | 25570 pontos | |
| 3DMark Fire Strike Score | 6286 pontos | |
| 3DMark Time Spy Score | 2196 pontos | |
Ajuda | ||
| 3DMark 11 - 1280x720 Performance GPU | |
| Média da turma Gaming (21841 - 80022, n=104, últimos 2 anos) | |
| HP Pavilion Gaming 15t-cx0000 | |
| Lenovo Legion Y530-15ICH | |
| Média NVIDIA GeForce GTX 1050 Ti Mobile (8304 - 10402, n=36) | |
| Acer Nitro 5 AN515-52-74DR | |
| Medion Erazer P6705-MD61131 | |
| Acer Nitro 5 AN515-42-R6V0 | |
| HP Pavilion Gaming 15-cx0003ng | |
| 3DMark | |
| 1280x720 Cloud Gate Standard Graphics | |
| Média da turma Gaming (86886 - 223650, n=60, últimos 2 anos) | |
| HP Pavilion Gaming 15t-cx0000 | |
| Acer Nitro 5 AN515-52-74DR | |
| Lenovo Legion Y530-15ICH | |
| Média NVIDIA GeForce GTX 1050 Ti Mobile (43721 - 53978, n=37) | |
| Medion Erazer P6705-MD61131 | |
| HP Pavilion Gaming 15-cx0003ng | |
| Acer Nitro 5 AN515-42-R6V0 | |
| 1920x1080 Fire Strike Graphics | |
| Média da turma Gaming (12242 - 62849, n=115, últimos 2 anos) | |
| HP Pavilion Gaming 15t-cx0000 | |
| Média NVIDIA GeForce GTX 1050 Ti Mobile (6792 - 8376, n=38) | |
| Lenovo Legion Y530-15ICH | |
| Acer Nitro 5 AN515-52-74DR | |
| Medion Erazer P6705-MD61131 | |
| HP Pavilion Gaming 15-cx0003ng | |
| Acer Nitro 5 AN515-42-R6V0 | |
| 2560x1440 Time Spy Graphics | |
| Média da turma Gaming (5012 - 26212, n=115, últimos 2 anos) | |
| Média NVIDIA GeForce GTX 1050 Ti Mobile (1990 - 2536, n=16) | |
| HP Pavilion Gaming 15-cx0003ng | |
| baixo | média | alto | ultra | |
|---|---|---|---|---|
| Tomb Raider (2013) | 326.3 | 237.1 | 174.7 | 80 |
| BioShock Infinite (2013) | 259.7 | 200.5 | 180.5 | 71.9 |
| The Witcher 3 (2015) | 116 | 69.7 | 40 | 23.1 |
| Rainbow Six Siege (2015) | 95.9 | 92 | 74.9 | 69.3 |
| Call of Duty Black Ops 4 (2018) | 107.8 | 47.6 | 47.5 | 44 |
| Hitman 2 (2018) | 60.8 | 43.1 | 37.8 | 33.4 |
| Fallout 76 (2018) | 60 | 50.3 | 44.1 | 43.1 |
| Battlefield V (2018) | 65.8 | 53.2 | 44.5 | 39.5 |
| Farming Simulator 19 (2018) | 163.1 | 124.8 | 79.1 | 60.1 |
| Darksiders III (2018) | 116.6 | 60.2 | 44.7 | 38.9 |
| Just Cause 4 (2018) | 65.6 | 40.9 | 34.6 | 33.2 |
| BioShock Infinite - 1920x1080 Ultra Preset, DX11 (DDOF) | |
| HP Pavilion Gaming 15t-cx0000 | |
| Média NVIDIA GeForce GTX 1050 Ti Mobile (61 - 97, n=23) | |
| HP Pavilion Gaming 15-cx0003ng | |
| Lenovo Legion Y530-15ICH | |
| The Witcher 3 - 1920x1080 High Graphics & Postprocessing (Nvidia HairWorks Off) | |
| Média da turma Gaming (341 - 404, n=2, últimos 2 anos) | |
| HP Pavilion Gaming 15t-cx0000 | |
| MSI GE72 7RE-046 | |
| Acer Nitro 5 AN515-52-74DR | |
| Média NVIDIA GeForce GTX 1050 Ti Mobile (21.3 - 51.9, n=26) | |
| Medion Erazer P6705-MD61131 | |
| HP Pavilion Gaming 15-cx0003ng | |
| Acer Nitro 5 AN515-42-R6V0 | |
| Farming Simulator 19 - 1920x1080 Very High Preset | |
| HP Pavilion Gaming 15-cx0003ng | |
| Média NVIDIA GeForce GTX 1050 Ti Mobile (59.3 - 60.1, n=2) | |
| MSI GE72 7RE | |
| Acer Nitro 5 AN515-42-R6V0 | |
| Just Cause 4 - 1920x1080 Medium / Off AF:4x | |
| MSI GE72 7RE | |
| Média NVIDIA GeForce GTX 1050 Ti Mobile (40.9 - 54, n=3) | |
| HP Pavilion Gaming 15-cx0003ng | |
| Call of Duty Black Ops 4 - 1920x1080 Very High / On | |
| HP Pavilion Gaming 15-cx0003ng | |
| Média NVIDIA GeForce GTX 1050 Ti Mobile (35.5 - 47.7, n=4) | |
| Medion Erazer P6705-MD61131 | |
| MSI GE72 7RE-046 | |
| Acer Nitro 5 AN515-42-R6V0 | |
Barulho
| Ocioso |
| 30.6 / 30.6 / 33.2 dB |
| DVD |
| 0 / dB |
| Carga |
| 42.8 / 43 dB |
 | ||
30 dB silencioso 40 dB(A) audível 50 dB(A) ruidosamente alto |
||
min: | ||
| HP Pavilion Gaming 15-cx0003ng i7-8750H, GeForce GTX 1050 Ti Mobile | Acer Nitro 5 AN515-42-R6V0 R7 2700U, Radeon RX 560X (Laptop) | Acer Nitro 5 AN515-52-74DR i7-8750H, GeForce GTX 1050 Ti Mobile | HP Pavilion Gaming 15t-cx0000 i7-8750H, GeForce GTX 1060 Max-Q | Medion Erazer P6705-MD61131 i7-8750H, GeForce GTX 1050 Ti Mobile | Lenovo Legion Y530-15ICH i5-8300H, GeForce GTX 1050 Ti Mobile | Média NVIDIA GeForce GTX 1050 Ti Mobile | Média da turma Gaming | |
|---|---|---|---|---|---|---|---|---|
| Noise | 2% | -3% | -2% | -7% | 7% | -1% | 5% | |
| desligado / ambiente * (dB) | 30.6 | 29 5% | 30 2% | 28.3 8% | 29 5% | 28 8% | 29.4 ? 4% | 24.1 ? 21% |
| Idle Minimum * (dB) | 30.6 | 29 5% | 30 2% | 32.2 -5% | 29 5% | 28 8% | 30.7 ? -0% | 26 ? 15% |
| Idle Average * (dB) | 30.6 | 31 -1% | 32 -5% | 32.4 -6% | 34 -11% | 28 8% | 31.7 ? -4% | 27.4 ? 10% |
| Idle Maximum * (dB) | 33.2 | 32 4% | 33 1% | 32.4 2% | 43 -30% | 28.5 14% | 33.8 ? -2% | 30.1 ? 9% |
| Load Average * (dB) | 42.8 | 36 16% | 42 2% | 40.2 6% | 44 -3% | 34.9 18% | 41.3 ? 4% | 43.6 ? -2% |
| Witcher 3 ultra * (dB) | 42.1 | 44 -5% | 46 -9% | 45 -7% | 44 -5% | 40 5% | ||
| Load Maximum * (dB) | 43 | 46 -7% | 49 -14% | 47.2 -10% | 48 -12% | 49.6 -15% | 47.2 ? -10% | 54.2 ? -26% |
* ... menor é melhor
(±) A temperatura máxima no lado superior é 44.1 °C / 111 F, em comparação com a média de 40.4 °C / 105 F , variando de 21.2 a 68.8 °C para a classe Gaming.
(-) A parte inferior aquece até um máximo de 53.8 °C / 129 F, em comparação com a média de 43.2 °C / 110 F
(+) Em uso inativo, a temperatura média para o lado superior é 24.1 °C / 75 F, em comparação com a média do dispositivo de 33.9 °C / ### class_avg_f### F.
(±) Jogando The Witcher 3, a temperatura média para o lado superior é 35.2 °C / 95 F, em comparação com a média do dispositivo de 33.9 °C / ## #class_avg_f### F.
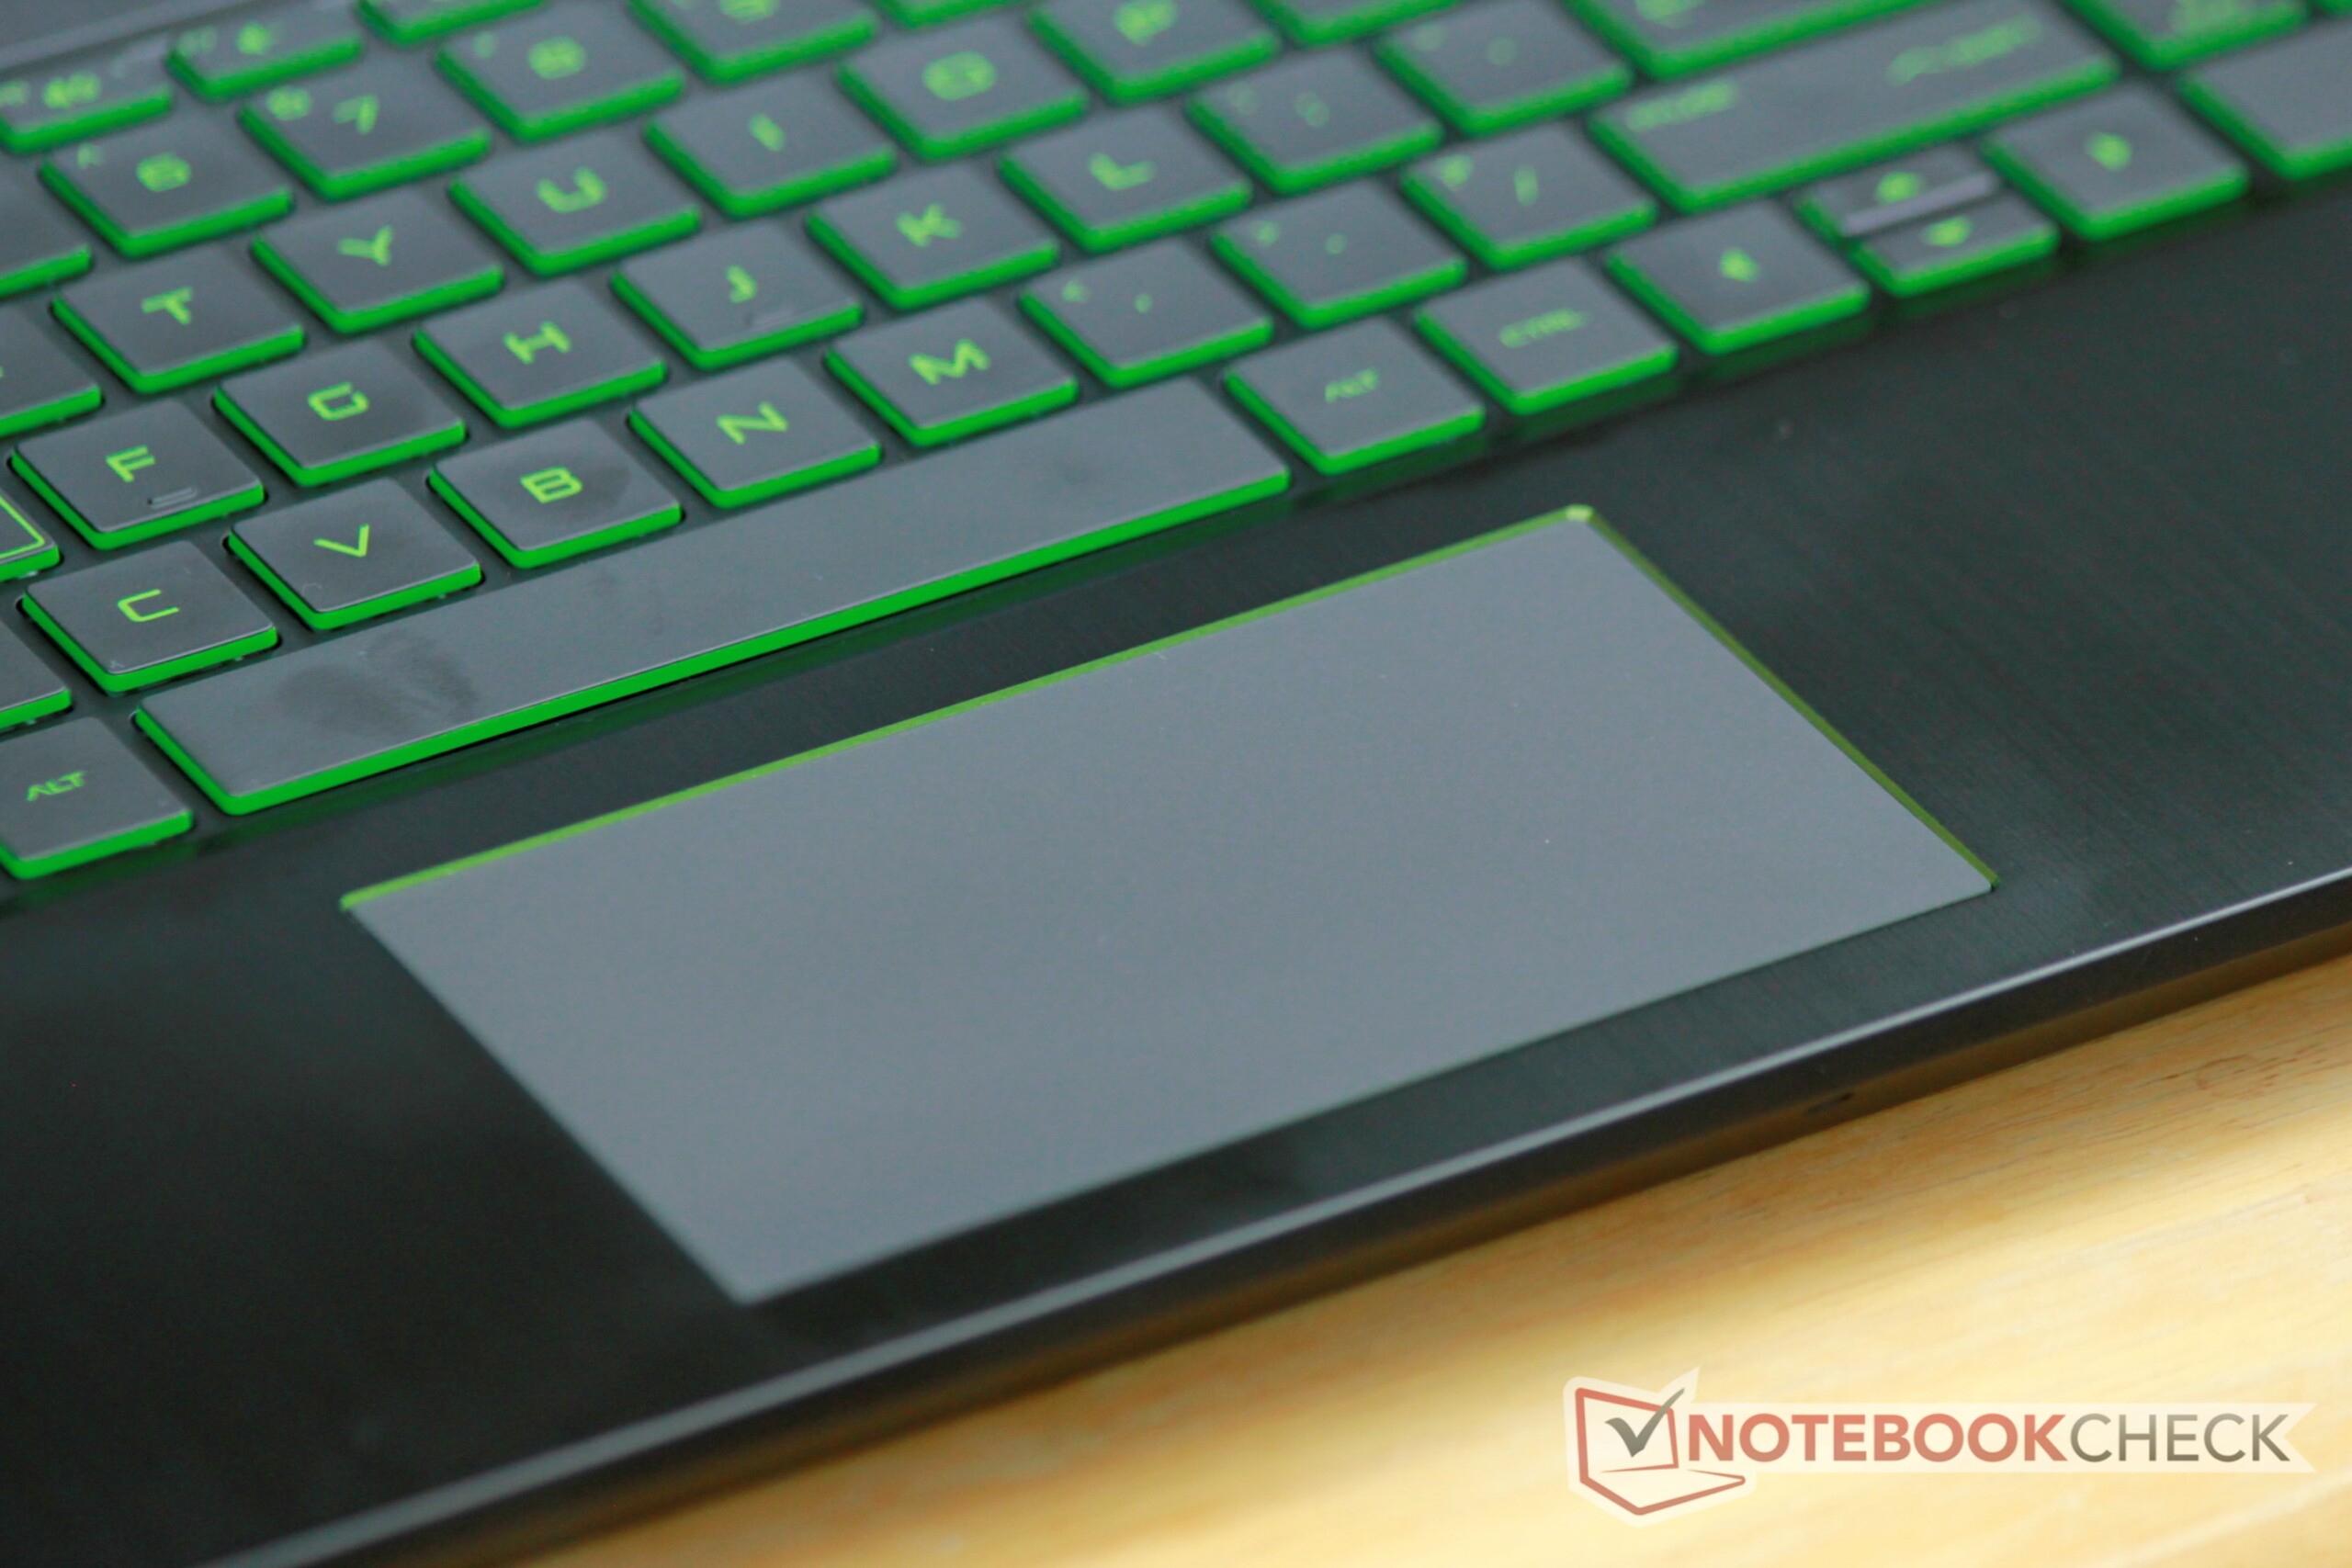
(+) Os apoios para as mãos e o touchpad são mais frios que a temperatura da pele, com um máximo de 30.6 °C / 87.1 F e, portanto, são frios ao toque.
(±) A temperatura média da área do apoio para as mãos de dispositivos semelhantes foi 28.8 °C / 83.8 F (-1.8 °C / -3.3 F).
| HP Pavilion Gaming 15-cx0003ng i7-8750H, GeForce GTX 1050 Ti Mobile | Acer Nitro 5 AN515-42-R6V0 R7 2700U, Radeon RX 560X (Laptop) | Acer Nitro 5 AN515-52-74DR i7-8750H, GeForce GTX 1050 Ti Mobile | HP Pavilion Gaming 15t-cx0000 i7-8750H, GeForce GTX 1060 Max-Q | Medion Erazer P6705-MD61131 i7-8750H, GeForce GTX 1050 Ti Mobile | Lenovo Legion Y530-15ICH i5-8300H, GeForce GTX 1050 Ti Mobile | Média NVIDIA GeForce GTX 1050 Ti Mobile | Média da turma Gaming | |
|---|---|---|---|---|---|---|---|---|
| Heat | -4% | -22% | -11% | 5% | -18% | -5% | -11% | |
| Maximum Upper Side * (°C) | 44.1 | 47 -7% | 52 -18% | 46 -4% | 45 -2% | 42.8 3% | 46.5 ? -5% | 45.2 ? -2% |
| Maximum Bottom * (°C) | 53.8 | 44 18% | 55 -2% | 52 3% | 43 20% | 52 3% | 48.4 ? 10% | 48.1 ? 11% |
| Idle Upper Side * (°C) | 24.6 | 30 -22% | 36 -46% | 29 -18% | 25 -2% | 32 -30% | 28.6 ? -16% | 31 ? -26% |
| Idle Bottom * (°C) | 26.7 | 28 -5% | 32 -20% | 33 -24% | 26 3% | 39.4 -48% | 28.9 ? -8% | 34.2 ? -28% |
* ... menor é melhor
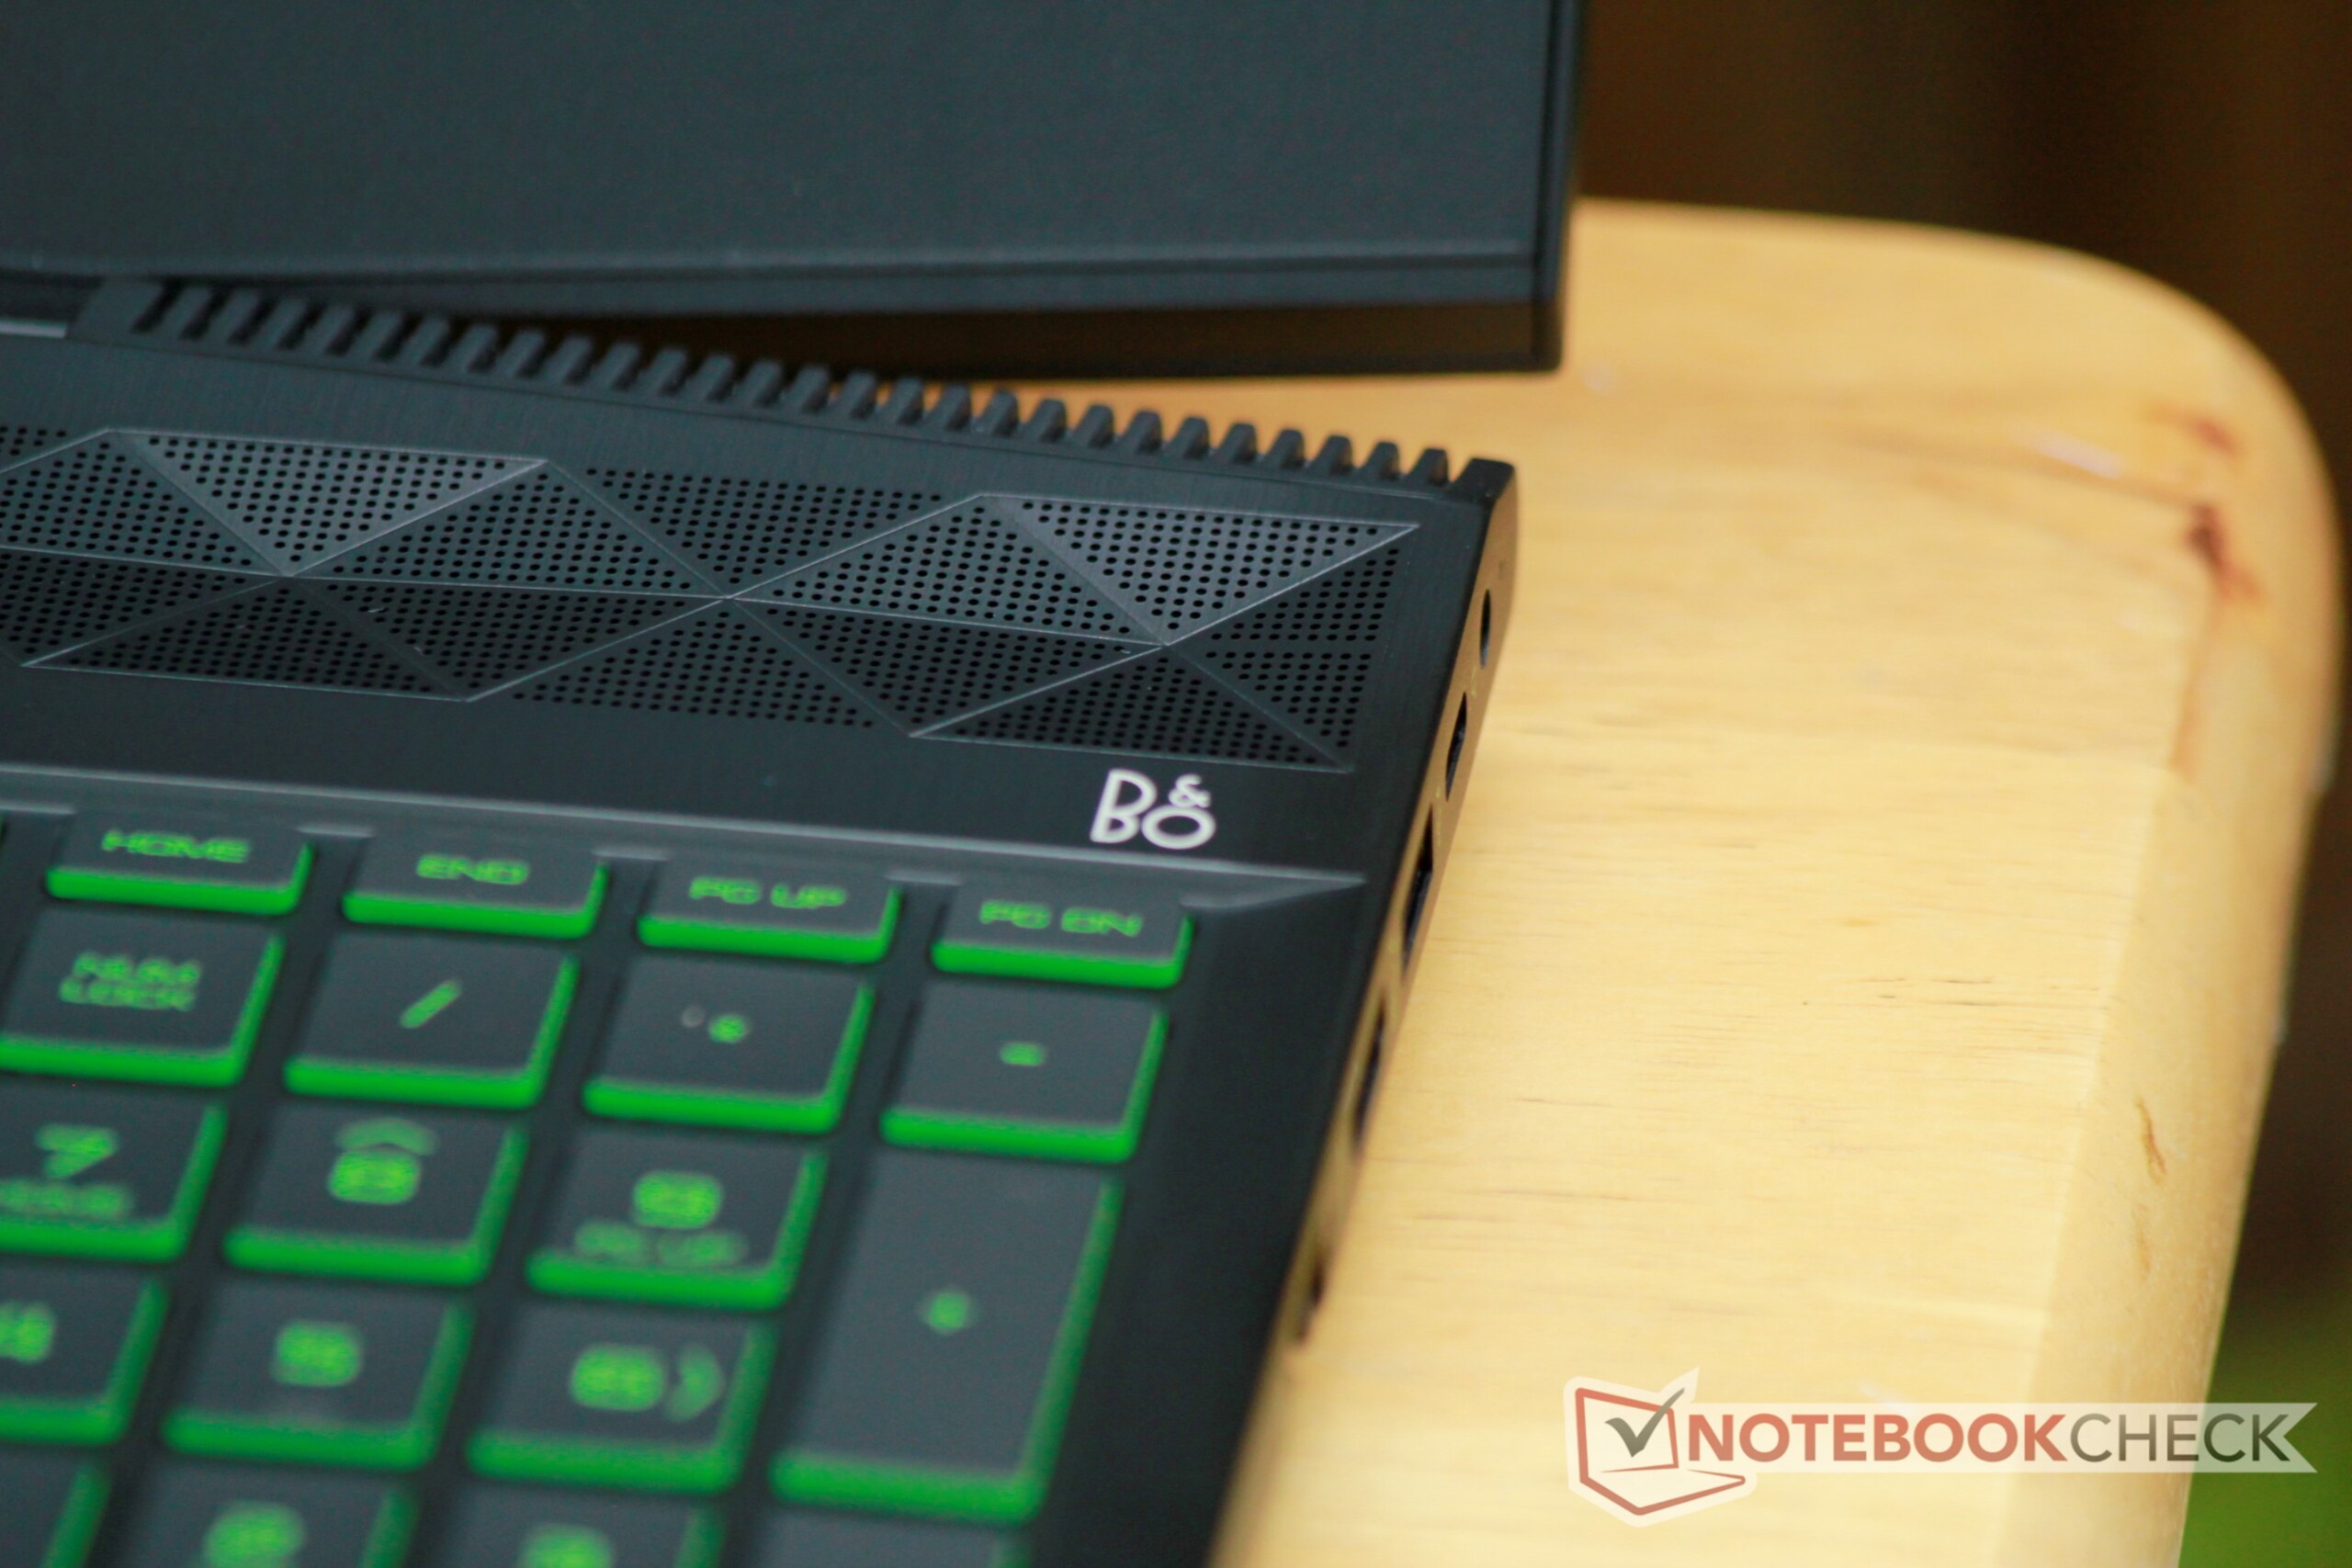
HP Pavilion Gaming 15-cx0003ng análise de áudio
(-) | alto-falantes não muito altos (###valor### dB)
Graves 100 - 315Hz
(-) | quase nenhum baixo - em média 25.4% menor que a mediana
(±) | a linearidade dos graves é média (10.3% delta para a frequência anterior)
Médios 400 - 2.000 Hz
(+) | médios equilibrados - apenas 2.3% longe da mediana
(+) | médios são lineares (6.9% delta para frequência anterior)
Altos 2 - 16 kHz
(+) | agudos equilibrados - apenas 1.8% longe da mediana
(+) | os máximos são lineares (4.7% delta da frequência anterior)
Geral 100 - 16.000 Hz
(±) | a linearidade do som geral é média (21.1% diferença em relação à mediana)
Comparado com a mesma classe
» 76% de todos os dispositivos testados nesta classe foram melhores, 4% semelhantes, 20% piores
» O melhor teve um delta de 6%, a média foi 18%, o pior foi 132%
Comparado com todos os dispositivos testados
» 58% de todos os dispositivos testados foram melhores, 7% semelhantes, 34% piores
» O melhor teve um delta de 4%, a média foi 23%, o pior foi 134%
Apple MacBook 12 (Early 2016) 1.1 GHz análise de áudio
(+) | os alto-falantes podem tocar relativamente alto (###valor### dB)
Graves 100 - 315Hz
(±) | graves reduzidos - em média 11.3% menor que a mediana
(±) | a linearidade dos graves é média (14.2% delta para a frequência anterior)
Médios 400 - 2.000 Hz
(+) | médios equilibrados - apenas 2.4% longe da mediana
(+) | médios são lineares (5.5% delta para frequência anterior)
Altos 2 - 16 kHz
(+) | agudos equilibrados - apenas 2% longe da mediana
(+) | os máximos são lineares (4.5% delta da frequência anterior)
Geral 100 - 16.000 Hz
(+) | o som geral é linear (10.2% diferença em relação à mediana)
Comparado com a mesma classe
» 7% de todos os dispositivos testados nesta classe foram melhores, 2% semelhantes, 90% piores
» O melhor teve um delta de 5%, a média foi 18%, o pior foi 53%
Comparado com todos os dispositivos testados
» 5% de todos os dispositivos testados foram melhores, 1% semelhantes, 94% piores
» O melhor teve um delta de 4%, a média foi 23%, o pior foi 134%
| desligado | |
| Ocioso | |
| Carga |
|
Key:
min: | |
| HP Pavilion Gaming 15-cx0003ng i7-8750H, GeForce GTX 1050 Ti Mobile | Acer Nitro 5 AN515-42-R6V0 R7 2700U, Radeon RX 560X (Laptop) | Acer Nitro 5 AN515-52-74DR i7-8750H, GeForce GTX 1050 Ti Mobile | HP Pavilion Gaming 15t-cx0000 i7-8750H, GeForce GTX 1060 Max-Q | Medion Erazer P6705-MD61131 i7-8750H, GeForce GTX 1050 Ti Mobile | Lenovo Legion Y530-15ICH i5-8300H, GeForce GTX 1050 Ti Mobile | Média NVIDIA GeForce GTX 1050 Ti Mobile | Média da turma Gaming | |
|---|---|---|---|---|---|---|---|---|
| Power Consumption | -14% | 5% | -10% | 12% | -4% | -19% | -93% | |
| Idle Minimum * (Watt) | 5.5 | 7 -27% | 5 9% | 6 -9% | 4 27% | 4.5 18% | 7.92 ? -44% | 13 ? -136% |
| Idle Average * (Watt) | 8.5 | 10 -18% | 7 18% | 11.2 -32% | 7 18% | 10 -18% | 11.9 ? -40% | 19 ? -124% |
| Idle Maximum * (Watt) | 11.9 | 18 -51% | 11 8% | 13.3 -12% | 11 8% | 13.8 -16% | 15.4 ? -29% | 24.6 ? -107% |
| Load Average * (Watt) | 94 | 79 16% | 91 3% | 89.2 5% | 72 23% | 92.5 2% | 85.1 ? 9% | 110.7 ? -18% |
| Witcher 3 ultra * (Watt) | 86 | 98 -14% | 97 -13% | 101.9 -18% | 79 8% | 108.1 -26% | ||
| Load Maximum * (Watt) | 144 | 128 11% | 137 5% | 134.5 7% | 158 -10% | 123.2 14% | 130.5 ? 9% | 259 ? -80% |
* ... menor é melhor
| HP Pavilion Gaming 15-cx0003ng i7-8750H, GeForce GTX 1050 Ti Mobile, 52.5 Wh | Acer Nitro 5 AN515-42-R6V0 R7 2700U, Radeon RX 560X (Laptop), 48 Wh | Acer Nitro 5 AN515-52-74DR i7-8750H, GeForce GTX 1050 Ti Mobile, 48 Wh | HP Pavilion Gaming 15t-cx0000 i7-8750H, GeForce GTX 1060 Max-Q, 70 Wh | Medion Erazer P6705-MD61131 i7-8750H, GeForce GTX 1050 Ti Mobile, 62 Wh | Lenovo Legion Y530-15ICH i5-8300H, GeForce GTX 1050 Ti Mobile, 52.5 Wh | Média da turma Gaming | |
|---|---|---|---|---|---|---|---|
| Duração da bateria | 8% | 27% | 2% | 29% | -23% | 25% | |
| Reader / Idle (h) | 10.8 | 12.5 16% | 8 -26% | 8.9 -18% | 8.27 ? -23% | ||
| H.264 (h) | 4.6 | 7.1 54% | 8.32 ? 81% | ||||
| WiFi v1.3 (h) | 5.3 | 5.7 8% | 7 32% | 6.3 19% | 6.7 26% | 4.1 -23% | 7.11 ? 34% |
| Load (h) | 1.4 | 1.5 7% | 1.6 14% | 2.5 79% | 1.502 ? 7% |
Pro
Contra
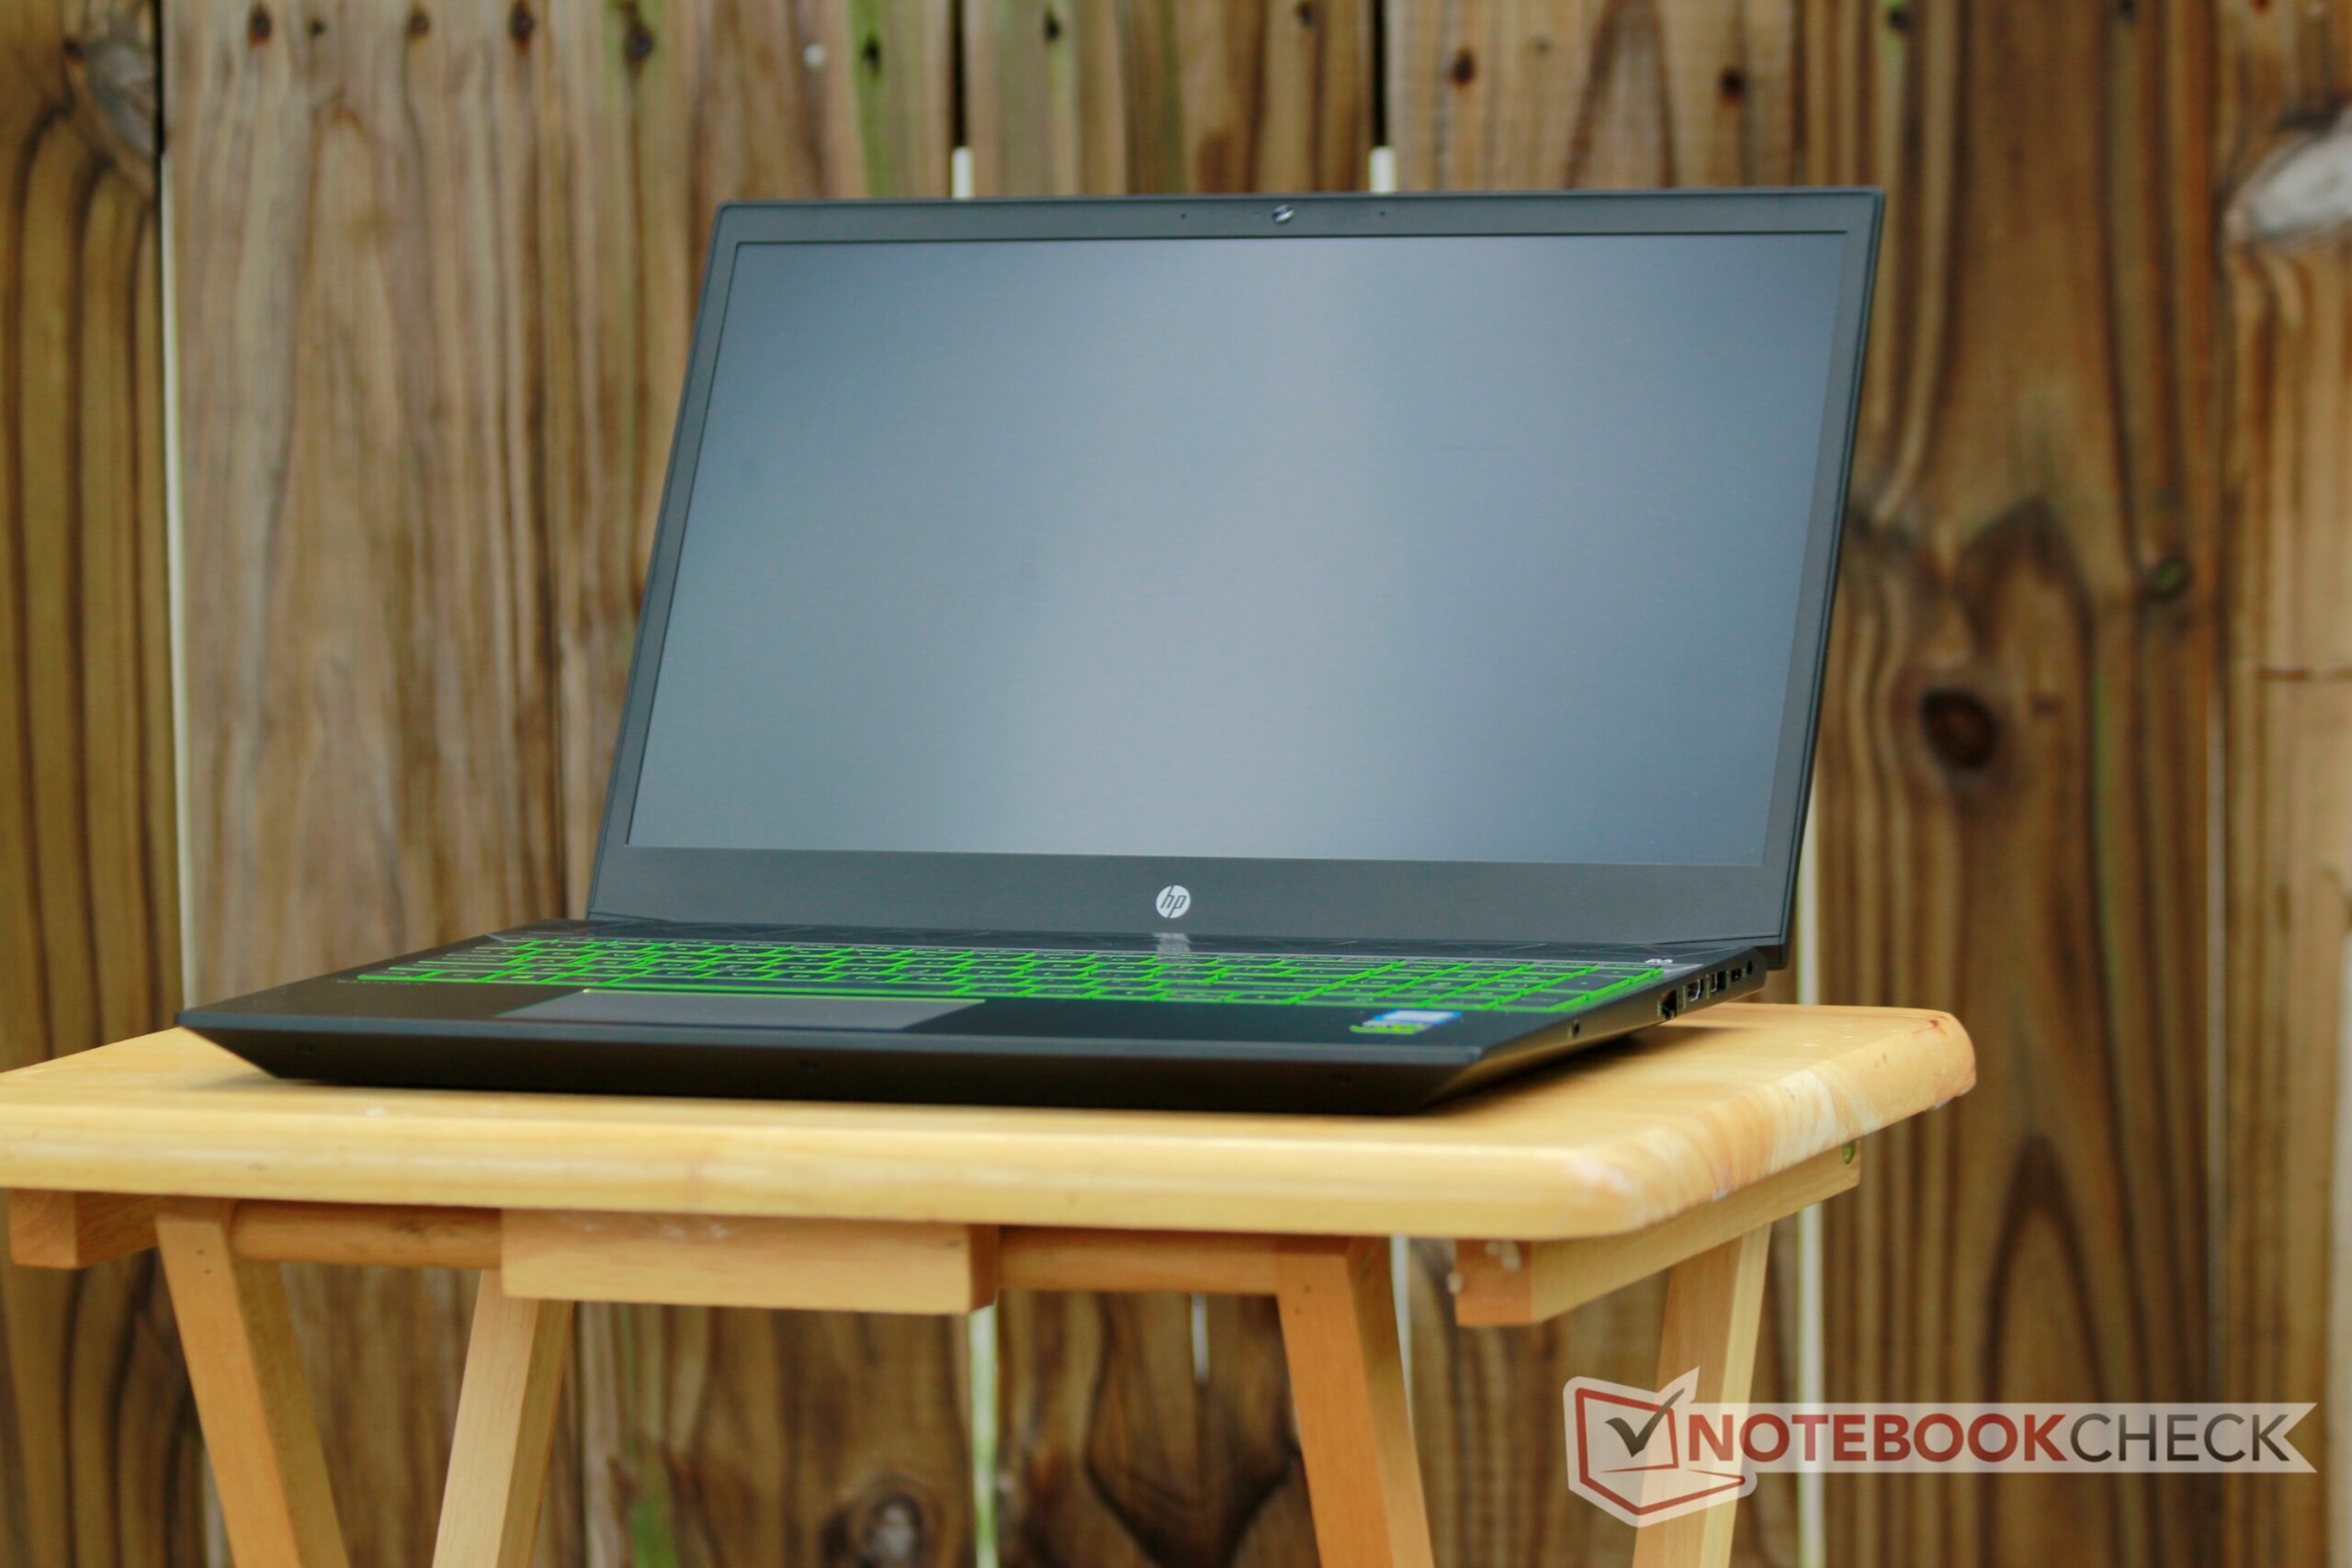
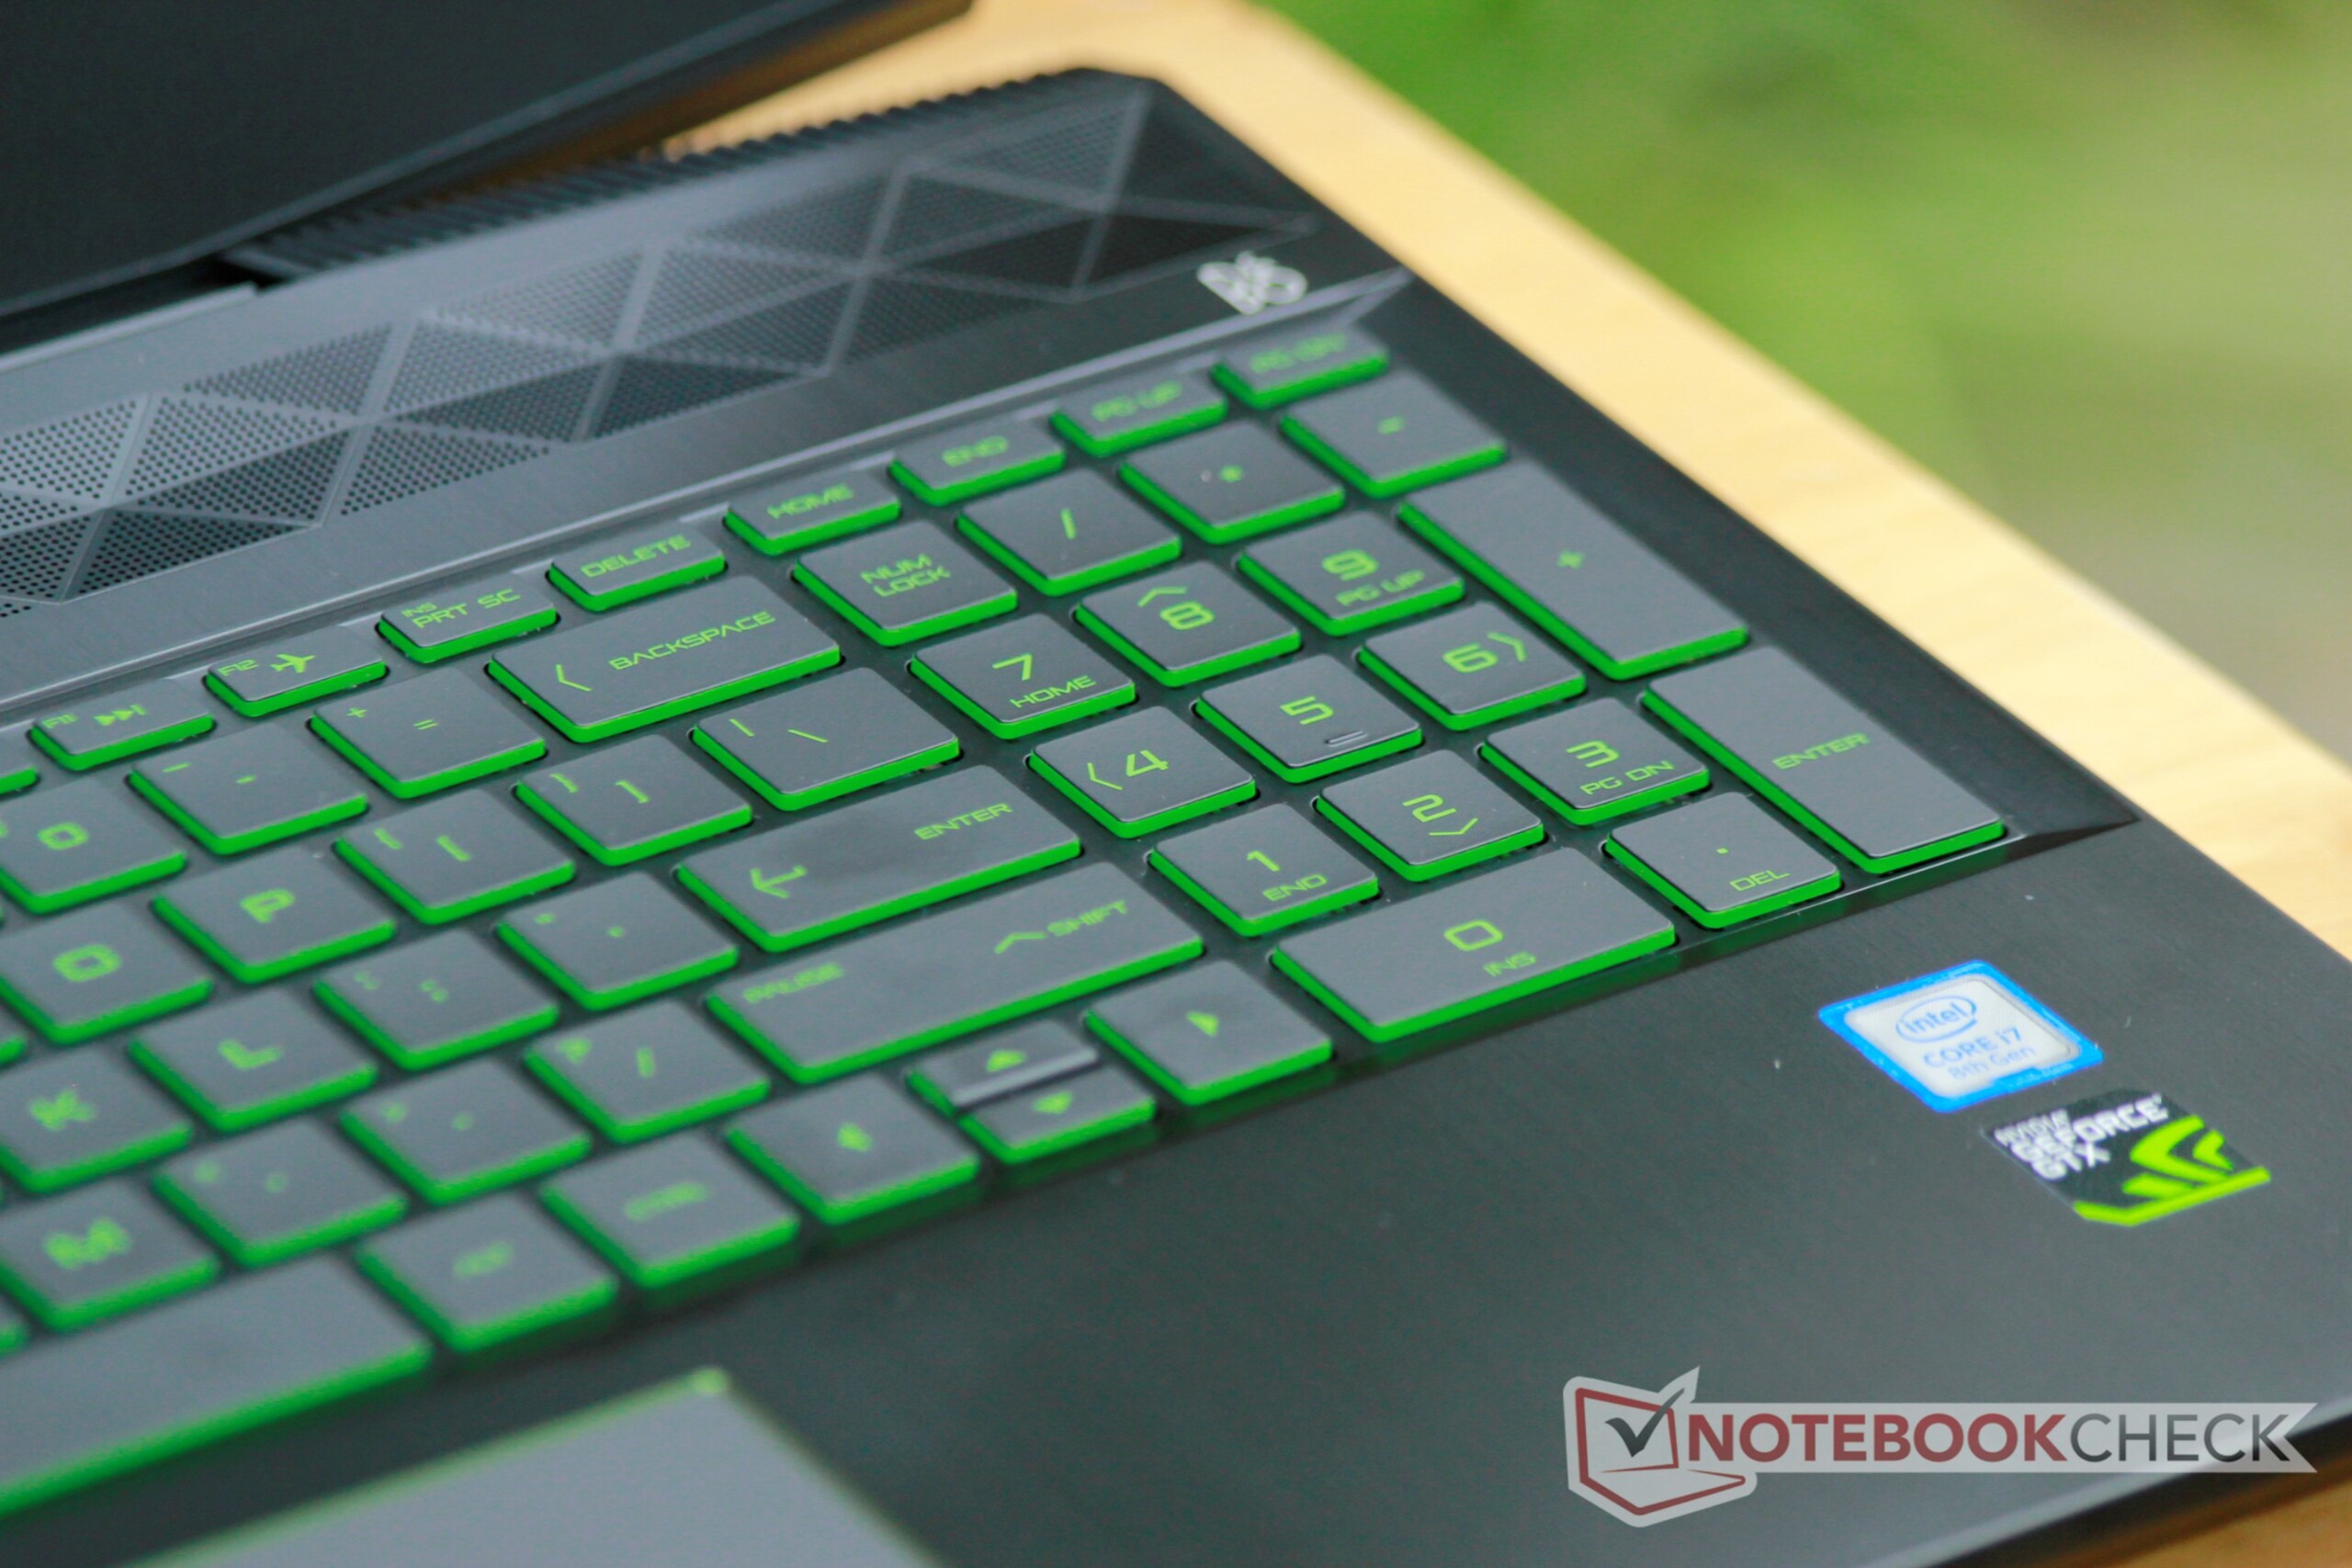
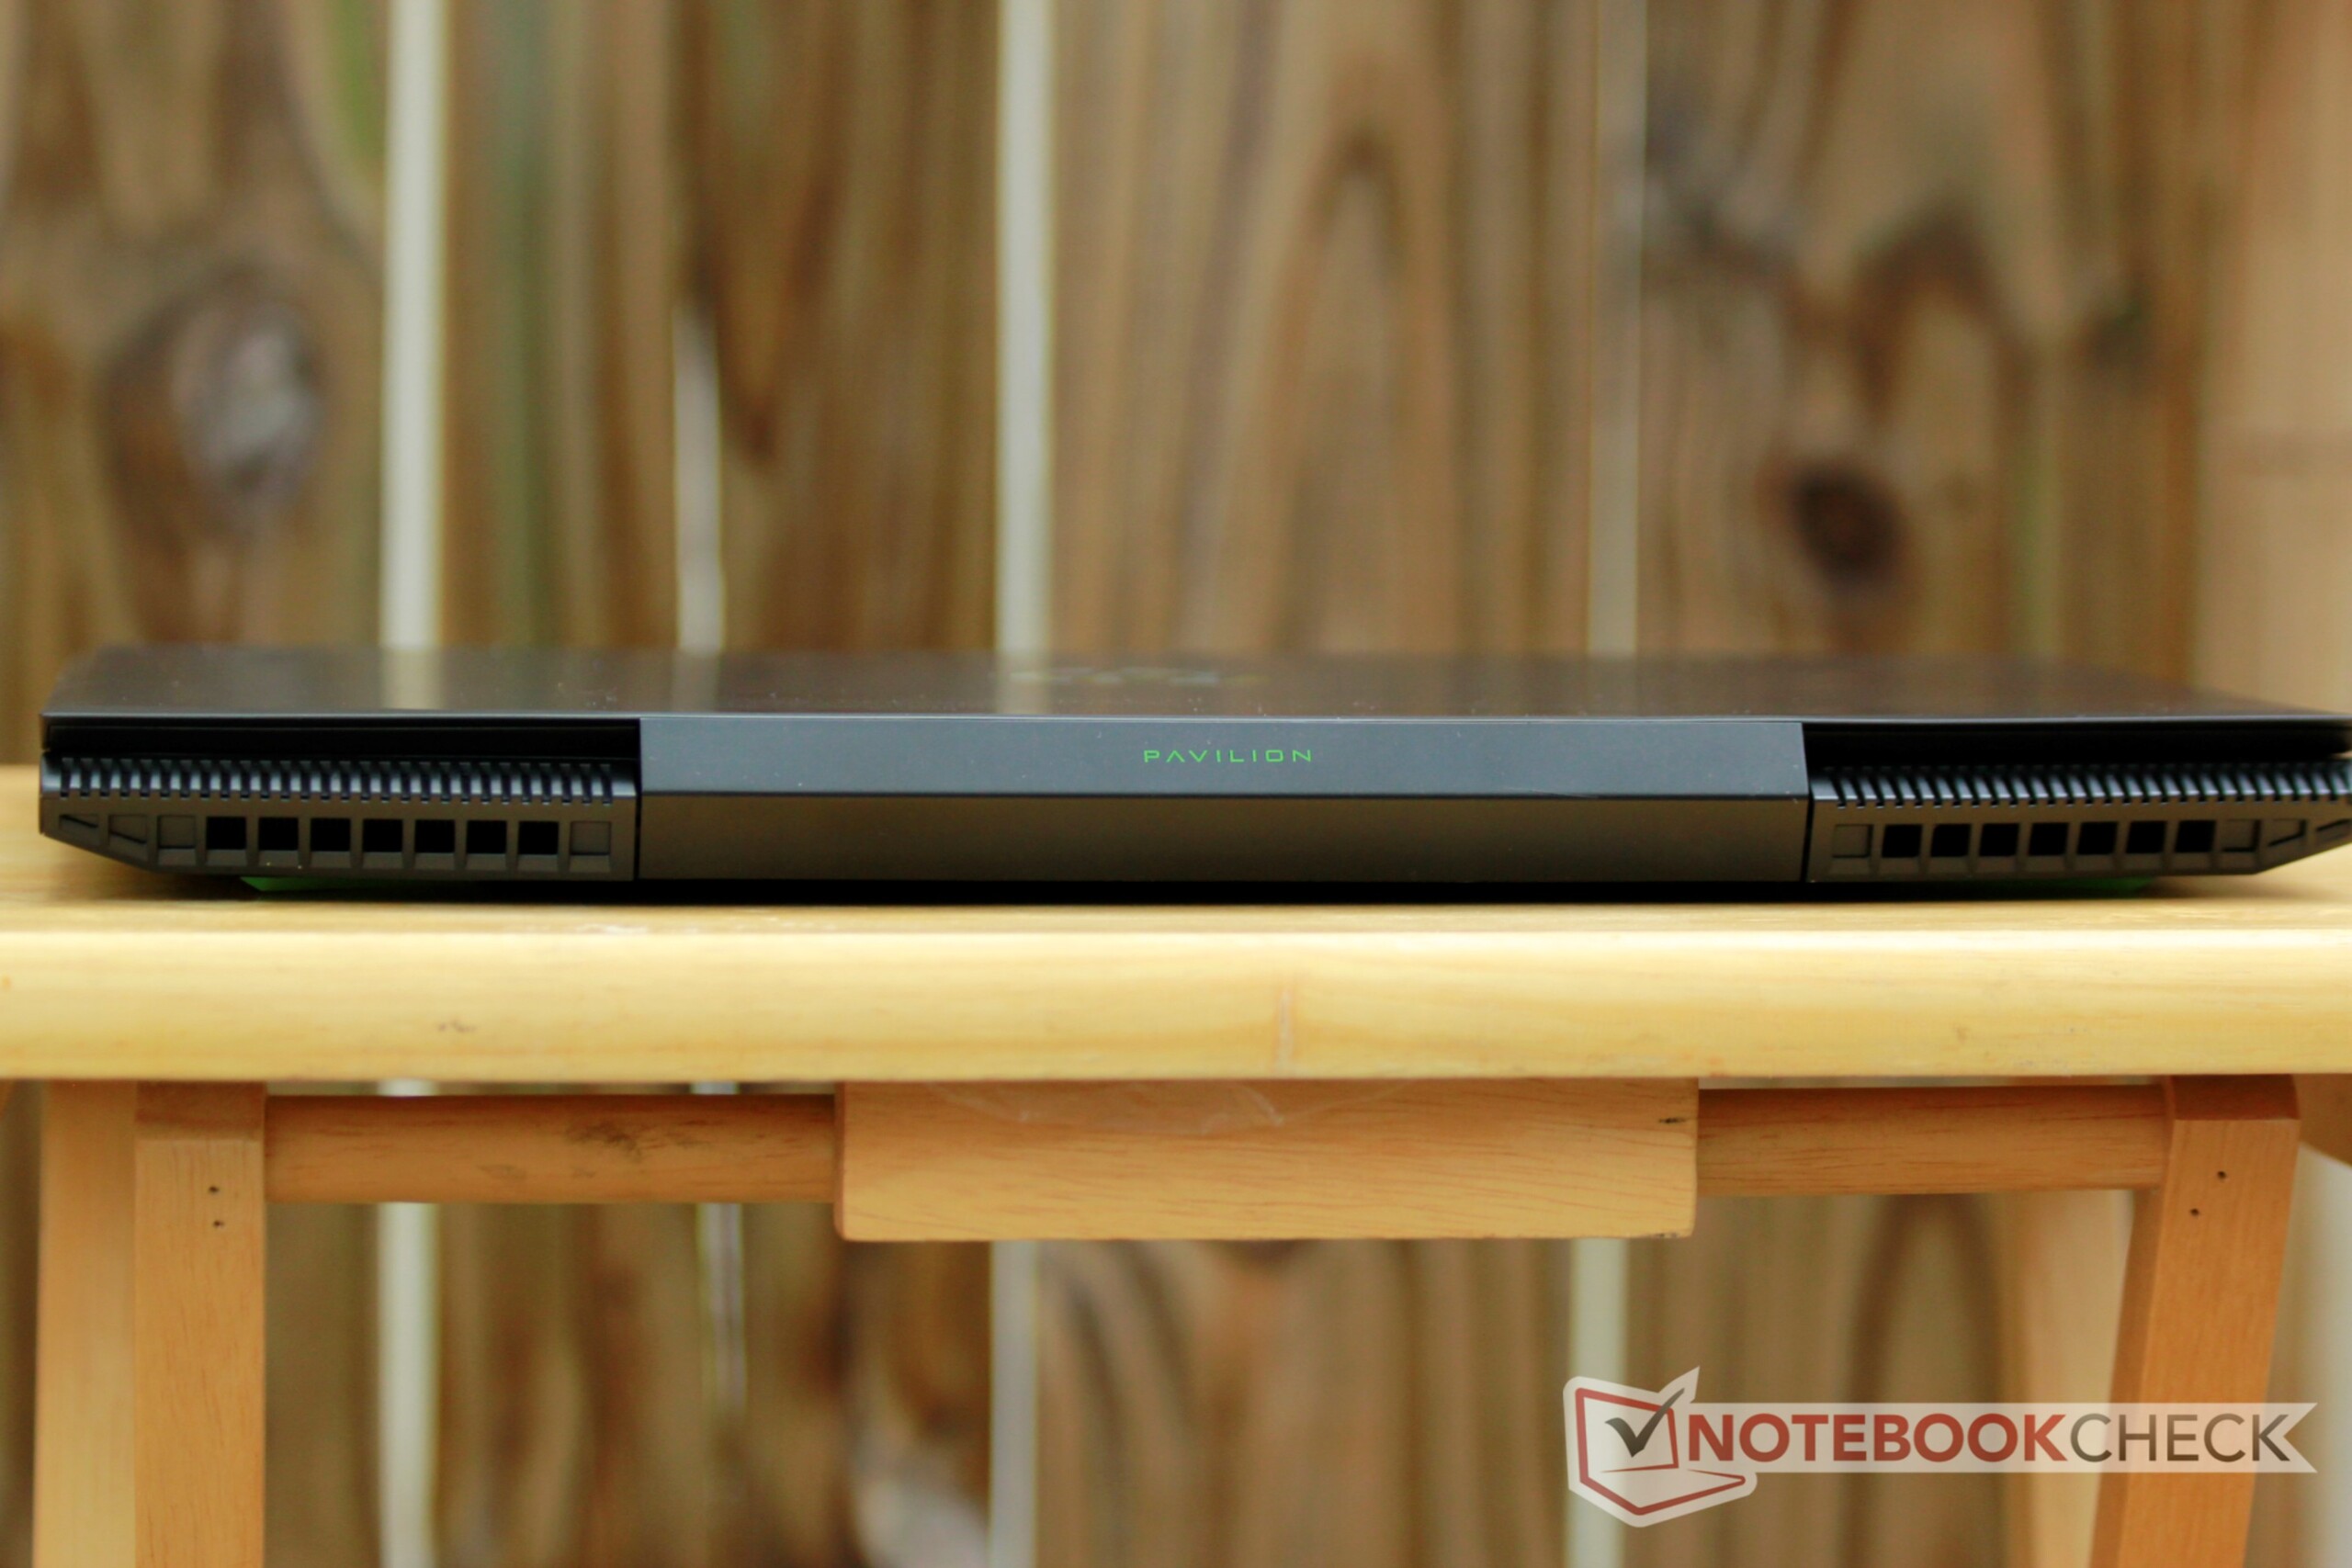
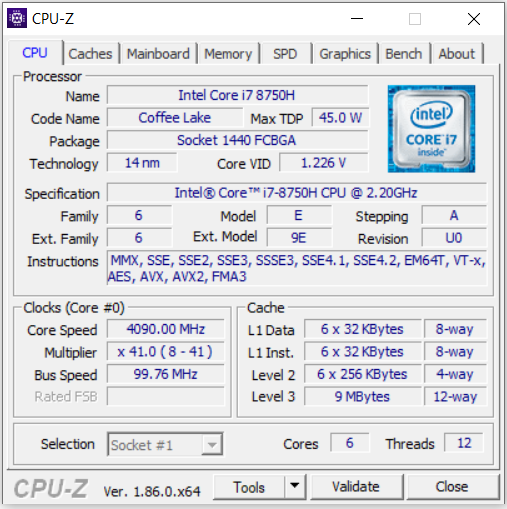
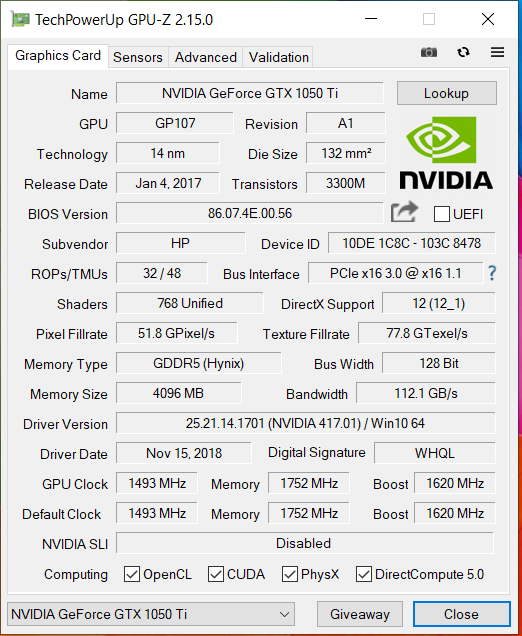
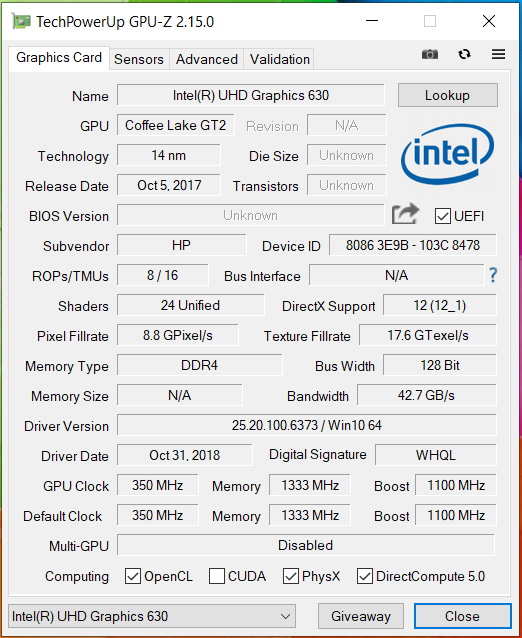
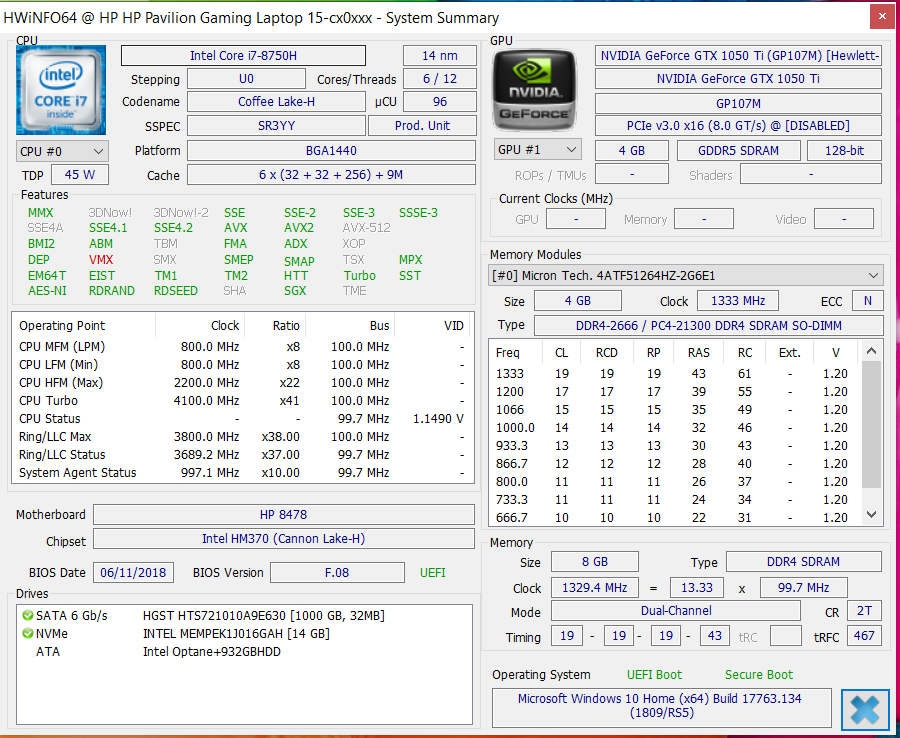
O Pavilion Gaming 15 é um portátil para jogos de gama média de 15,6 polegadas. A combinação de um processador Core i7-8750H e um placa gráfica GeForce GTX 1050 Ti pode rodar fluentemente todos os jogos que atualmente estão no nosso banco de dados. No entanto, os jogos modernos mais exigentes devem ser jogados em configurações mais baixas. O processador hexa-core também oferece capacidade de processamento suficiente para aplicativos além das cargas de jogos. Se você não precisa de um processador hexa-core e/ou gostaria de economizar um pouco de dinheiro, deve dar uma olhada em um modelo Pavilion equipado com um processador quad-core. Core i5-8300H.
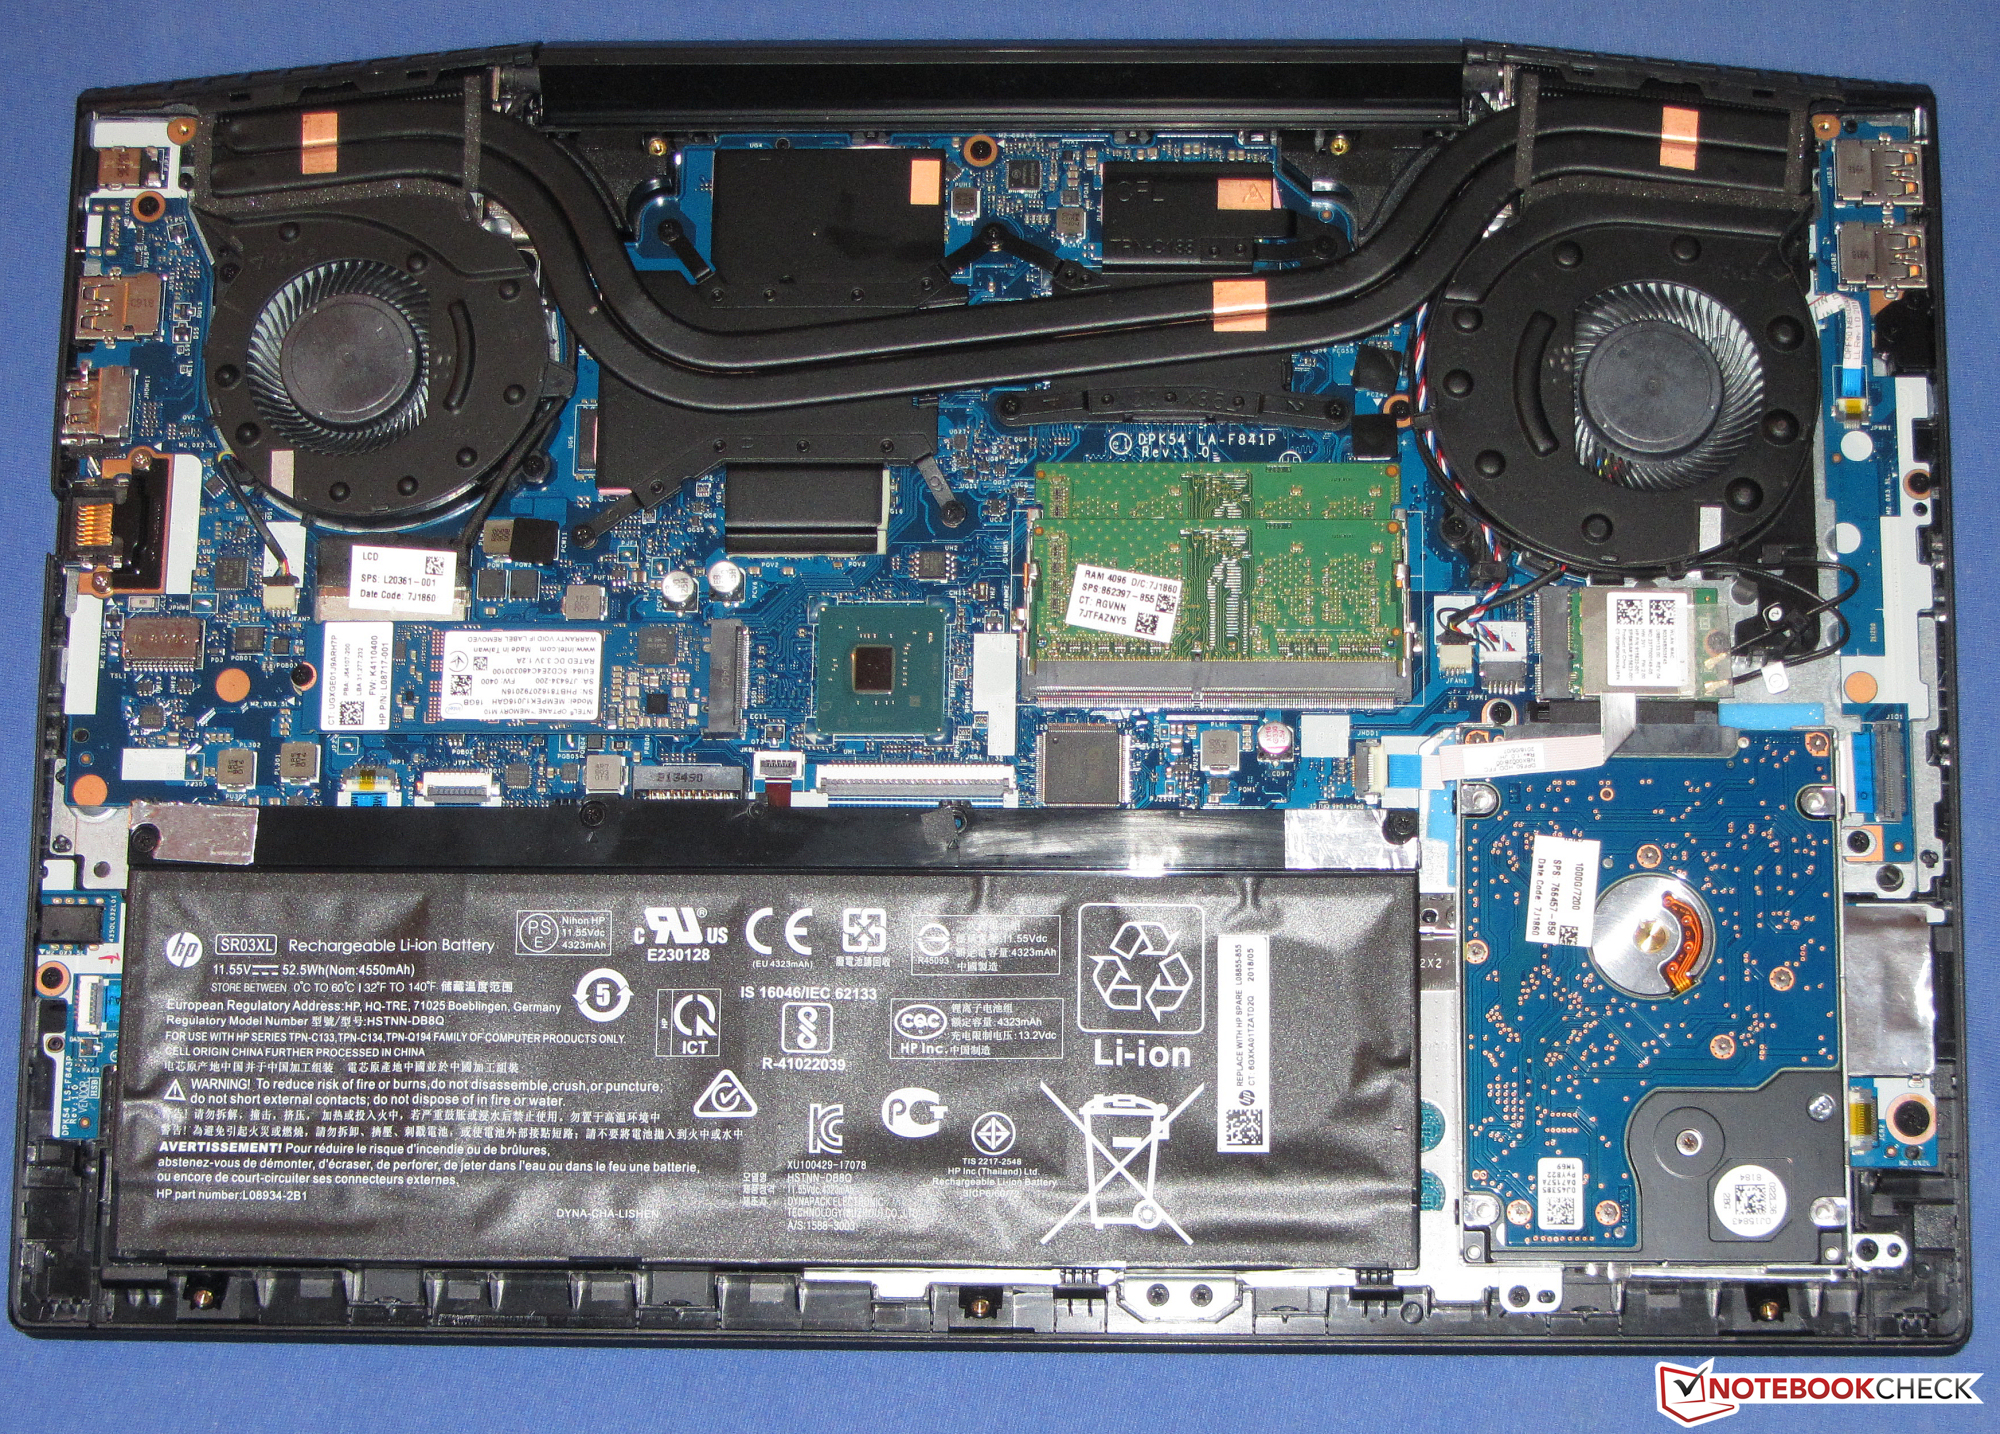
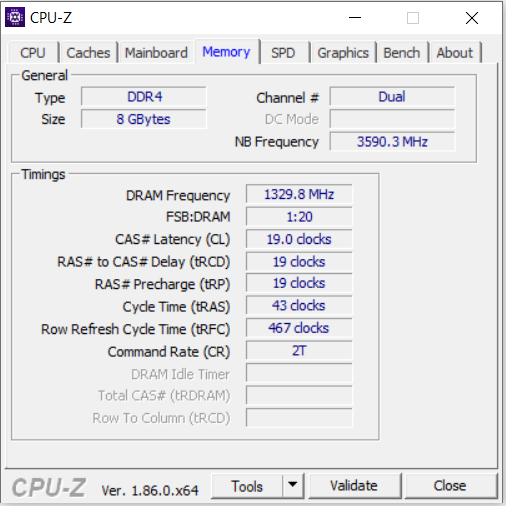
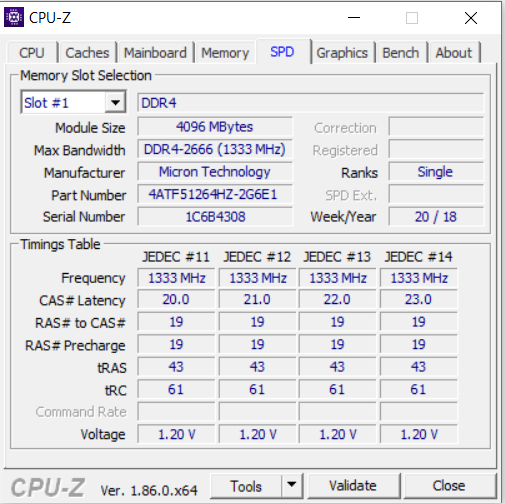
A combinação da memória Intel Optane consiste em um HD de 1 TB e um SSD NVMe de 16 GB e garante um sistema veloz. O uso do Optane é opcional. O SSD do cache pode ser substituído por um dispositivo NVMe maior de um fabricante diferente, que poderia então ser usado como unidade do sistema, enquanto o HD seria usado apenas para armazenamento de dados.
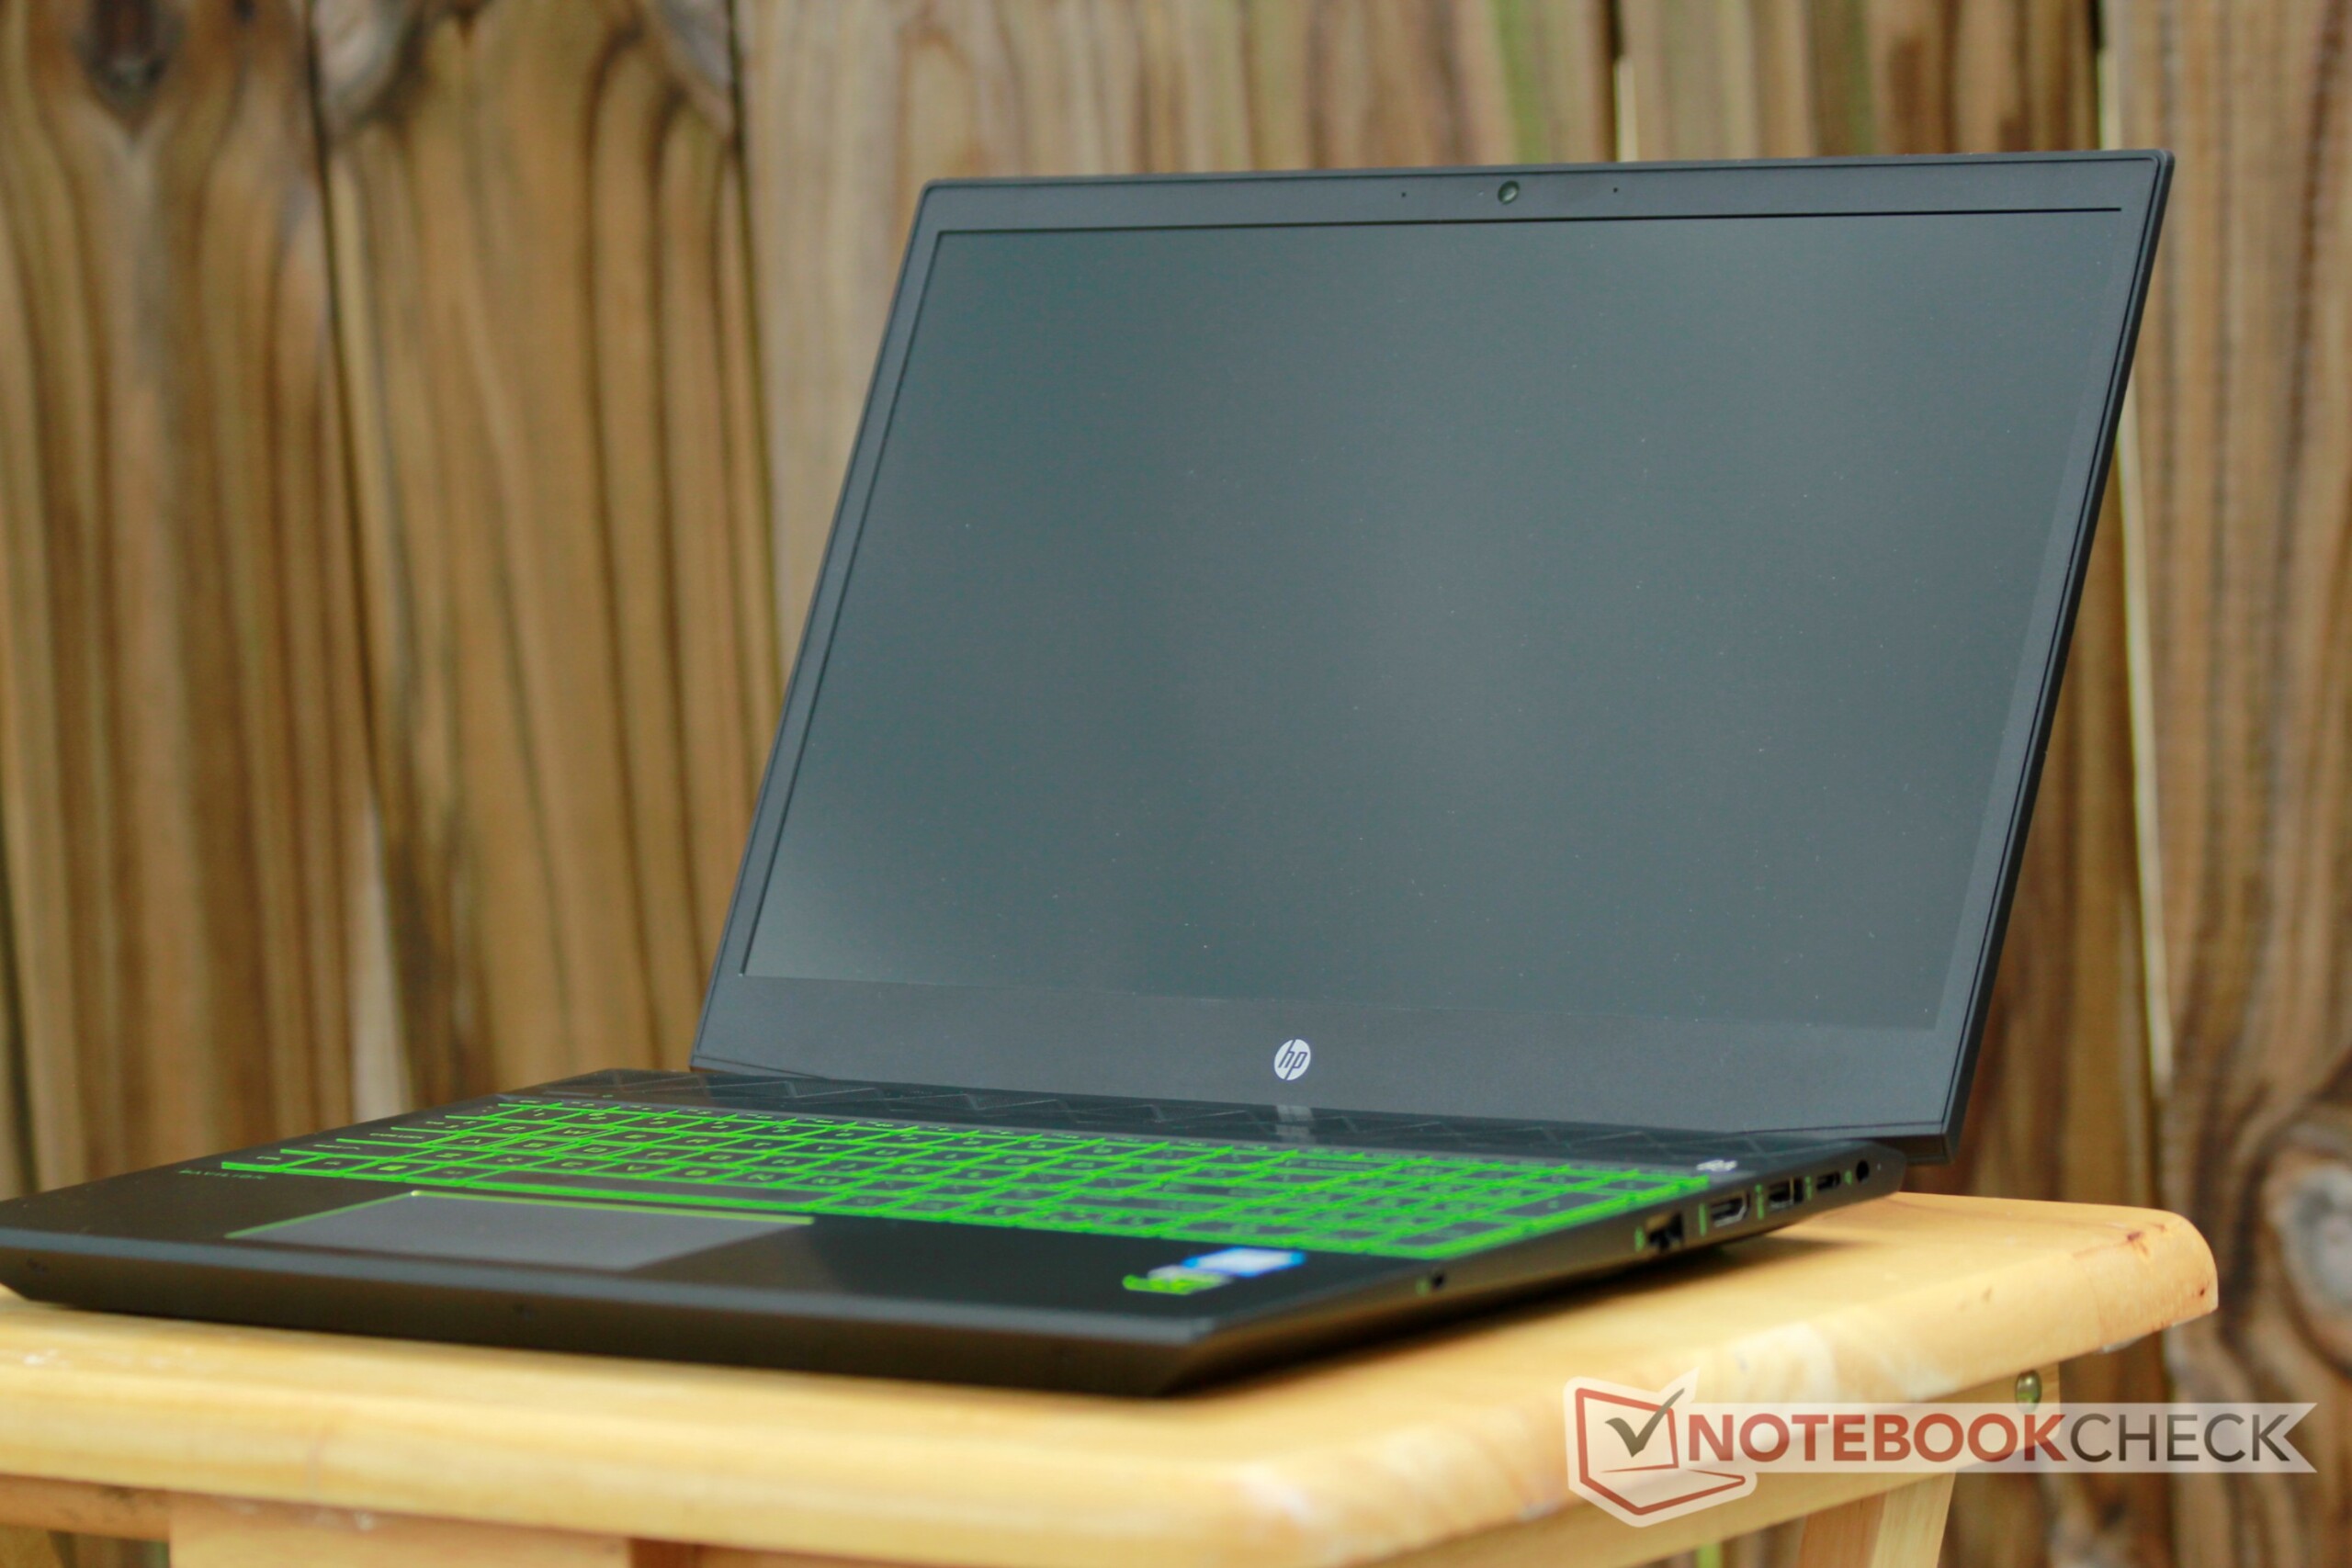
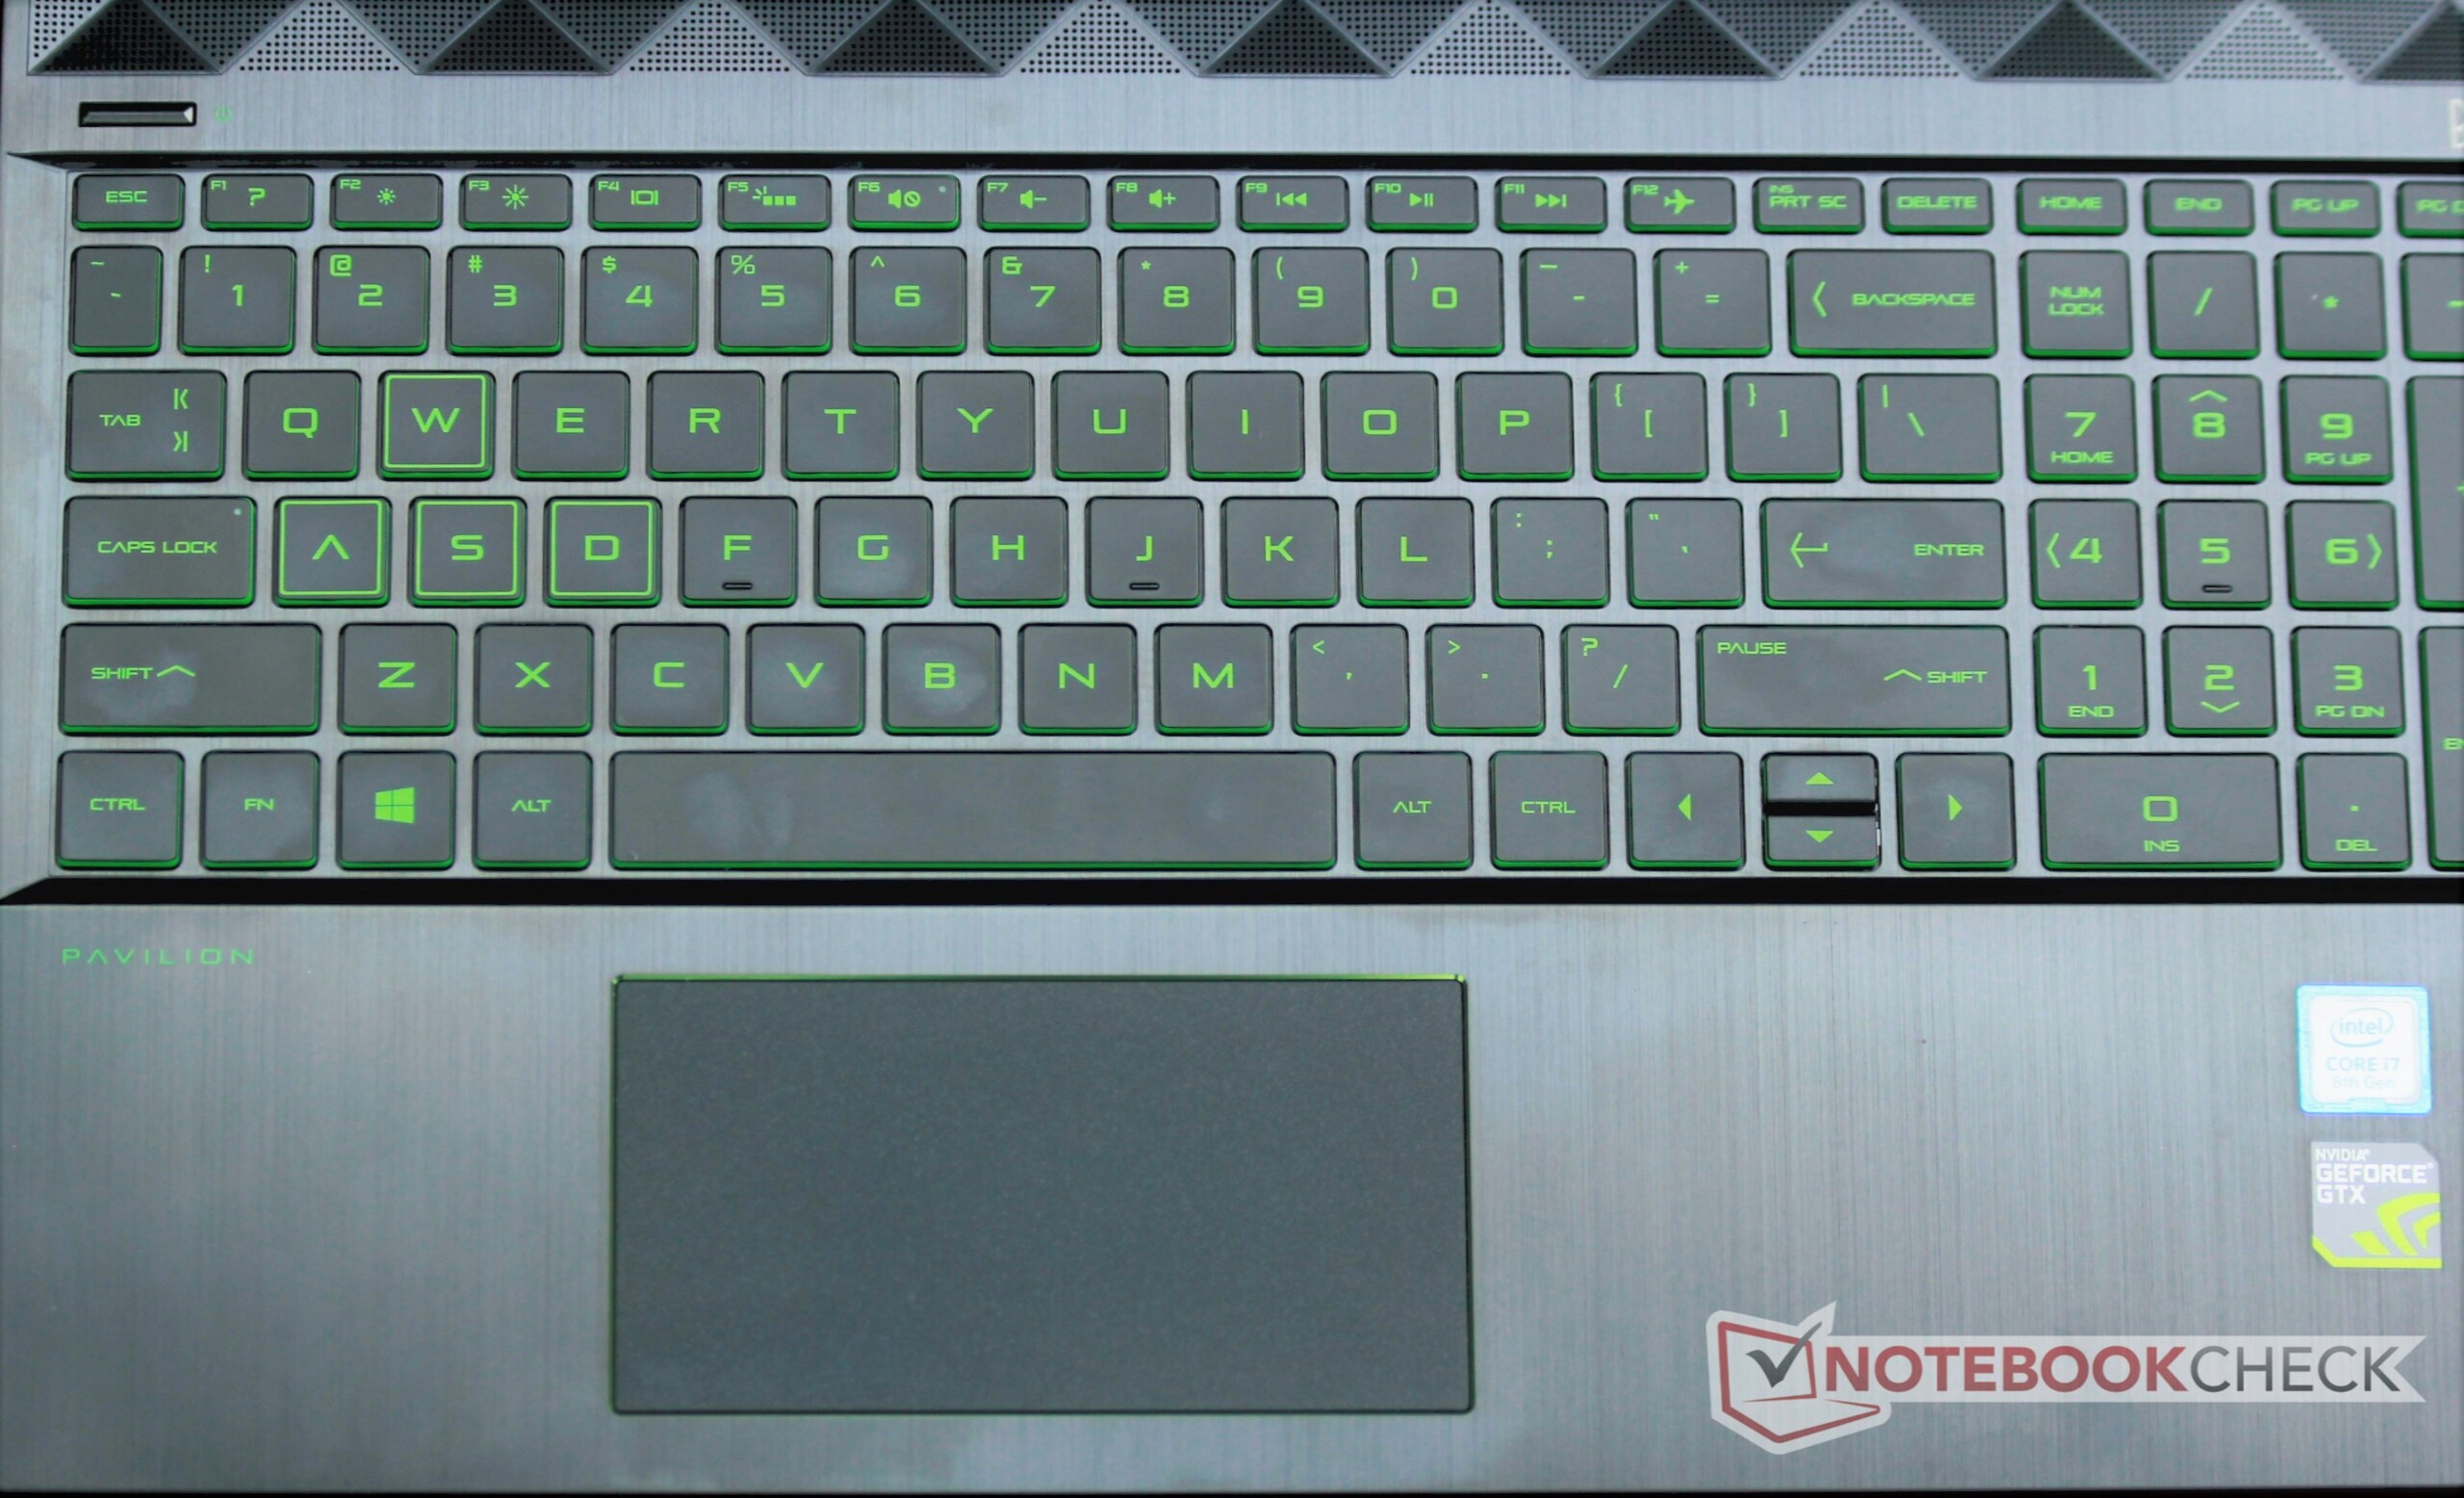
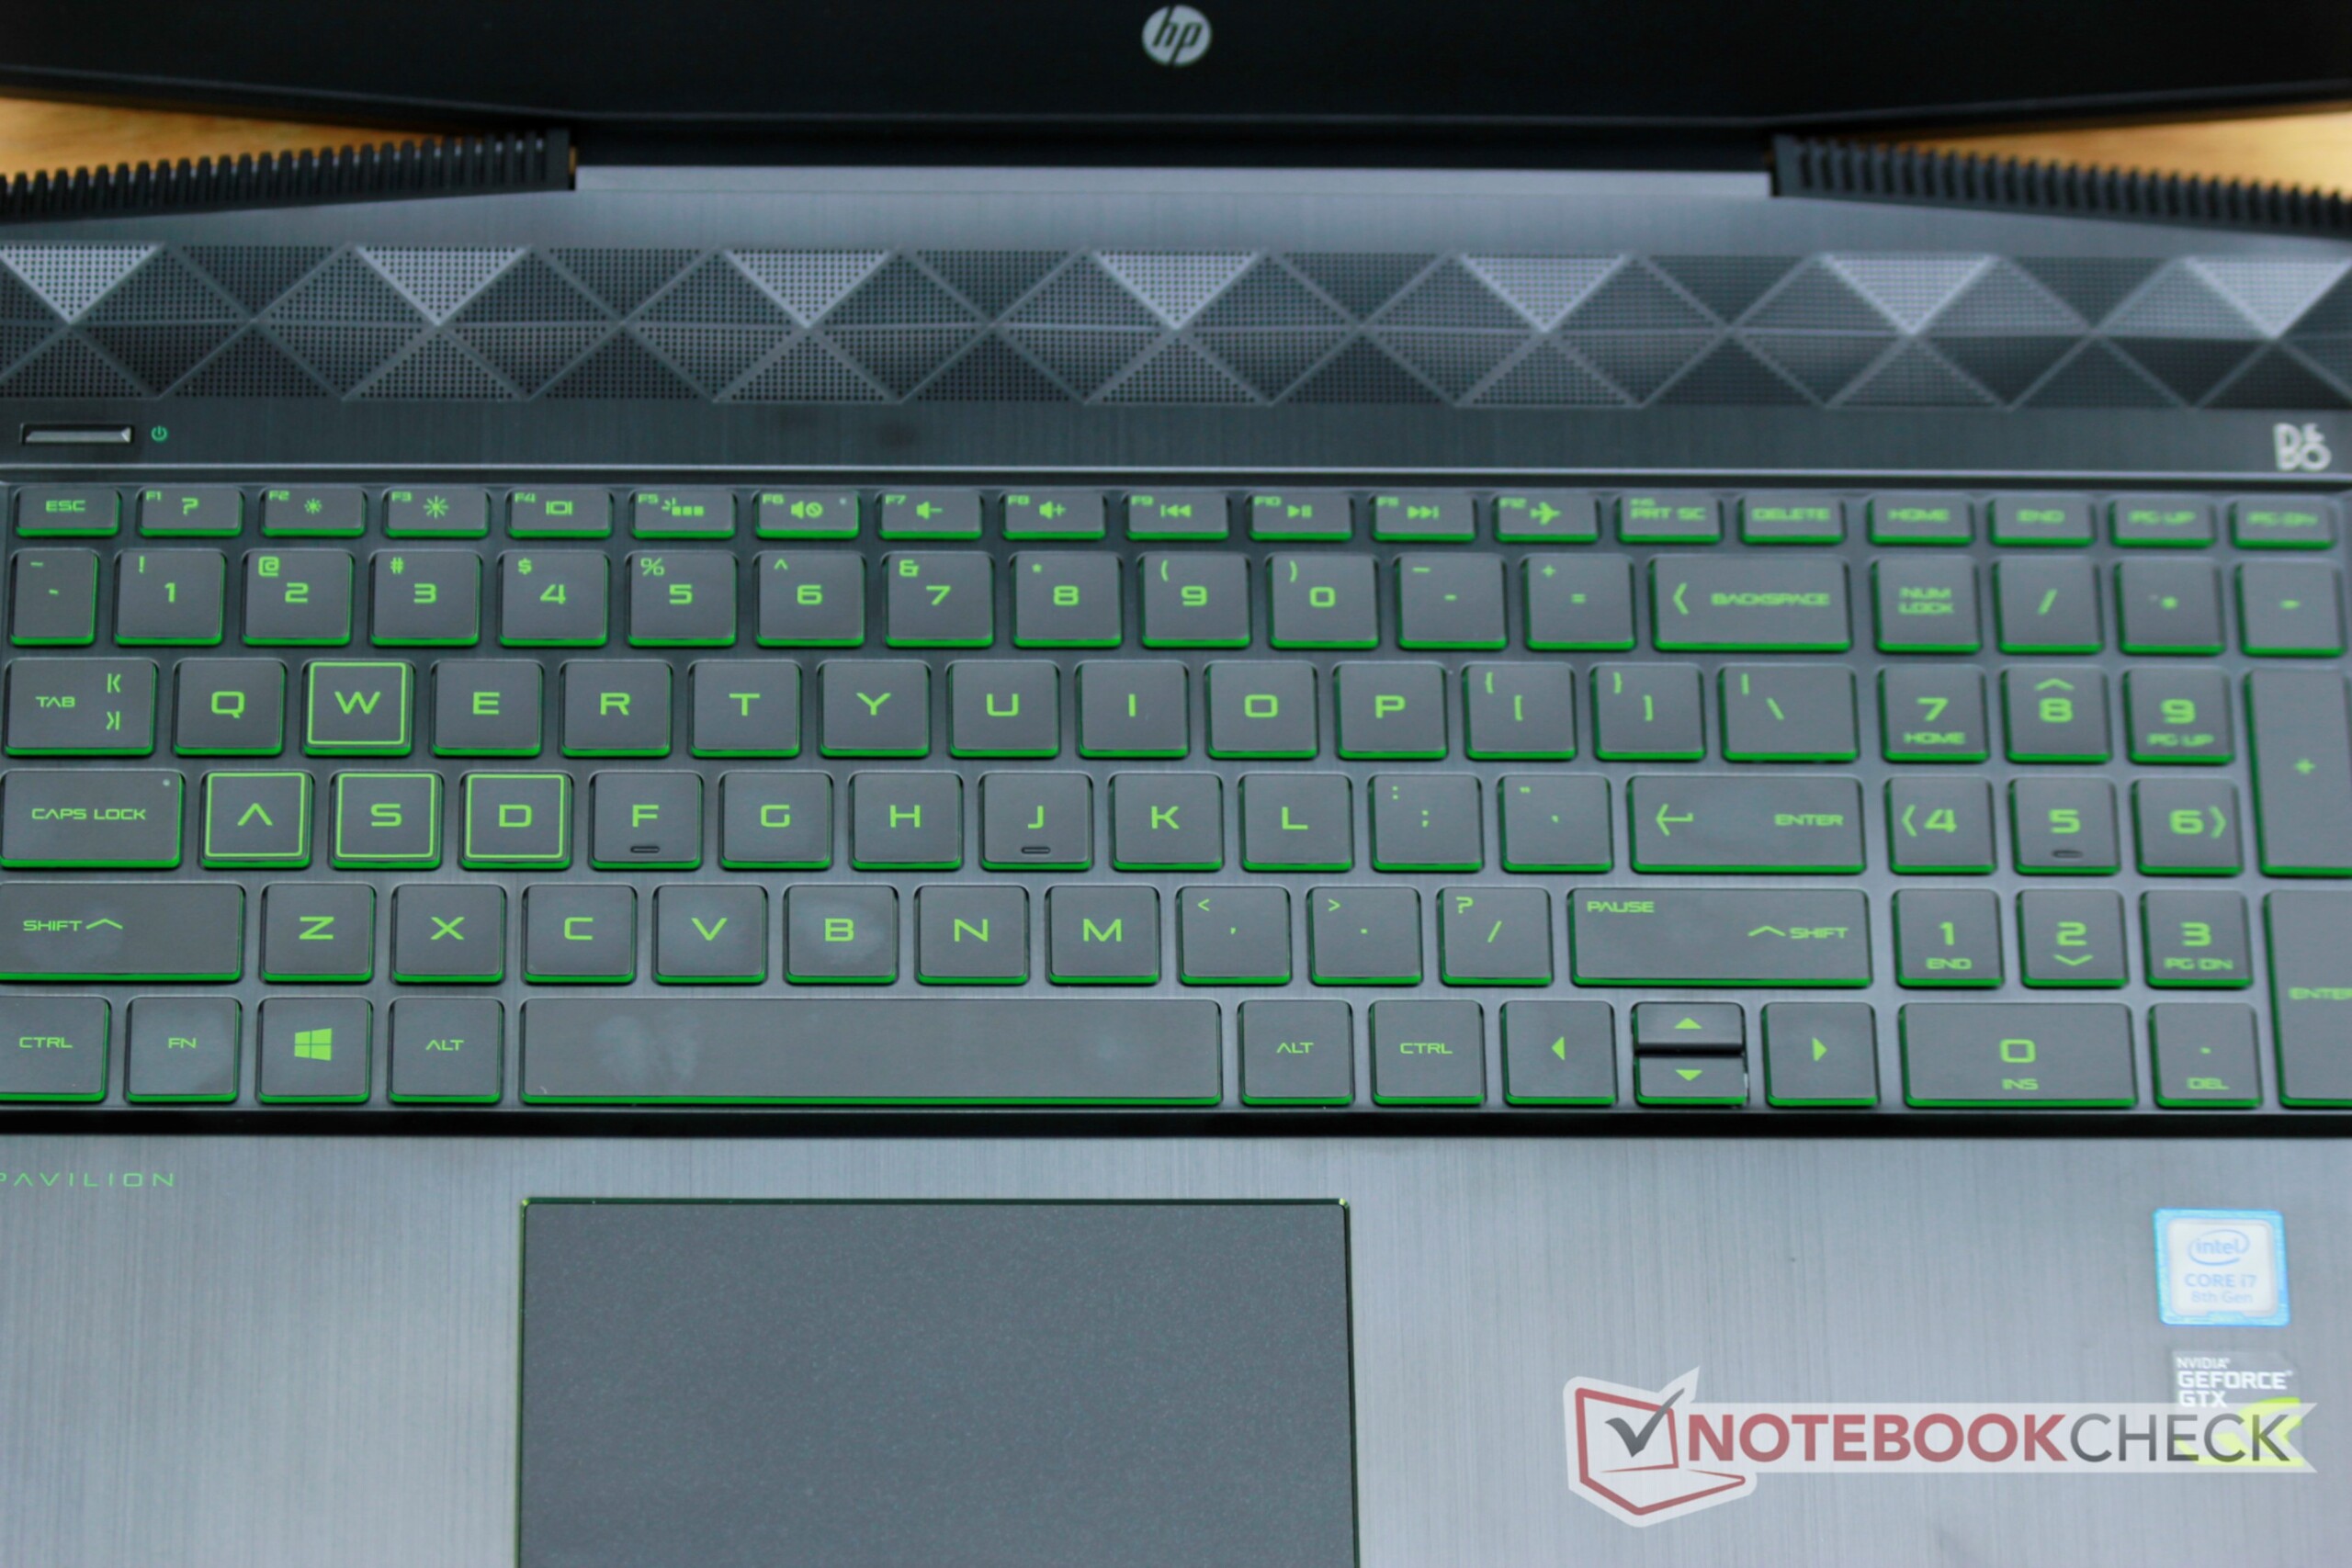
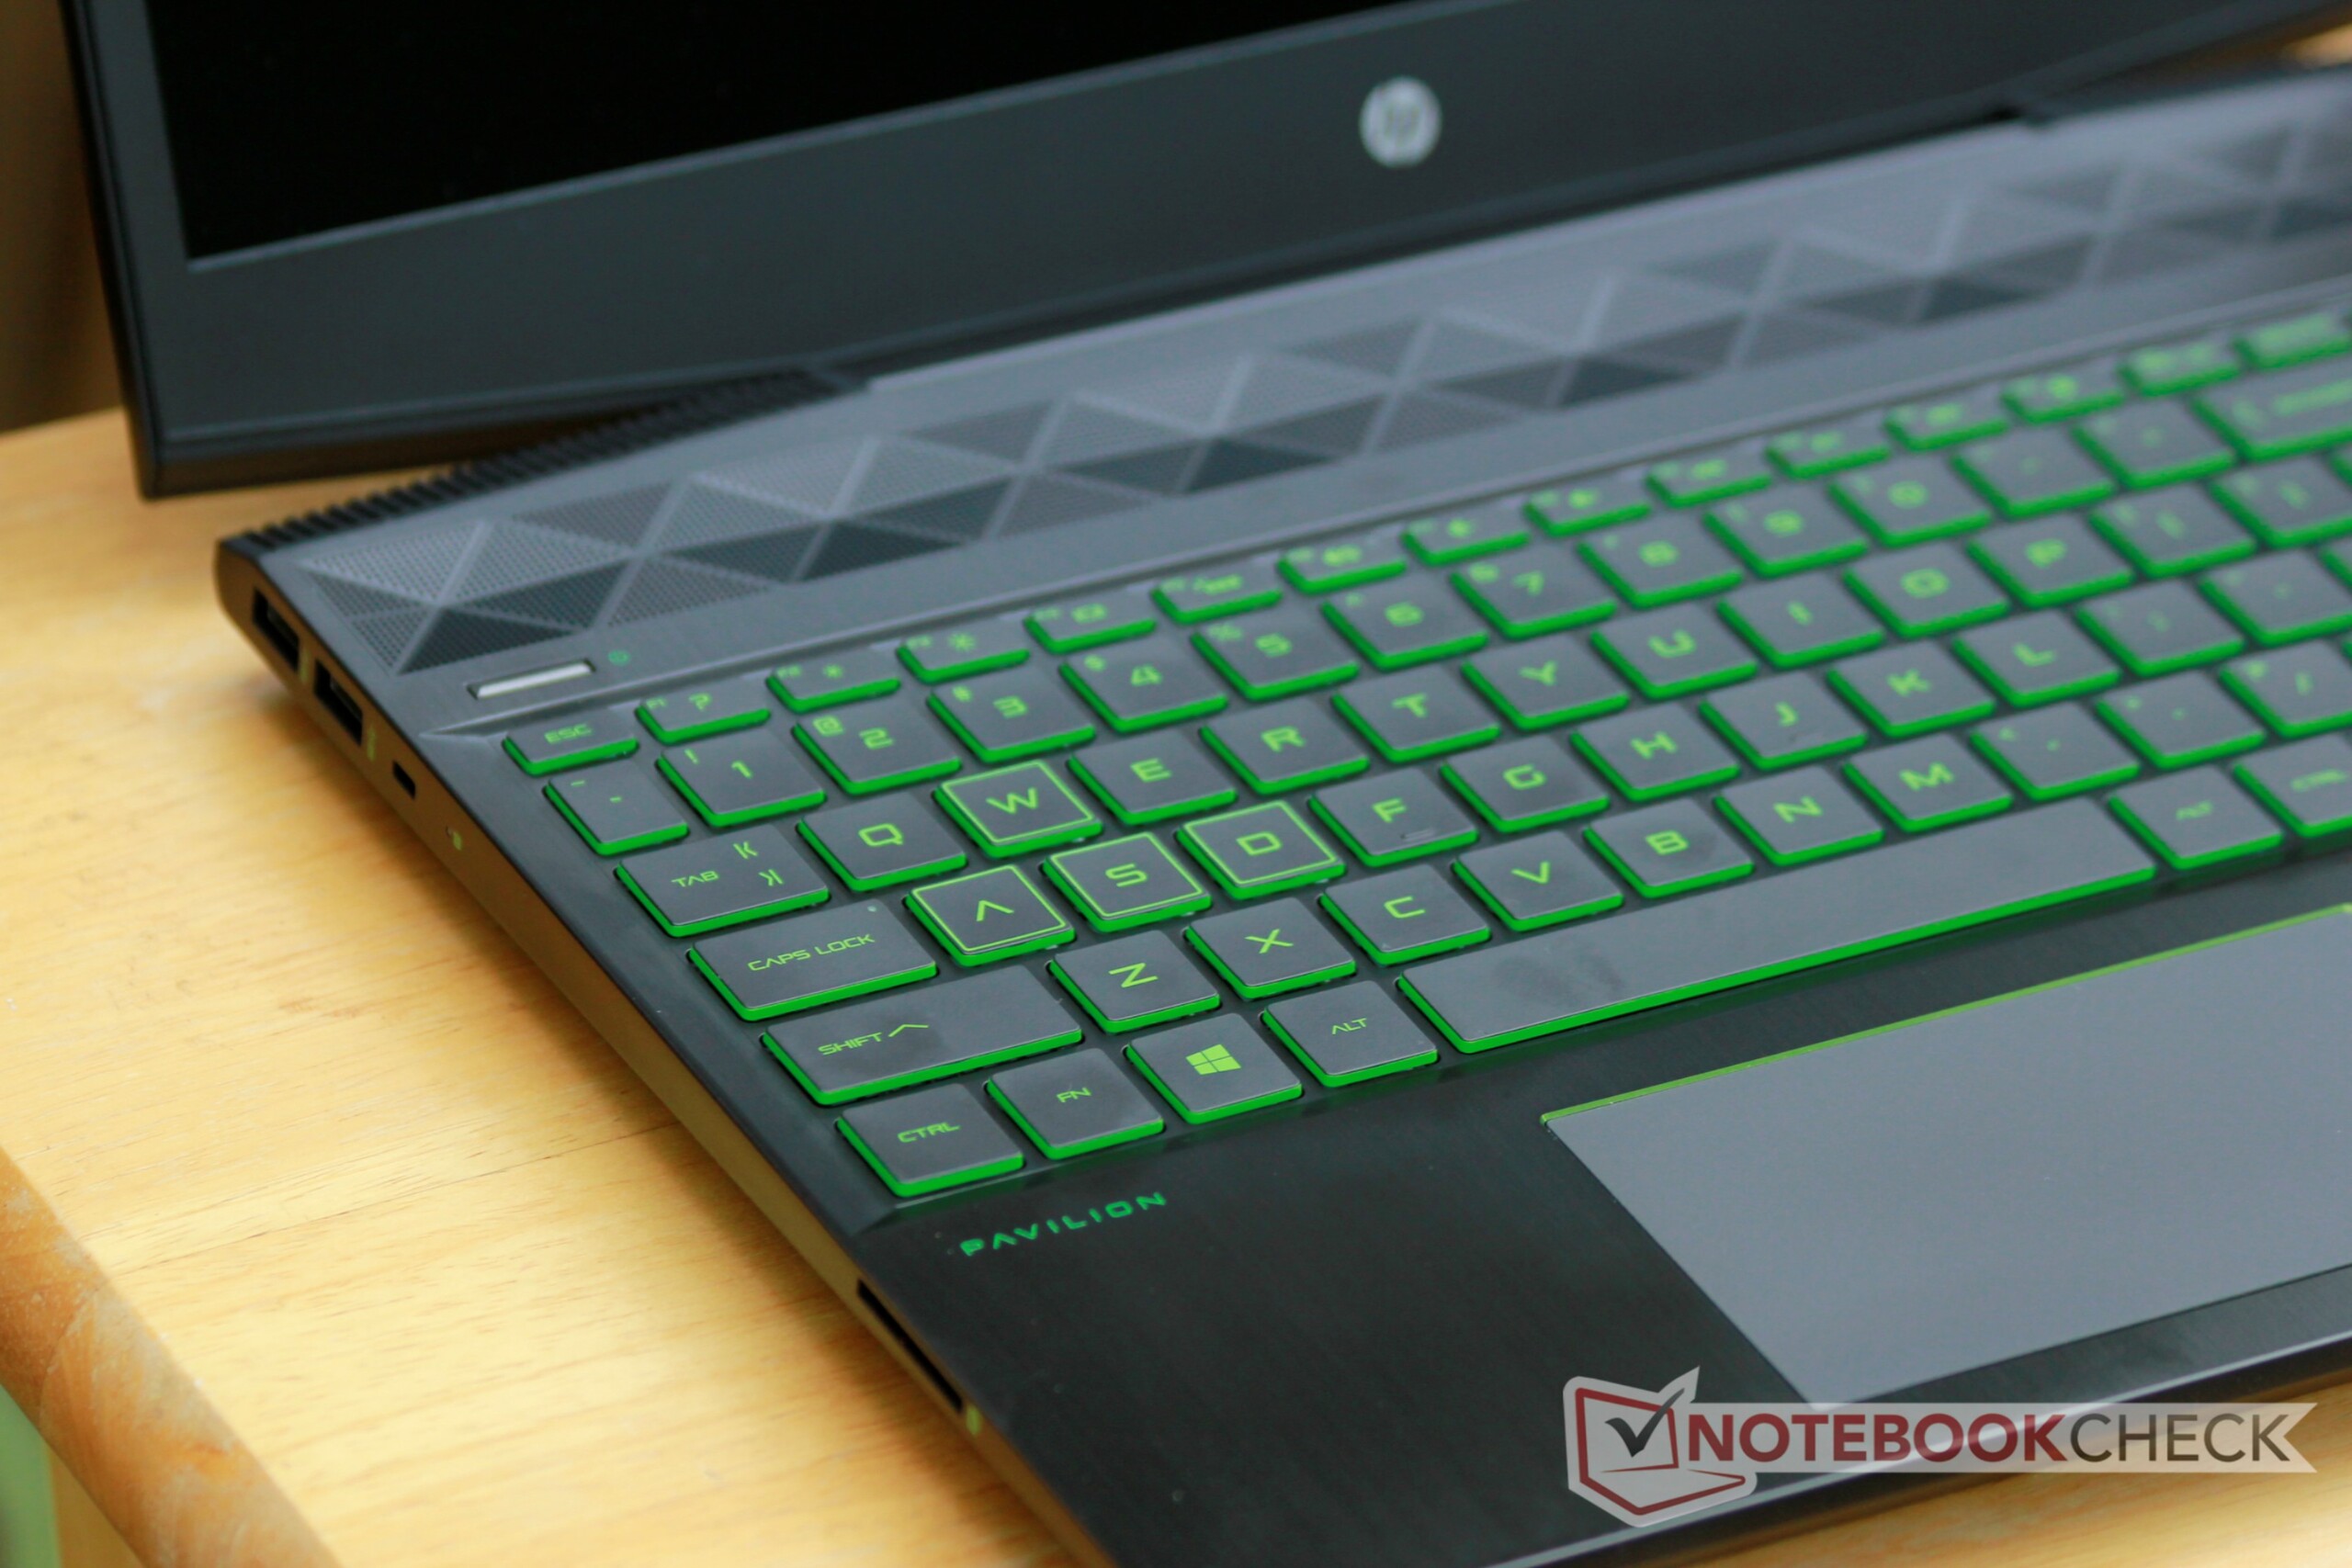
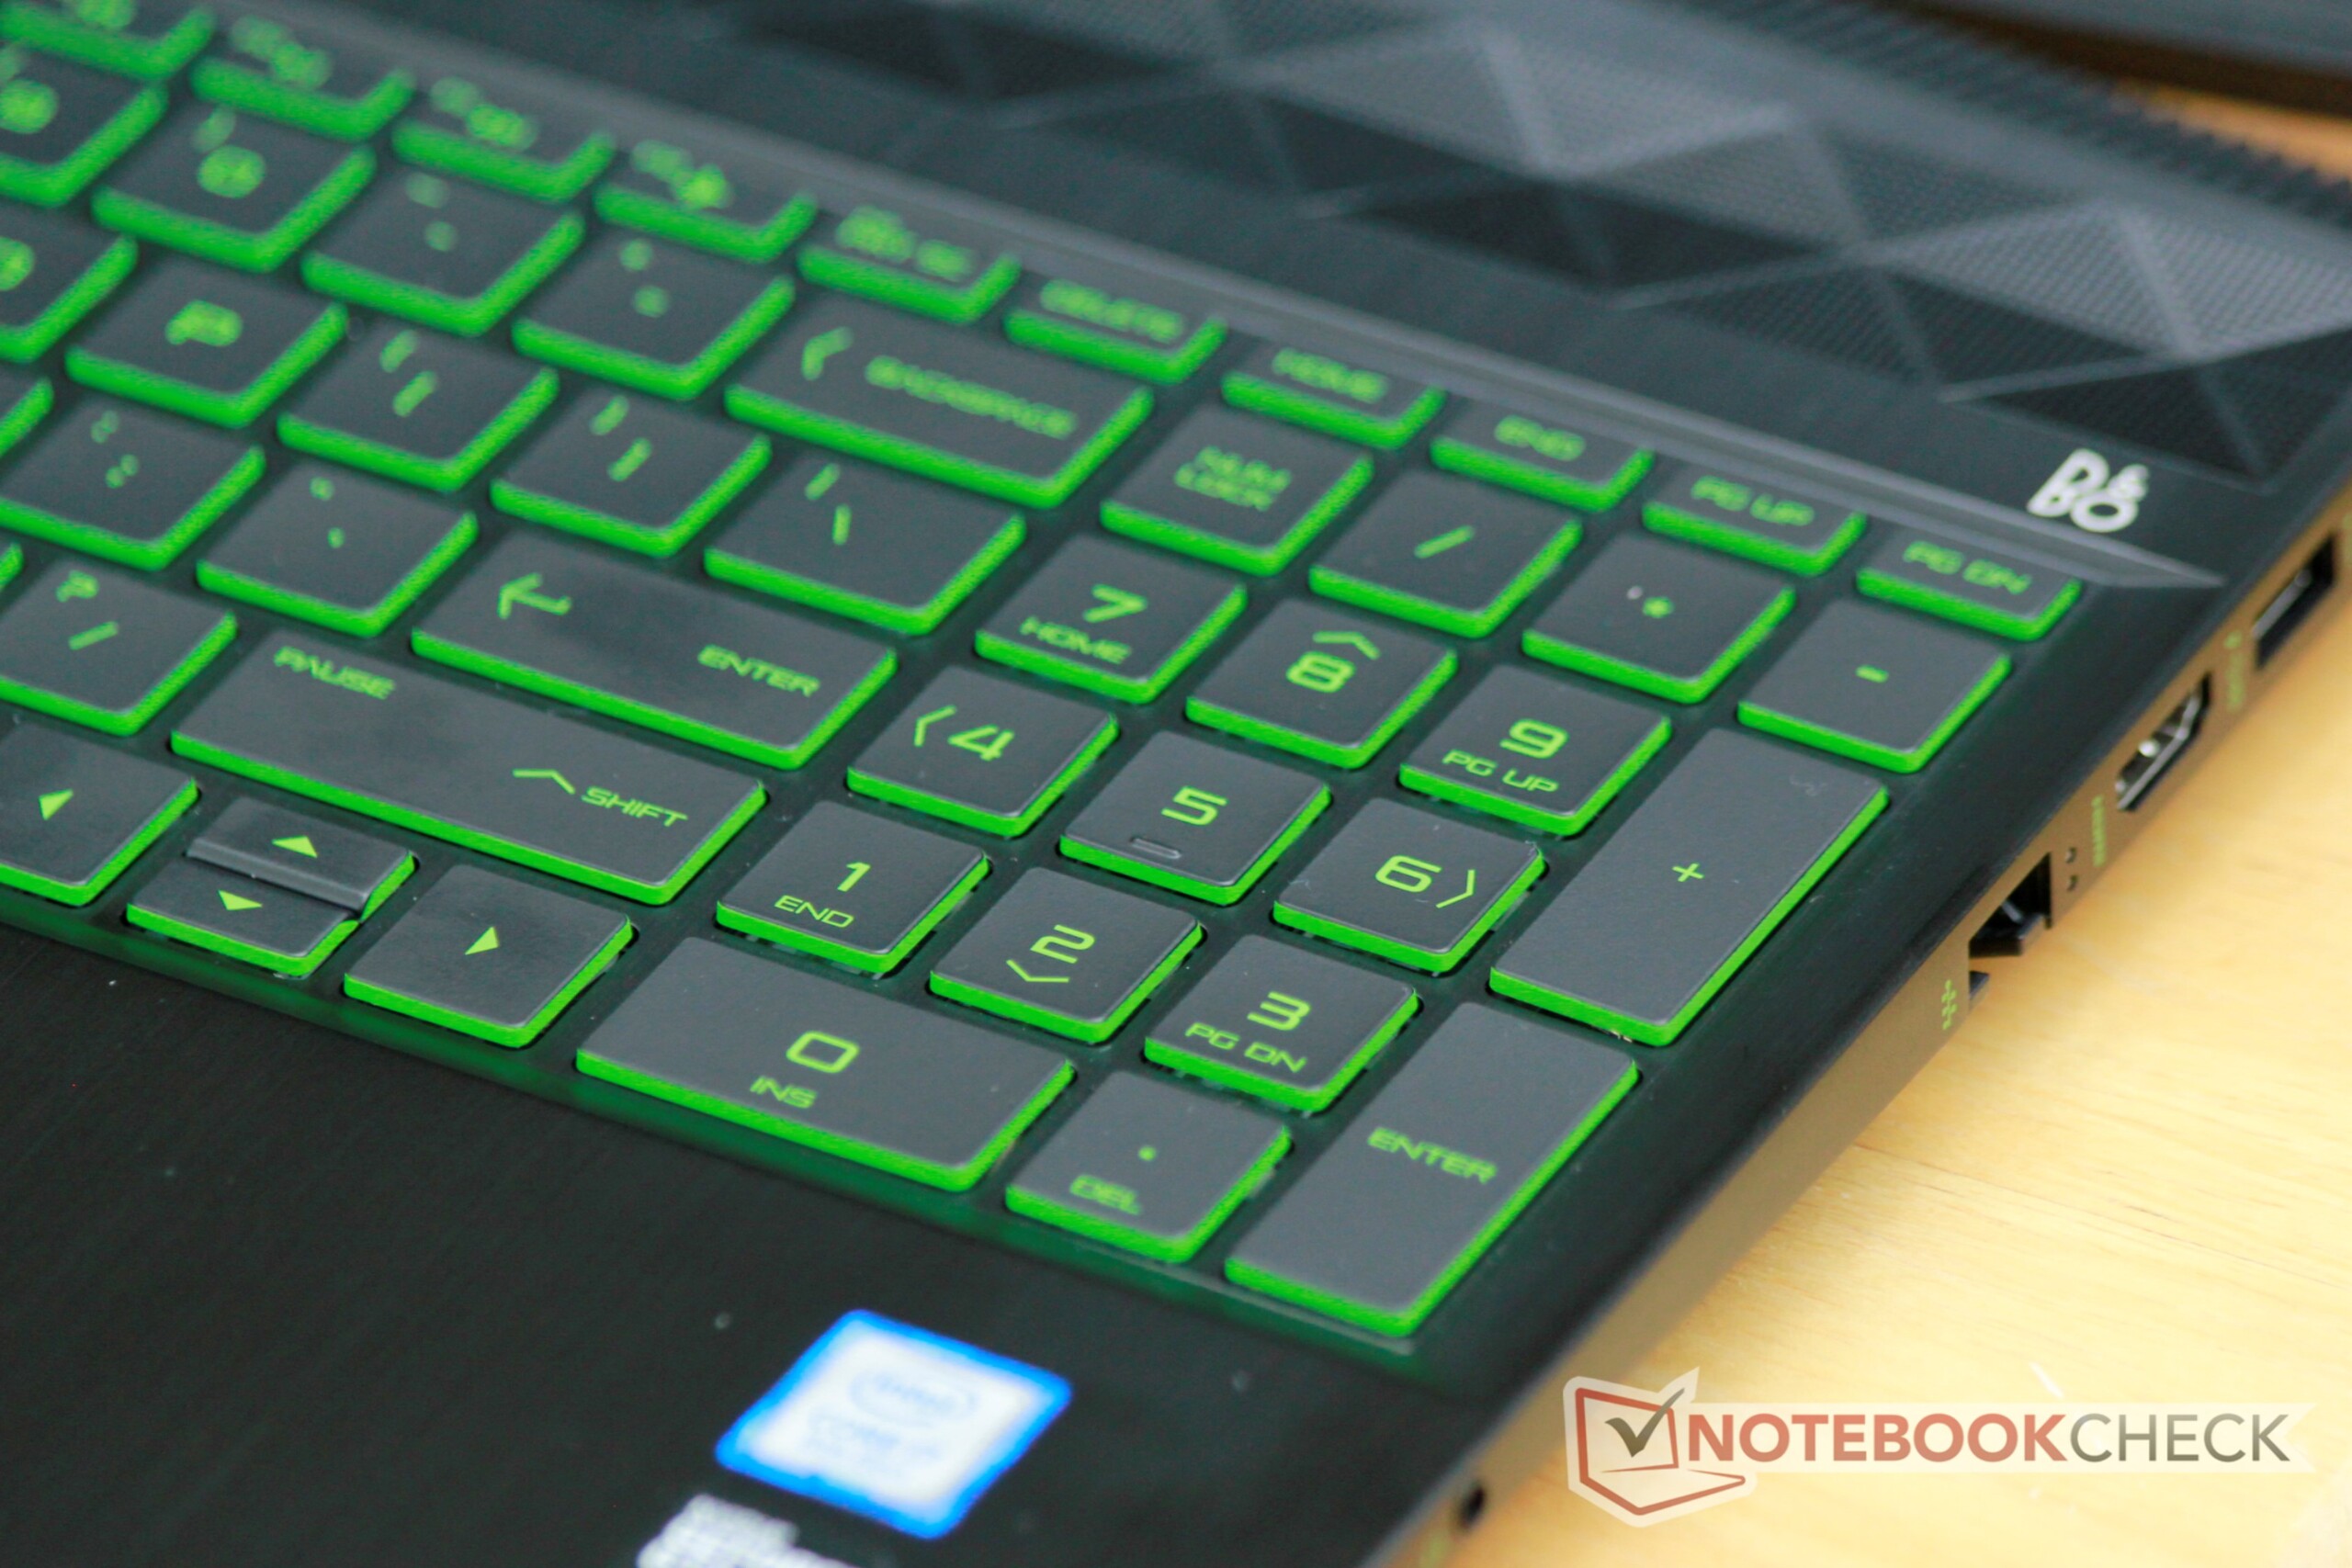
A tela IPS Full HD no Pavilion oferece ângulos de visão estáveis e bom contraste. O brilho da tela é muito baixo para um portátil desta faixa de preços. Seus tempos de duração de bateria são bons para um portátil para jogos, embora alguns concorrentes similares tenham mais a oferecer. O teclado é muito bom, especialmente para um portátil para jogos.
A HP criou uma série de portáteis para jogos que está posicionada abaixo da série Omen. Esses dispositivos devem oferecer o máximo de desempenho de jogos possível por um preço comparativamente baixo. Enquanto o dispositivo cumpre este objetivo, não desencadeia ondas de entusiasmo.
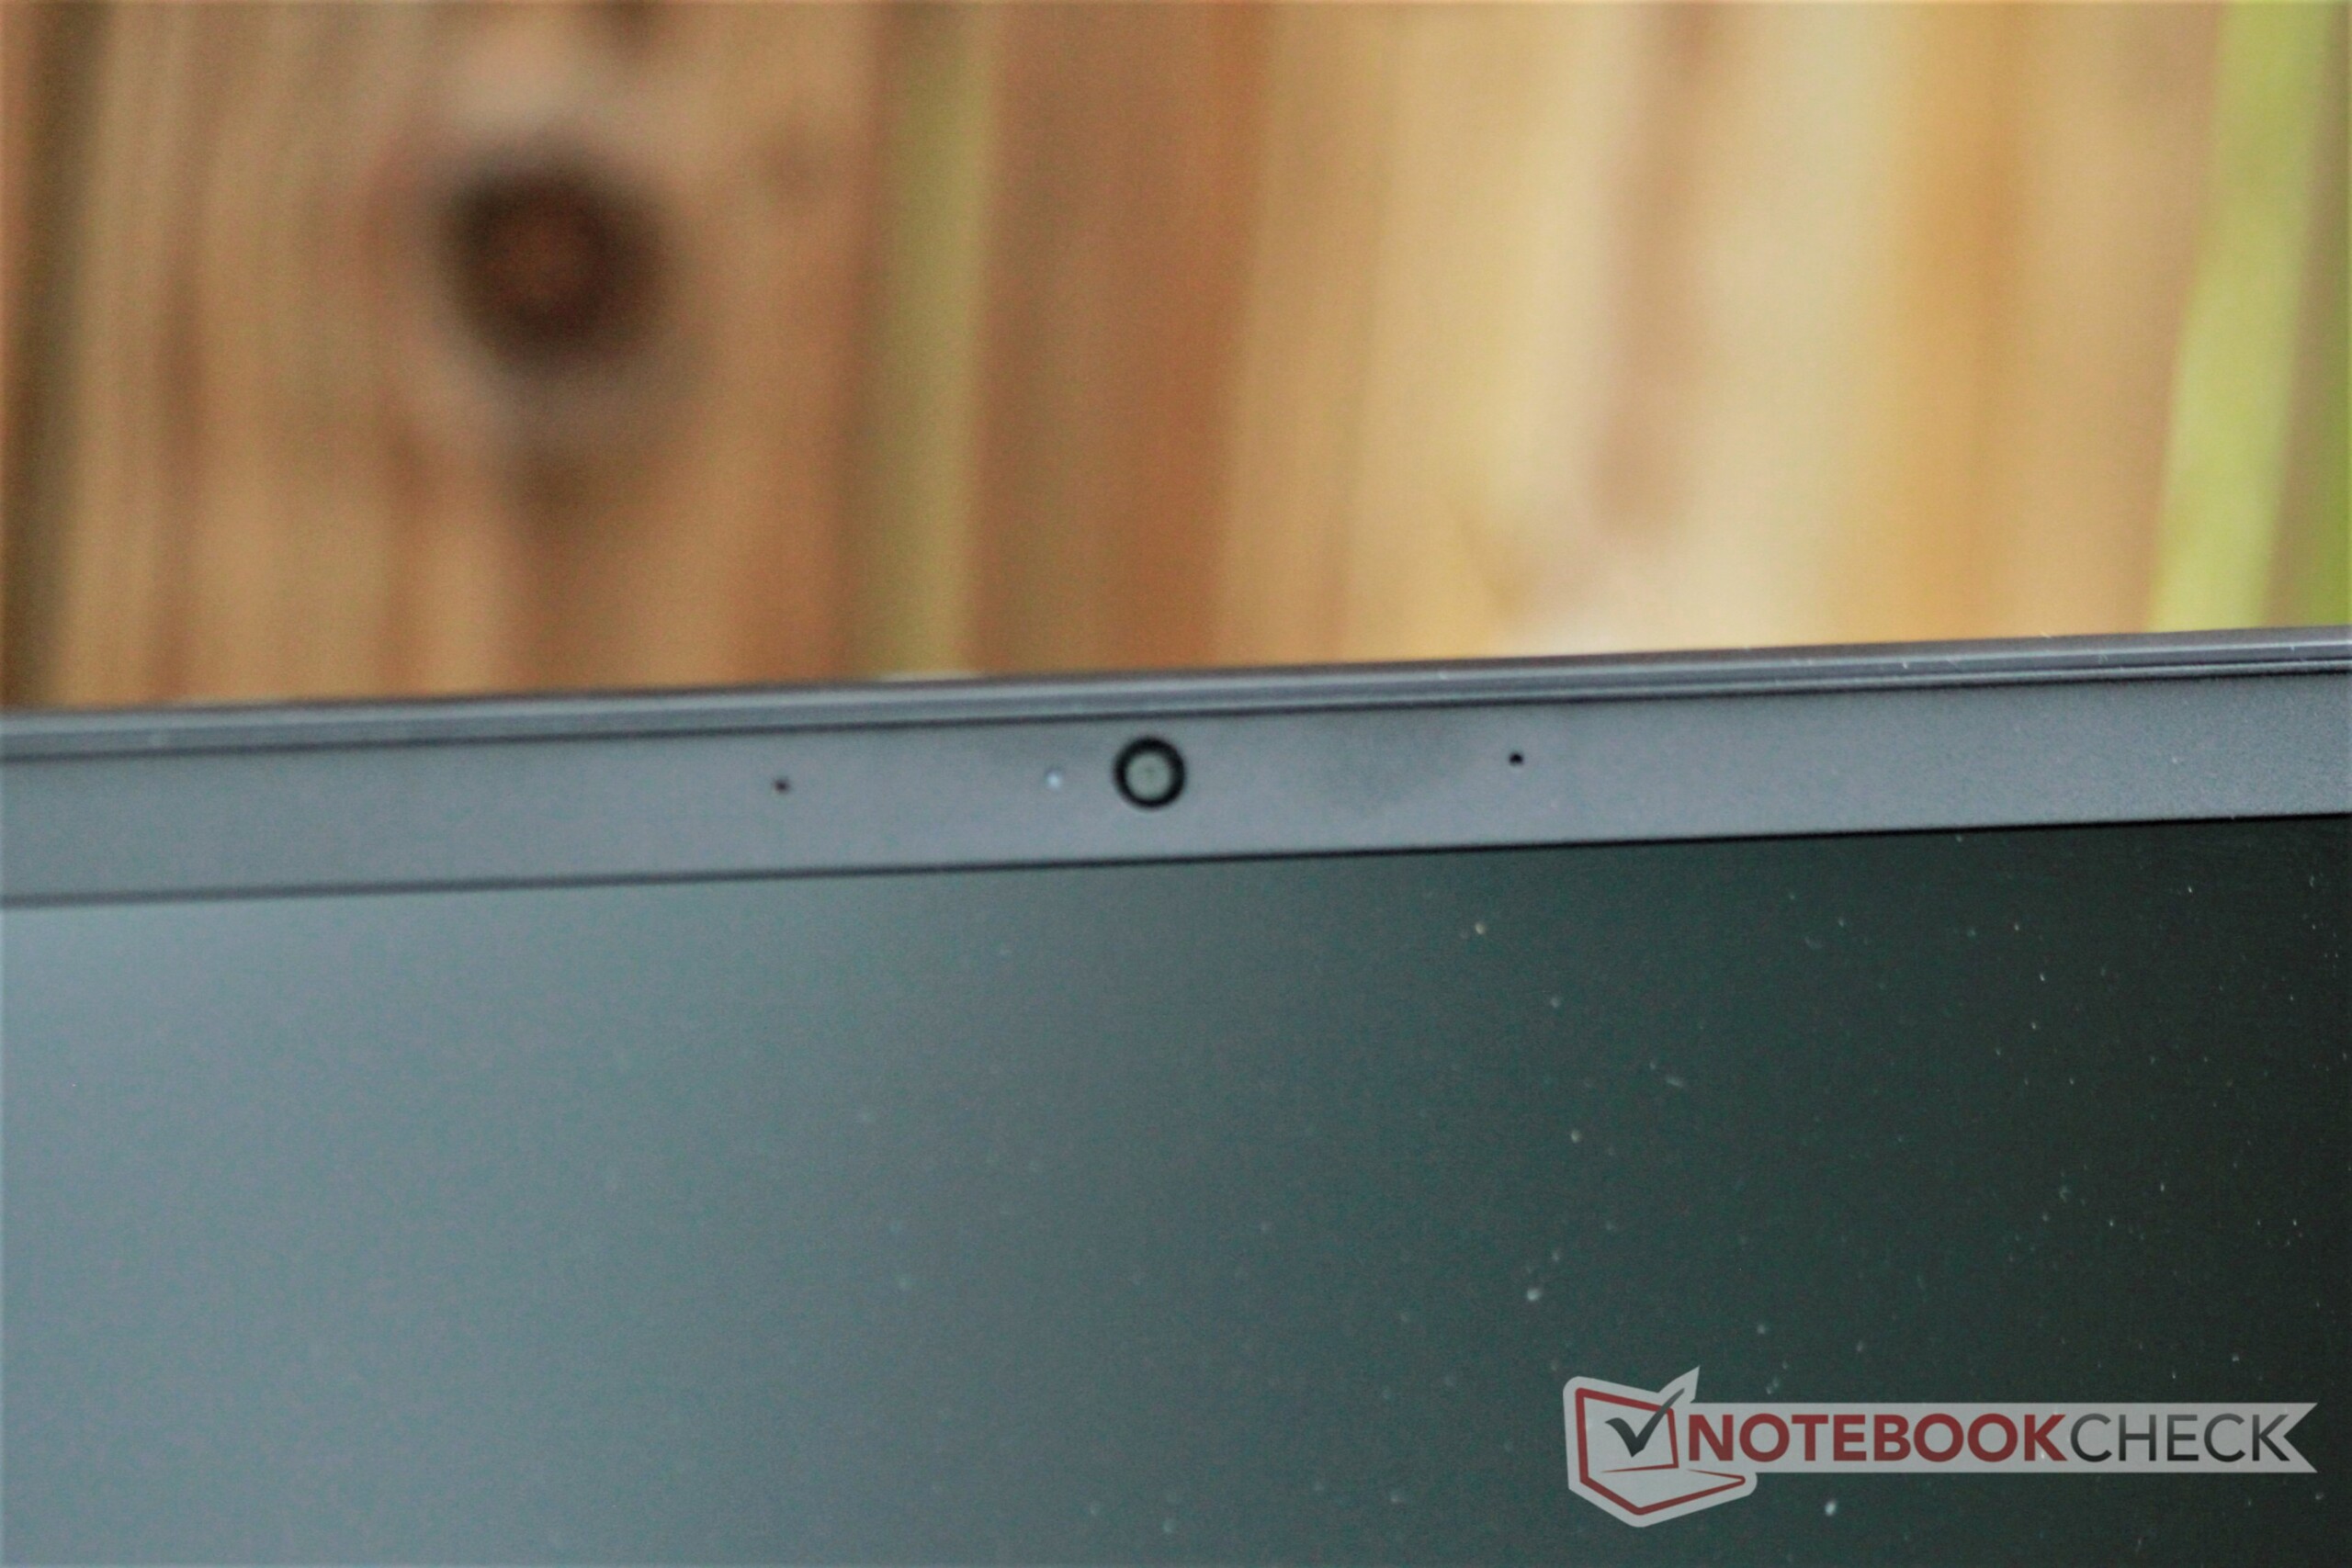
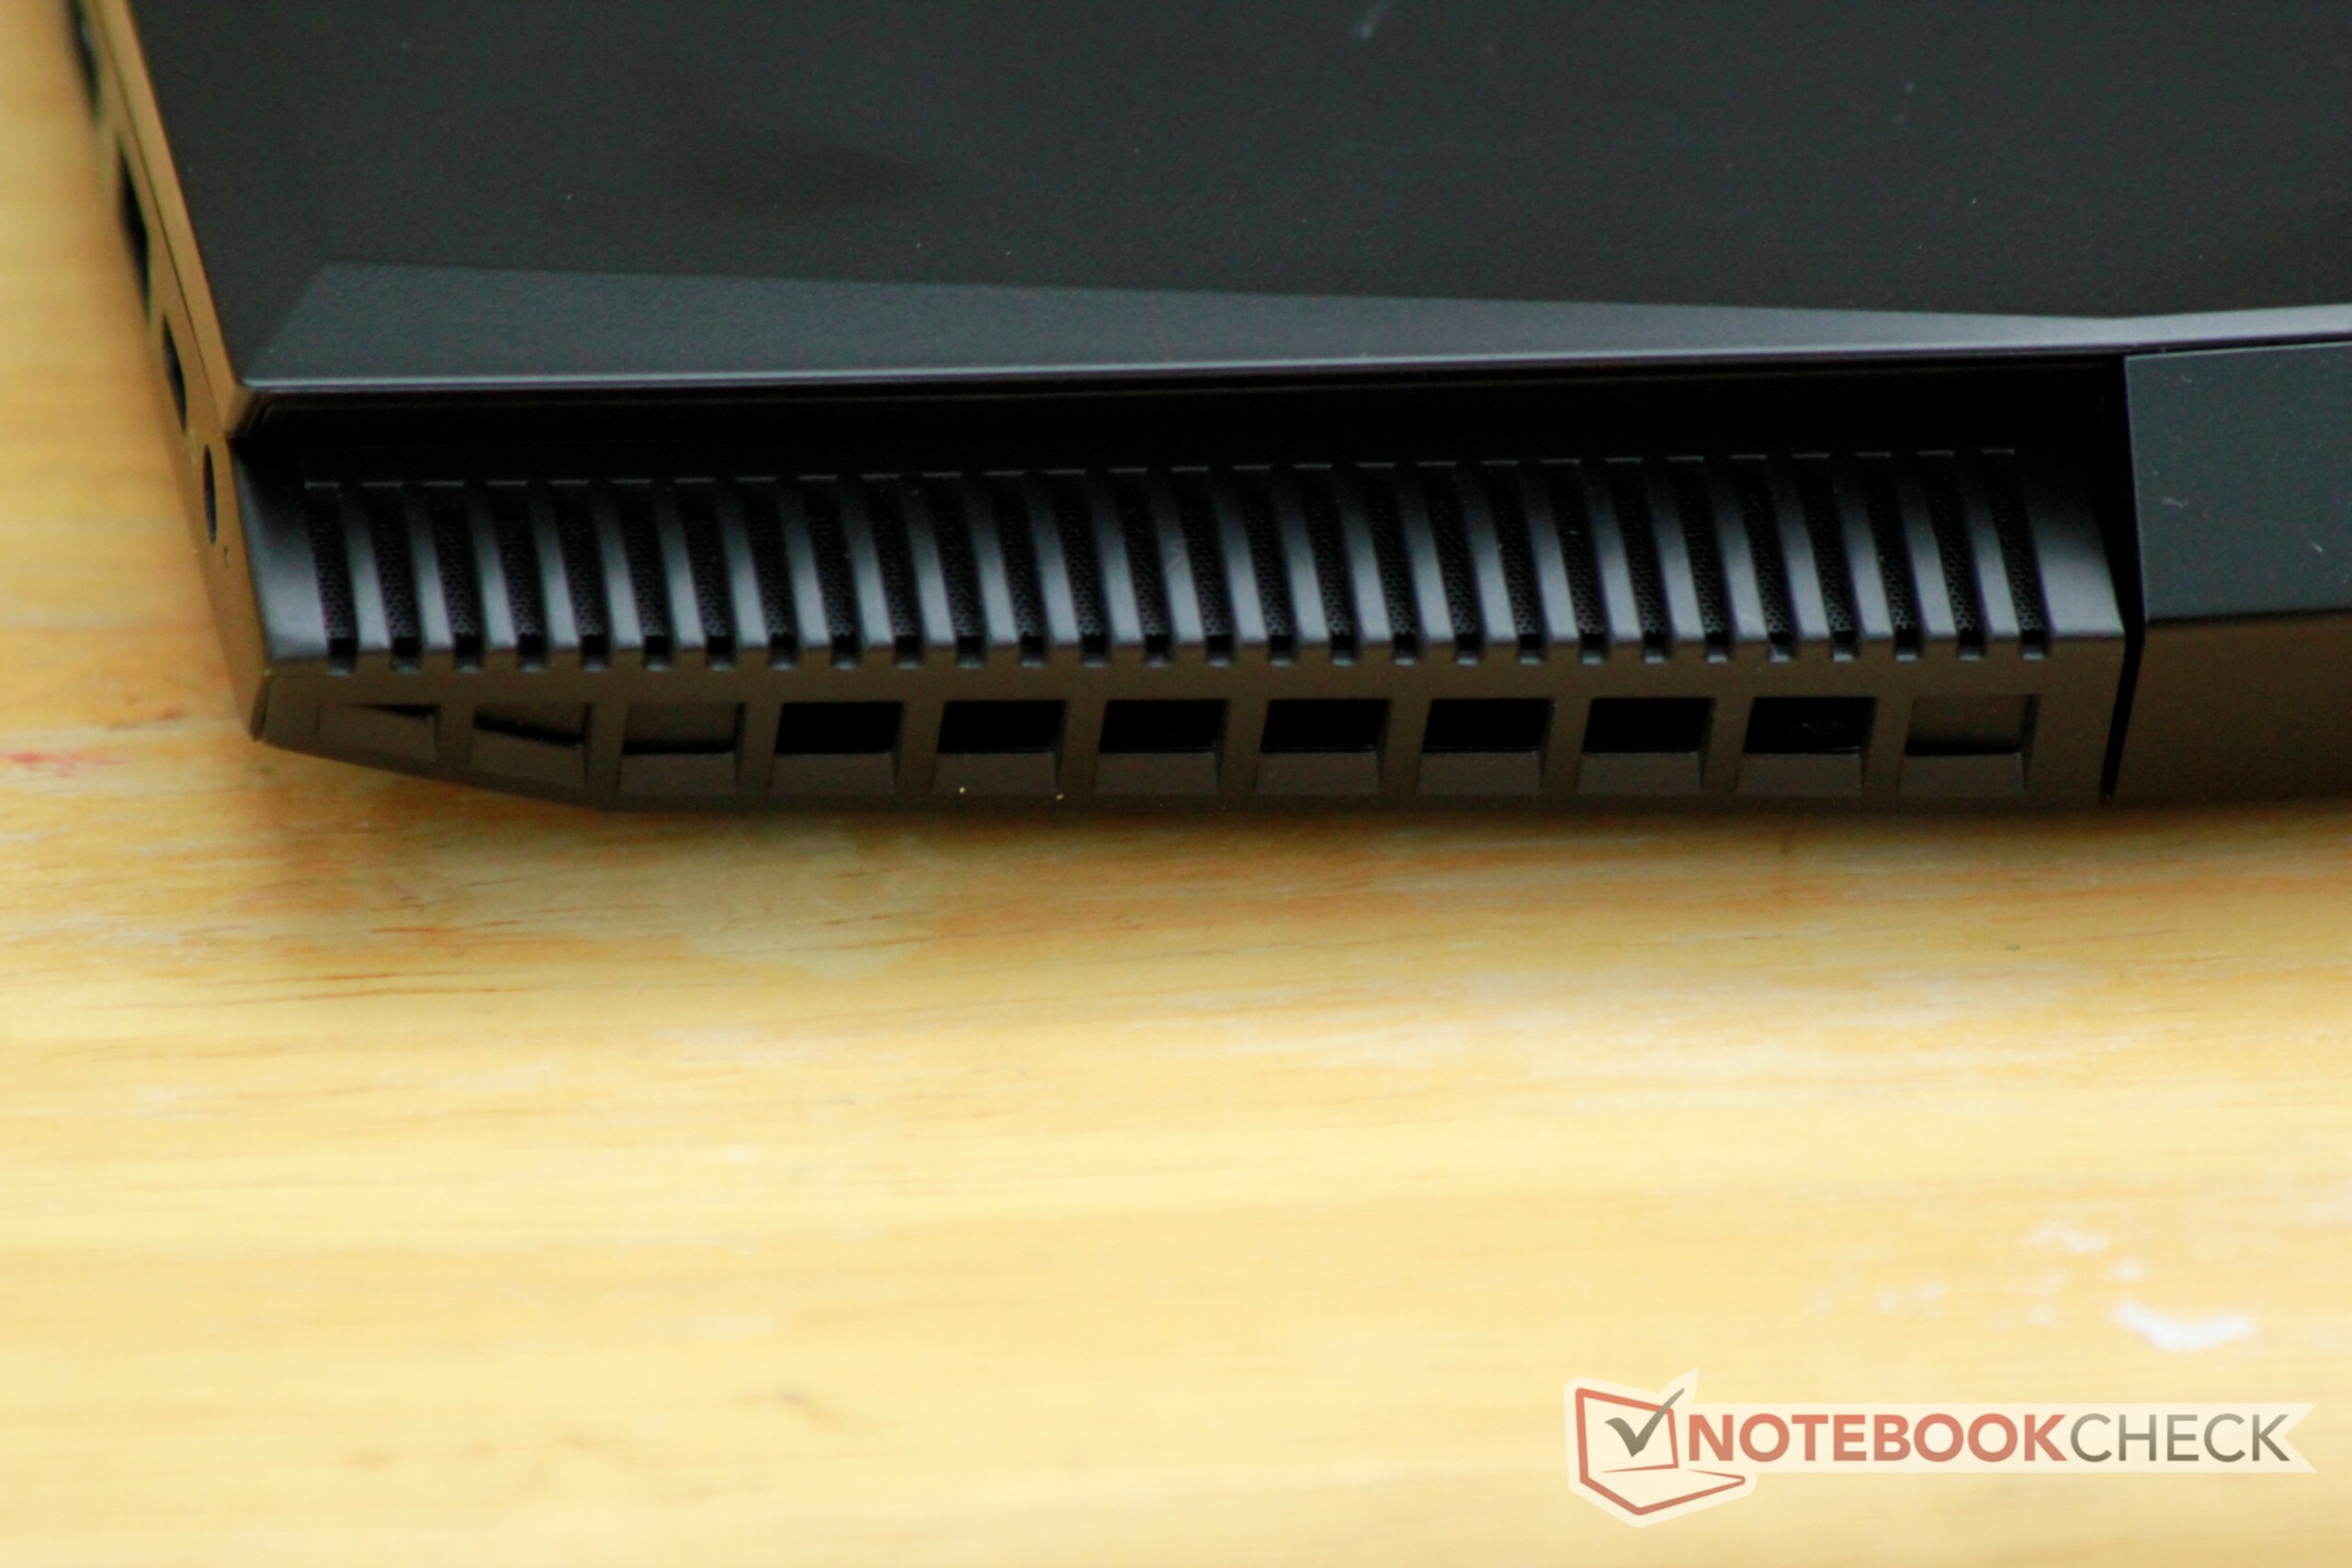
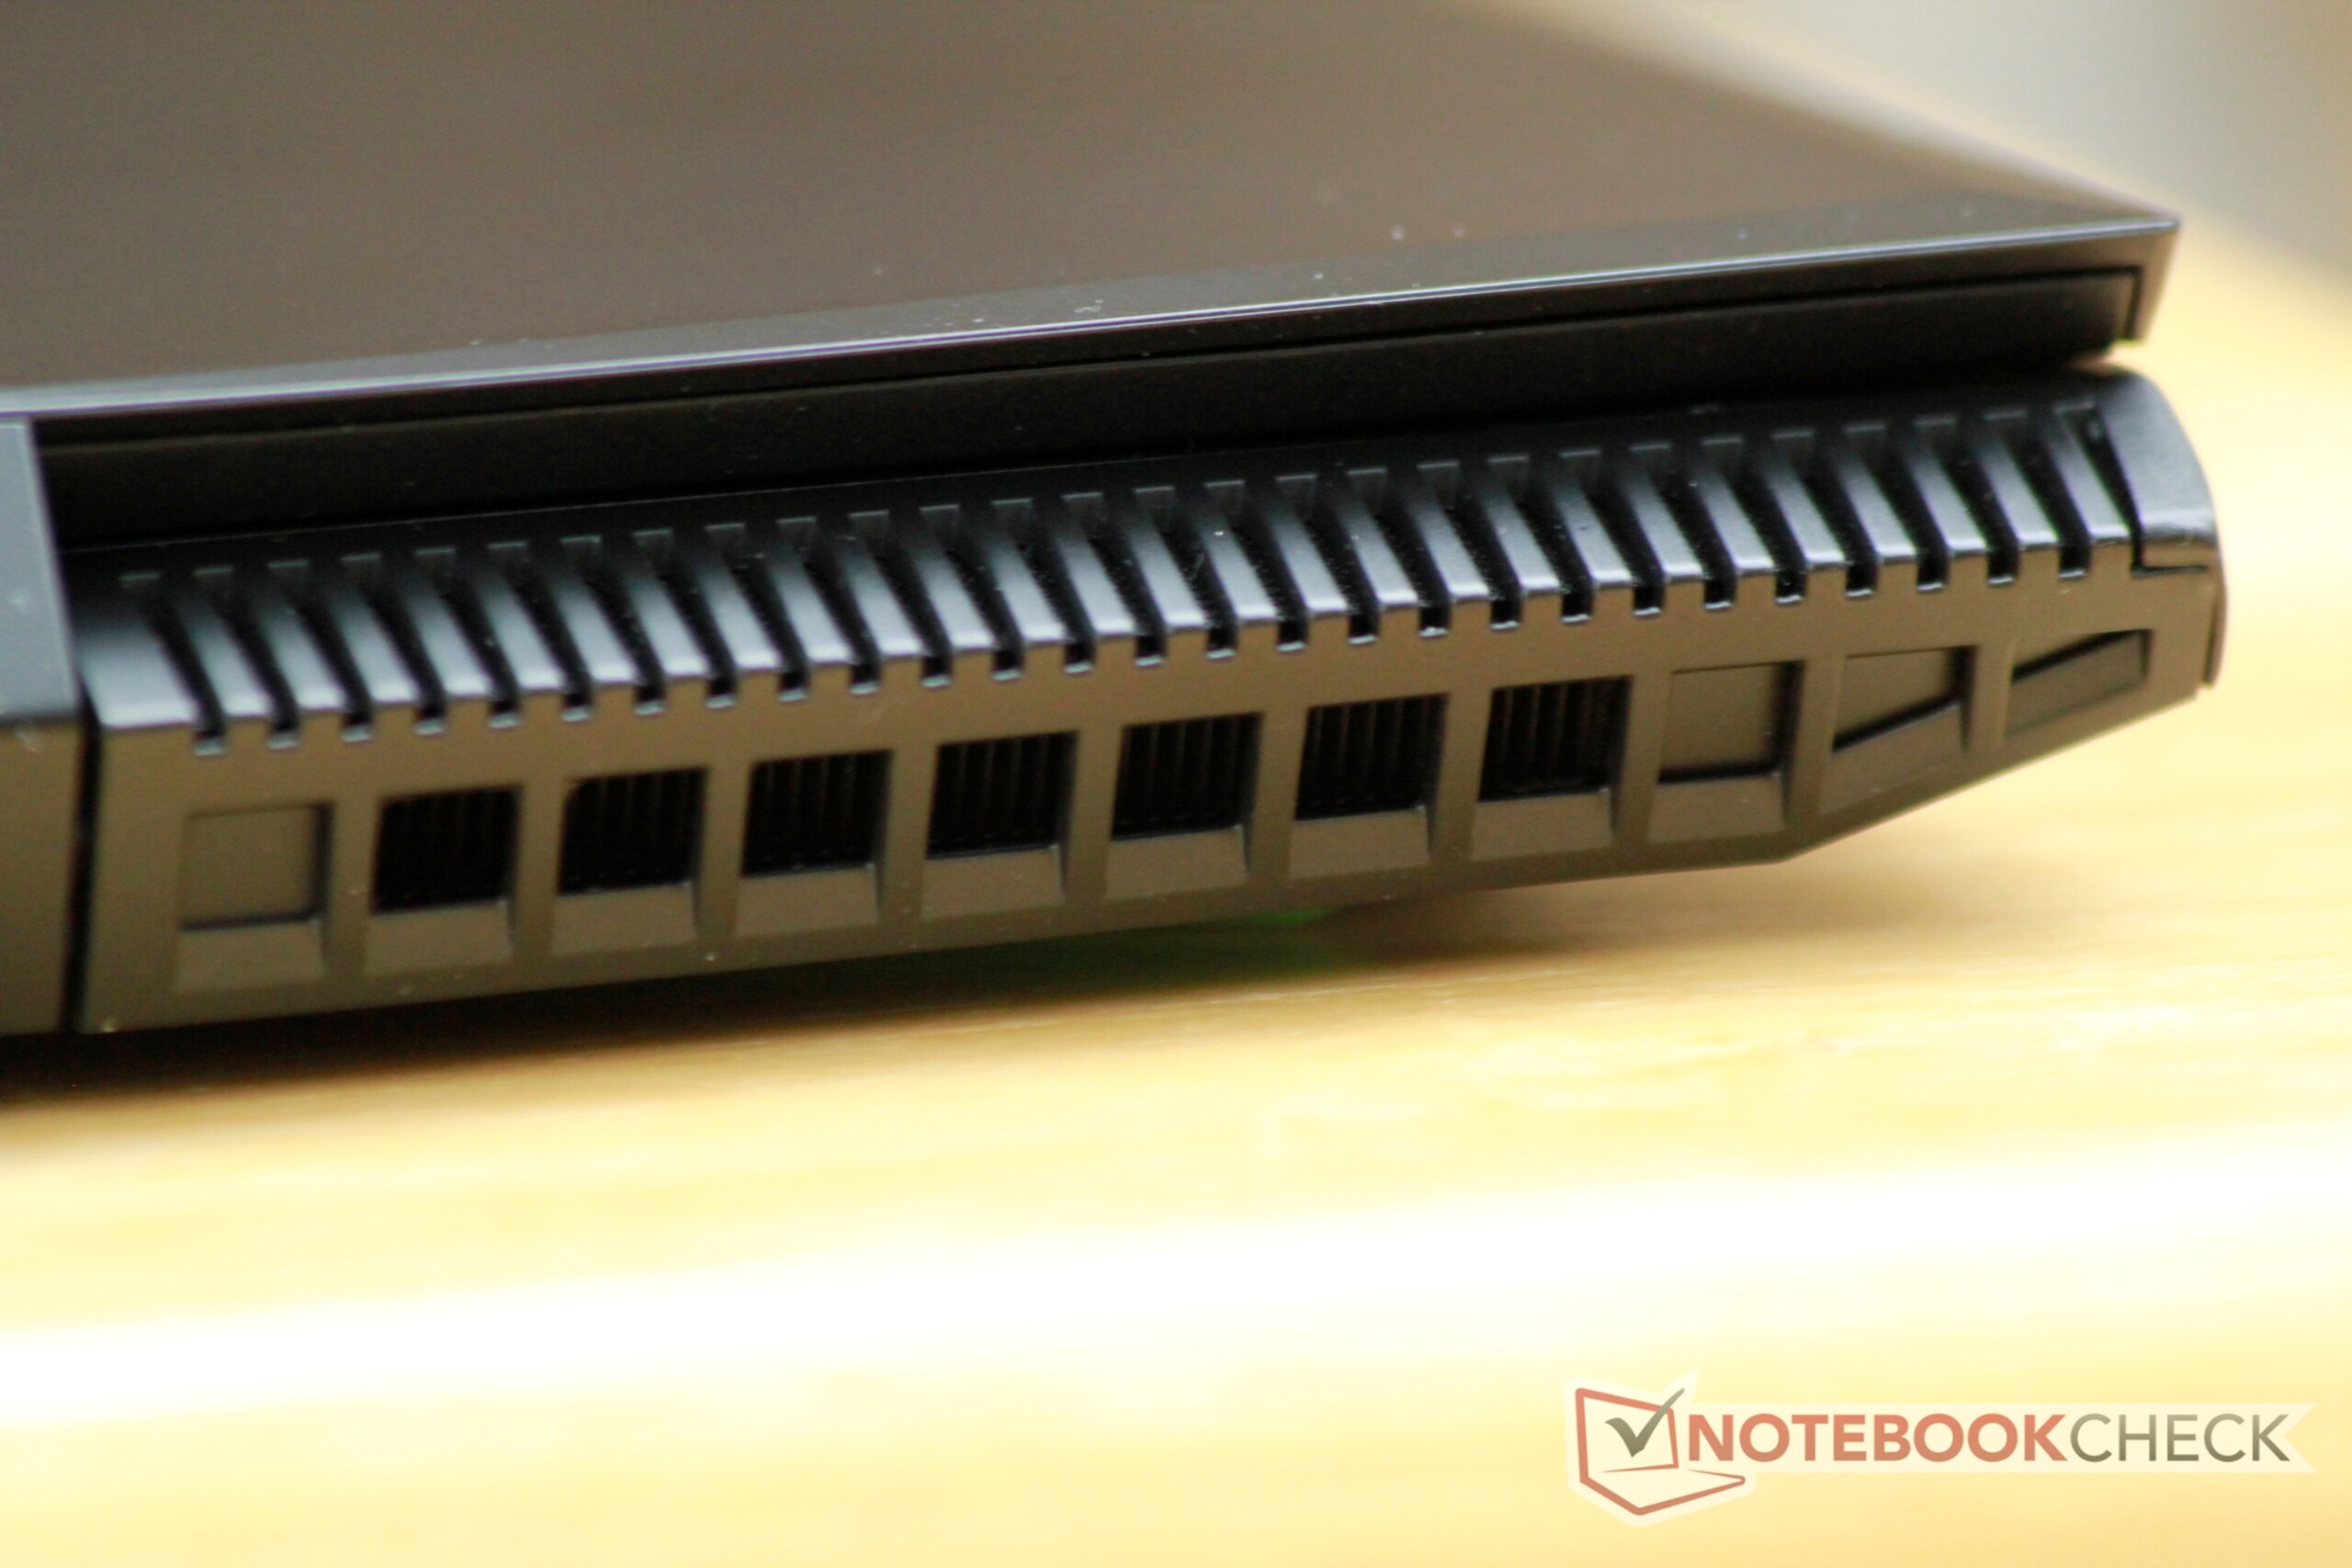
Os ventiladores de refrigeração em nossa unidade de teste também podem ser melhores, pois produzem muito ruído. Além disso, a carcaça em si não é tão estável quanto esperávamos. Por exemplo, a tampa da tela relativamente instável mostra que uma grande parte do orçamento foi gasta no interior do dispositivo e não no exterior. O Acer Nitro 5 é equipado com a mesma combinação de CPU/GPU, mas consegue obter mais desempenho desses componentes e, ao mesmo tempo, oferece durações significativamente melhores.
HP Pavilion Gaming 15-cx0003ng
- 12/12/2018 v6 (old)
Sascha Mölck
Price comparison
