Breve Análise do Portátil Lenovo Legion Y530 (Core i5-8300H, GTX 1050 Ti)
| Networking | |
| iperf3 transmit AX12 | |
| Alienware 15 R4 | |
| Razer Blade 15 GTX 1060 | |
| Lenovo Legion Y530-15ICH | |
| Dell G5 15 5587 | |
| Dell XPS 15 2018 i5 FHD 97Wh | |
| MSI GS63VR 7RG-005 | |
| Lenovo Legion Y520-15IKBA-80WY001VGE | |
| iperf3 receive AX12 | |
| MSI GS63VR 7RG-005 | |
| Alienware 15 R4 | |
| Razer Blade 15 GTX 1060 | |
| Lenovo Legion Y530-15ICH | |
| Dell XPS 15 2018 i5 FHD 97Wh | |
| Dell G5 15 5587 | |
| Lenovo Legion Y520-15IKBA-80WY001VGE | |
| |||||||||||||||||||||||||
iluminação: 88 %
iluminação com acumulador: 282.8 cd/m²
Contraste: 673:1 (Preto: 0.42 cd/m²)
ΔE ColorChecker Calman: 4.93 | ∀{0.5-29.43 Ø4.71}
calibrated: 4.07
ΔE Greyscale Calman: 3.8 | ∀{0.09-98 Ø4.96}
57% sRGB (Argyll 1.6.3 3D)
36% AdobeRGB 1998 (Argyll 1.6.3 3D)
39.58% AdobeRGB 1998 (Argyll 3D)
57.3% sRGB (Argyll 3D)
38.31% Display P3 (Argyll 3D)
Gamma: 2.449
CCT: 6112 K
| Lenovo Legion Y530-15ICH B156HAN02.1, IPS, 15.6", 1920x1080 | Dell XPS 15 2018 i5 FHD 97Wh Sharp SHP149A LQ156M1, LED IGZO IPS InfinityEdge, 15.6", 1920x1080 | Razer Blade 15 GTX 1060 LGD05C0, IPS, 15.6", 1920x1080 | Lenovo Legion Y520-15IKBA-80WY001VGE LG Philips LGD0533, IPS, 15.6", 1920x1080 | Alienware 15 R4 LG Philips LP156WF6 (LGD0540), IPS, 15.6", 1920x1080 | Dell G5 15 5587 LGD053F, 156WF6, IPS, 15.6", 1920x1080 | MSI GS63VR 7RG-005 Chi Mei N156HHE-GA1 (CMN15F4), TN LED, 15.6", 1920x1080 | |
|---|---|---|---|---|---|---|---|
| Display | 70% | 65% | 3% | 60% | -0% | 111% | |
| Display P3 Coverage (%) | 38.31 | 66 72% | 64.4 68% | 39.53 3% | 65.7 71% | 38.13 0% | 91.6 139% |
| sRGB Coverage (%) | 57.3 | 96.5 68% | 93.4 63% | 59.2 3% | 86.4 51% | 56.8 -1% | 100 75% |
| AdobeRGB 1998 Coverage (%) | 39.58 | 66.7 69% | 65.5 65% | 40.86 3% | 63.1 59% | 39.47 0% | 86.6 119% |
| Response Times | -3% | 66% | 11% | 20% | 25% | 78% | |
| Response Time Grey 50% / Grey 80% * (ms) | 43.6 ? | 49 ? -12% | 13.6 ? 69% | 42 ? 4% | 37.6 ? 14% | 33 ? 24% | 10.4 ? 76% |
| Response Time Black / White * (ms) | 32.4 ? | 30 ? 7% | 12 ? 63% | 27 ? 17% | 24 ? 26% | 24 ? 26% | 6.6 ? 80% |
| PWM Frequency (Hz) | 961 ? | 24900 ? | 20830 ? | 25510 ? | |||
| Screen | 52% | 38% | -3% | 23% | -7% | 44% | |
| Brightness middle (cd/m²) | 282.8 | 413 46% | 304.3 8% | 243 -14% | 292 3% | 229 -19% | 269 -5% |
| Brightness (cd/m²) | 264 | 378 43% | 293 11% | 231 -12% | 278 5% | 224 -15% | 254 -4% |
| Brightness Distribution (%) | 88 | 86 -2% | 80 -9% | 87 -1% | 88 0% | 87 -1% | 85 -3% |
| Black Level * (cd/m²) | 0.42 | 0.29 31% | 0.38 10% | 0.24 43% | 0.29 31% | 0.28 33% | 0.21 50% |
| Contrast (:1) | 673 | 1424 112% | 801 19% | 1013 51% | 1007 50% | 818 22% | 1281 90% |
| Colorchecker dE 2000 * | 4.93 | 2.44 51% | 1.79 64% | 6.36 -29% | 4.9 1% | 6.1 -24% | 3 39% |
| Colorchecker dE 2000 max. * | 17.65 | 4.46 75% | 3.69 79% | 12.76 28% | 10.08 43% | 12.2 31% | 5.62 68% |
| Colorchecker dE 2000 calibrated * | 4.07 | 2.48 39% | 6.51 -60% | 2.27 44% | 6.12 -50% | ||
| Greyscale dE 2000 * | 3.8 | 2.48 35% | 1.1 71% | 5.63 -48% | 4.89 -29% | 5.68 -49% | 3.18 16% |
| Gamma | 2.449 90% | 2.43 91% | 2.27 97% | 2.47 89% | 2.36 93% | 2.4 92% | 2.25 98% |
| CCT | 6112 106% | 7006 93% | 6665 98% | 7411 88% | 7598 86% | 6989 93% | 7274 89% |
| Color Space (Percent of AdobeRGB 1998) (%) | 36 | 62 72% | 59.8 66% | 38 6% | 56 56% | 36 0% | 77 114% |
| Color Space (Percent of sRGB) (%) | 57 | 96 68% | 92.8 63% | 59 4% | 86 51% | 57 0% | 100 75% |
| Média Total (Programa/Configurações) | 40% /
48% | 56% /
47% | 4% /
-0% | 34% /
30% | 6% /
-1% | 78% /
62% |
* ... menor é melhor
Exibir tempos de resposta
| ↔ Tempo de resposta preto para branco | ||
|---|---|---|
| 32.4 ms ... ascensão ↗ e queda ↘ combinadas | ↗ 18 ms ascensão | 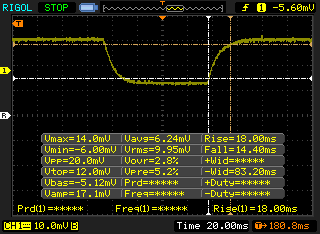 |
| ↘ 14.4 ms queda | ||
| A tela mostra taxas de resposta lentas em nossos testes e será insatisfatória para os jogadores. Em comparação, todos os dispositivos testados variam de 0.1 (mínimo) a 240 (máximo) ms. » 88 % de todos os dispositivos são melhores. Isso significa que o tempo de resposta medido é pior que a média de todos os dispositivos testados (19.8 ms). | ||
| ↔ Tempo de resposta 50% cinza a 80% cinza | ||
| 43.6 ms ... ascensão ↗ e queda ↘ combinadas | ↗ 19.2 ms ascensão | 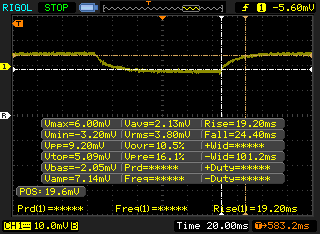 |
| ↘ 24.4 ms queda | ||
| A tela mostra taxas de resposta lentas em nossos testes e será insatisfatória para os jogadores. Em comparação, todos os dispositivos testados variam de 0.165 (mínimo) a 636 (máximo) ms. » 73 % de todos os dispositivos são melhores. Isso significa que o tempo de resposta medido é pior que a média de todos os dispositivos testados (31 ms). | ||
Cintilação da tela / PWM (modulação por largura de pulso)
| Tela tremeluzindo / PWM não detectado | 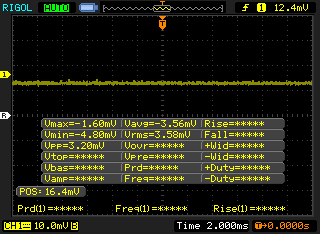 | ||
[pwm_comparison] Em comparação: 52 % de todos os dispositivos testados não usam PWM para escurecer a tela. Se PWM foi detectado, uma média de 7754 (mínimo: 5 - máximo: 343500) Hz foi medida. | |||
| Cinebench R15 | |
| CPU Single 64Bit | |
| Média da turma Gaming (188.8 - 350, n=106, últimos 2 anos) | |
| Alienware 15 R4 | |
| Razer Blade 15 GTX 1060 | |
| Dell G5 15 5587 | |
| Lenovo Legion Y530-15ICH | |
| Média Intel Core i5-8300H (151 - 174, n=17) | |
| Dell XPS 15 2018 i5 FHD 97Wh | |
| MSI GS63VR 7RG-005 | |
| Lenovo Legion Y520-15IKBA-80WY001VGE | |
| CPU Multi 64Bit | |
| Média da turma Gaming (1578 - 6330, n=105, últimos 2 anos) | |
| Alienware 15 R4 | |
| Razer Blade 15 GTX 1060 | |
| Dell XPS 15 2018 i5 FHD 97Wh | |
| Lenovo Legion Y530-15ICH | |
| Média Intel Core i5-8300H (609 - 850, n=17) | |
| MSI GS63VR 7RG-005 | |
| Dell G5 15 5587 | |
| Lenovo Legion Y520-15IKBA-80WY001VGE | |
| PCMark 8 | |
| Home Score Accelerated v2 | |
| Média da turma Gaming (n=1últimos 2 anos) | |
| Alienware 15 R4 | |
| Razer Blade 15 GTX 1060 | |
| Dell G5 15 5587 | |
| Lenovo Legion Y520-15IKBA-80WY001VGE | |
| MSI GS63VR 7RG-005 | |
| Lenovo Legion Y530-15ICH | |
| Média Intel Core i5-8300H, NVIDIA GeForce GTX 1050 Ti Mobile (3931 - 4253, n=4) | |
| Dell XPS 15 2018 i5 FHD 97Wh | |
| Work Score Accelerated v2 | |
| Razer Blade 15 GTX 1060 | |
| Alienware 15 R4 | |
| Lenovo Legion Y530-15ICH | |
| Dell G5 15 5587 | |
| Média Intel Core i5-8300H, NVIDIA GeForce GTX 1050 Ti Mobile (5208 - 5369, n=4) | |
| Dell XPS 15 2018 i5 FHD 97Wh | |
| MSI GS63VR 7RG-005 | |
| Lenovo Legion Y520-15IKBA-80WY001VGE | |
| Média da turma Gaming (n=1últimos 2 anos) | |
| PCMark 8 Home Score Accelerated v2 | 4129 pontos | |
| PCMark 8 Work Score Accelerated v2 | 5369 pontos | |
| PCMark 10 Score | 4812 pontos | |
Ajuda | ||
| Lenovo Legion Y530-15ICH Toshiba KBG30ZMT128G | Dell XPS 15 2018 i5 FHD 97Wh Lite-On CA3-8D256-Q11 | Razer Blade 15 GTX 1060 Samsung SSD PM981 MZVLB512HAJQ | Alienware 15 R4 Toshiba XG5 KXG50ZNV256G | Dell G5 15 5587 SK hynix SC311 M.2 | MSI GS63VR 7RG-005 Samsung SM961 MZVPW256HEGL | Lenovo Legion Y520-15IKBN 80WK0042GE Samsung PM961 NVMe MZVLW128HEGR | Média Toshiba KBG30ZMT128G | |
|---|---|---|---|---|---|---|---|---|
| AS SSD | -17% | 550% | 111% | 16% | 392% | 138% | 0% | |
| Copy Game MB/s (MB/s) | 465.9 | 882 | 130.9 | 892 | 197.3 | 122.3 ? | ||
| Copy Program MB/s (MB/s) | 117.2 | 370.7 | 95.7 | 317.5 | 127.3 | 122.6 ? | ||
| Copy ISO MB/s (MB/s) | 632 | 1452 | 146.6 | 1698 | 497.6 | 174.8 ? | ||
| Score Total (Points) | 838 | 750 -11% | 4095 389% | 1416 69% | 557 -34% | 3848 359% | 1434 71% | 656 ? -22% |
| Score Write (Points) | 128 | 58 -55% | 1955 1427% | 435 240% | 199 55% | 1185 826% | 368 188% | 149 ? 16% |
| Score Read (Points) | 497 | 492 -1% | 1407 183% | 714 44% | 240 -52% | 1795 261% | 746 50% | 360 ? -28% |
| Access Time Write * (ms) | 0.287 | 0.889 -210% | 0.037 87% | 0.053 82% | 0.066 77% | 0.03 90% | 0.032 89% | 0.27 ? 6% |
| Access Time Read * (ms) | 0.626 | 0.086 86% | 0.05 92% | 0.116 81% | 0.128 80% | 0.039 94% | 0.07 89% | 0.3803 ? 39% |
| 4K-64 Write (MB/s) | 78.9 | 19.19 -76% | 1664 2009% | 310.5 294% | 112.4 42% | 932 1081% | 158.6 101% | 75.1 ? -5% |
| 4K-64 Read (MB/s) | 335.3 | 301.8 -10% | 1177 251% | 437.4 30% | 164.1 -51% | 1506 349% | 463.2 38% | 222 ? -34% |
| 4K Write (MB/s) | 35.74 | 5.12 -86% | 99.2 178% | 94.8 165% | 62.2 74% | 124.7 249% | 127.9 258% | 60.8 ? 70% |
| 4K Read (MB/s) | 38.71 | 32.5 -16% | 48.56 25% | 32.87 -15% | 24.44 -37% | 51 32% | 46.98 21% | 30.3 ? -22% |
| Seq Write (MB/s) | 131.6 | 340.3 159% | 1917 1357% | 300.4 128% | 243.7 85% | 1281 873% | 814 519% | 122.4 ? -7% |
| Seq Read (MB/s) | 1231 | 1574 28% | 1820 48% | 2441 98% | 511 -58% | 2382 94% | 2362 92% | 1074 ? -13% |
* ... menor é melhor

| 3DMark 11 | |
| 1280x720 Performance GPU | |
| Média da turma Gaming (21841 - 80022, n=104, últimos 2 anos) | |
| Alienware 15 R4 | |
| MSI GS63VR 7RG-005 | |
| Razer Blade 15 GTX 1060 | |
| Dell G5 15 5587 | |
| Lenovo Legion Y530-15ICH | |
| Média NVIDIA GeForce GTX 1050 Ti Mobile (8304 - 10402, n=36) | |
| Lenovo Legion Y520-15IKBA-80WY001VGE | |
| Dell XPS 15 2018 i5 FHD 97Wh | |
| 1280x720 Performance Combined | |
| Média da turma Gaming (10258 - 30851, n=104, últimos 2 anos) | |
| Alienware 15 R4 | |
| Razer Blade 15 GTX 1060 | |
| Dell G5 15 5587 | |
| Média NVIDIA GeForce GTX 1050 Ti Mobile (6104 - 9172, n=35) | |
| Dell XPS 15 2018 i5 FHD 97Wh | |
| MSI GS63VR 7RG-005 | |
| Lenovo Legion Y530-15ICH | |
| Lenovo Legion Y520-15IKBA-80WY001VGE | |
| 3DMark | |
| 1280x720 Cloud Gate Standard Graphics | |
| Média da turma Gaming (86886 - 223650, n=60, últimos 2 anos) | |
| Alienware 15 R4 | |
| MSI GS63VR 7RG-005 | |
| Razer Blade 15 GTX 1060 | |
| Dell G5 15 5587 | |
| Lenovo Legion Y530-15ICH | |
| Média NVIDIA GeForce GTX 1050 Ti Mobile (43721 - 53978, n=37) | |
| Dell XPS 15 2018 i5 FHD 97Wh | |
| Lenovo Legion Y520-15IKBA-80WY001VGE | |
| 1920x1080 Fire Strike Graphics | |
| Média da turma Gaming (12242 - 62849, n=115, últimos 2 anos) | |
| Alienware 15 R4 | |
| MSI GS63VR 7RG-005 | |
| Razer Blade 15 GTX 1060 | |
| Dell G5 15 5587 | |
| Média NVIDIA GeForce GTX 1050 Ti Mobile (6792 - 8376, n=38) | |
| Lenovo Legion Y530-15ICH | |
| Dell XPS 15 2018 i5 FHD 97Wh | |
| Lenovo Legion Y520-15IKBA-80WY001VGE | |
| 1920x1080 Ice Storm Extreme Graphics | |
| Média da turma Gaming (544538 - 659227, n=5, últimos 2 anos) | |
| MSI GS63VR 7RG-005 | |
| Média NVIDIA GeForce GTX 1050 Ti Mobile (71804 - 221173, n=18) | |
| Dell G5 15 5587 | |
| 3DMark 11 Performance | 9285 pontos | |
| 3DMark Cloud Gate Standard Score | 22978 pontos | |
| 3DMark Fire Strike Score | 6809 pontos | |
Ajuda | ||
| BioShock Infinite | |
| 1280x720 Very Low Preset (classificar por valor) | |
| Lenovo Legion Y530-15ICH | |
| Razer Blade 15 GTX 1060 | |
| Lenovo Legion Y520-15IKBA-80WY001VGE | |
| Dell G5 15 5587 | |
| MSI GS63VR 7RG-005 | |
| Média NVIDIA GeForce GTX 1050 Ti Mobile (168.9 - 271, n=18) | |
| 1366x768 Medium Preset (classificar por valor) | |
| Lenovo Legion Y530-15ICH | |
| Razer Blade 15 GTX 1060 | |
| Lenovo Legion Y520-15IKBA-80WY001VGE | |
| Dell G5 15 5587 | |
| MSI GS63VR 7RG-005 | |
| Média NVIDIA GeForce GTX 1050 Ti Mobile (154.1 - 217, n=20) | |
| 1366x768 High Preset (classificar por valor) | |
| Lenovo Legion Y530-15ICH | |
| Razer Blade 15 GTX 1060 | |
| Lenovo Legion Y520-15IKBA-80WY001VGE | |
| Dell G5 15 5587 | |
| MSI GS63VR 7RG-005 | |
| Média NVIDIA GeForce GTX 1050 Ti Mobile (147 - 195.4, n=21) | |
| 1920x1080 Ultra Preset, DX11 (DDOF) (classificar por valor) | |
| Lenovo Legion Y530-15ICH | |
| Dell XPS 15 2018 i5 FHD 97Wh | |
| Razer Blade 15 GTX 1060 | |
| Lenovo Legion Y520-15IKBA-80WY001VGE | |
| Dell G5 15 5587 | |
| MSI GS63VR 7RG-005 | |
| Média NVIDIA GeForce GTX 1050 Ti Mobile (61 - 97, n=23) | |
| Metro: Last Light | |
| 1024x768 Low (DX10) AF:4x (classificar por valor) | |
| Lenovo Legion Y530-15ICH | |
| Média NVIDIA GeForce GTX 1050 Ti Mobile (113 - 115, n=2) | |
| 1366x768 Medium (DX10) AF:4x (classificar por valor) | |
| Lenovo Legion Y530-15ICH | |
| Média NVIDIA GeForce GTX 1050 Ti Mobile (106 - 108, n=2) | |
| 1366x768 High (DX11) AF:16x (classificar por valor) | |
| Lenovo Legion Y530-15ICH | |
| Média NVIDIA GeForce GTX 1050 Ti Mobile (87 - 98, n=2) | |
| 1920x1080 Very High (DX11) AF:16x (classificar por valor) | |
| Lenovo Legion Y530-15ICH | |
| Média NVIDIA GeForce GTX 1050 Ti Mobile (47 - 59, n=3) | |
| The Witcher 3 - 1920x1080 Ultra Graphics & Postprocessing (HBAO+) (classificar por valor) | |
| Lenovo Legion Y530-15ICH | |
| Dell XPS 15 2018 i5 FHD 97Wh | |
| Razer Blade 15 GTX 1060 | |
| Lenovo Legion Y520-15IKBA-80WY001VGE | |
| Alienware 15 R4 | |
| Dell G5 15 5587 | |
| MSI GS63VR 7RG-005 | |
| Média NVIDIA GeForce GTX 1050 Ti Mobile (14 - 38, n=31) | |
| Média da turma Gaming (104.7 - 240, n=7, últimos 2 anos) | |
| Rise of the Tomb Raider | |
| 1024x768 Lowest Preset (classificar por valor) | |
| Lenovo Legion Y530-15ICH | |
| Lenovo Legion Y520-15IKBA-80WY001VGE | |
| Dell G5 15 5587 | |
| Média NVIDIA GeForce GTX 1050 Ti Mobile (83.8 - 134.9, n=9) | |
| 1366x768 Medium Preset AF:2x (classificar por valor) | |
| Lenovo Legion Y530-15ICH | |
| Dell XPS 15 2018 i5 FHD 97Wh | |
| Lenovo Legion Y520-15IKBA-80WY001VGE | |
| Dell G5 15 5587 | |
| Média NVIDIA GeForce GTX 1050 Ti Mobile (60 - 95, n=12) | |
| 1920x1080 High Preset AA:FX AF:4x (classificar por valor) | |
| Lenovo Legion Y530-15ICH | |
| Dell XPS 15 2018 i5 FHD 97Wh | |
| Lenovo Legion Y520-15IKBA-80WY001VGE | |
| Dell G5 15 5587 | |
| Média NVIDIA GeForce GTX 1050 Ti Mobile (33 - 51.3, n=14) | |
| 1920x1080 Very High Preset AA:FX AF:16x (classificar por valor) | |
| Lenovo Legion Y530-15ICH | |
| Dell XPS 15 2018 i5 FHD 97Wh | |
| Lenovo Legion Y520-15IKBA-80WY001VGE | |
| Dell G5 15 5587 | |
| Média NVIDIA GeForce GTX 1050 Ti Mobile (27.8 - 40.7, n=16) | |
| baixo | média | alto | ultra | |
|---|---|---|---|---|
| BioShock Infinite (2013) | 238 | 201 | 155 | 61 |
| Metro: Last Light (2013) | 115 | 108 | 98 | 47 |
| The Witcher 3 (2015) | 37 | |||
| Rise of the Tomb Raider (2016) | 88 | 60 | 33 | 29 |
Barulho
| Ocioso |
| 28 / 28 / 28.5 dB |
| Carga |
| 34.9 / 49.6 dB |
 | ||
30 dB silencioso 40 dB(A) audível 50 dB(A) ruidosamente alto |
||
min: | ||
| Lenovo Legion Y530-15ICH GeForce GTX 1050 Ti Mobile, i5-8300H, Toshiba KBG30ZMT128G | Dell XPS 15 2018 i5 FHD 97Wh GeForce GTX 1050 Mobile, i5-8300H, Lite-On CA3-8D256-Q11 | Razer Blade 15 GTX 1060 GeForce GTX 1060 Max-Q, i7-8750H, Samsung SSD PM981 MZVLB512HAJQ | Lenovo Legion Y520-15IKBA-80WY001VGE Radeon RX 560 (Laptop), i5-7300HQ, Seagate Mobile HDD 1TB ST1000LM035 | Alienware 15 R4 GeForce GTX 1070 Mobile, i9-8950HK, Toshiba XG5 KXG50ZNV256G | Dell G5 15 5587 GeForce GTX 1060 Max-Q, i5-8300H, SK hynix SC311 M.2 | MSI GS63VR 7RG-005 GeForce GTX 1070 Max-Q, i7-7700HQ, Samsung SM961 MZVPW256HEGL | |
|---|---|---|---|---|---|---|---|
| Noise | -4% | -9% | -3% | -26% | -7% | -12% | |
| desligado / ambiente * (dB) | 28 | 30.3 -8% | 28.1 -0% | 30.3 -8% | 29 -4% | 30.3 -8% | 30 -7% |
| Idle Minimum * (dB) | 28 | 30.3 -8% | 28.1 -0% | 31.3 -12% | 32 -14% | 31.1 -11% | 31 -11% |
| Idle Average * (dB) | 28 | 30.3 -8% | 33 -18% | 31.3 -12% | 33 -18% | 31.1 -11% | 34 -21% |
| Idle Maximum * (dB) | 28.5 | 30.3 -6% | 33.5 -18% | 31.3 -10% | 50 -75% | 34.2 -20% | 35 -23% |
| Load Average * (dB) | 34.9 | 37.1 -6% | 42.2 -21% | 32.8 6% | 50 -43% | 34.9 -0% | 42 -20% |
| Witcher 3 ultra * (dB) | 40 | 43.3 -8% | 45.3 -13% | 41.2 -3% | 51 -27% | 42.7 -7% | 44 -10% |
| Load Maximum * (dB) | 49.6 | 43 13% | 45.7 8% | 39 21% | 51 -3% | 44 11% | 46 7% |
* ... menor é melhor
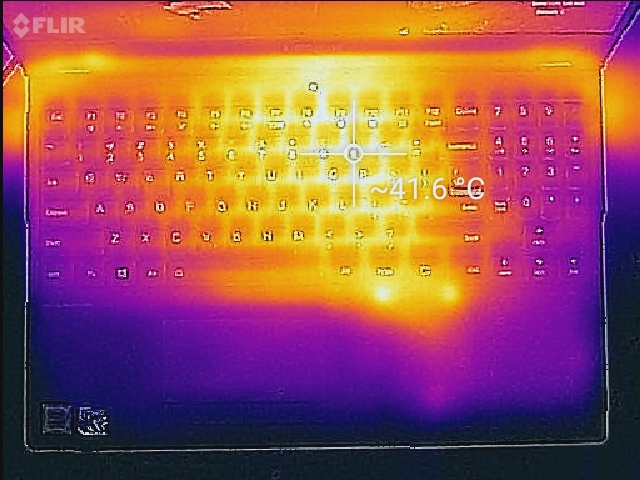
(±) A temperatura máxima no lado superior é 42.8 °C / 109 F, em comparação com a média de 40.4 °C / 105 F , variando de 21.2 a 68.8 °C para a classe Gaming.
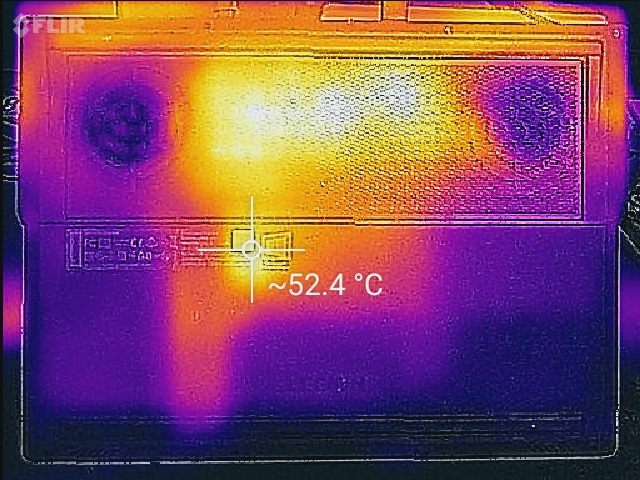
(-) A parte inferior aquece até um máximo de 52 °C / 126 F, em comparação com a média de 43.2 °C / 110 F
(+) Em uso inativo, a temperatura média para o lado superior é 27.4 °C / 81 F, em comparação com a média do dispositivo de 33.9 °C / ### class_avg_f### F.
(+) Jogando The Witcher 3, a temperatura média para o lado superior é 30.9 °C / 88 F, em comparação com a média do dispositivo de 33.9 °C / ## #class_avg_f### F.
(+) Os apoios para as mãos e o touchpad são mais frios que a temperatura da pele, com um máximo de 31 °C / 87.8 F e, portanto, são frios ao toque.
(-) A temperatura média da área do apoio para as mãos de dispositivos semelhantes foi 28.8 °C / 83.8 F (-2.2 °C / -4 F).
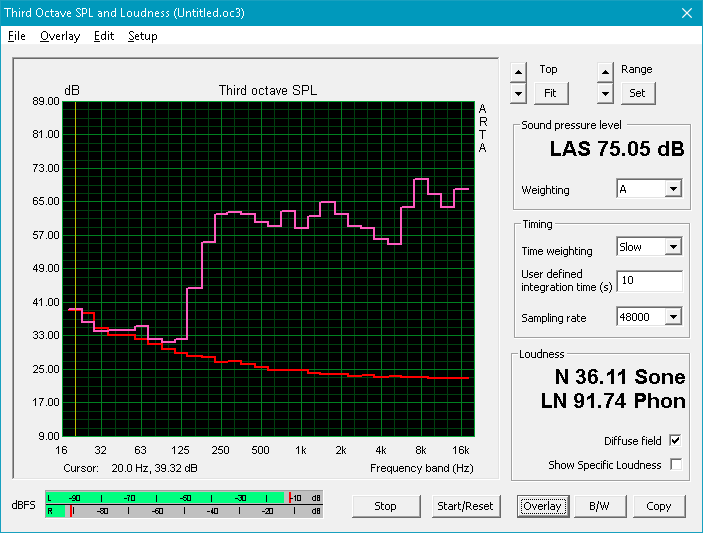
Lenovo Legion Y530-15ICH análise de áudio
(±) | o volume do alto-falante é médio, mas bom (###valor### dB)
Graves 100 - 315Hz
(±) | graves reduzidos - em média 14% menor que a mediana
(±) | a linearidade dos graves é média (14.1% delta para a frequência anterior)
Médios 400 - 2.000 Hz
(+) | médios equilibrados - apenas 1.5% longe da mediana
(+) | médios são lineares (6.7% delta para frequência anterior)
Altos 2 - 16 kHz
(+) | agudos equilibrados - apenas 4.8% longe da mediana
(±) | a linearidade dos máximos é média (10% delta para frequência anterior)
Geral 100 - 16.000 Hz
(±) | a linearidade do som geral é média (18.9% diferença em relação à mediana)
Comparado com a mesma classe
» 63% de todos os dispositivos testados nesta classe foram melhores, 8% semelhantes, 29% piores
» O melhor teve um delta de 6%, a média foi 18%, o pior foi 132%
Comparado com todos os dispositivos testados
» 44% de todos os dispositivos testados foram melhores, 8% semelhantes, 48% piores
» O melhor teve um delta de 4%, a média foi 23%, o pior foi 134%
Dell XPS 15 2018 i5 FHD 97Wh análise de áudio
(±) | o volume do alto-falante é médio, mas bom (###valor### dB)
Graves 100 - 315Hz
(±) | graves reduzidos - em média 10.9% menor que a mediana
(+) | o baixo é linear (4.9% delta para a frequência anterior)
Médios 400 - 2.000 Hz
(±) | médios mais altos - em média 6.8% maior que a mediana
(+) | médios são lineares (6.8% delta para frequência anterior)
Altos 2 - 16 kHz
(+) | agudos equilibrados - apenas 3.7% longe da mediana
(+) | os máximos são lineares (6.9% delta da frequência anterior)
Geral 100 - 16.000 Hz
(±) | a linearidade do som geral é média (16.6% diferença em relação à mediana)
Comparado com a mesma classe
» 44% de todos os dispositivos testados nesta classe foram melhores, 7% semelhantes, 50% piores
» O melhor teve um delta de 5%, a média foi 17%, o pior foi 45%
Comparado com todos os dispositivos testados
» 29% de todos os dispositivos testados foram melhores, 6% semelhantes, 65% piores
» O melhor teve um delta de 4%, a média foi 23%, o pior foi 134%
| desligado | |
| Ocioso | |
| Carga |
|
Key:
min: | |
| Lenovo Legion Y530-15ICH i5-8300H, GeForce GTX 1050 Ti Mobile, Toshiba KBG30ZMT128G, IPS, 1920x1080, 15.6" | Dell XPS 15 2018 i5 FHD 97Wh i5-8300H, GeForce GTX 1050 Mobile, Lite-On CA3-8D256-Q11, LED IGZO IPS InfinityEdge, 1920x1080, 15.6" | Razer Blade 15 GTX 1060 i7-8750H, GeForce GTX 1060 Max-Q, Samsung SSD PM981 MZVLB512HAJQ, IPS, 1920x1080, 15.6" | Lenovo Legion Y520-15IKBA-80WY001VGE i5-7300HQ, Radeon RX 560 (Laptop), Seagate Mobile HDD 1TB ST1000LM035, IPS, 1920x1080, 15.6" | Alienware 15 R4 i9-8950HK, GeForce GTX 1070 Mobile, Toshiba XG5 KXG50ZNV256G, IPS, 1920x1080, 15.6" | Dell G5 15 5587 i5-8300H, GeForce GTX 1060 Max-Q, SK hynix SC311 M.2, IPS, 1920x1080, 15.6" | MSI GS63VR 7RG-005 i7-7700HQ, GeForce GTX 1070 Max-Q, Samsung SM961 MZVPW256HEGL, TN LED, 1920x1080, 15.6" | |
|---|---|---|---|---|---|---|---|
| Power Consumption | 29% | -63% | 17% | -143% | 4% | -53% | |
| Idle Minimum * (Watt) | 4.5 | 2.9 36% | 14.9 -231% | 4.7 -4% | 23 -411% | 4.9 -9% | 12 -167% |
| Idle Average * (Watt) | 10 | 5.8 42% | 17.5 -75% | 7.8 22% | 26 -160% | 8.5 15% | 16 -60% |
| Idle Maximum * (Watt) | 13.8 | 7.5 46% | 19.2 -39% | 8.4 39% | 30 -117% | 9.1 34% | 21 -52% |
| Load Average * (Watt) | 92.5 | 77.5 16% | 103.2 -12% | 76.5 17% | 111 -20% | 90.7 2% | 85 8% |
| Witcher 3 ultra * (Watt) | 108.1 | 84 22% | 123.1 -14% | 93 14% | 182 -68% | 110 -2% | 128 -18% |
| Load Maximum * (Watt) | 123.2 | 107 13% | 132.7 -8% | 106 14% | 222 -80% | 144 -17% | 162 -31% |
* ... menor é melhor
| Lenovo Legion Y530-15ICH i5-8300H, GeForce GTX 1050 Ti Mobile, 52.5 Wh | Dell XPS 15 2018 i5 FHD 97Wh i5-8300H, GeForce GTX 1050 Mobile, 97 Wh | Razer Blade 15 GTX 1060 i7-8750H, GeForce GTX 1060 Max-Q, 80 Wh | Lenovo Legion Y520-15IKBA-80WY001VGE i5-7300HQ, Radeon RX 560 (Laptop), 45 Wh | Alienware 15 R4 i9-8950HK, GeForce GTX 1070 Mobile, 99 Wh | Dell G5 15 5587 i5-8300H, GeForce GTX 1060 Max-Q, 56 Wh | MSI GS63VR 7RG-005 i7-7700HQ, GeForce GTX 1070 Max-Q, 52.4 Wh | |
|---|---|---|---|---|---|---|---|
| Duração da bateria | 283% | 63% | 37% | 24% | 59% | -5% | |
| WiFi v1.3 (h) | 4.1 | 15.7 283% | 6.7 63% | 5.6 37% | 5.1 24% | 6.5 59% | 3.9 -5% |
| Witcher 3 ultra (h) | 1 |
Pro
Contra
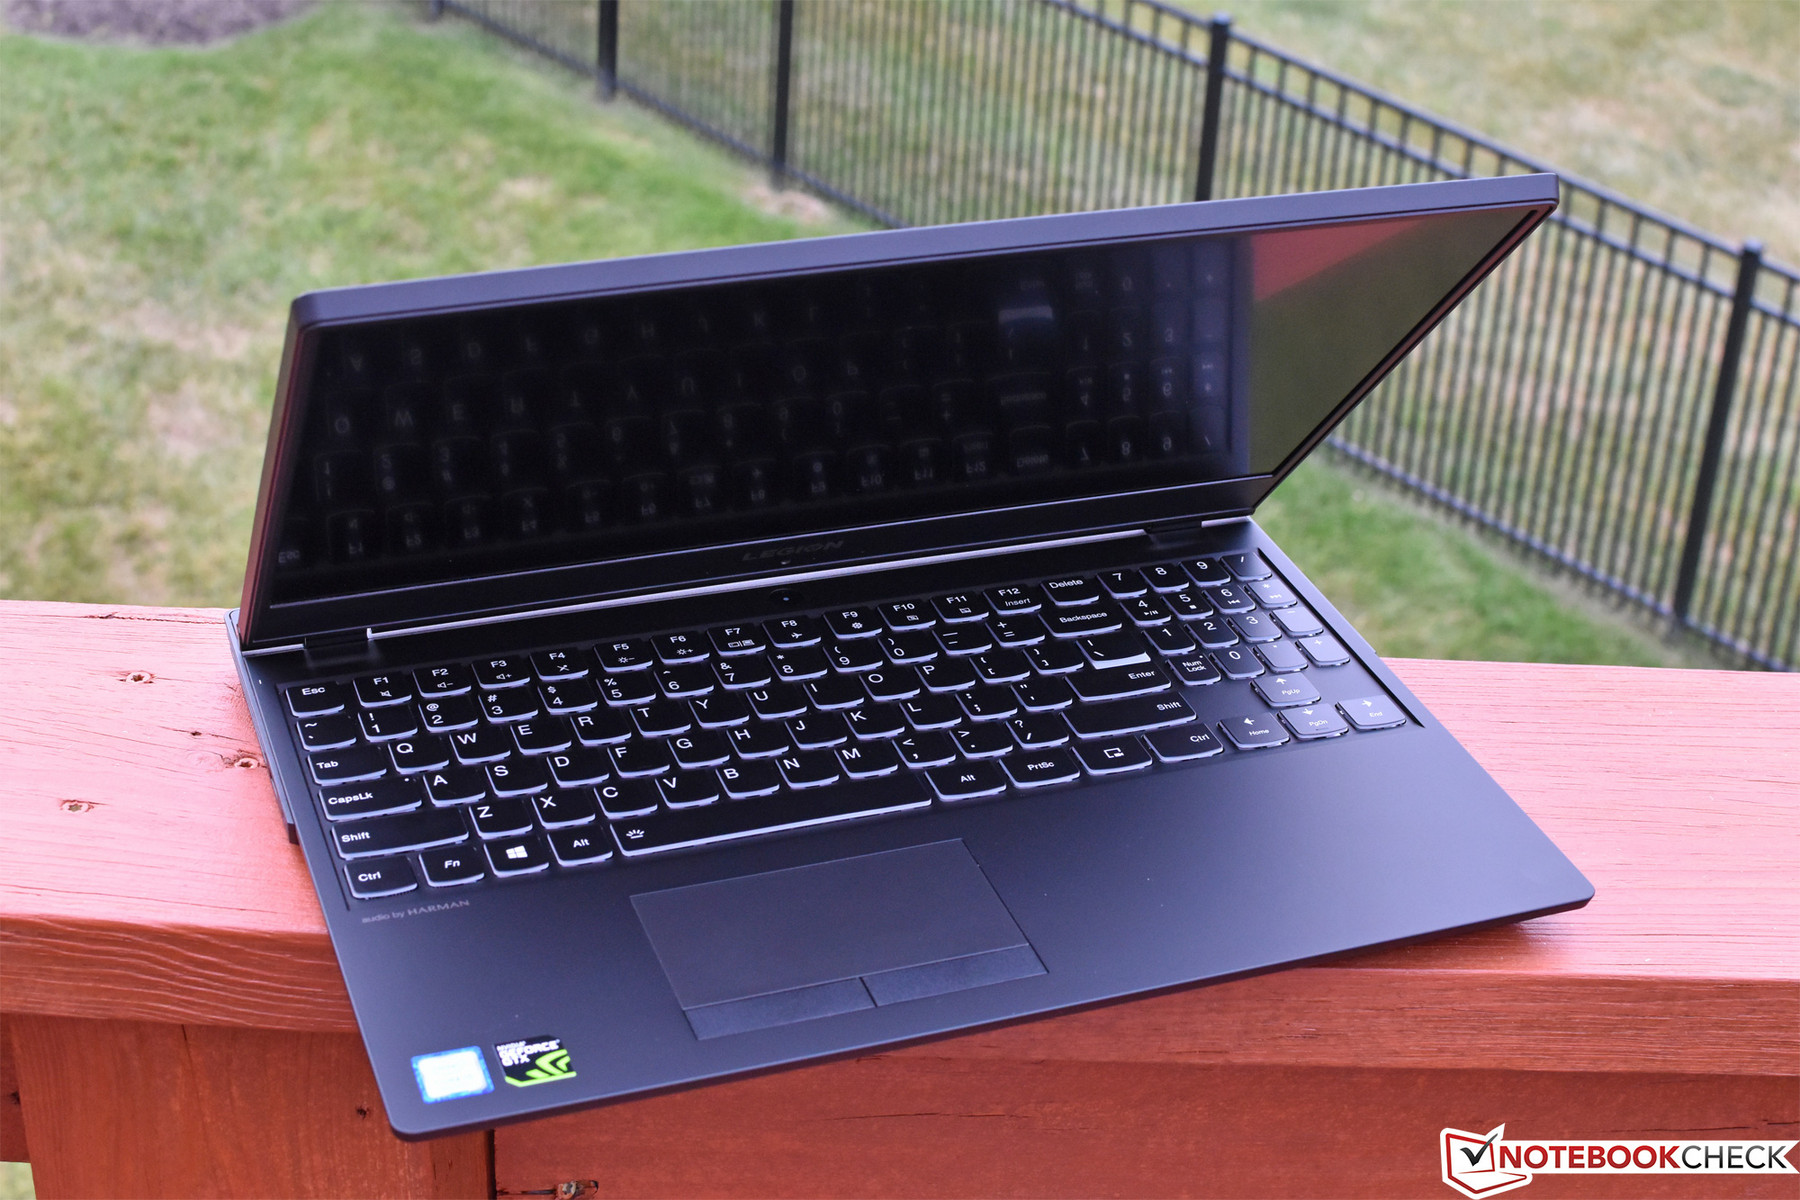
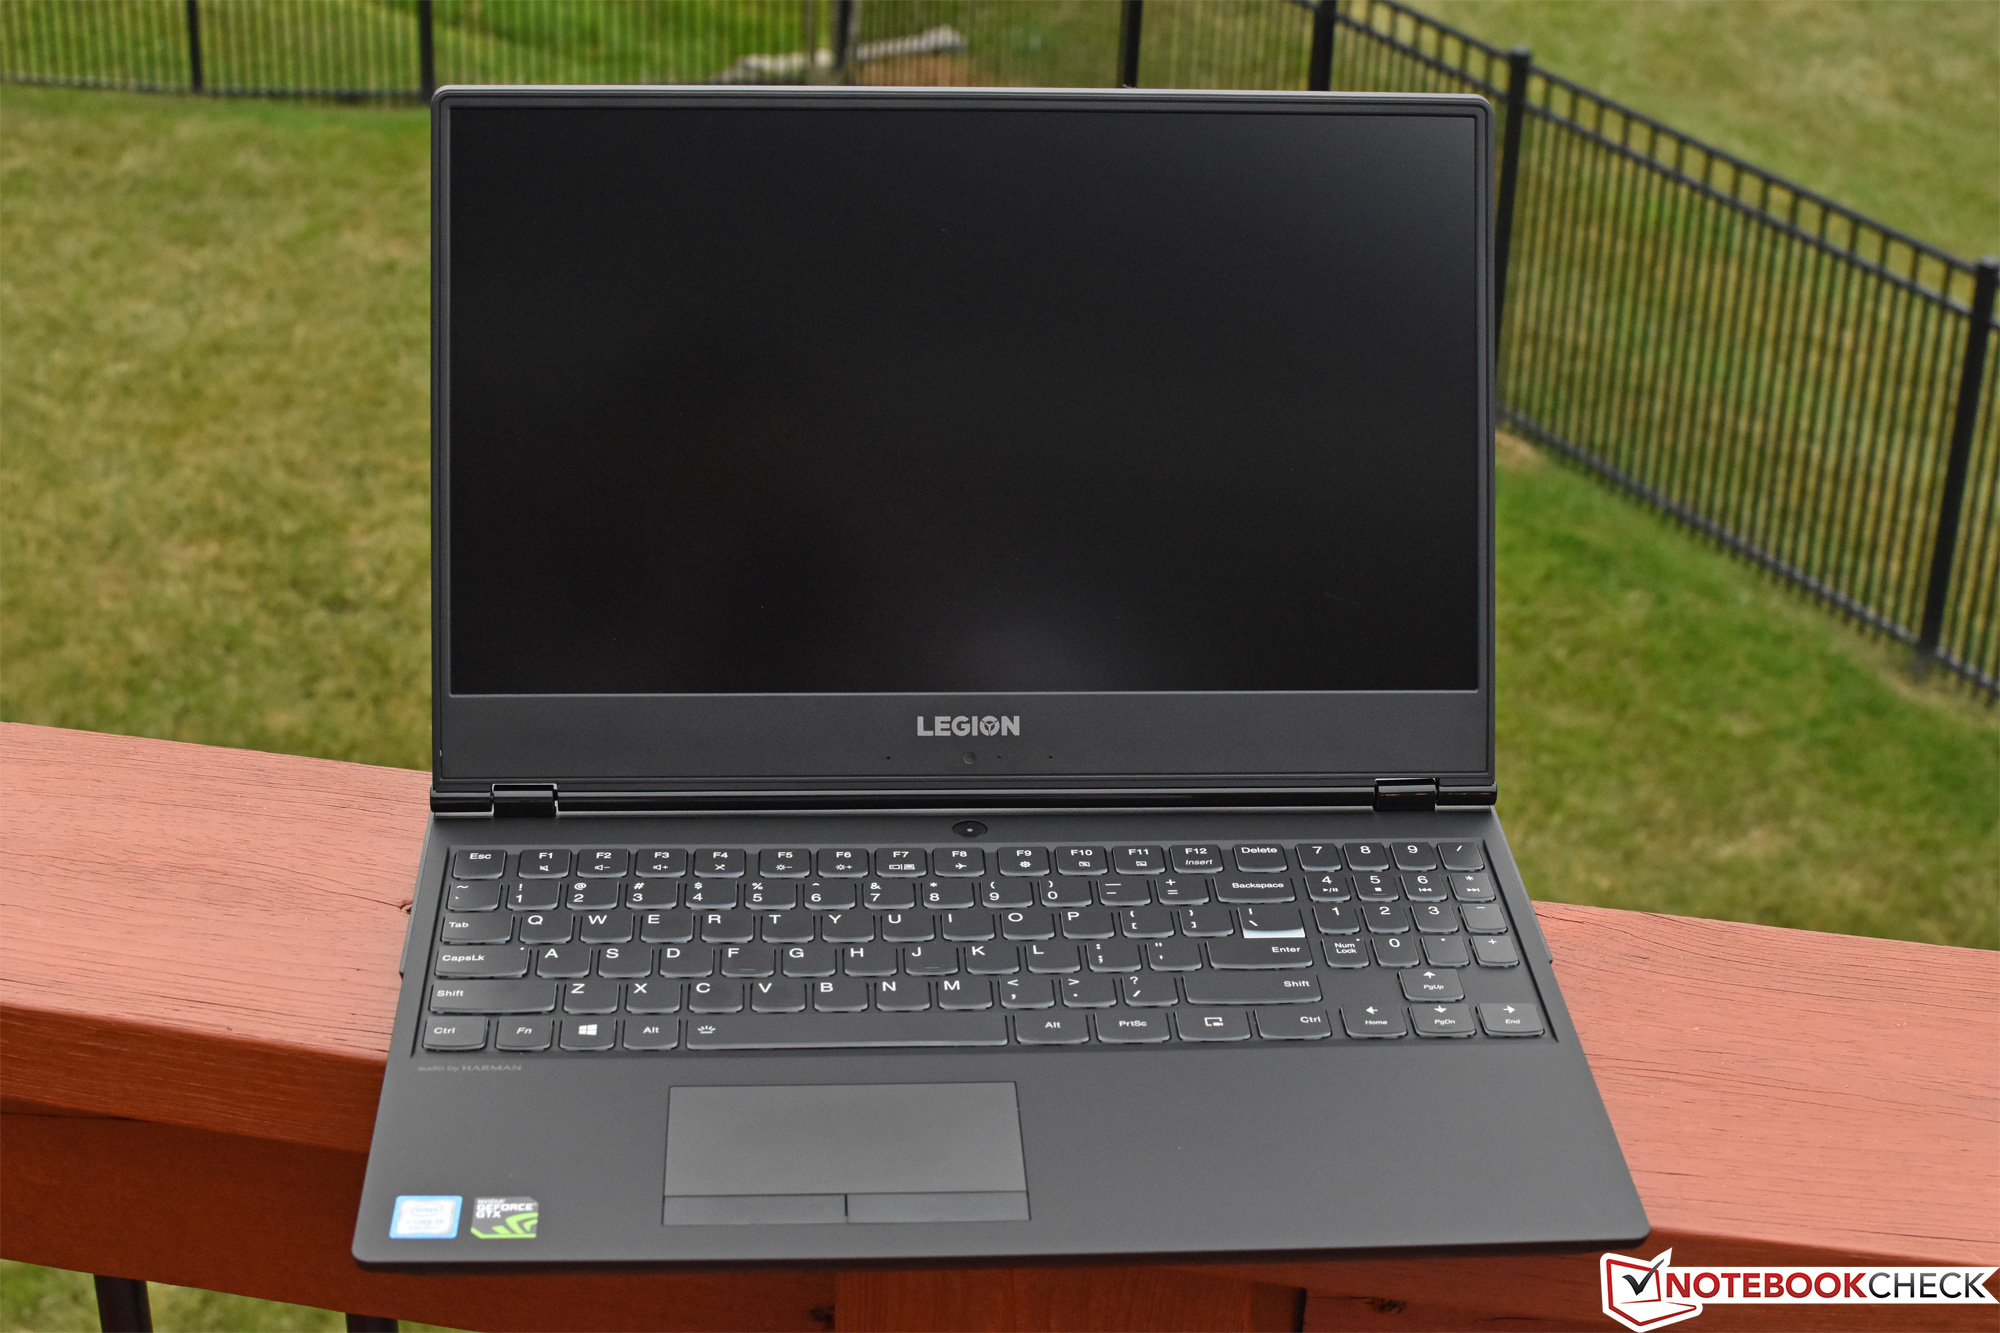
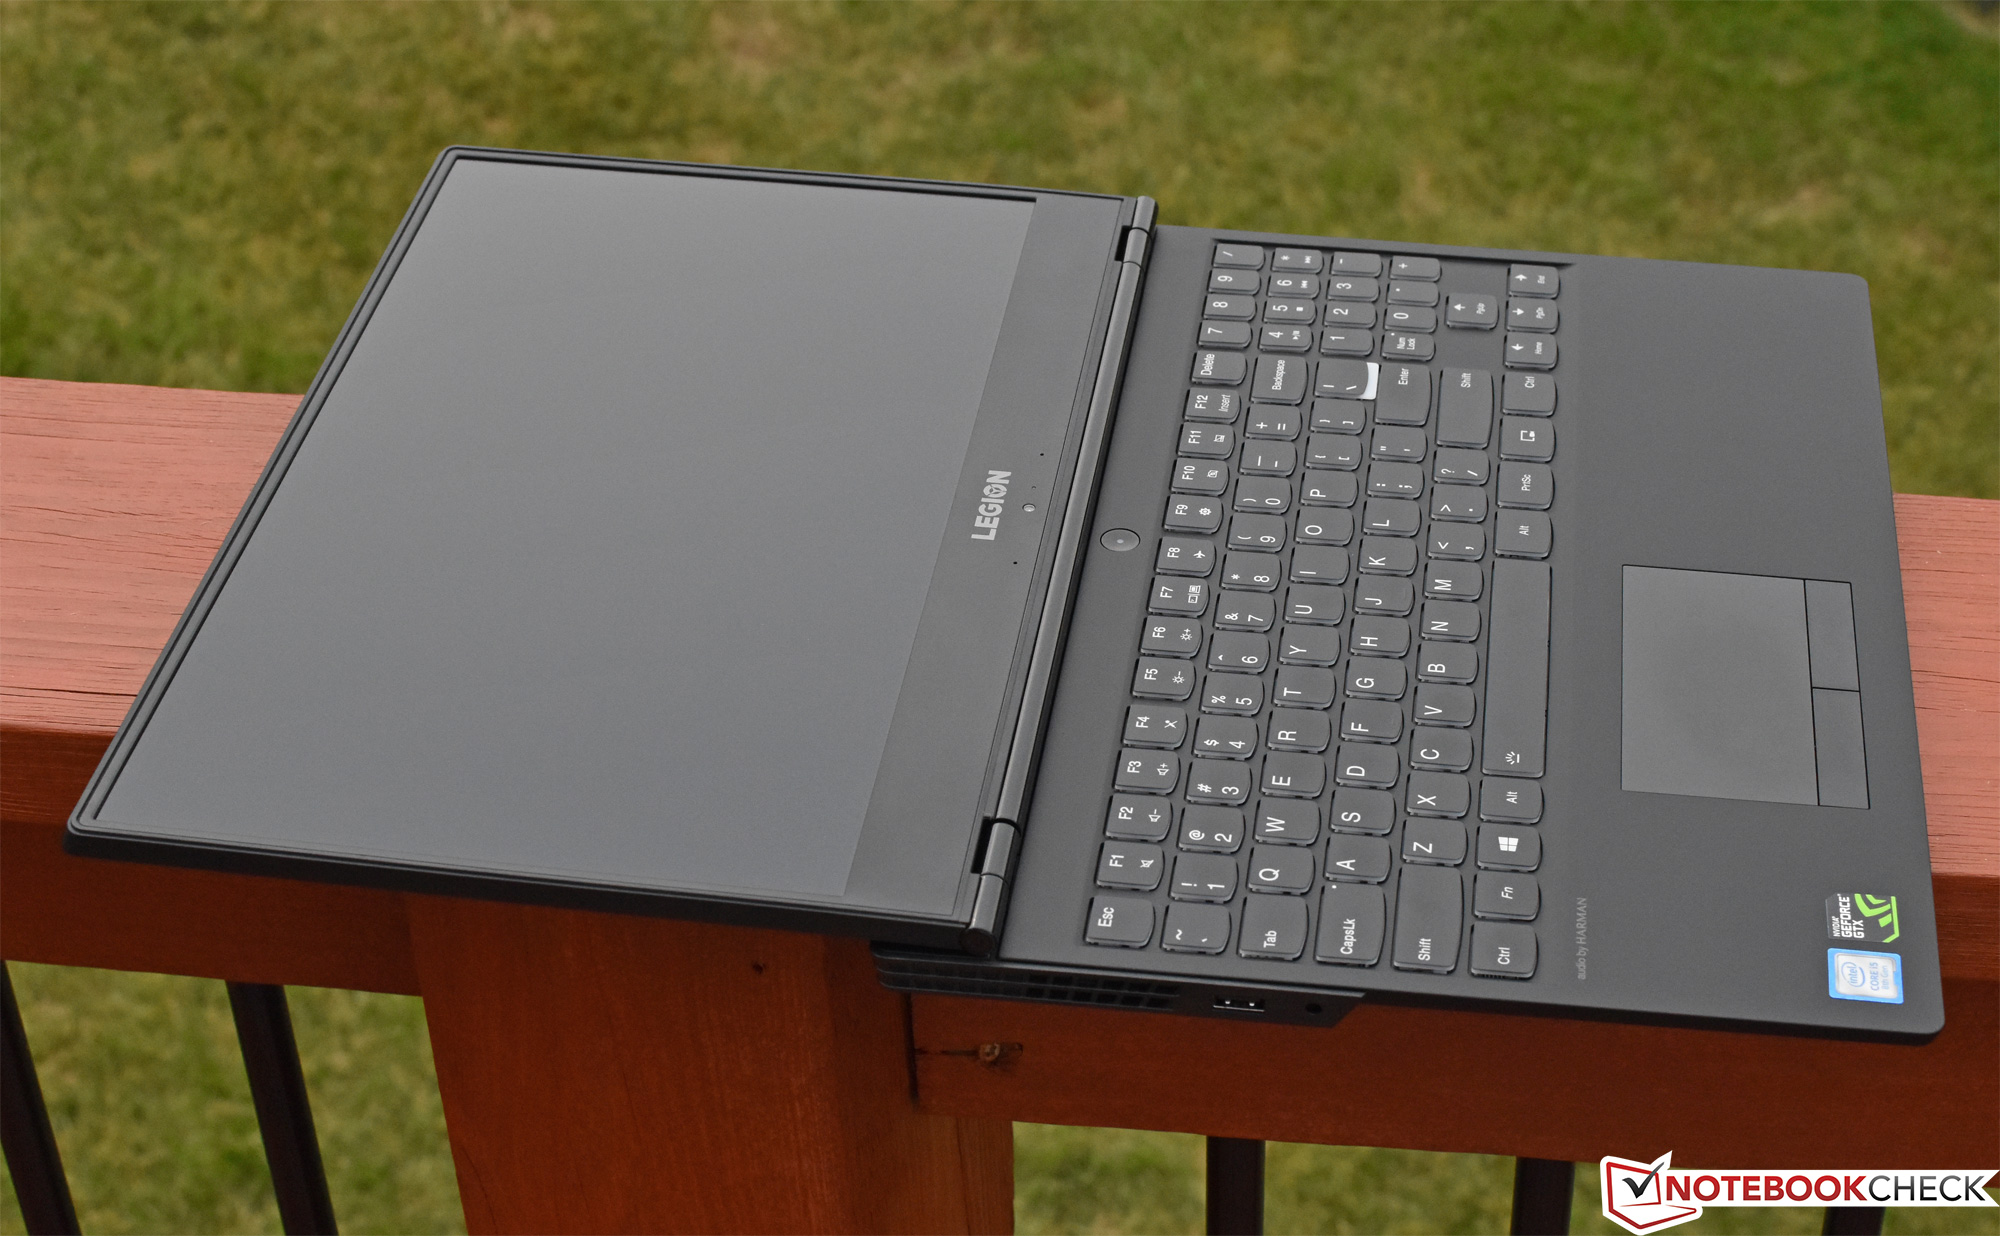
O Lenovo Legion Y530 é um ótimo ponto de partida para os consumidores em busca de um portátil básico para jogos que aborde a maioria dos fundamentos sem gastar muito em luxos. Aposta na filosofia do Y520 do ano passado removendo os últimos remanescentes de qualquer tipo de acentos chamativos coloridos e substituindo-os por uma paleta muito mais profissional (ou, pelo menos, moderada) de branco sobre preto. Embora esteja equipado com uma GPU de gama relativamente baixa (a GeForce GTX 1050 Ti) e “apenas” uma CPU Core i5 2430M quad-core, o desempenho é particularmente estável e as temperaturas (juntamente com os níveis de ruído) nunca saem de controle. Ele pode, portanto, lidar facilmente com a maioria dos jogos em configurações médias, e alguns em alta resolução nativa.
O Lenovo Legion Y530 é um ótimo ponto de partida para os consumidores em busca de um portátil básico para jogos que aborde a maioria dos fundamentos sem gastar muito em luxos.
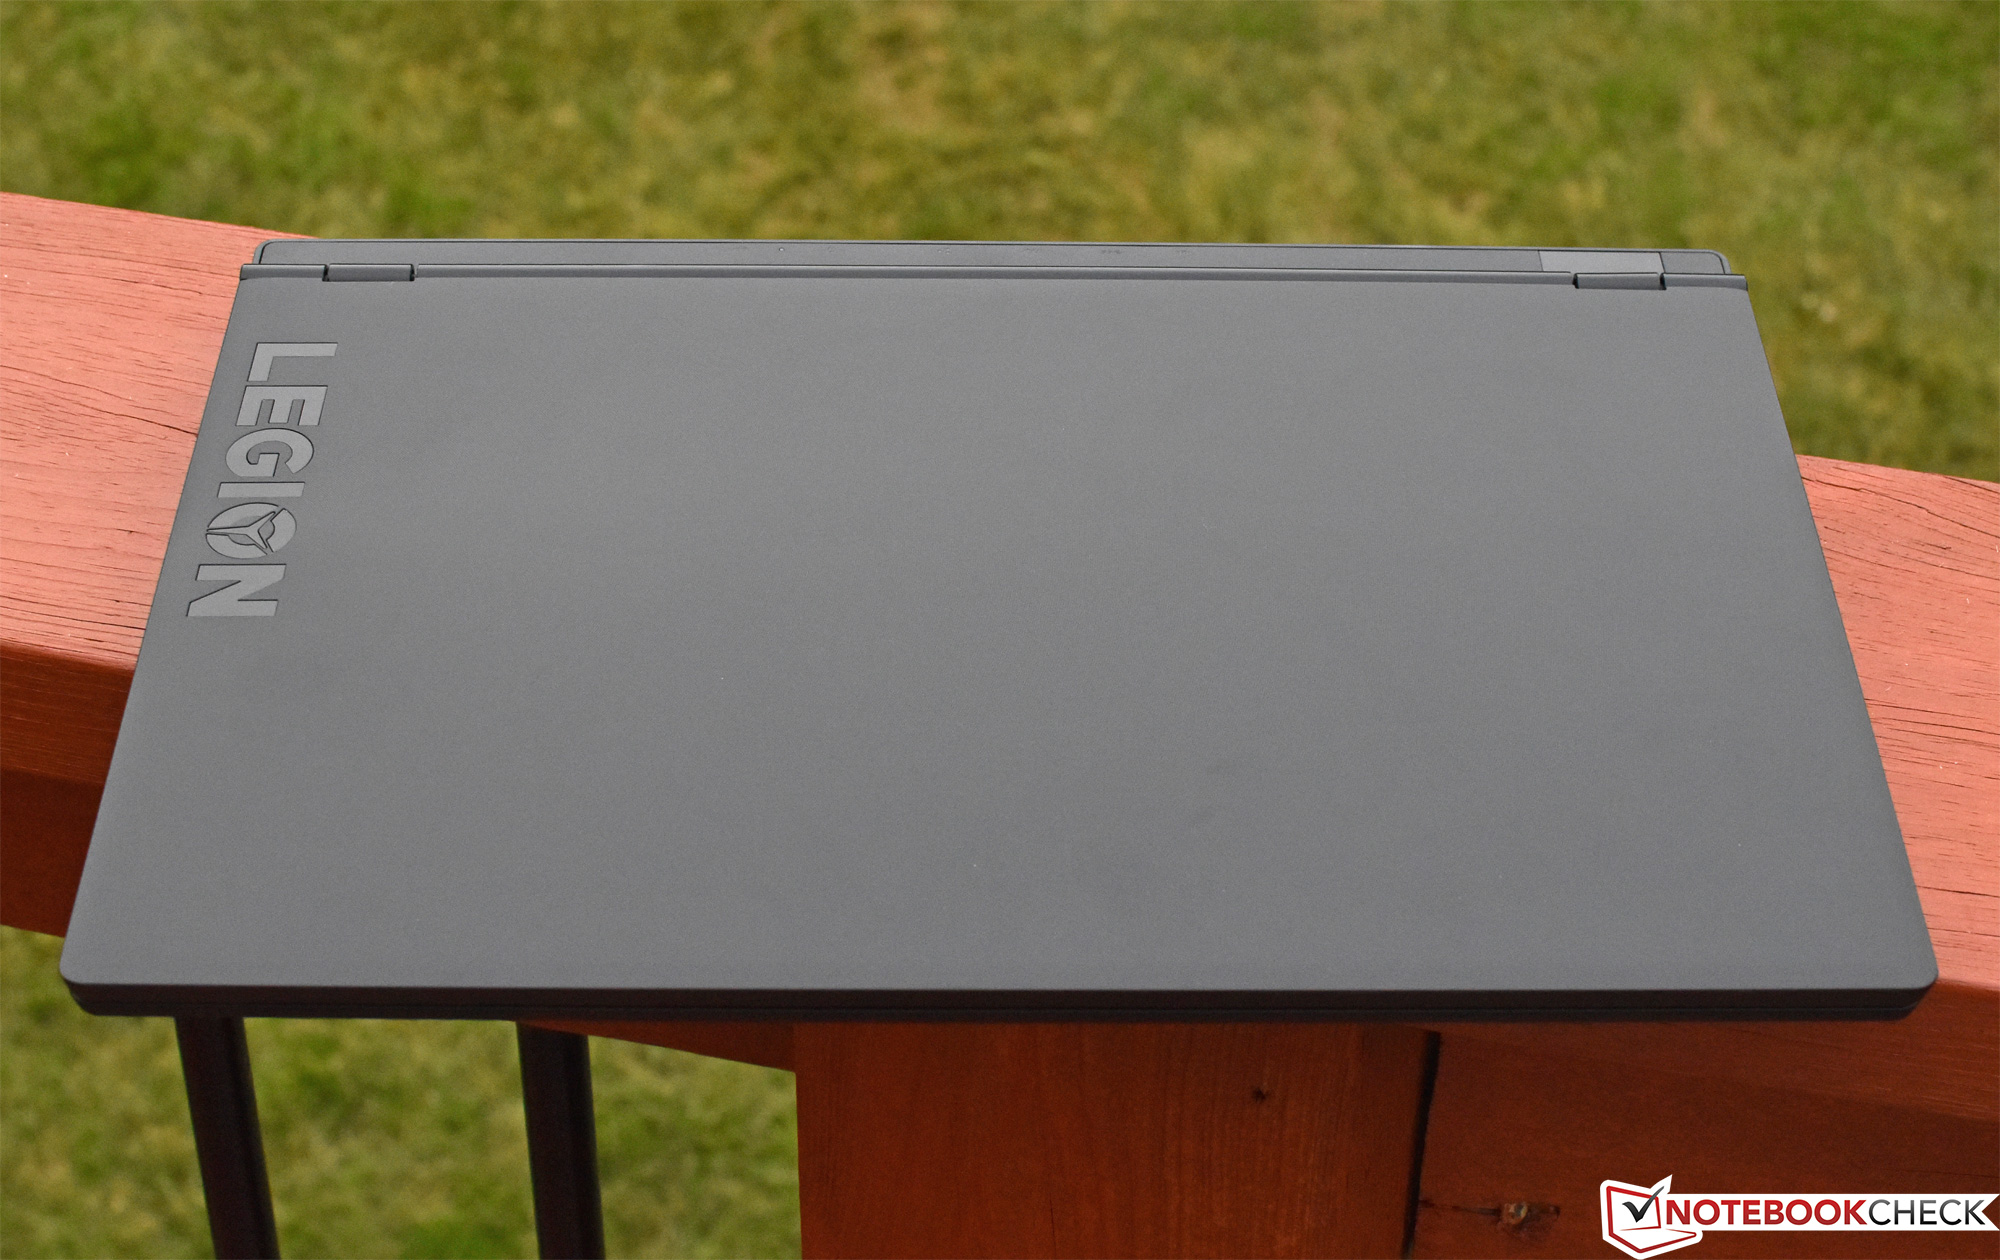
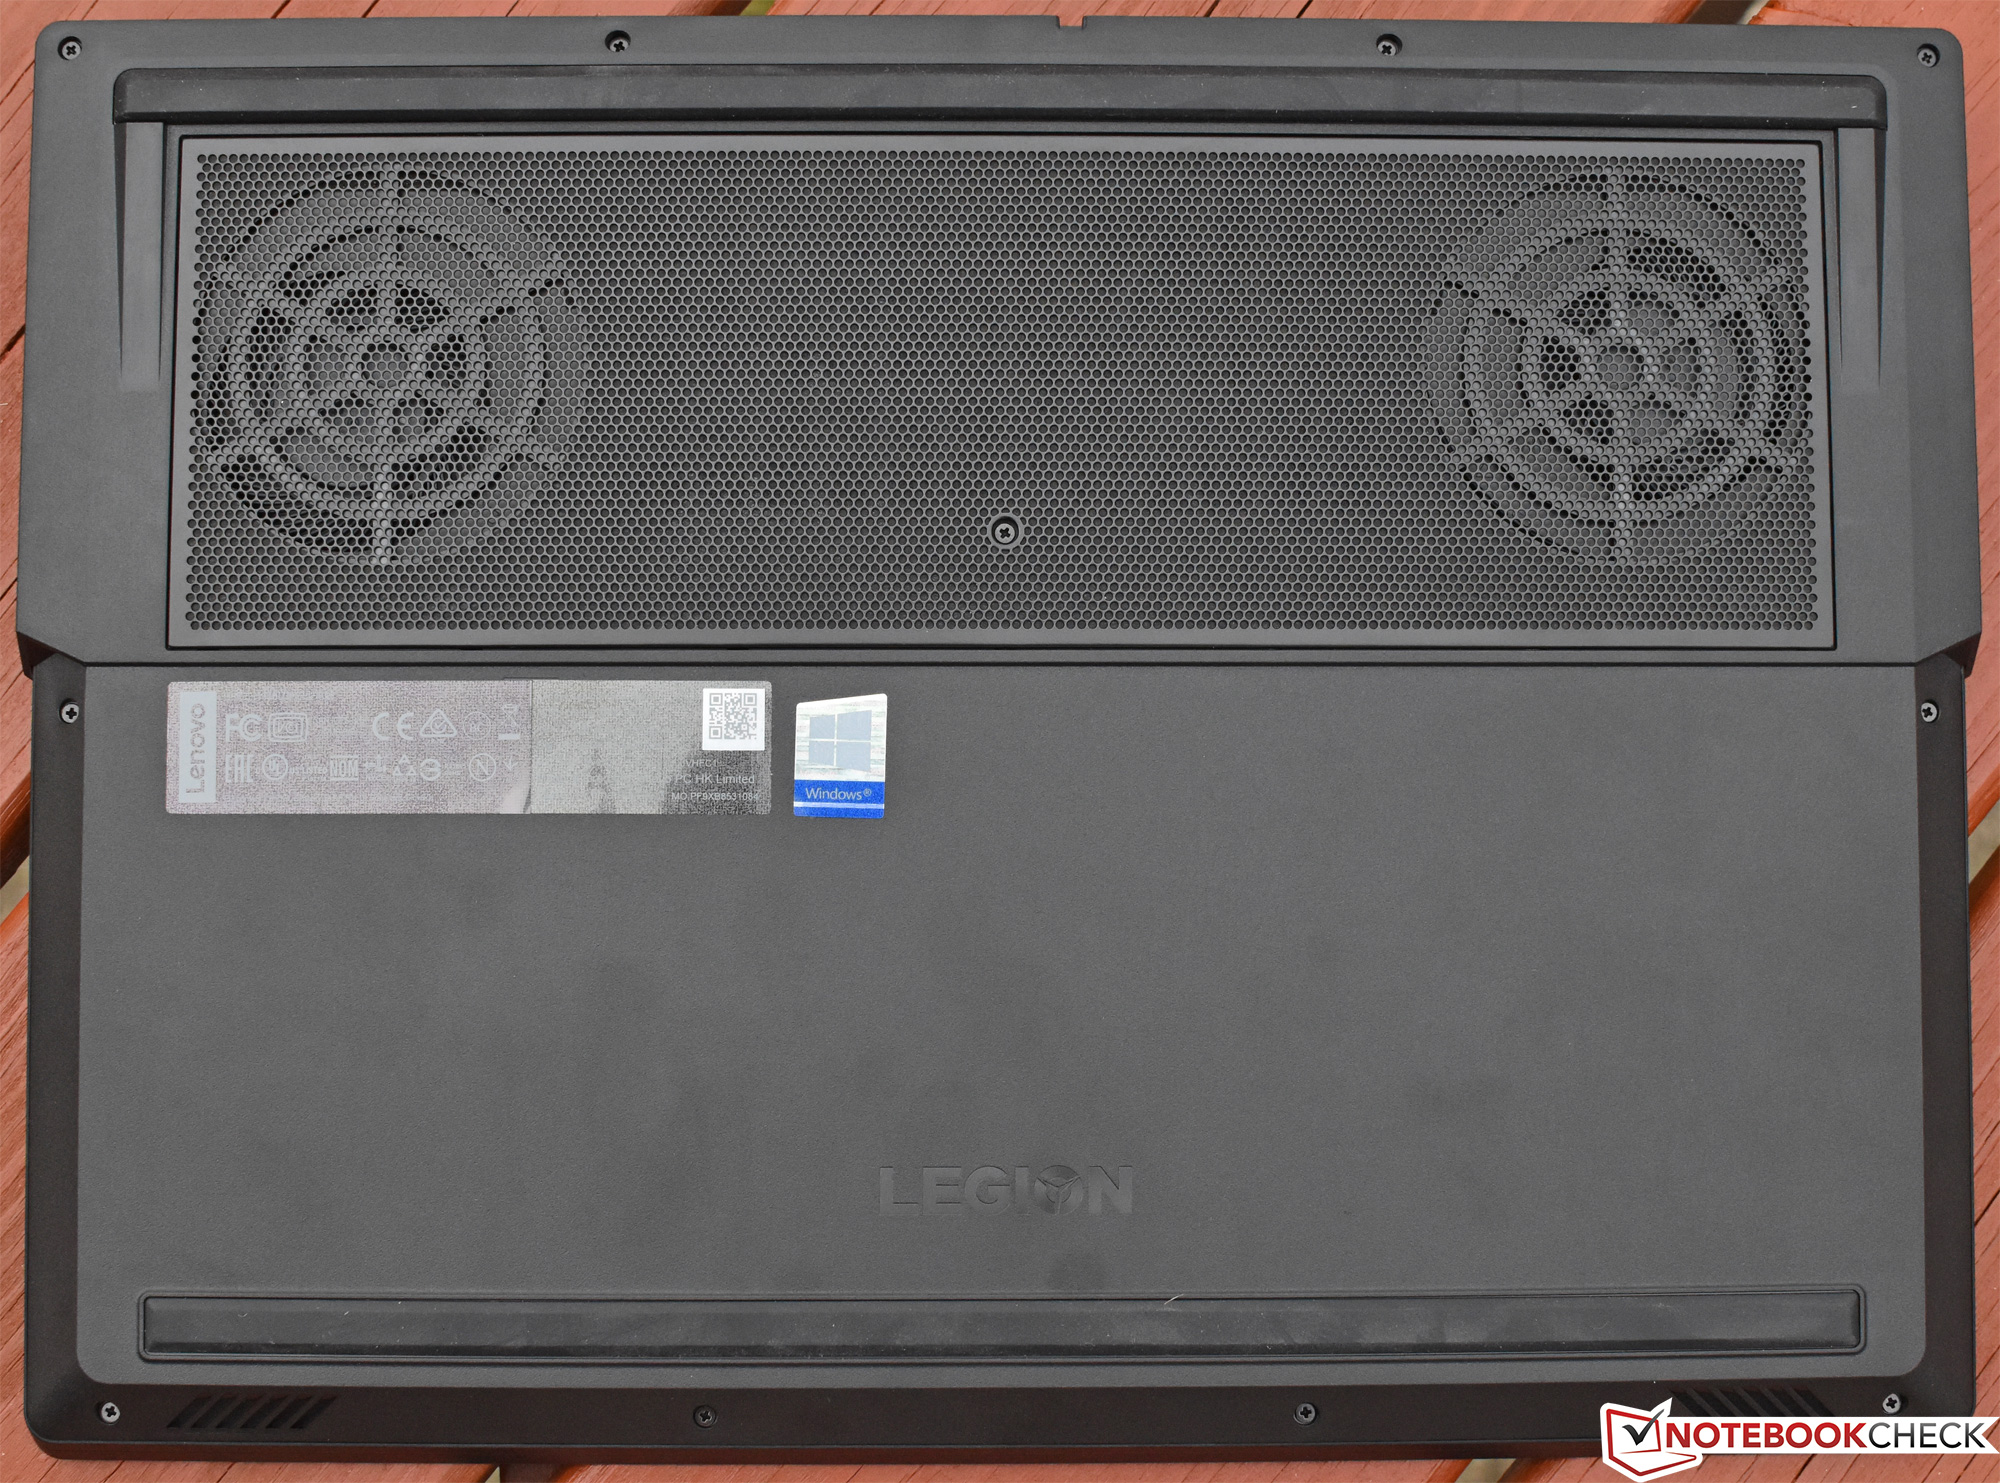
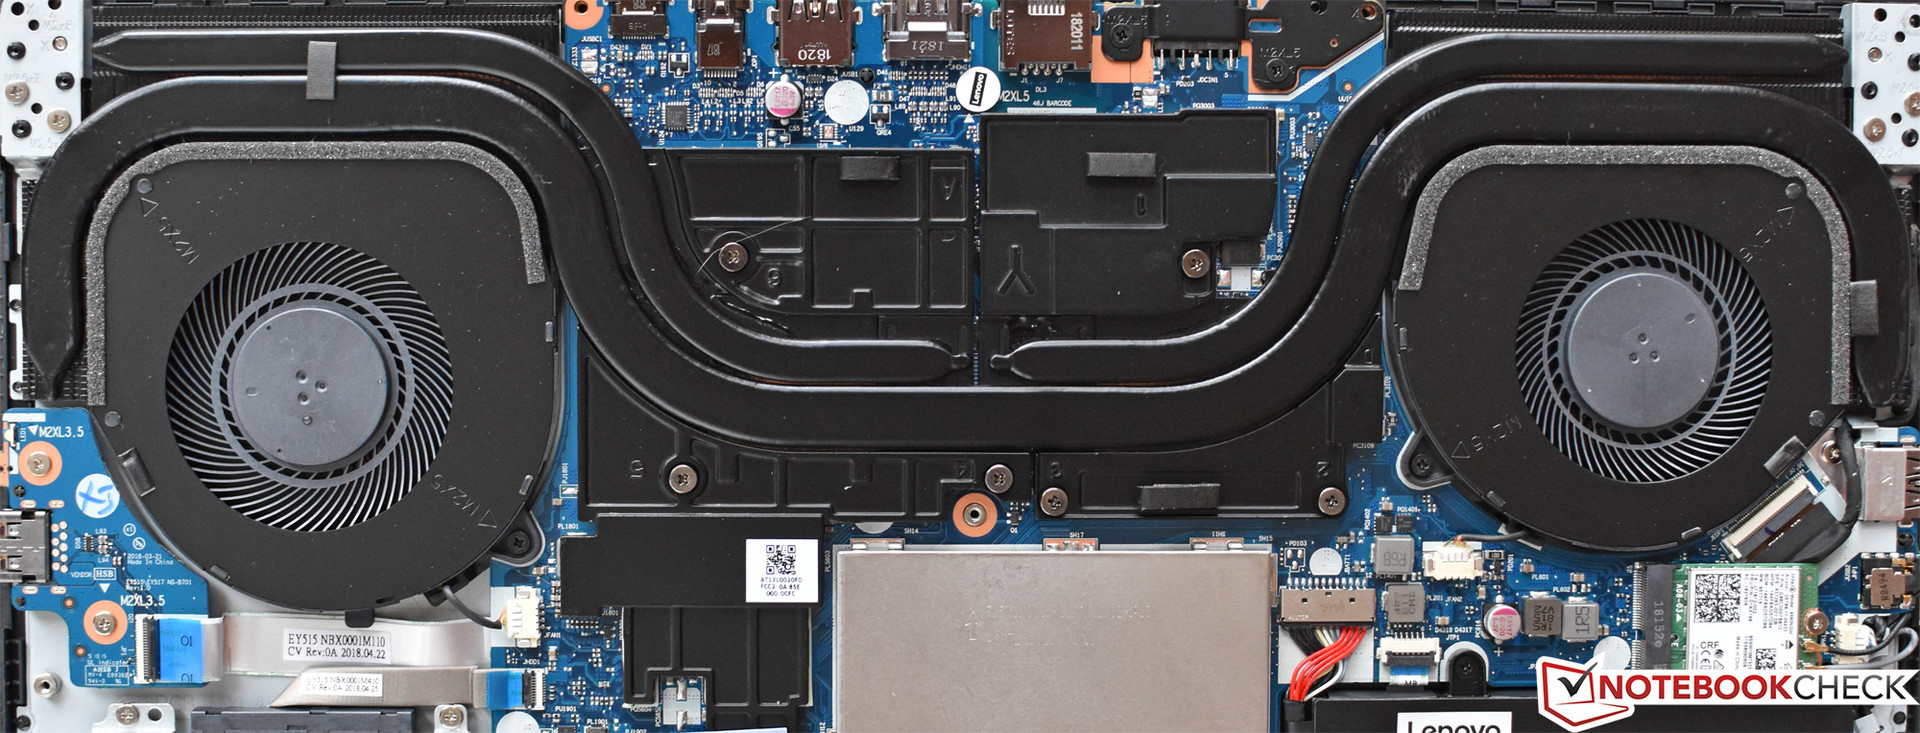
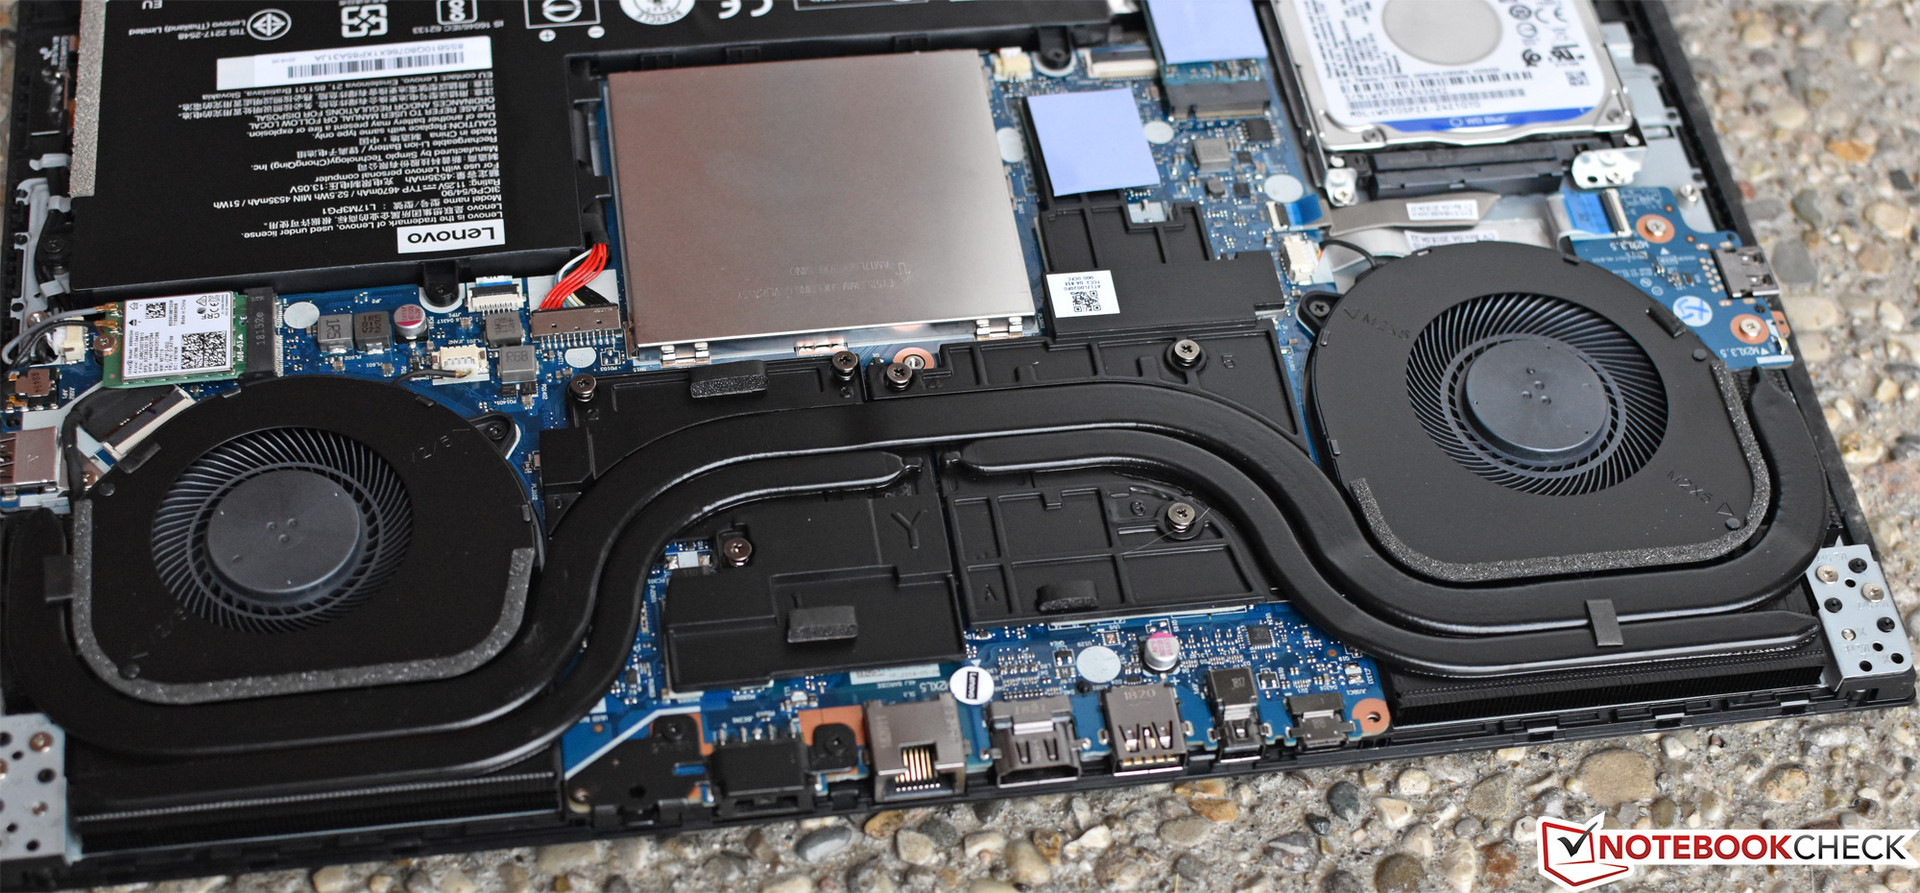
Por falar nisso, a tela é o primeiro item da nossa lista de reclamações. Não oferece benefícios reais em relação ao painel do Y520 anterior, com um brilho ligeiramente melhor, mas com um contraste menor e com a mesma reprodução de cores desbotadas. Além disso, o SSD Toshiba M.2 2242 NVMe oferece velocidades de gravação que empalidecem em comparação com até mesmo muitos drives SATA e, embora essa configuração inclua armazenamento duplo (com um HD de 1 TB a 7200 RPM também instalado), a manutenção pós-venda é desnecessariamente difícil através de um painel inferior um tanto teimoso que parece que pode quebrar se o usuário não for extremamente cuidadoso enquanto libera os numerosos clipes. A construção de plástico em geral parece apropriadamente estável, mas é inquestionavelmente de nível inferior do tipo de coisa que você encontrará em líderes de categoria, sem mencionar o ultra-premium. Dell XPS 15 e Razer Blade 15.
Aqueles com bolsos mais cheios também podem considerar essas duas alternativas, apesar de ambos virem com suas próprias limitações: o XPS é bastante caro, e o Razer Blade se esforça para manter as velocidades turbo e funciona bastante quente (entre outras coisas). Mas o compromisso é o nome do jogo quando se trata de comprar praticamente qualquer portátil, especialmente máquinas de jogos portáteis. E acontece que, desde que os usuários possam ignorar a decepcionante tela, a variedade de pontos fortes do Y530 enfatiza as qualidades mais atraentes para qualquer pessoa interessada na compra de um portátil pela primeira vez, ou talvez apenas uma máquina de jogos razoavelmente capaz que não parece uma máquina de jogos.
Lenovo Legion Y530-15ICH
- 11/30/2018 v6 (old)
Steve Schardein
Price comparison
