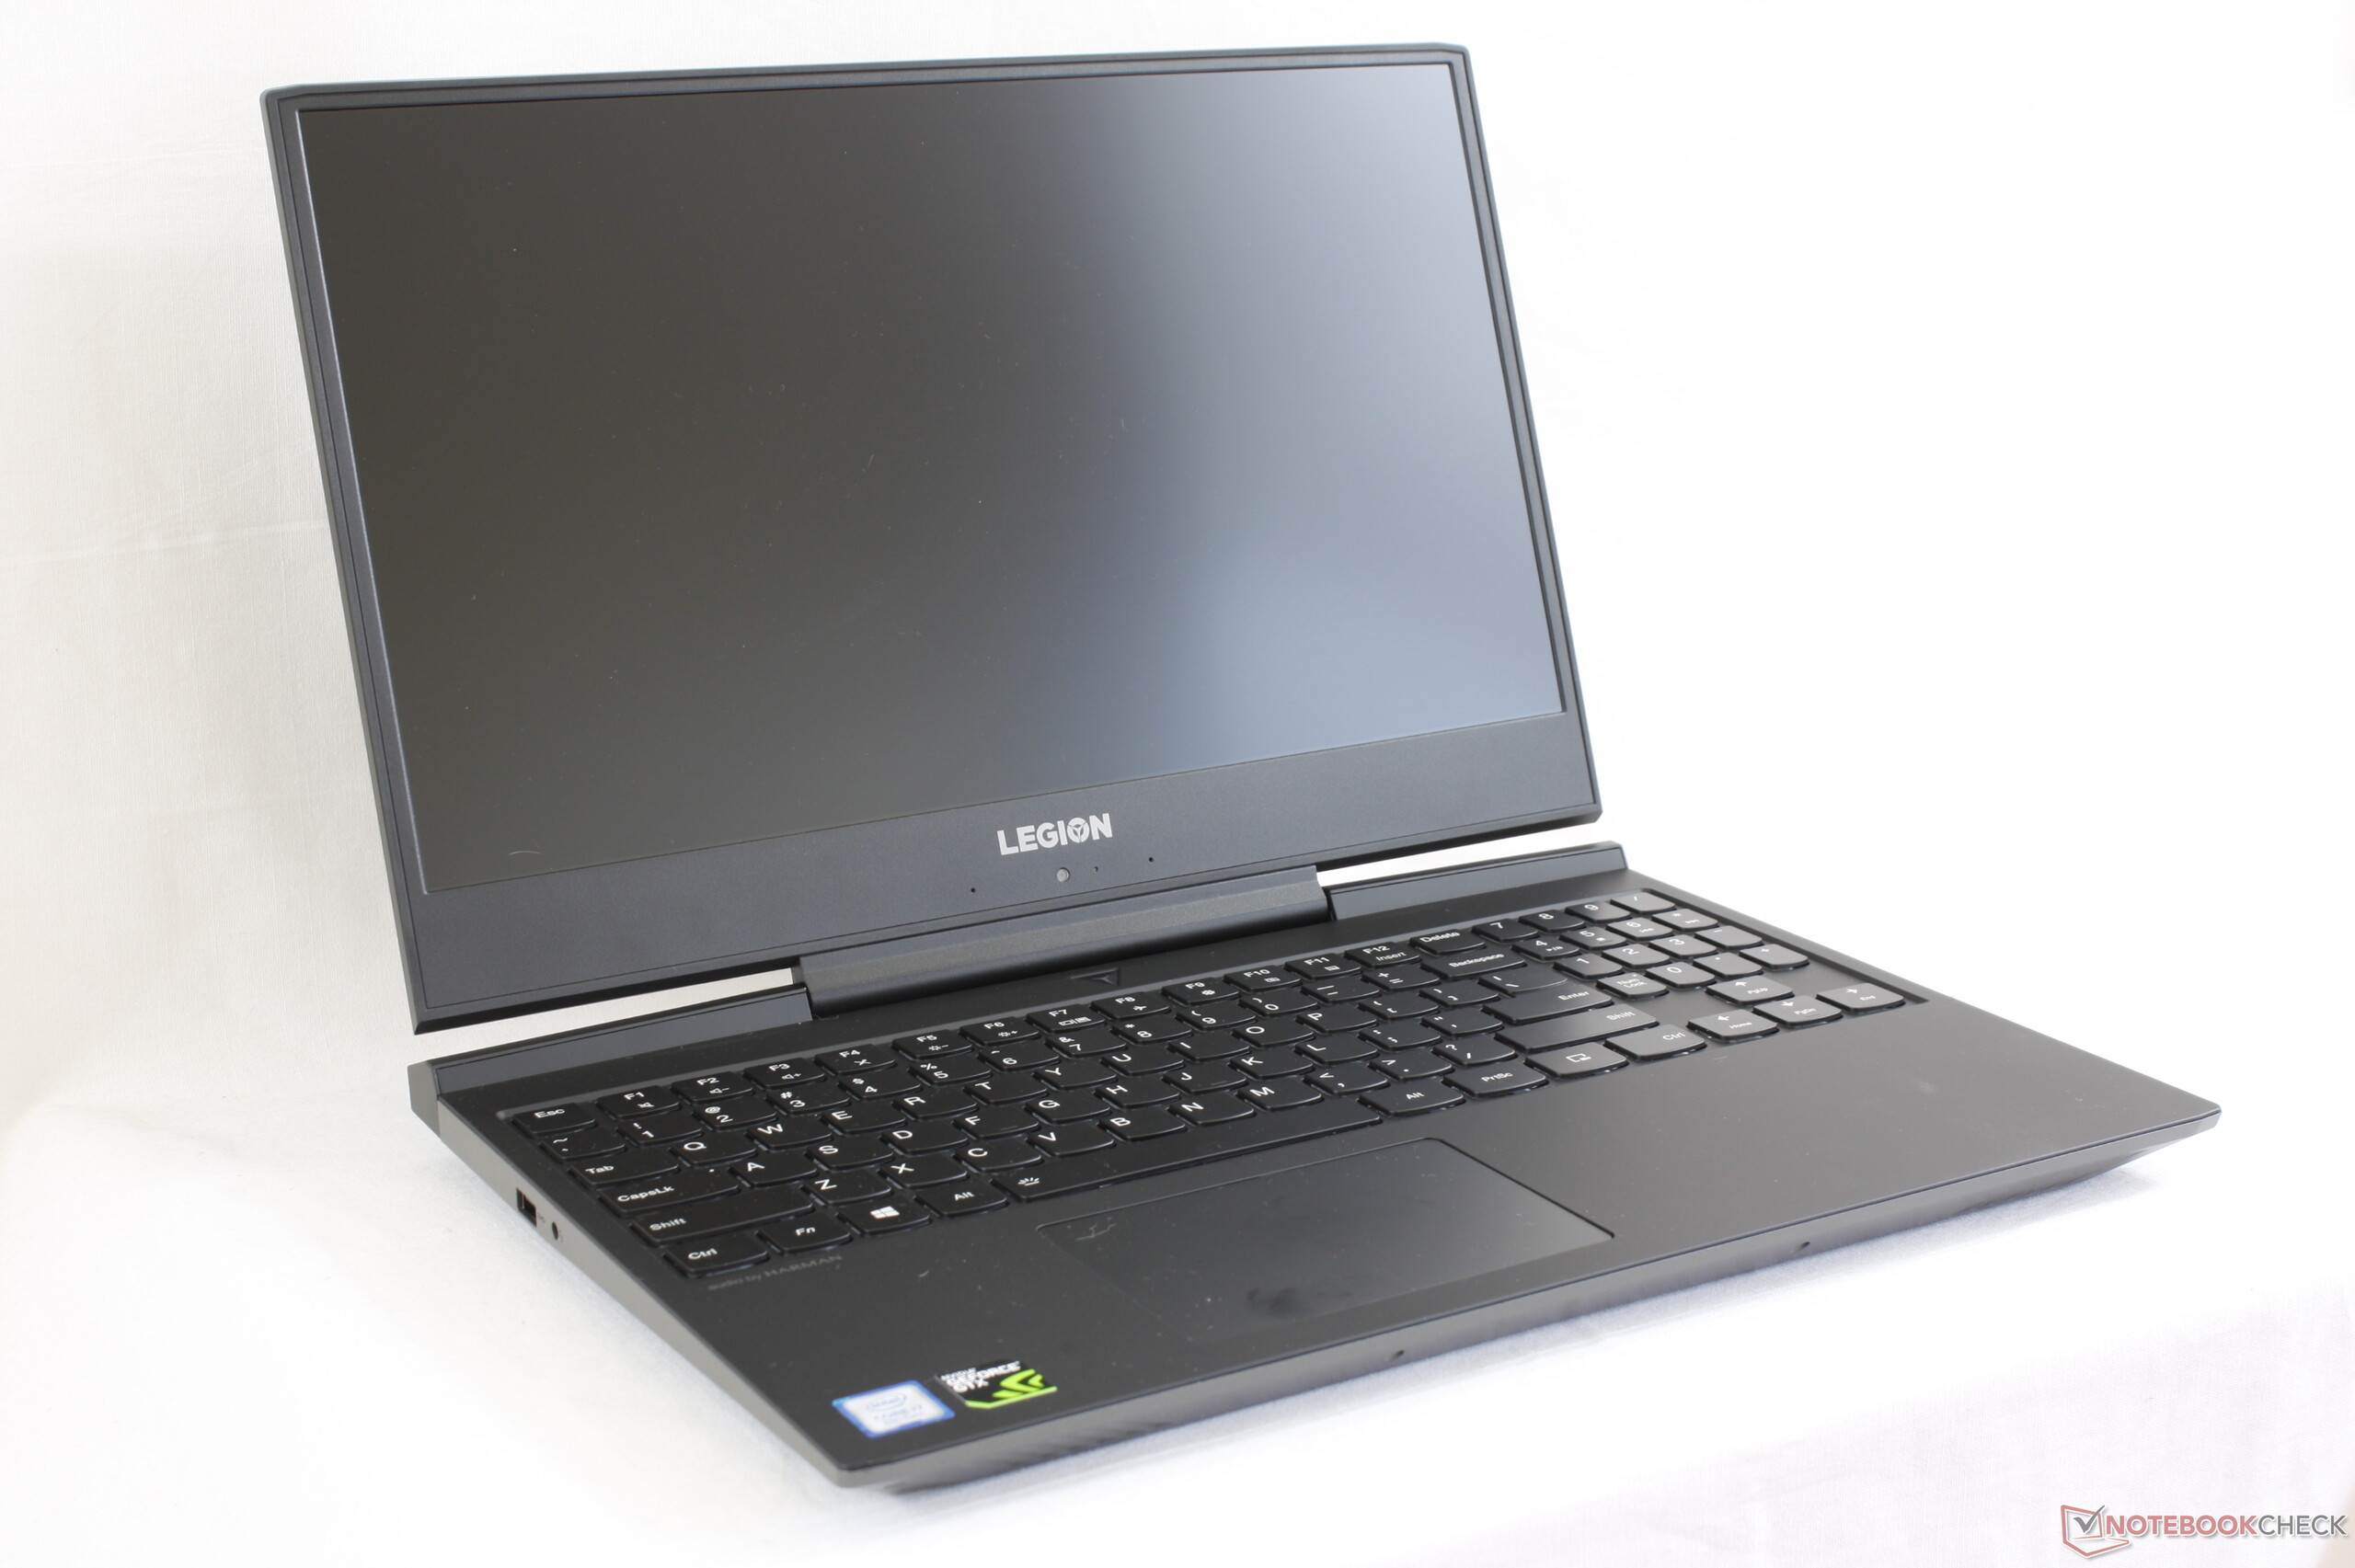
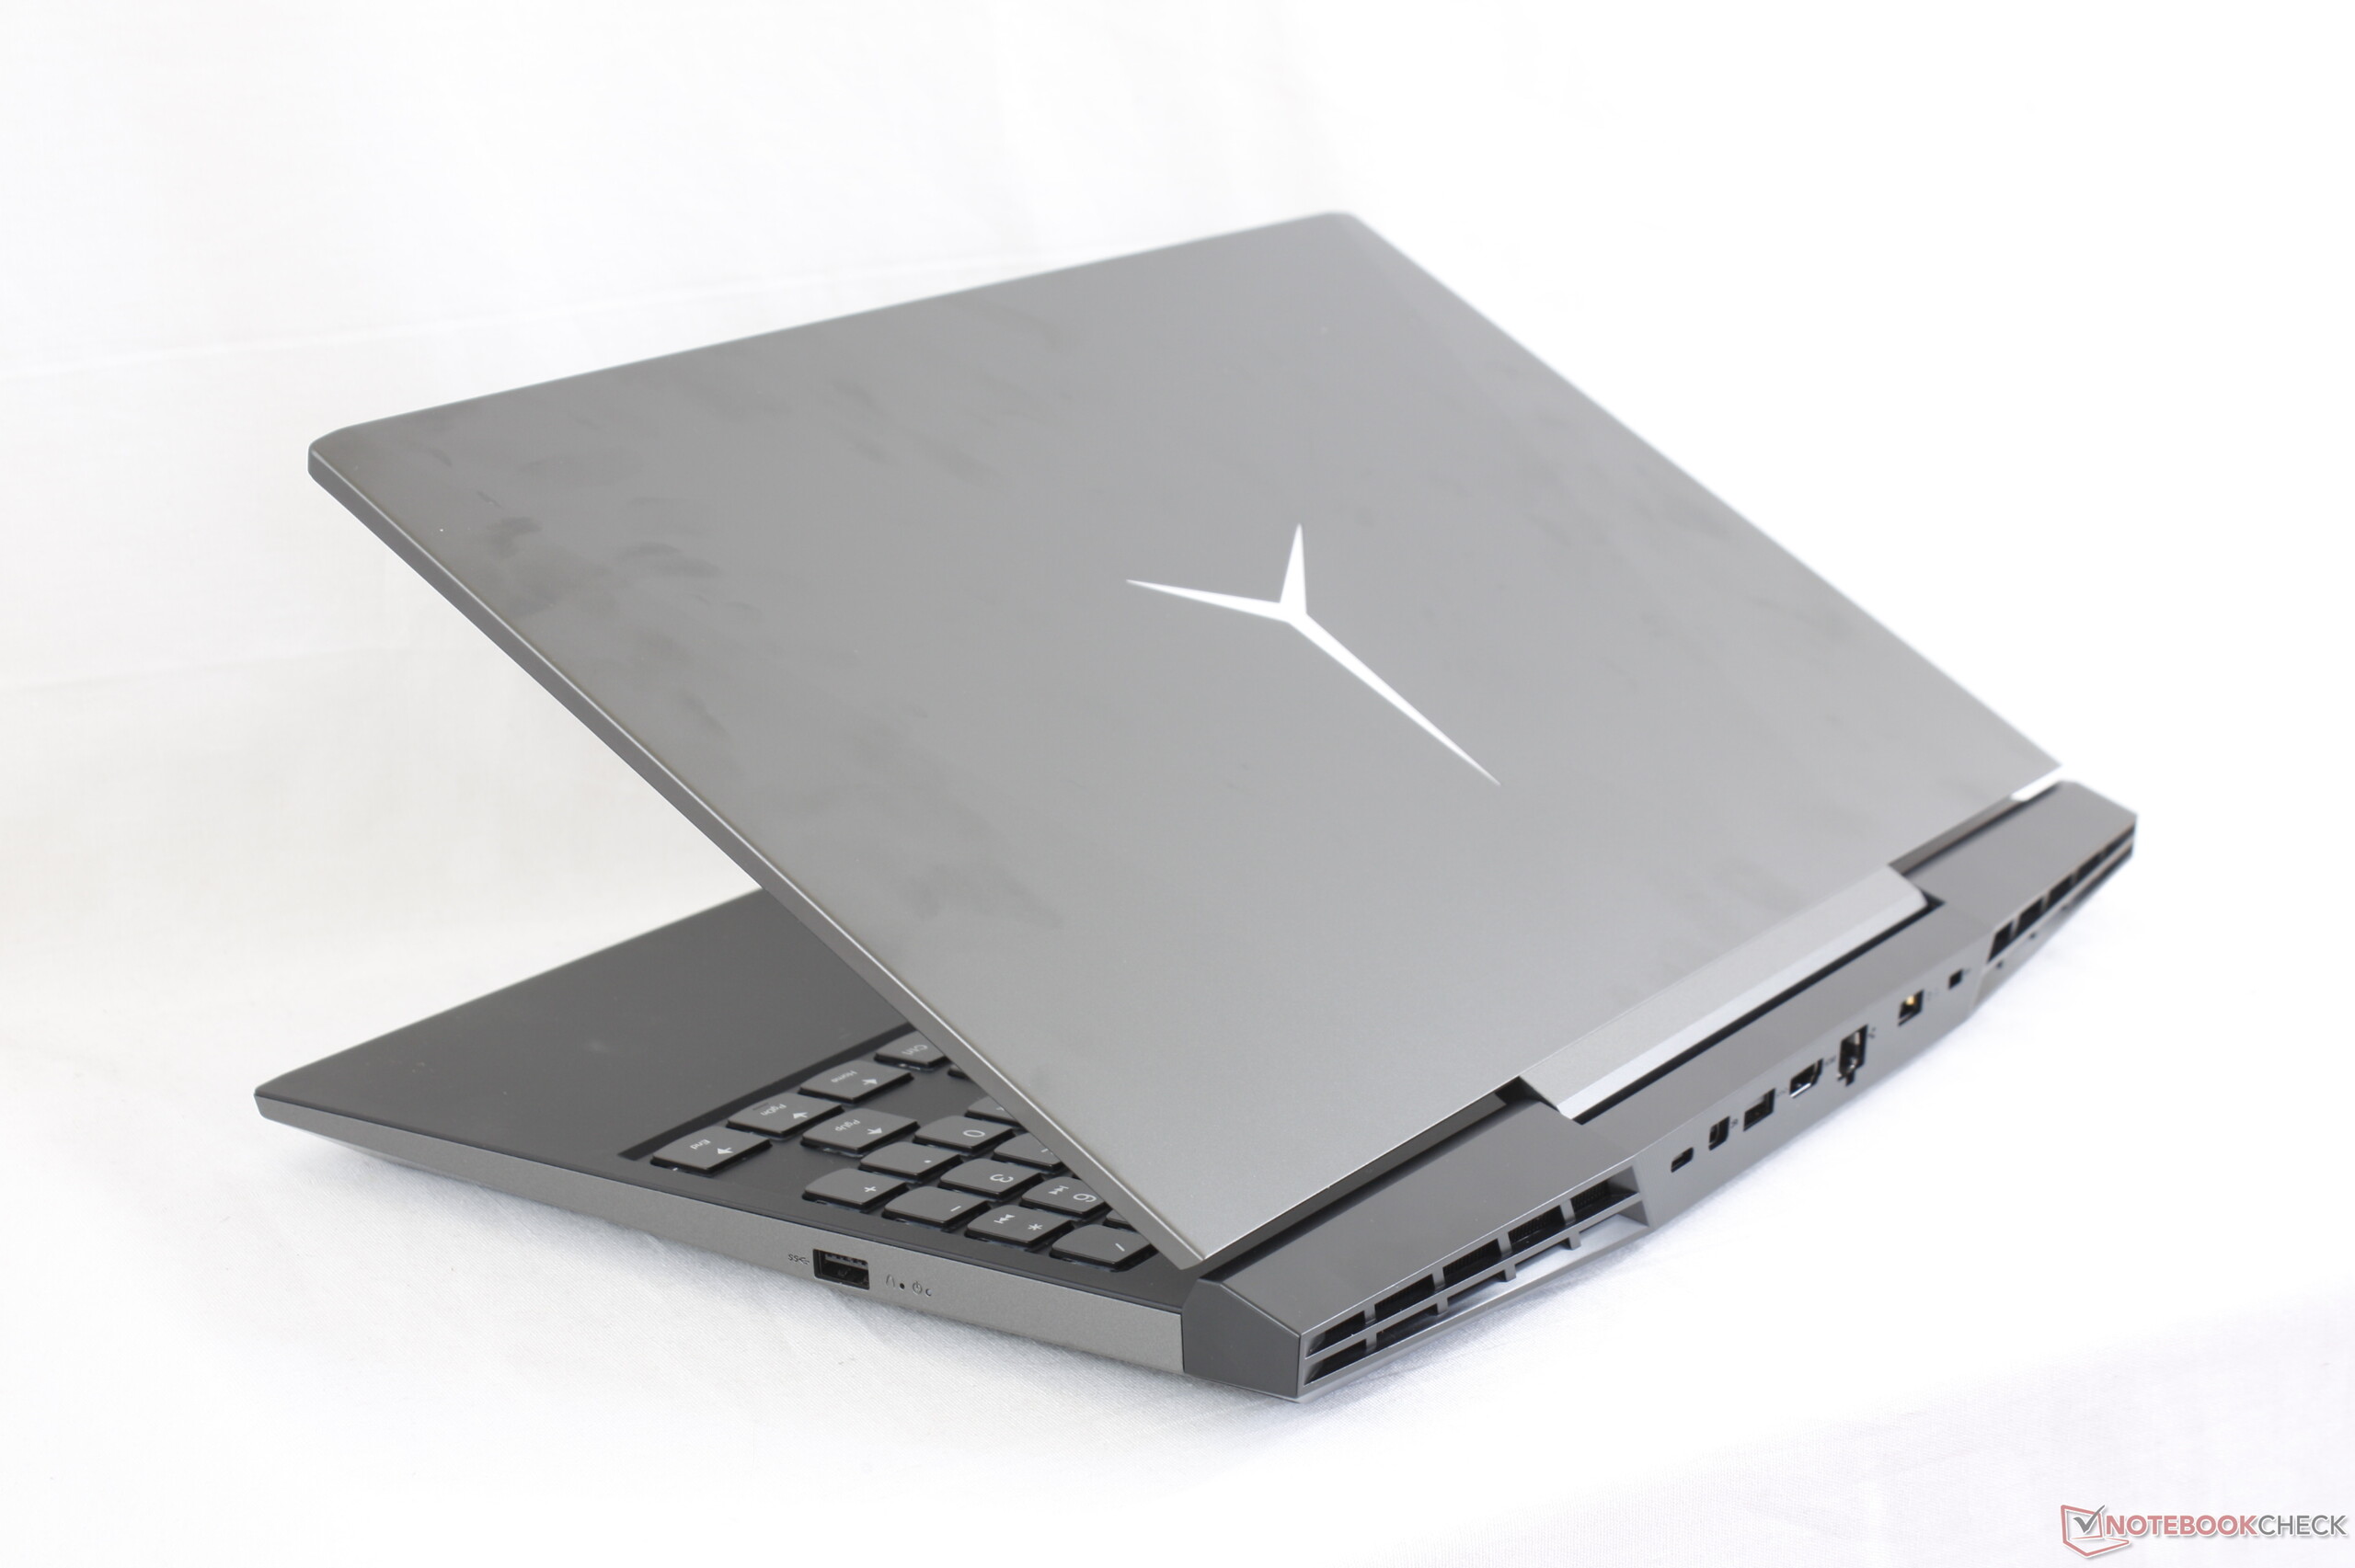
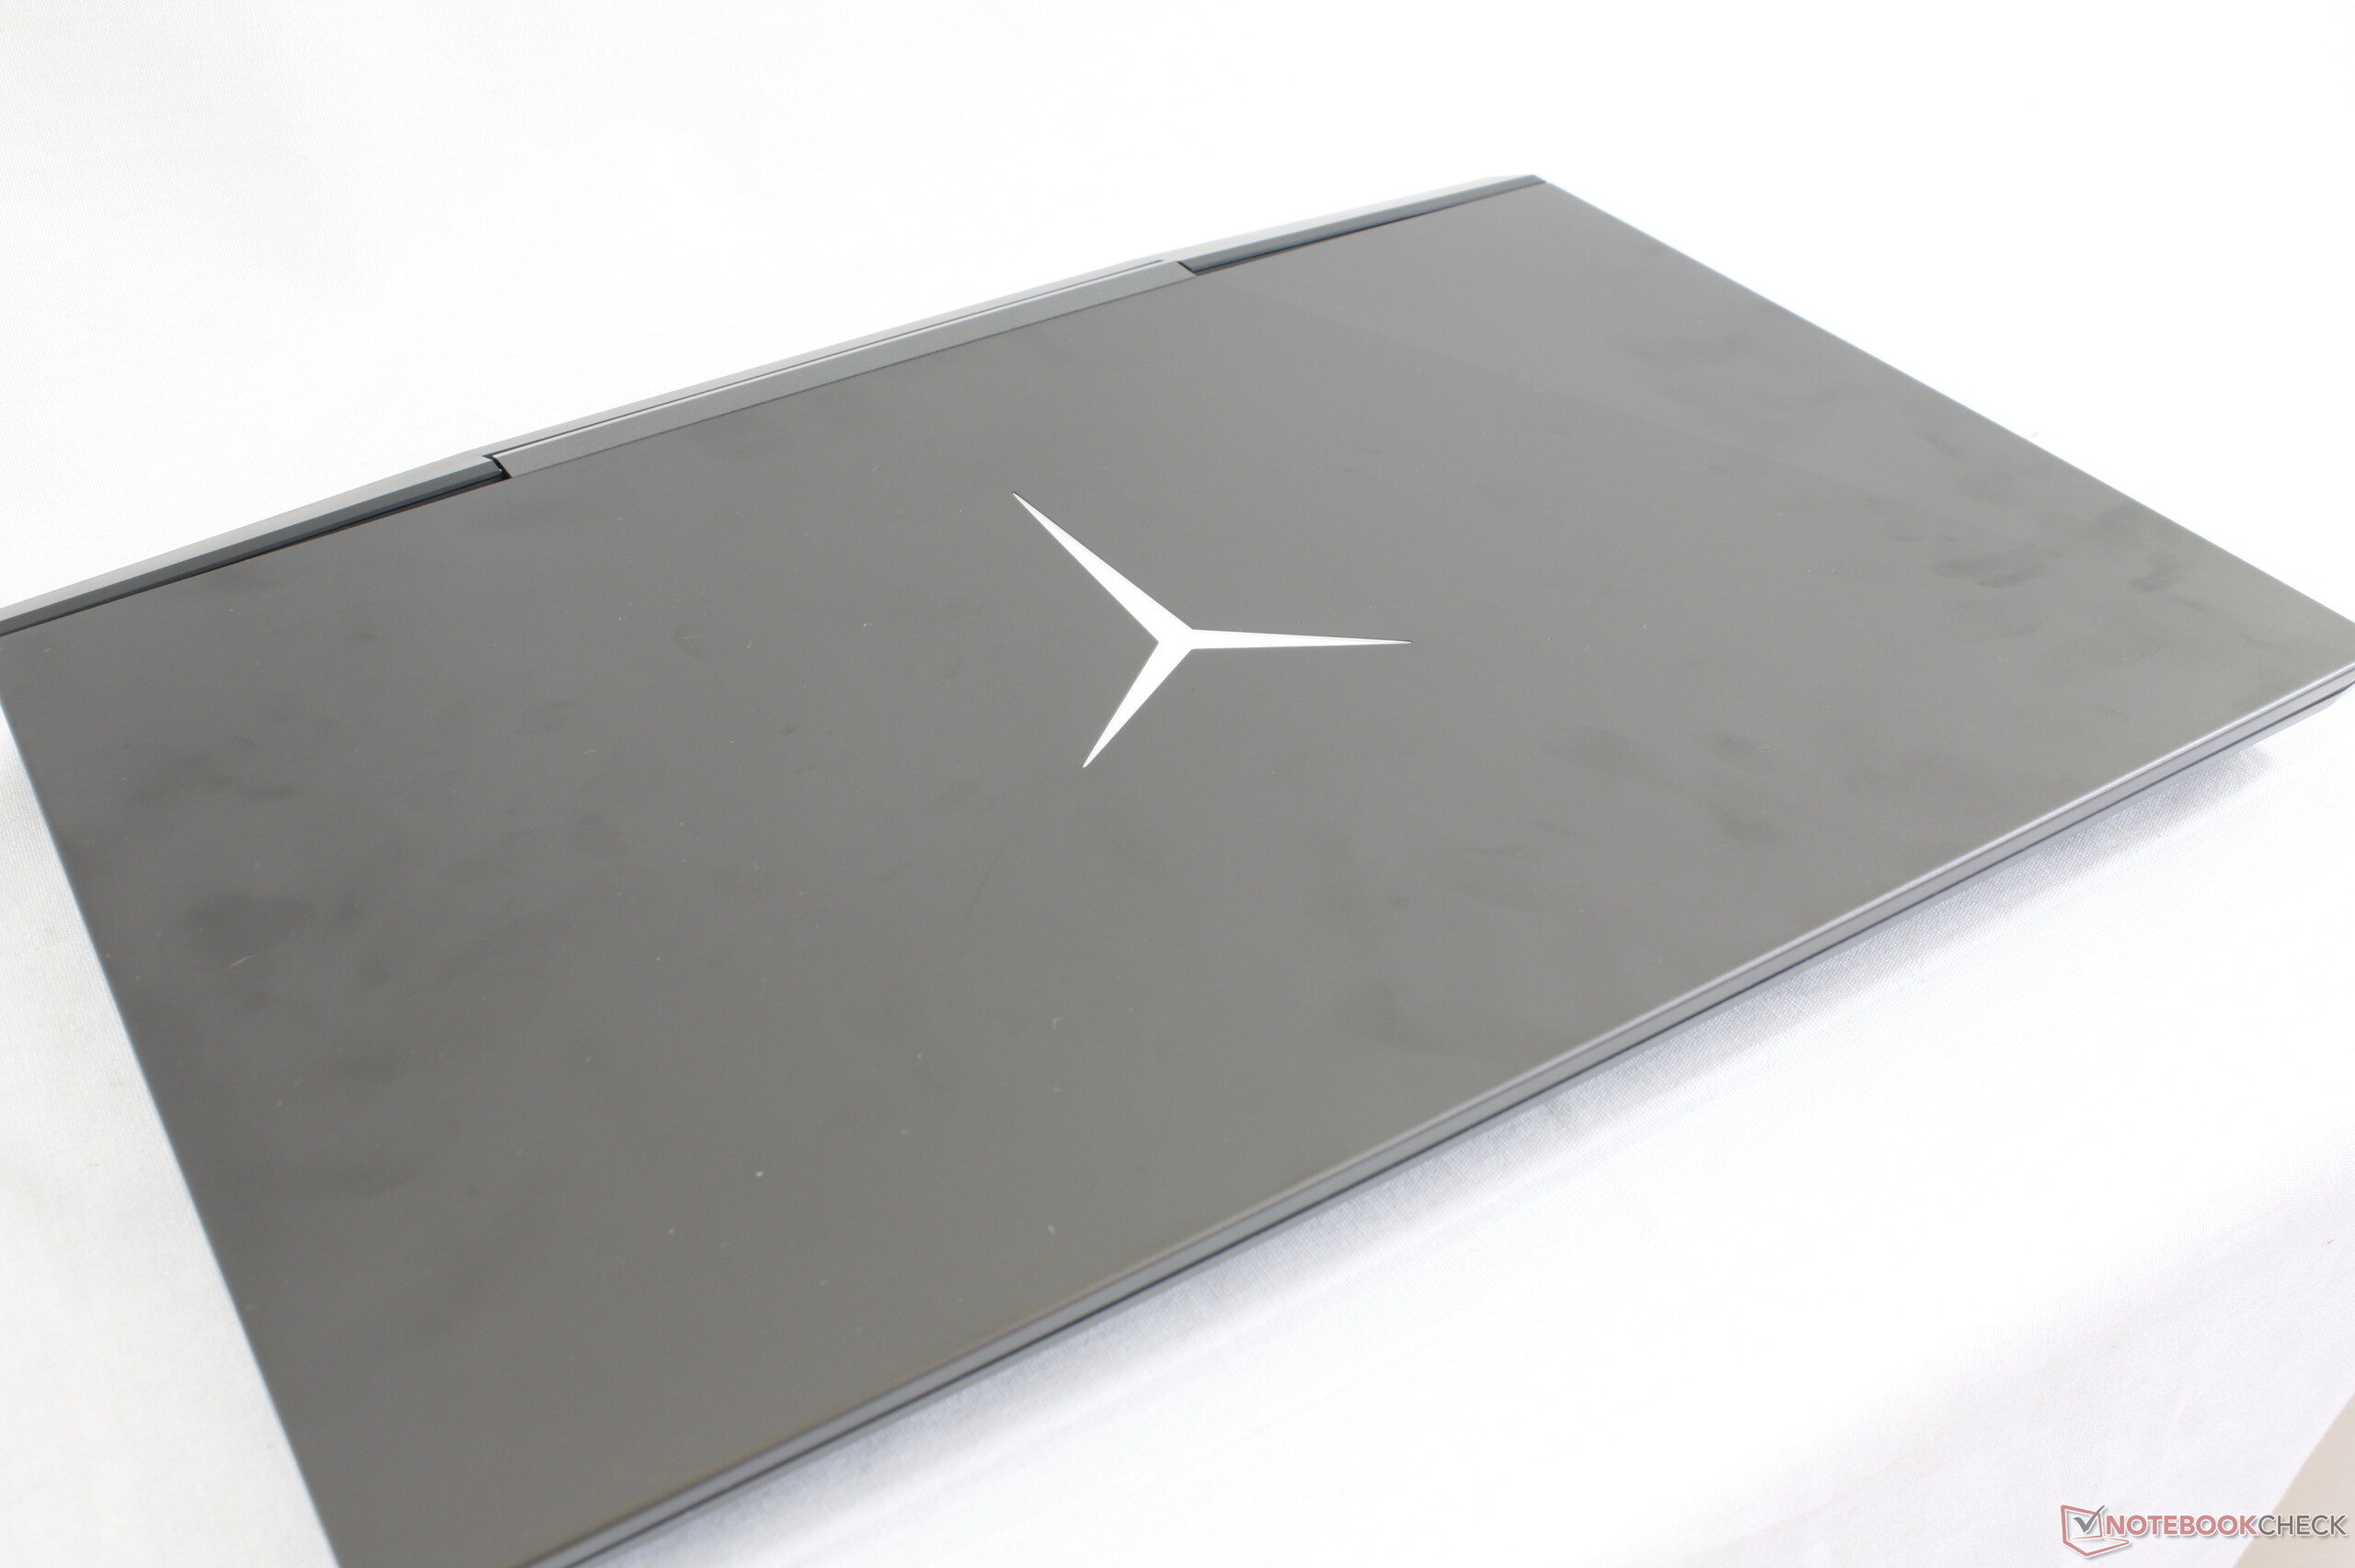
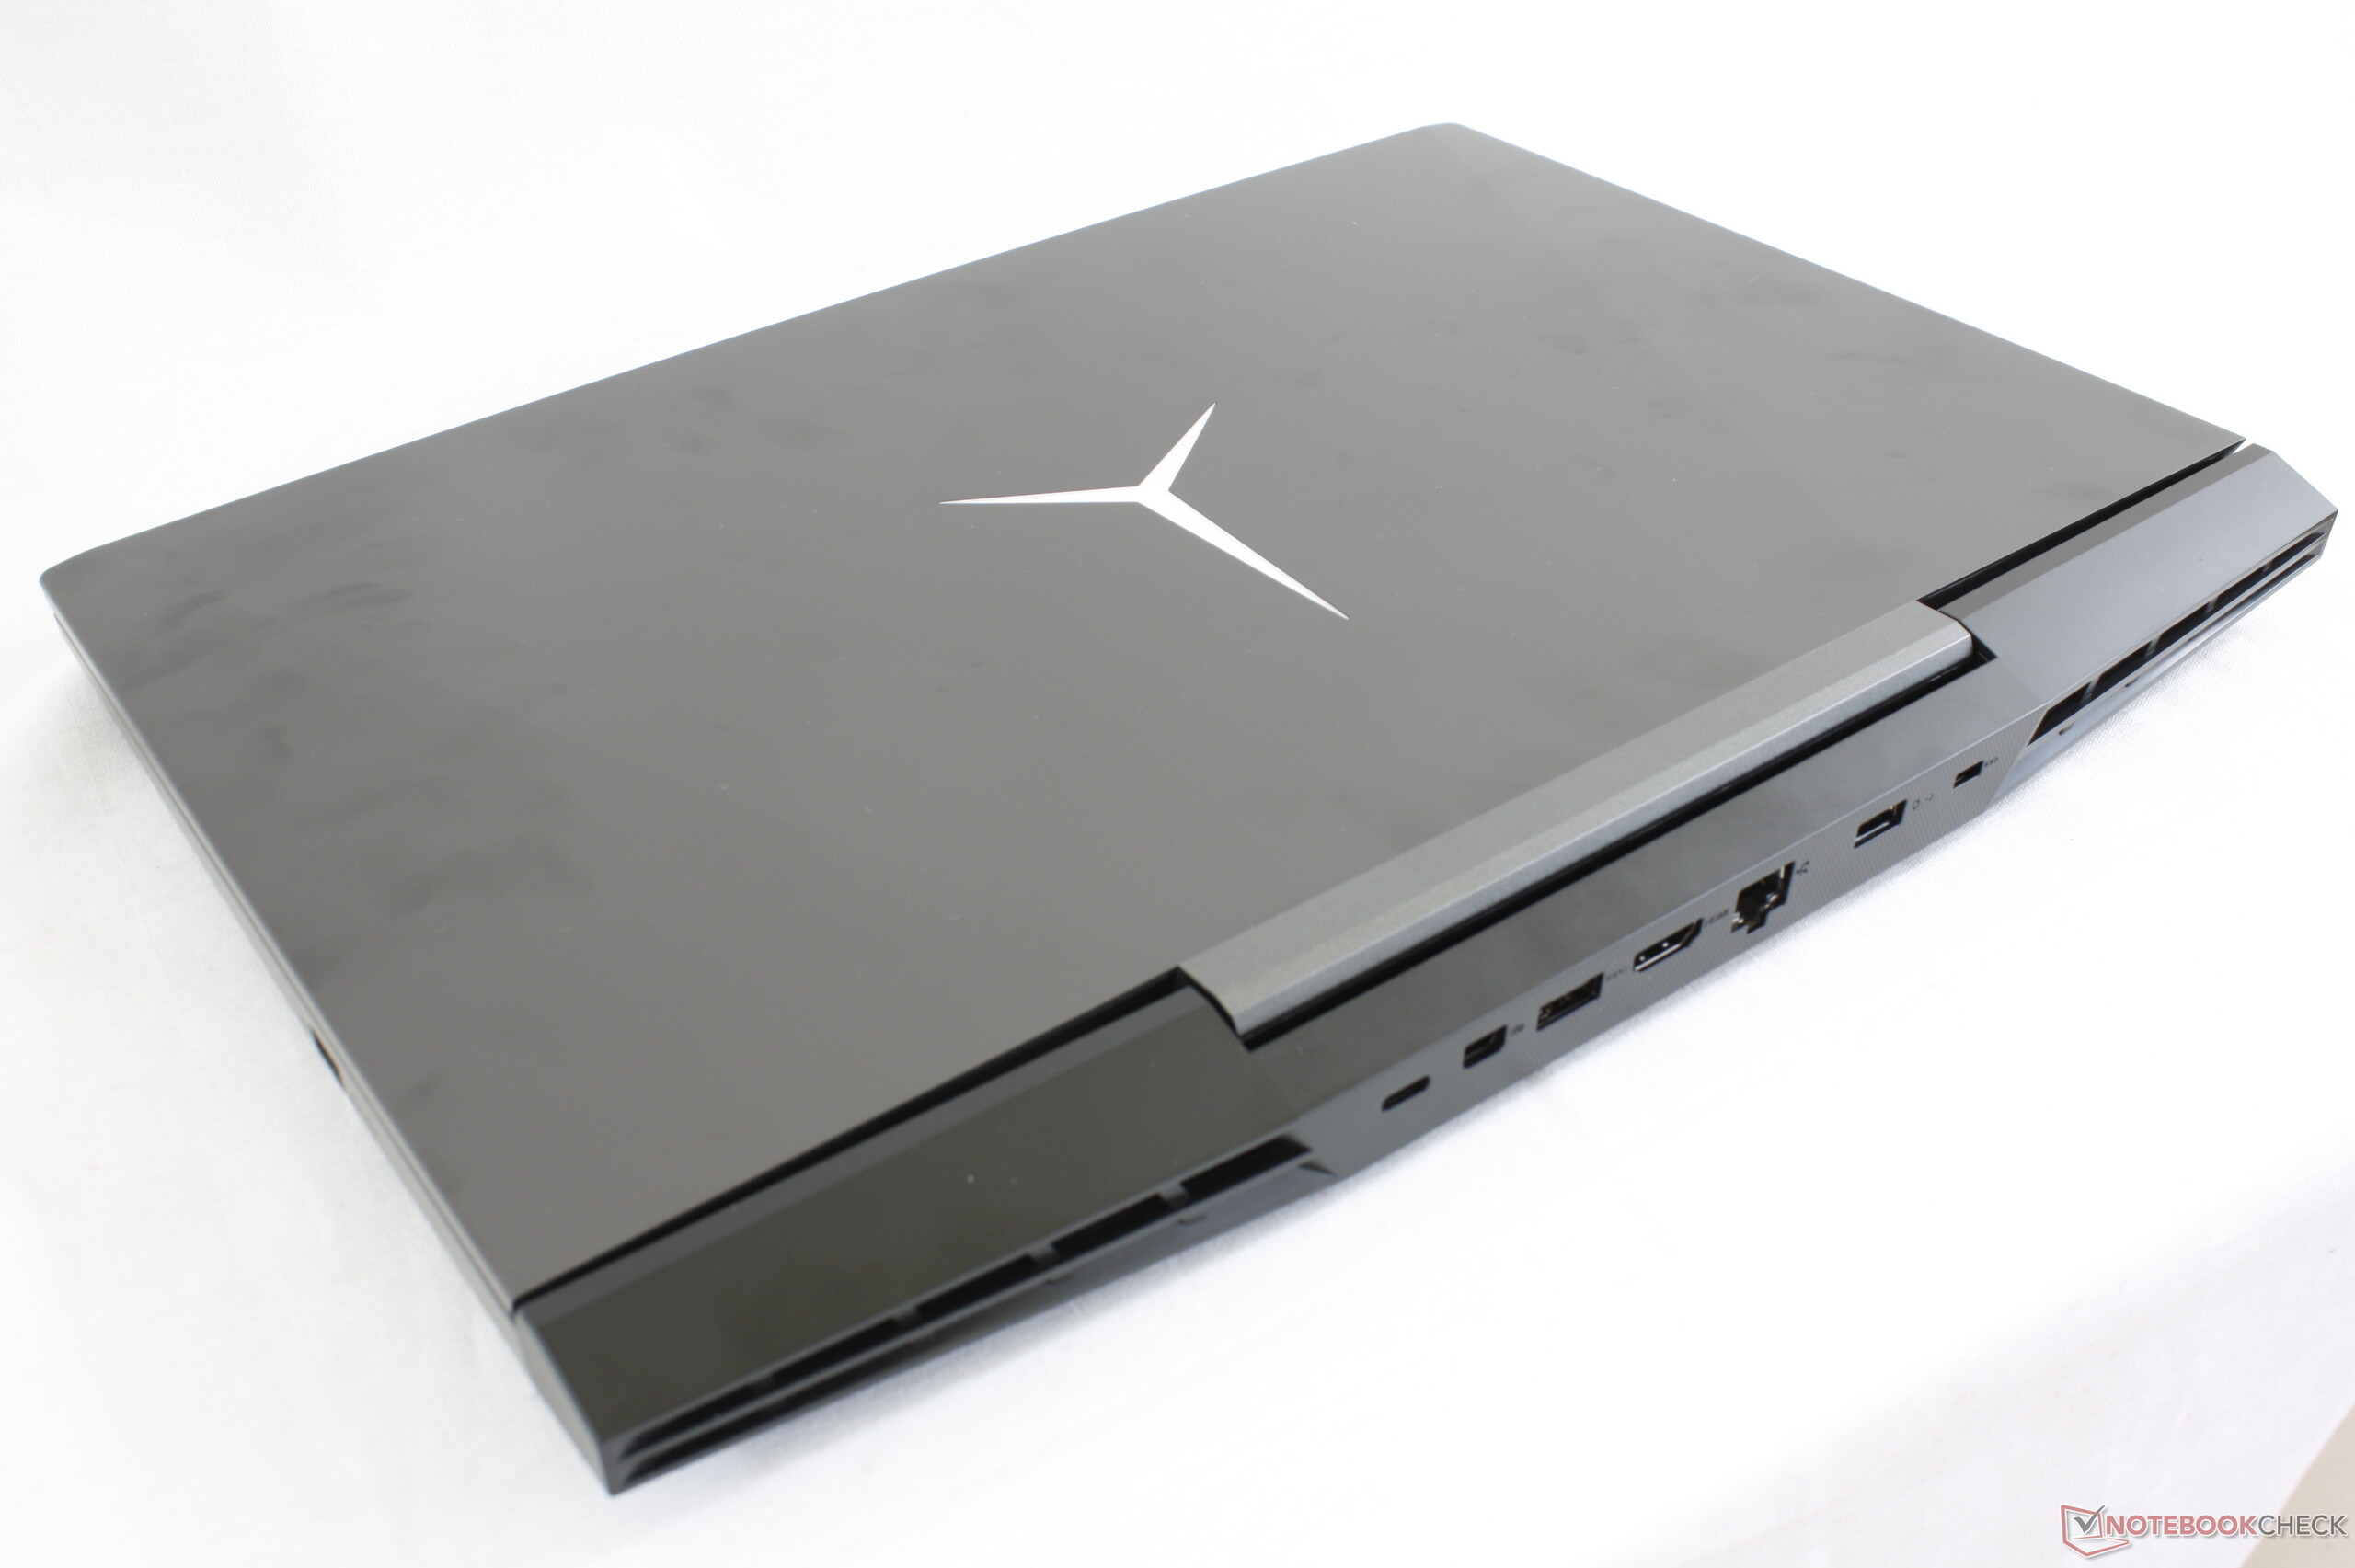
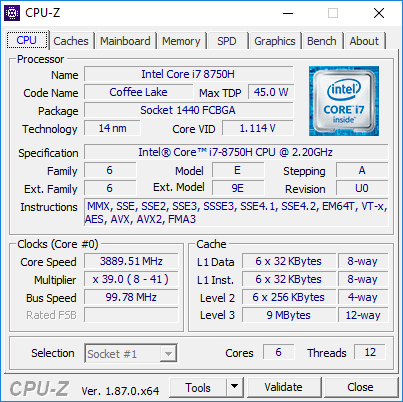
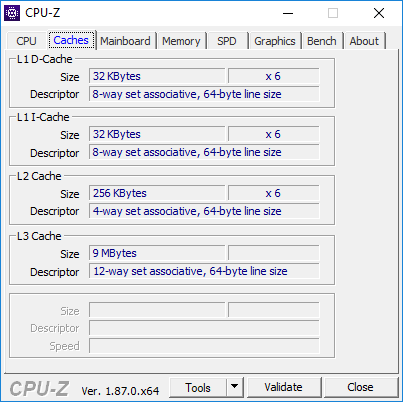
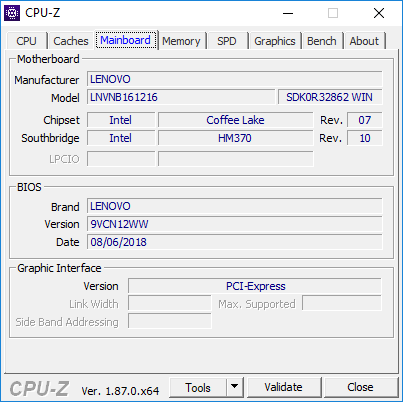
Breve Análise do Portátil Lenovo Legion Y7000 (i7-8750H, GTX 1060)
| Networking | |
| iperf3 transmit AX12 | |
| Lenovo Legion Y7000P-1060 | |
| Lenovo Legion Y530-15ICH | |
| HP Pavilion Gaming 15t-cx0000 | |
| Dell XPS 15 9570 i7 UHD | |
| iperf3 receive AX12 | |
| HP Pavilion Gaming 15t-cx0000 | |
| Lenovo Legion Y530-15ICH | |
| Lenovo Legion Y7000P-1060 | |
| Dell XPS 15 9570 i7 UHD | |
| |||||||||||||||||||||||||
iluminação: 88 %
iluminação com acumulador: 312.9 cd/m²
Contraste: 846:1 (Preto: 0.37 cd/m²)
ΔE ColorChecker Calman: 5.49 | ∀{0.5-29.43 Ø4.72}
calibrated: 3.99
ΔE Greyscale Calman: 4.7 | ∀{0.09-98 Ø4.97}
86.1% sRGB (Argyll 1.6.3 3D)
56.3% AdobeRGB 1998 (Argyll 1.6.3 3D)
63.1% AdobeRGB 1998 (Argyll 3D)
86.4% sRGB (Argyll 3D)
66.1% Display P3 (Argyll 3D)
Gamma: 2.29
CCT: 6779 K
| Lenovo Legion Y7000P-1060 BOE NV156FHM-N61, IPS, 15.6", 1920x1080 | Dell XPS 15 2018 i5 FHD 97Wh Sharp SHP149A LQ156M1, LED IGZO IPS InfinityEdge, 15.6", 1920x1080 | MSI GF63 8RC AU Optronics B156HAN02.1, IPS, 15.6", 1920x1080 | HP Pavilion Gaming 15t-cx0000 AU Optronics AUO82ED, IPS, 15.6", 1920x1080 | Lenovo Legion Y530-15ICH B156HAN02.1, IPS, 15.6", 1920x1080 | Dell G7 15-7588 LG Philips LGD053F, IPS, 15.6", 1920x1080 | |
|---|---|---|---|---|---|---|
| Display | 6% | -35% | 4% | -38% | -39% | |
| Display P3 Coverage (%) | 66.1 | 66 0% | 39.43 -40% | 66.5 1% | 38.31 -42% | 37.82 -43% |
| sRGB Coverage (%) | 86.4 | 96.5 12% | 59.3 -31% | 91.7 6% | 57.3 -34% | 56.2 -35% |
| AdobeRGB 1998 Coverage (%) | 63.1 | 66.7 6% | 40.73 -35% | 67.1 6% | 39.58 -37% | 39.2 -38% |
| Response Times | 2% | 23% | 64% | 4% | 18% | |
| Response Time Grey 50% / Grey 80% * (ms) | 42.8 ? | 49 ? -14% | 33.2 ? 22% | 17.6 ? 59% | 43.6 ? -2% | 38.8 ? 9% |
| Response Time Black / White * (ms) | 36 ? | 30 ? 17% | 27.2 ? 24% | 11.2 ? 69% | 32.4 ? 10% | 26.8 ? 26% |
| PWM Frequency (Hz) | 21740 ? | 961 ? | ||||
| Screen | 33% | -17% | 14% | -18% | -39% | |
| Brightness middle (cd/m²) | 312.9 | 413 32% | 266.6 -15% | 357.5 14% | 282.8 -10% | 250.9 -20% |
| Brightness (cd/m²) | 296 | 378 28% | 257 -13% | 351 19% | 264 -11% | 246 -17% |
| Brightness Distribution (%) | 88 | 86 -2% | 89 1% | 85 -3% | 88 0% | 89 1% |
| Black Level * (cd/m²) | 0.37 | 0.29 22% | 0.29 22% | 0.36 3% | 0.42 -14% | 0.34 8% |
| Contrast (:1) | 846 | 1424 68% | 919 9% | 993 17% | 673 -20% | 738 -13% |
| Colorchecker dE 2000 * | 5.49 | 2.44 56% | 5.93 -8% | 4.19 24% | 4.93 10% | 7.34 -34% |
| Colorchecker dE 2000 max. * | 8.78 | 4.46 49% | 16.28 -85% | 6.97 21% | 17.65 -101% | 28.66 -226% |
| Colorchecker dE 2000 calibrated * | 3.99 | 2.48 38% | 3.6 10% | 3.2 20% | 4.07 -2% | 4.42 -11% |
| Greyscale dE 2000 * | 4.7 | 2.48 47% | 6.8 -45% | 3.5 26% | 3.8 19% | 6.8 -45% |
| Gamma | 2.29 96% | 2.43 91% | 2.43 91% | 2.324 95% | 2.449 90% | 2.164 102% |
| CCT | 6779 96% | 7006 93% | 7192 90% | 7028 92% | 6112 106% | 6780 96% |
| Color Space (Percent of AdobeRGB 1998) (%) | 56.3 | 62 10% | 37.6 -33% | 60 7% | 36 -36% | 36 -36% |
| Color Space (Percent of sRGB) (%) | 86.1 | 96 11% | 59.3 -31% | 91 6% | 57 -34% | 56 -35% |
| Média Total (Programa/Configurações) | 14% /
24% | -10% /
-16% | 27% /
18% | -17% /
-19% | -20% /
-32% |
* ... menor é melhor
Exibir tempos de resposta
| ↔ Tempo de resposta preto para branco | ||
|---|---|---|
| 36 ms ... ascensão ↗ e queda ↘ combinadas | ↗ 19.6 ms ascensão | 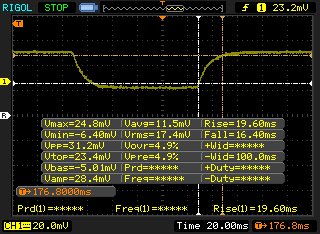 |
| ↘ 16.4 ms queda | ||
| A tela mostra taxas de resposta lentas em nossos testes e será insatisfatória para os jogadores. Em comparação, todos os dispositivos testados variam de 0.1 (mínimo) a 240 (máximo) ms. » 94 % de todos os dispositivos são melhores. Isso significa que o tempo de resposta medido é pior que a média de todos os dispositivos testados (19.8 ms). | ||
| ↔ Tempo de resposta 50% cinza a 80% cinza | ||
| 42.8 ms ... ascensão ↗ e queda ↘ combinadas | ↗ 22.4 ms ascensão | 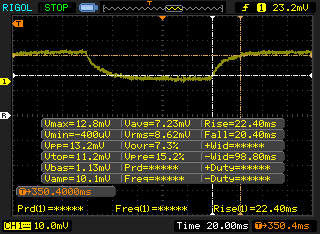 |
| ↘ 20.4 ms queda | ||
| A tela mostra taxas de resposta lentas em nossos testes e será insatisfatória para os jogadores. Em comparação, todos os dispositivos testados variam de 0.165 (mínimo) a 636 (máximo) ms. » 70 % de todos os dispositivos são melhores. Isso significa que o tempo de resposta medido é pior que a média de todos os dispositivos testados (31 ms). | ||
Cintilação da tela / PWM (modulação por largura de pulso)
| Tela tremeluzindo/PWM detectado | 21740 Hz | ≤ 99 % configuração de brilho | 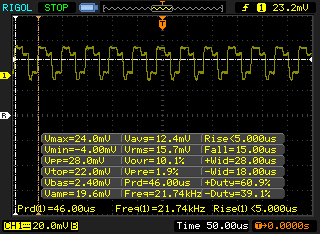 |
A luz de fundo da tela pisca em 21740 Hz (pior caso, por exemplo, utilizando PWM) Cintilação detectada em uma configuração de brilho de 99 % e abaixo. Não deve haver cintilação ou PWM acima desta configuração de brilho. A frequência de 21740 Hz é bastante alta, então a maioria dos usuários sensíveis ao PWM não deve notar nenhuma oscilação. [pwm_comparison] Em comparação: 52 % de todos os dispositivos testados não usam PWM para escurecer a tela. Se PWM foi detectado, uma média de 7769 (mínimo: 5 - máximo: 343500) Hz foi medida. | |||
| Cinebench R15 | |
| CPU Single 64Bit | |
| Intel Core i9-9900K, AMD Radeon RX Vega 64 | |
| Eurocom Sky X4C | |
| Lenovo Legion Y7000P-1060 | |
| Média Intel Core i7-8750H (163 - 177, n=86) | |
| Lenovo Legion Y530-15ICH | |
| Lenovo Yoga C930-13IKB 81C4 | |
| Asus Zephyrus S GX531GS | |
| Lenovo Ideapad 720S-15IKB 81AC001AGE | |
| Lenovo Legion Y520-15IKBA-80WY001VGE | |
| Lenovo Ideapad 720S-13ARR | |
| CPU Multi 64Bit | |
| Intel Core i9-9900K, AMD Radeon RX Vega 64 | |
| Eurocom Sky X4C | |
| Lenovo Legion Y7000P-1060 | |
| Asus Zephyrus S GX531GS | |
| Média Intel Core i7-8750H (863 - 1251, n=93) | |
| Lenovo Legion Y530-15ICH | |
| Lenovo Ideapad 720S-15IKB 81AC001AGE | |
| Lenovo Yoga C930-13IKB 81C4 | |
| Lenovo Ideapad 720S-13ARR | |
| Lenovo Legion Y520-15IKBA-80WY001VGE | |
| PCMark 8 Home Score Accelerated v2 | 4403 pontos | |
| PCMark 8 Work Score Accelerated v2 | 5282 pontos | |
| PCMark 10 Score | 5250 pontos | |
Ajuda | ||
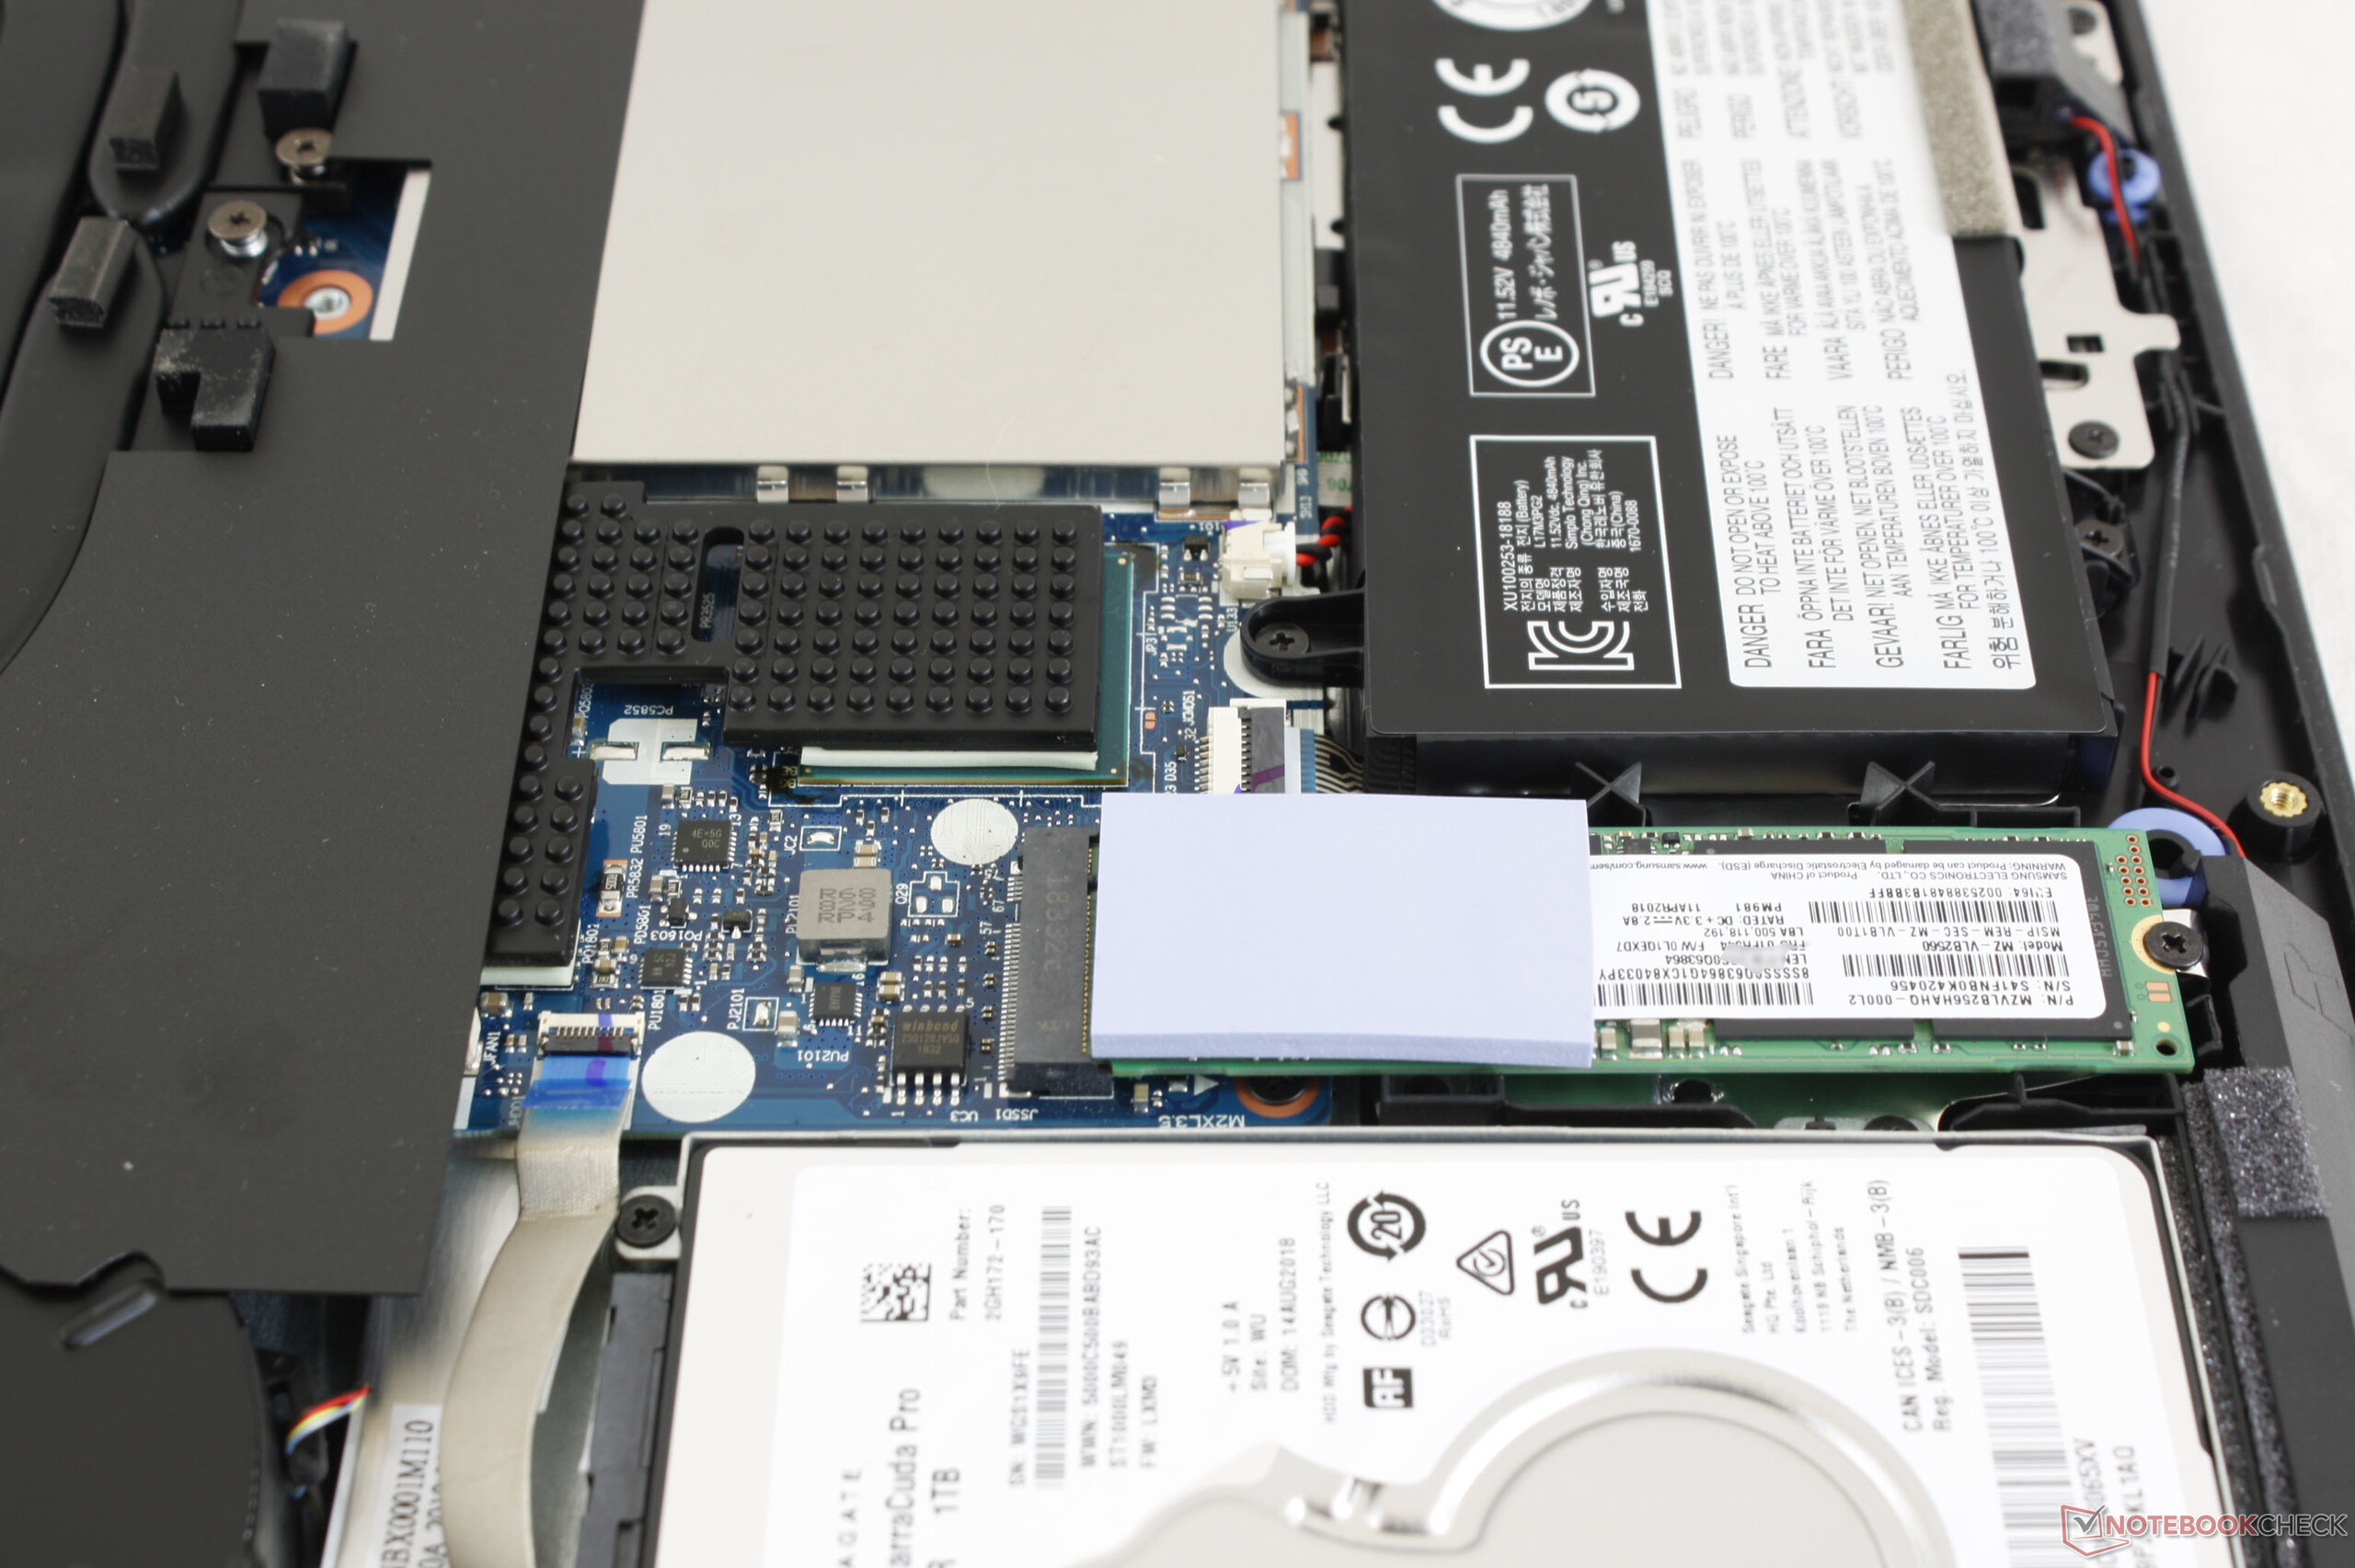
| Lenovo Legion Y7000P-1060 Samsung SSD PM981 MZVLB256HAHQ | HP Pavilion Gaming 15t-cx0000 Samsung SSD PM981 MZVLB512HAJQ | Lenovo Legion Y530-15ICH Toshiba KBG30ZMT128G | Asus Zephyrus S GX531GS WDC PC SN520 SDAPNUW-512G | Eurocom Sky X4C Samsung SSD 960 Pro 1TB m.2 NVMe | |
|---|---|---|---|---|---|
| AS SSD | 30% | -137% | 7% | 46% | |
| Seq Read (MB/s) | 864 | 1235 43% | 1231 42% | 903 5% | 2541 194% |
| Seq Write (MB/s) | 1646 | 1829 11% | 131.6 -92% | 1261 -23% | 1989 21% |
| 4K Read (MB/s) | 32.4 | 35.03 8% | 38.71 19% | 40.02 24% | 44.83 38% |
| 4K Write (MB/s) | 88 | 95.9 9% | 35.74 -59% | 103.6 18% | 129.6 47% |
| 4K-64 Read (MB/s) | 770 | 1160 51% | 335.3 -56% | 1030 34% | 1646 114% |
| 4K-64 Write (MB/s) | 1392 | 1808 30% | 78.9 -94% | 1285 -8% | 1375 -1% |
| Access Time Read * (ms) | 0.103 | 0.051 50% | 0.626 -508% | 0.129 -25% | 0.032 69% |
| Access Time Write * (ms) | 0.044 | 0.038 14% | 0.287 -552% | 0.036 18% | 0.03 32% |
| Score Read (Points) | 888 | 1319 49% | 497 -44% | 1161 31% | 1945 119% |
| Score Write (Points) | 1644 | 2087 27% | 128 -92% | 1515 -8% | 1703 4% |
| Score Total (Points) | 3032 | 4113 36% | 838 -72% | 3294 9% | 4615 52% |
| Copy ISO MB/s (MB/s) | 1677 | 1908 14% | |||
| Copy Program MB/s (MB/s) | 764 | 467.2 -39% | |||
| Copy Game MB/s (MB/s) | 1298 | 1055 -19% | |||
| CrystalDiskMark 5.2 / 6 | 31% | -39% | 0% | 55% | |
| Write 4K (MB/s) | 92.3 | 129.5 40% | 71.8 -22% | 98.2 6% | 158.6 72% |
| Read 4K (MB/s) | 39.04 | 44.61 14% | 41.03 5% | 39.43 1% | 55.2 41% |
| Write Seq (MB/s) | 1218 | 1268 4% | 349 -71% | 1386 14% | 1568 29% |
| Read Seq (MB/s) | 755 | 992 31% | 736 -3% | 1100 46% | 1411 87% |
| Write 4K Q32T1 (MB/s) | 280.7 | 535 91% | 105.3 -62% | 270.3 -4% | 545 94% |
| Read 4K Q32T1 (MB/s) | 328 | 601 83% | 308 -6% | 340.3 4% | 661 102% |
| Write Seq Q32T1 (MB/s) | 1698 | 1938 14% | 151.4 -91% | 1454 -14% | 2054 21% |
| Read Seq Q32T1 (MB/s) | 3430 | 2306 -33% | 1262 -63% | 1681 -51% | 3155 -8% |
| Média Total (Programa/Configurações) | 31% /
30% | -88% /
-96% | 4% /
4% | 51% /
49% |
* ... menor é melhor

| 3DMark 11 | |
| 1280x720 Performance GPU | |
| Eurocom Sky X4C | |
| Asus Zephyrus S GX531GS | |
| Nvidia GeForce GTX 1060 Founders Edition 6 GB | |
| Média NVIDIA GeForce GTX 1060 Mobile (12620 - 15607, n=77) | |
| Lenovo Legion Y7000P-1060 | |
| Dell G7 15-7588 | |
| Lenovo IdeaPad Y900 | |
| Lenovo Legion Y530-15ICH | |
| Dell XPS 15 9570 i7 UHD | |
| Lenovo Legion Y520-15IKBA-80WY001VGE | |
| Lenovo Ideapad 720S-15IKB 81AC001AGE | |
| Dell XPS 15 2018 i5 FHD 97Wh | |
| Lenovo Ideapad Y700 17ISK 80Q0 | |
| 1280x720 Performance Combined | |
| Eurocom Sky X4C | |
| Lenovo Legion Y7000P-1060 | |
| Nvidia GeForce GTX 1060 Founders Edition 6 GB | |
| Asus Zephyrus S GX531GS | |
| Dell G7 15-7588 | |
| Lenovo IdeaPad Y900 | |
| Dell XPS 15 9570 i7 UHD | |
| Média NVIDIA GeForce GTX 1060 Mobile (5655 - 12930, n=76) | |
| Lenovo Ideapad 720S-15IKB 81AC001AGE | |
| Dell XPS 15 2018 i5 FHD 97Wh | |
| Lenovo Legion Y530-15ICH | |
| Lenovo Legion Y520-15IKBA-80WY001VGE | |
| Lenovo Ideapad Y700 17ISK 80Q0 | |
| 3DMark | |
| 1920x1080 Fire Strike Graphics | |
| Eurocom Sky X4C | |
| Nvidia GeForce GTX 1060 Founders Edition 6 GB | |
| Lenovo Legion Y7000P-1060 | |
| Média NVIDIA GeForce GTX 1060 Mobile (10708 - 12298, n=77) | |
| Dell G7 15-7588 | |
| Lenovo IdeaPad Y900 | |
| Lenovo Legion Y530-15ICH | |
| Dell XPS 15 9570 i7 UHD | |
| Lenovo Ideapad 720S-15IKB 81AC001AGE | |
| Dell XPS 15 2018 i5 FHD 97Wh | |
| Lenovo Legion Y520-15IKBA-80WY001VGE | |
| Lenovo Ideapad Y700 17ISK 80Q0 | |
| 2560x1440 Time Spy Graphics | |
| Média NVIDIA GeForce GTX 1060 Mobile (3396 - 3790, n=20) | |
| Dell XPS 15 9570 i7 UHD | |
| 3DMark 11 Performance | 13743 pontos | |
| 3DMark Cloud Gate Standard Score | 33931 pontos | |
| 3DMark Fire Strike Score | 10343 pontos | |
Ajuda | ||
| The Witcher 3 - 1920x1080 Ultra Graphics & Postprocessing (HBAO+) | |
| Asus Zephyrus S GX531GS | |
| Nvidia GeForce GTX 1060 Founders Edition 6 GB | |
| MSI GS65 Stealth Thin 8RE-051US | |
| Lenovo Legion Y7000P-1060 | |
| Asus G752VY-GC110T | |
| Medion Erazer P6705-MD61131 | |
| baixo | média | alto | ultra | |
|---|---|---|---|---|
| BioShock Infinite (2013) | 277.1 | 244 | 224.2 | 111.7 |
| The Witcher 3 (2015) | 194.7 | 130.4 | 73.1 | 37 |
| Rise of the Tomb Raider (2016) | 164.1 | 131.4 | 75.2 | 61.4 |
| Lenovo Legion Y7000P-1060 GeForce GTX 1060 Mobile, i7-8750H, Samsung SSD PM981 MZVLB256HAHQ | Asus Zephyrus S GX531GS GeForce GTX 1070 Max-Q, i7-8750H, WDC PC SN520 SDAPNUW-512G | MSI GS65 Stealth Thin 8RE-051US GeForce GTX 1060 Mobile, i7-8750H, Samsung SSD PM981 MZVLB256HAHQ | Lenovo Legion Y530-15ICH GeForce GTX 1050 Ti Mobile, i5-8300H, Toshiba KBG30ZMT128G | Dell G7 15-7588 GeForce GTX 1060 Max-Q, i7-8750H, SK hynix SC311 SATA | |
|---|---|---|---|---|---|
| Noise | -10% | 4% | 9% | 2% | |
| desligado / ambiente * (dB) | 28.4 | 29 -2% | 28.4 -0% | 28 1% | 28.1 1% |
| Idle Minimum * (dB) | 31.1 | 33 -6% | 28.4 9% | 28 10% | 29 7% |
| Idle Average * (dB) | 31.1 | 34 -9% | 28.4 9% | 28 10% | 29 7% |
| Idle Maximum * (dB) | 31.2 | 40 -28% | 29.6 5% | 28.5 9% | 29.2 6% |
| Load Average * (dB) | 43.2 | 47 -9% | 43.5 -1% | 34.9 19% | 40.6 6% |
| Witcher 3 ultra * (dB) | 45.3 | 51 -13% | 45.7 -1% | 40 12% | 49.8 -10% |
| Load Maximum * (dB) | 50 | 53 -6% | 45.7 9% | 49.6 1% | 49.8 -0% |
* ... menor é melhor
Barulho
| Ocioso |
| 31.1 / 31.1 / 31.2 dB |
| HDD |
| 31.2 dB |
| Carga |
| 43.2 / 50 dB |
 | ||
30 dB silencioso 40 dB(A) audível 50 dB(A) ruidosamente alto |
||
min: | ||
(-) A temperatura máxima no lado superior é 53.4 °C / 128 F, em comparação com a média de 40.4 °C / 105 F , variando de 21.2 a 68.8 °C para a classe Gaming.
(-) A parte inferior aquece até um máximo de 51 °C / 124 F, em comparação com a média de 43.2 °C / 110 F
(+) Em uso inativo, a temperatura média para o lado superior é 27.1 °C / 81 F, em comparação com a média do dispositivo de 33.9 °C / ### class_avg_f### F.
(±) Jogando The Witcher 3, a temperatura média para o lado superior é 33.2 °C / 92 F, em comparação com a média do dispositivo de 33.9 °C / ## #class_avg_f### F.
(+) Os apoios para as mãos e o touchpad são mais frios que a temperatura da pele, com um máximo de 31 °C / 87.8 F e, portanto, são frios ao toque.
(-) A temperatura média da área do apoio para as mãos de dispositivos semelhantes foi 28.8 °C / 83.8 F (-2.2 °C / -4 F).
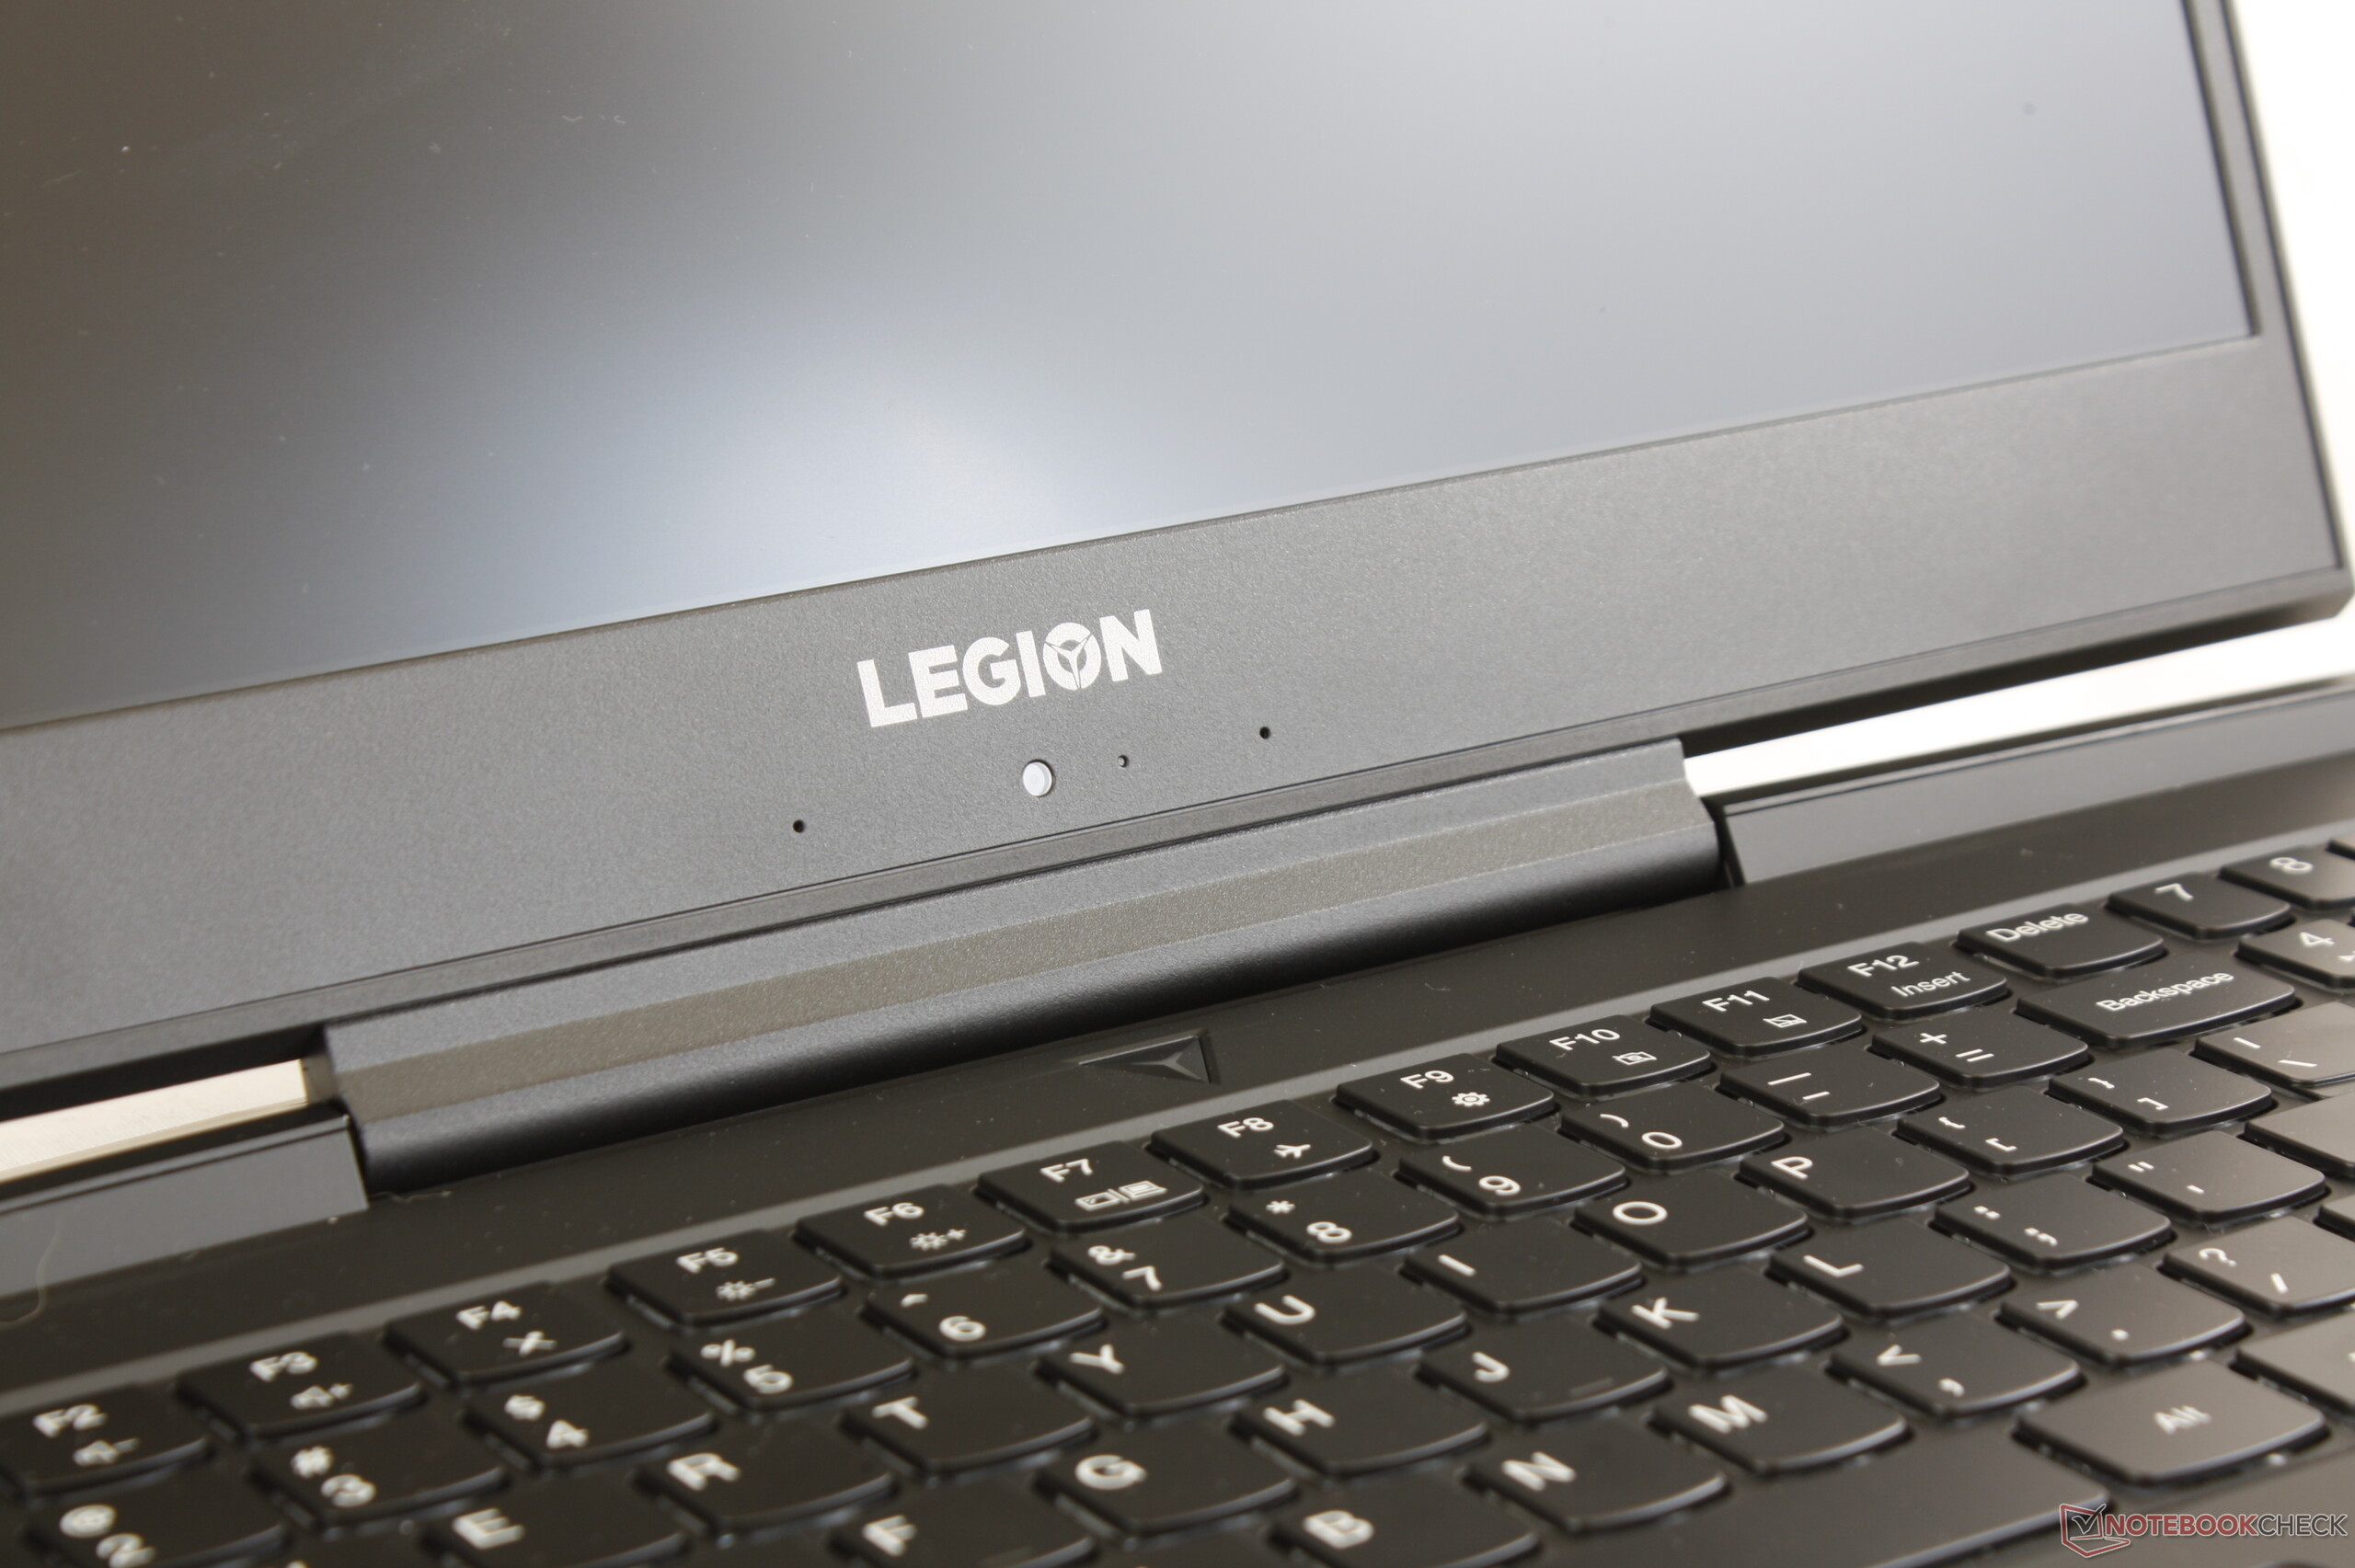
Lenovo Legion Y7000P-1060 análise de áudio
(±) | o volume do alto-falante é médio, mas bom (###valor### dB)
Graves 100 - 315Hz
(±) | graves reduzidos - em média 8% menor que a mediana
(±) | a linearidade dos graves é média (8.3% delta para a frequência anterior)
Médios 400 - 2.000 Hz
(±) | médios mais altos - em média 5.5% maior que a mediana
(+) | médios são lineares (6.3% delta para frequência anterior)
Altos 2 - 16 kHz
(±) | máximos mais altos - em média 6.1% maior que a mediana
(+) | os máximos são lineares (6.6% delta da frequência anterior)
Geral 100 - 16.000 Hz
(±) | a linearidade do som geral é média (20.6% diferença em relação à mediana)
Comparado com a mesma classe
» 74% de todos os dispositivos testados nesta classe foram melhores, 5% semelhantes, 21% piores
» O melhor teve um delta de 6%, a média foi 18%, o pior foi 132%
Comparado com todos os dispositivos testados
» 55% de todos os dispositivos testados foram melhores, 8% semelhantes, 37% piores
» O melhor teve um delta de 4%, a média foi 24%, o pior foi 134%
Apple MacBook 12 (Early 2016) 1.1 GHz análise de áudio
(+) | os alto-falantes podem tocar relativamente alto (###valor### dB)
Graves 100 - 315Hz
(±) | graves reduzidos - em média 11.3% menor que a mediana
(±) | a linearidade dos graves é média (14.2% delta para a frequência anterior)
Médios 400 - 2.000 Hz
(+) | médios equilibrados - apenas 2.4% longe da mediana
(+) | médios são lineares (5.5% delta para frequência anterior)
Altos 2 - 16 kHz
(+) | agudos equilibrados - apenas 2% longe da mediana
(+) | os máximos são lineares (4.5% delta da frequência anterior)
Geral 100 - 16.000 Hz
(+) | o som geral é linear (10.2% diferença em relação à mediana)
Comparado com a mesma classe
» 7% de todos os dispositivos testados nesta classe foram melhores, 2% semelhantes, 91% piores
» O melhor teve um delta de 5%, a média foi 18%, o pior foi 53%
Comparado com todos os dispositivos testados
» 5% de todos os dispositivos testados foram melhores, 1% semelhantes, 94% piores
» O melhor teve um delta de 4%, a média foi 24%, o pior foi 134%
| desligado | |
| Ocioso | |
| Carga |
|
Key:
min: | |
| Lenovo Legion Y7000P-1060 i7-8750H, GeForce GTX 1060 Mobile, Samsung SSD PM981 MZVLB256HAHQ, IPS, 1920x1080, 15.6" | MSI GF63 8RC i5-8300H, GeForce GTX 1050 Mobile, Seagate BarraCuda Pro Compute 1TB ST1000LM049, IPS, 1920x1080, 15.6" | Lenovo Legion Y530-15ICH i5-8300H, GeForce GTX 1050 Ti Mobile, Toshiba KBG30ZMT128G, IPS, 1920x1080, 15.6" | Dell G7 15-7588 i7-8750H, GeForce GTX 1060 Max-Q, SK hynix SC311 SATA, IPS, 1920x1080, 15.6" | Asus Zephyrus S GX531GS i7-8750H, GeForce GTX 1070 Max-Q, WDC PC SN520 SDAPNUW-512G, IPS, 1920x1080, 15.6" | Asus Strix GL502VY-DS71 6700HQ, GeForce GTX 980M, SanDisk SD8SN8U1T001122, IPS, 1920x1080, 15.6" | |
|---|---|---|---|---|---|---|
| Power Consumption | 13% | 10% | 12% | -86% | -110% | |
| Idle Minimum * (Watt) | 4.9 | 5.4 -10% | 4.5 8% | 5.5 -12% | 17 -247% | 20.6 -320% |
| Idle Average * (Watt) | 8.1 | 10.4 -28% | 10 -23% | 7.6 6% | 20 -147% | 22.1 -173% |
| Idle Maximum * (Watt) | 16.5 | 10.5 36% | 13.8 16% | 9 45% | 29 -76% | 22.5 -36% |
| Load Average * (Watt) | 109.2 | 84.7 22% | 92.5 15% | 94 14% | 112 -3% | 130.6 -20% |
| Witcher 3 ultra * (Watt) | 124.6 | 92.7 26% | 108.1 13% | 116.3 7% | 152 -22% | |
| Load Maximum * (Watt) | 175.2 | 119.9 32% | 123.2 30% | 154.4 12% | 211 -20% | 177.2 -1% |
* ... menor é melhor
| Lenovo Legion Y7000P-1060 i7-8750H, GeForce GTX 1060 Mobile, 57 Wh | MSI GF63 8RC i5-8300H, GeForce GTX 1050 Mobile, 51 Wh | Dell XPS 15 9570 i7 UHD i7-8750H, GeForce GTX 1050 Ti Max-Q, 97 Wh | Lenovo Legion Y530-15ICH i5-8300H, GeForce GTX 1050 Ti Mobile, 52.5 Wh | Dell G7 15-7588 i7-8750H, GeForce GTX 1060 Max-Q, 56 Wh | Asus Zephyrus S GX531GS i7-8750H, GeForce GTX 1070 Max-Q, 50 Wh | |
|---|---|---|---|---|---|---|
| Duração da bateria | -7% | 65% | -29% | 61% | -47% | |
| Reader / Idle (h) | 13.6 | 9.5 -30% | 10.9 -20% | 3.6 -74% | ||
| WiFi v1.3 (h) | 5.8 | 5.5 -5% | 9.6 66% | 4.1 -29% | 7.5 29% | 2.6 -55% |
| Load (h) | 0.8 | 0.9 13% | 1.3 63% | 2.2 175% | 0.7 -13% | |
| Witcher 3 ultra (h) | 1 |
Pro
Contra
O Lenovo Legion Y7000 pode ser melhor descrito como um Asus ROG GL504GM mas com menos recursos e melhor desempenho por dólar. Ambos sistemas têm a mesma CPU e GPU e ambos são quase iguais em tamanho. Os usuários que decidem pagar mais pelo Asus não estão necessariamente pagando por mais desempenho, mas estariam tendo mais alguns recursos ausentes da Lenovo, incluindo um leitor de cartões SD e uma luz de fundo RGB multi-zona. A partir dessa perspectiva, o Legion Y7000 oferece um valor de jogo incrível por centenas de dólares a menos, mantendo a mesma sensação e aparência.
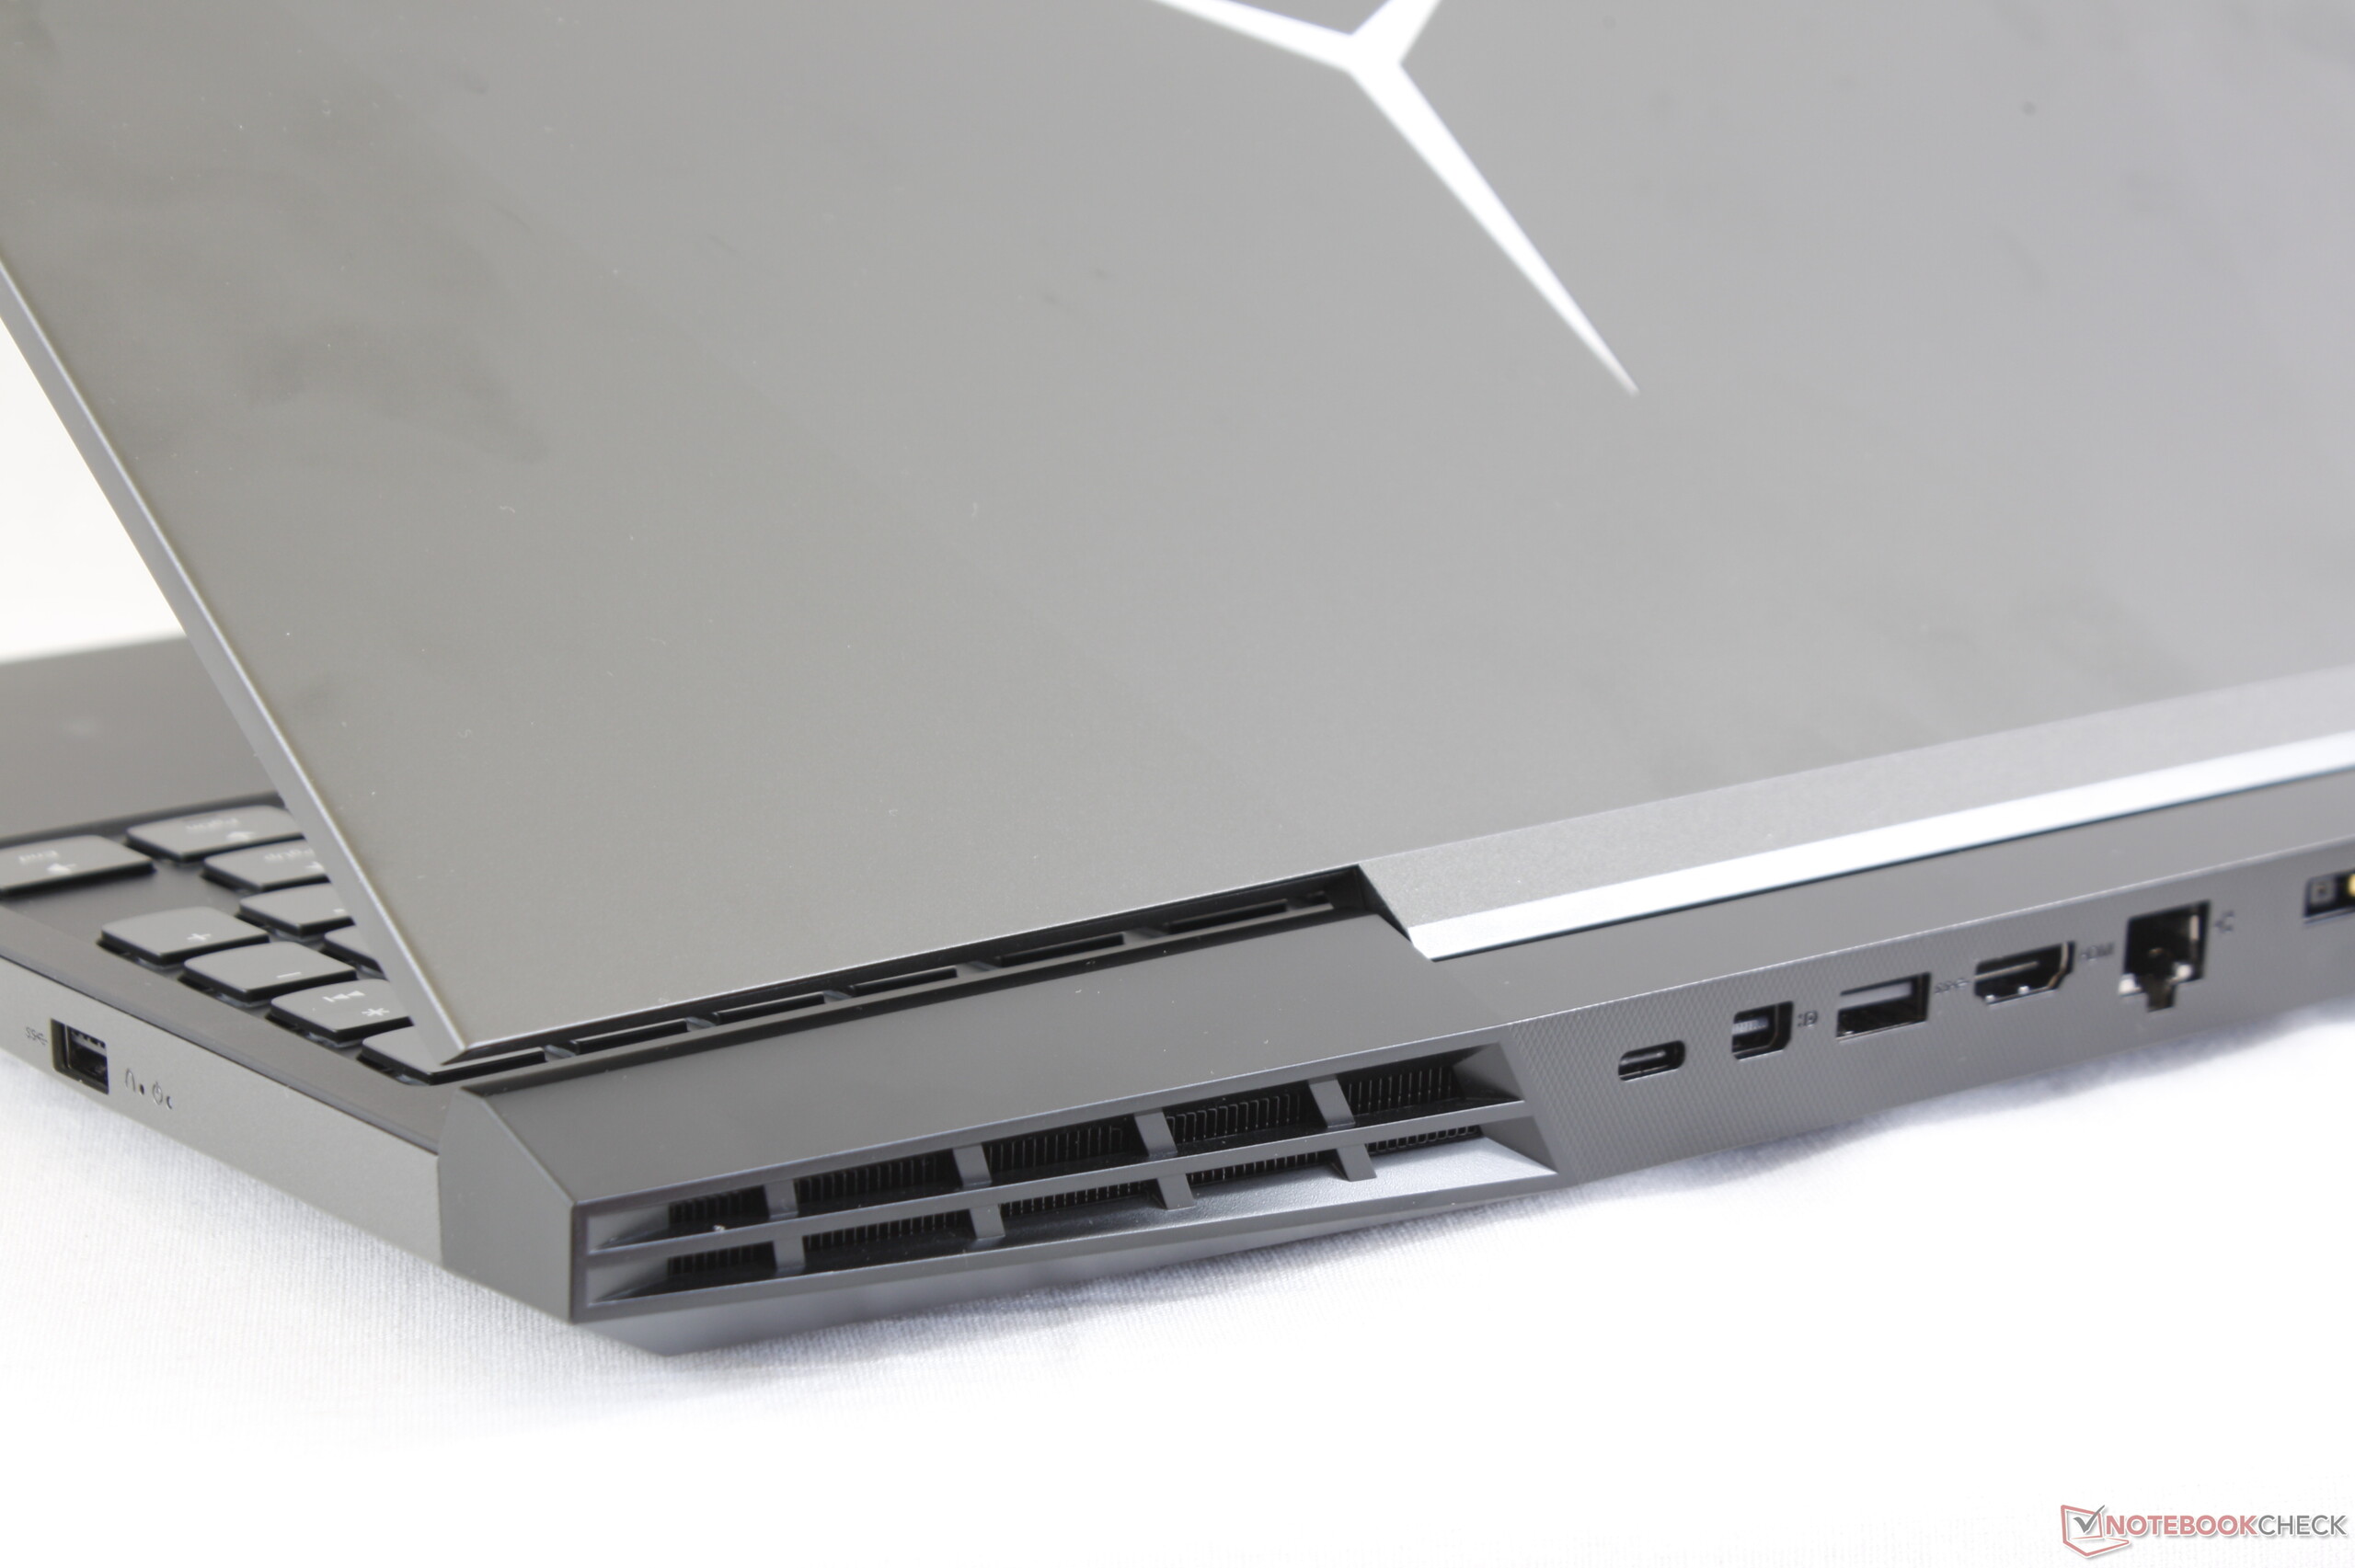
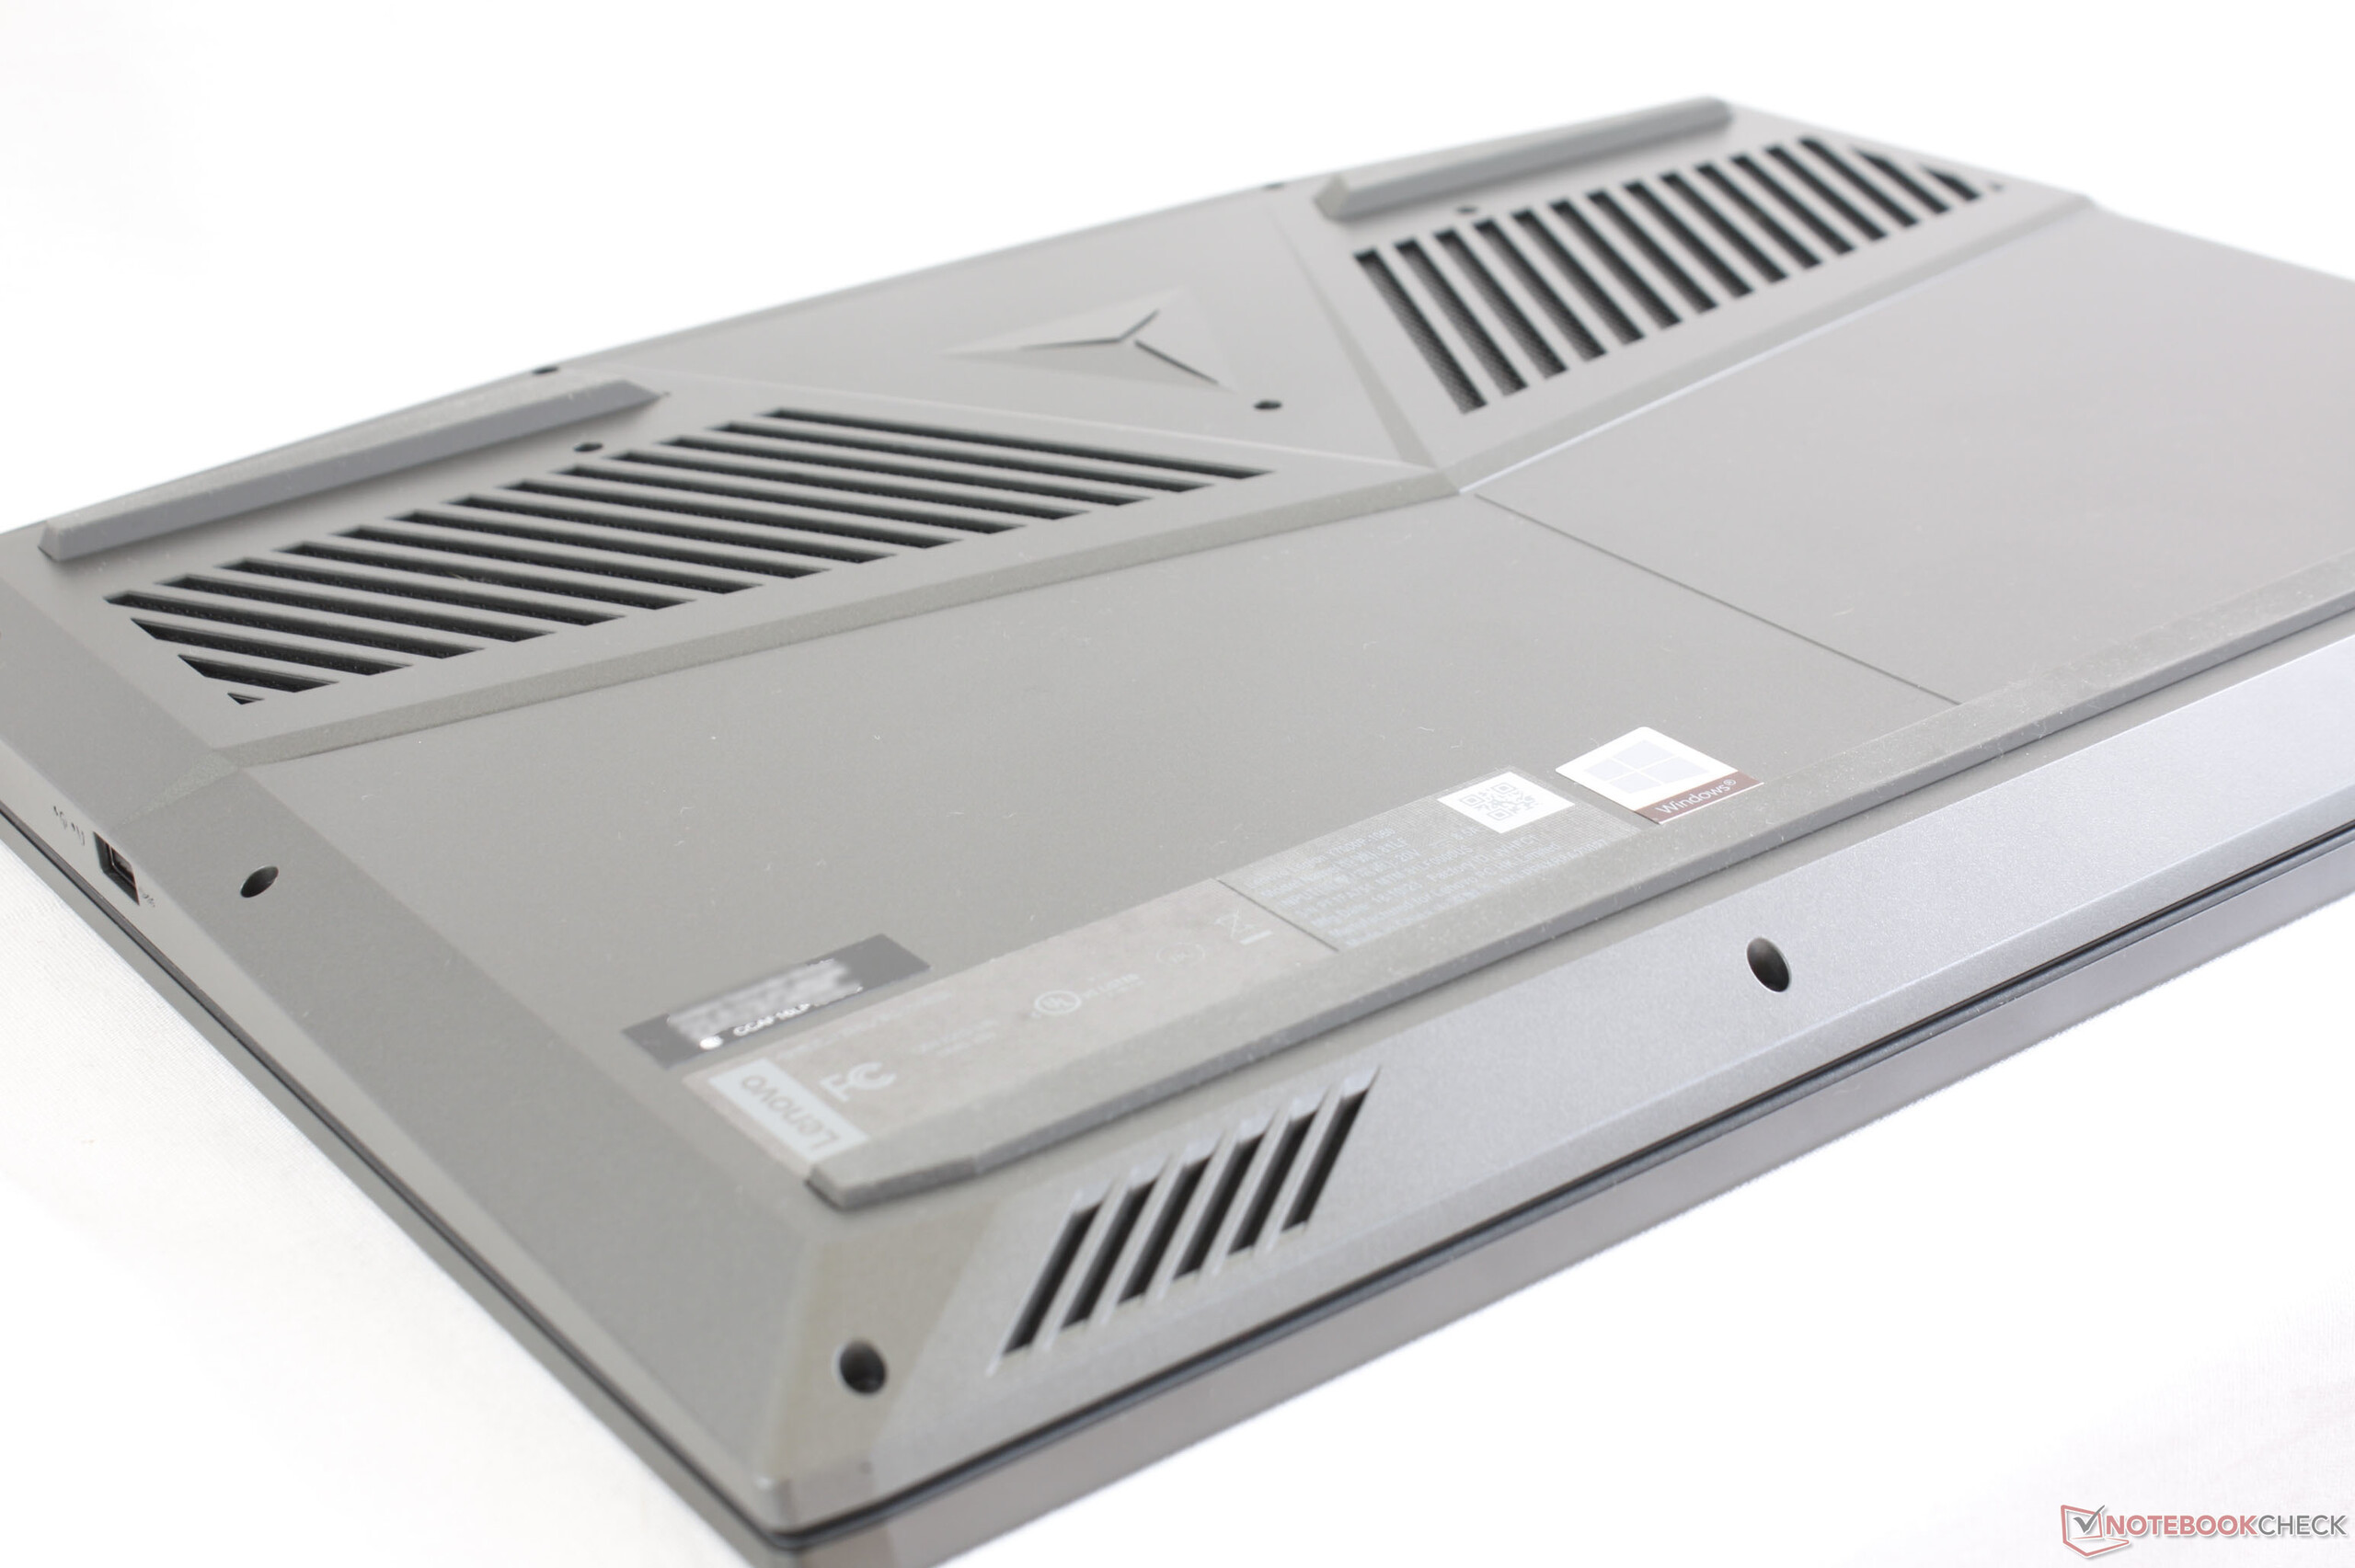
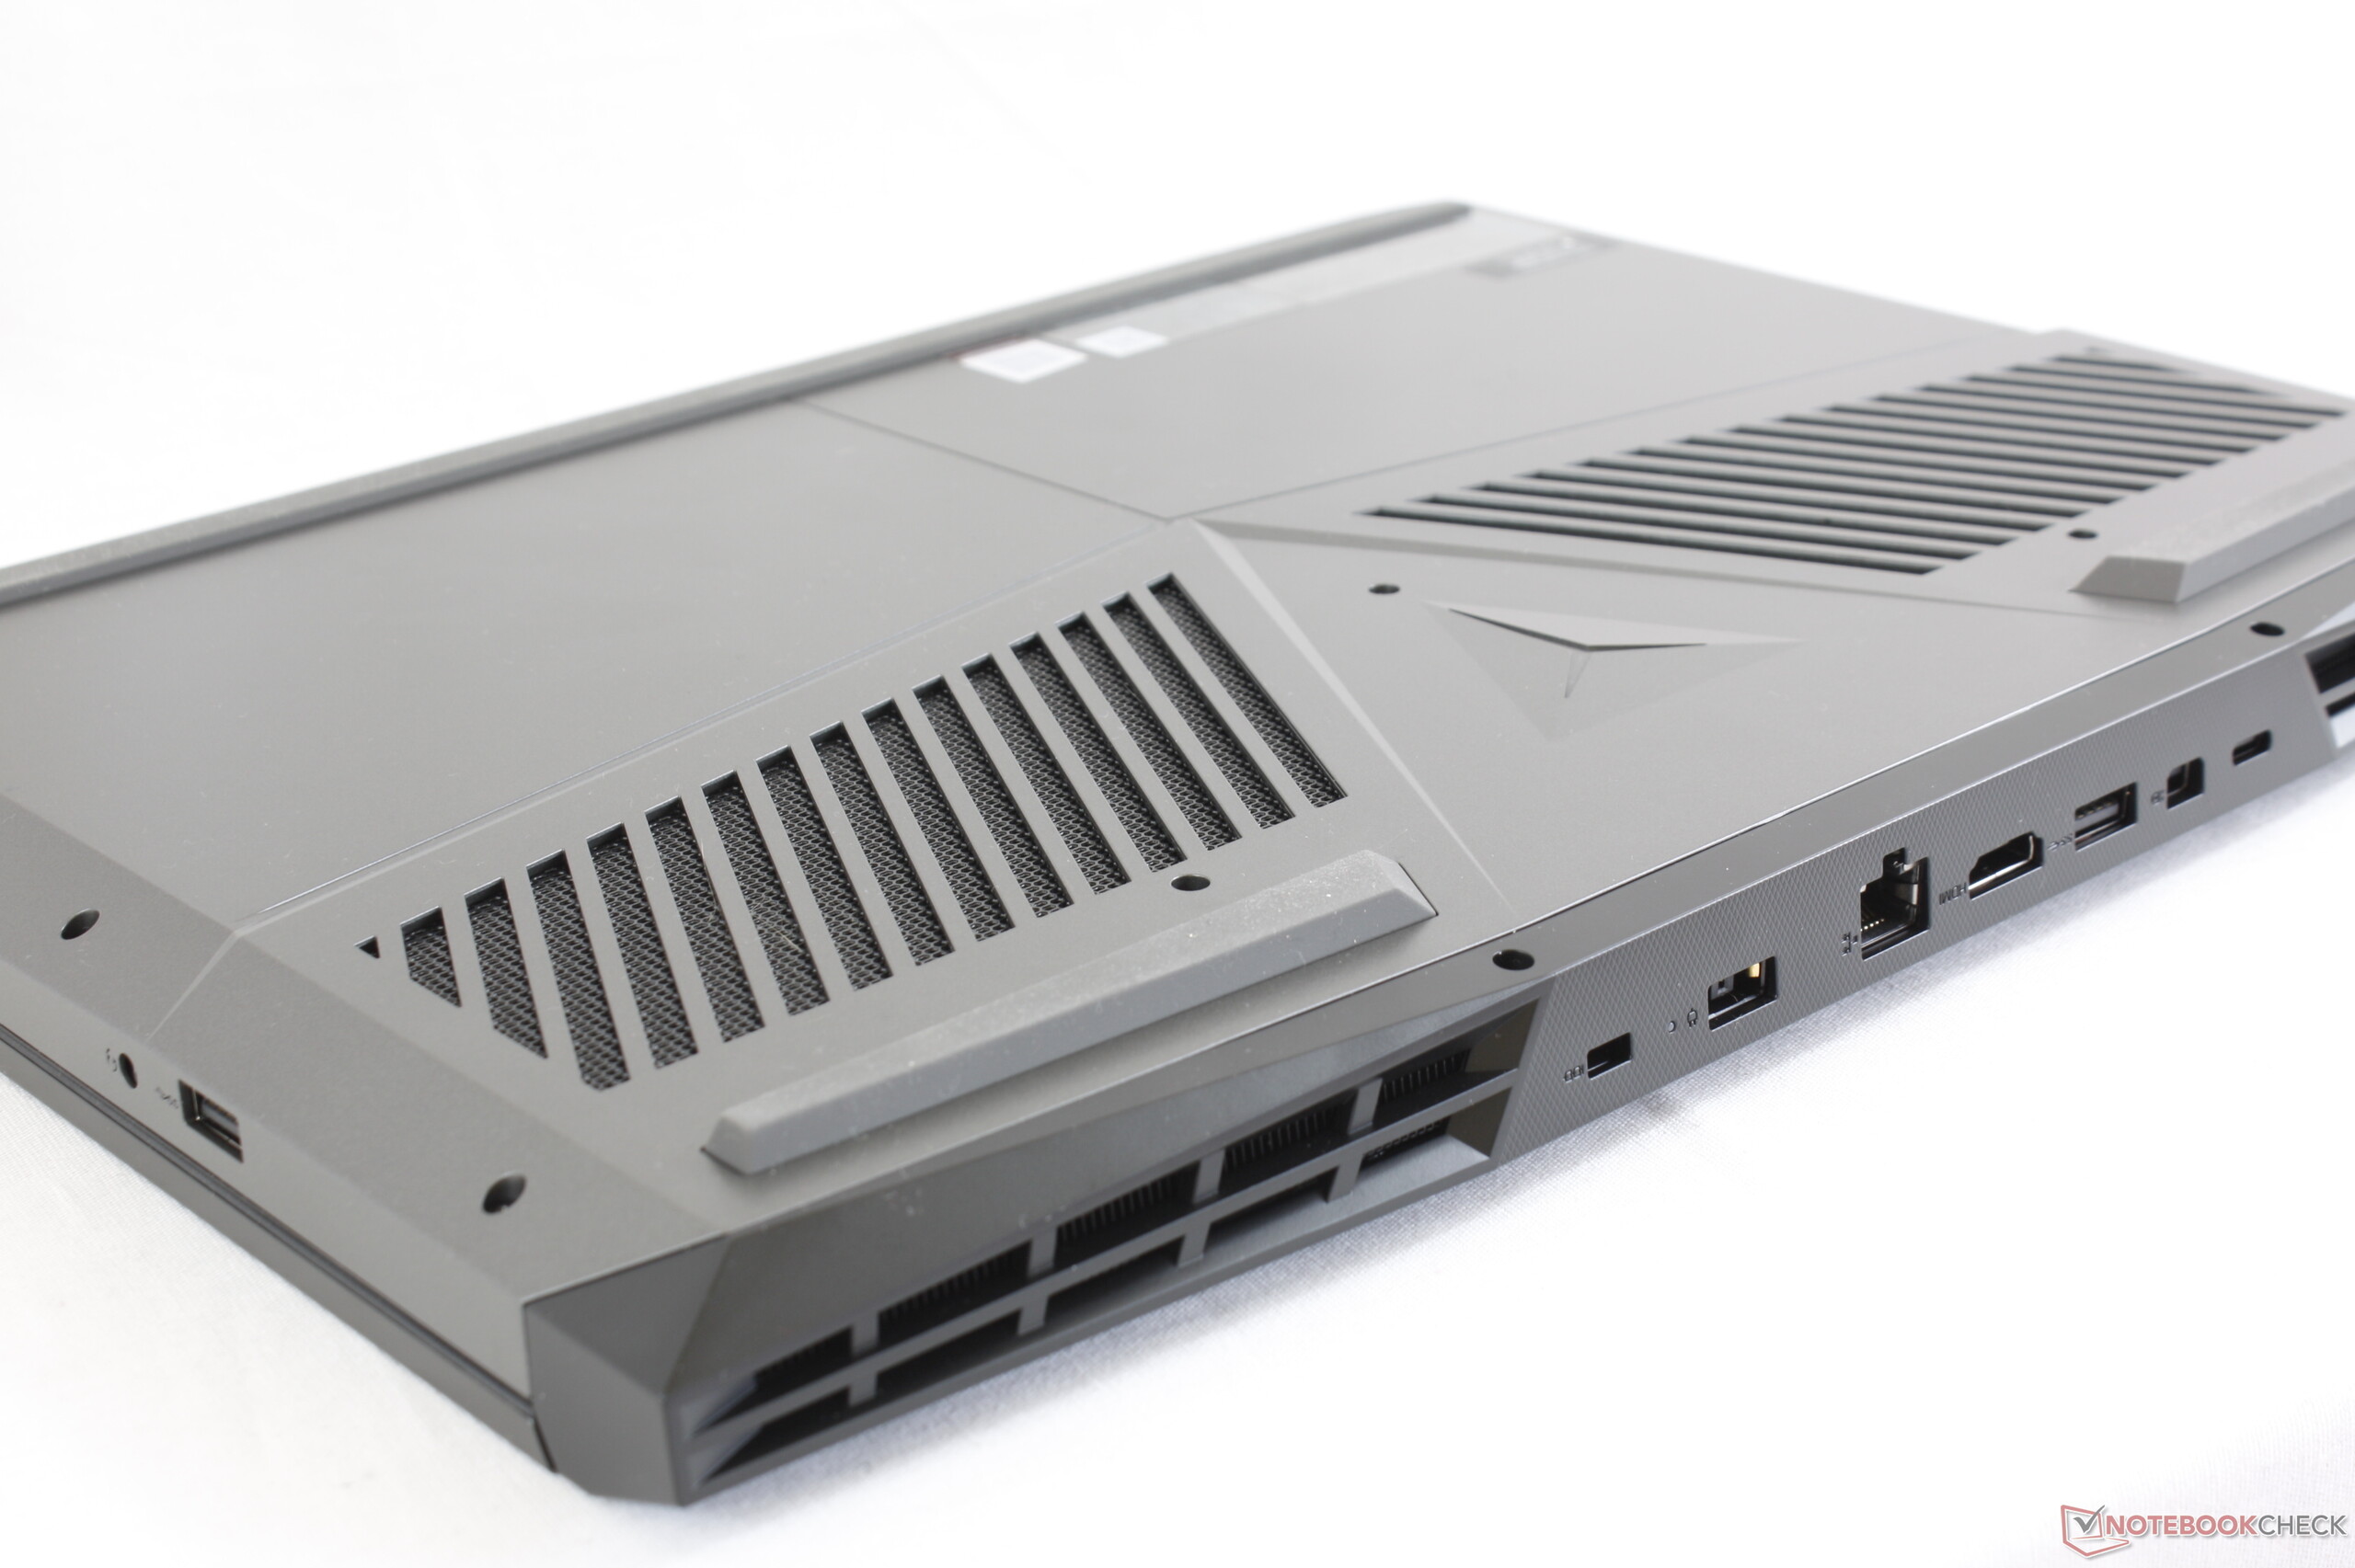
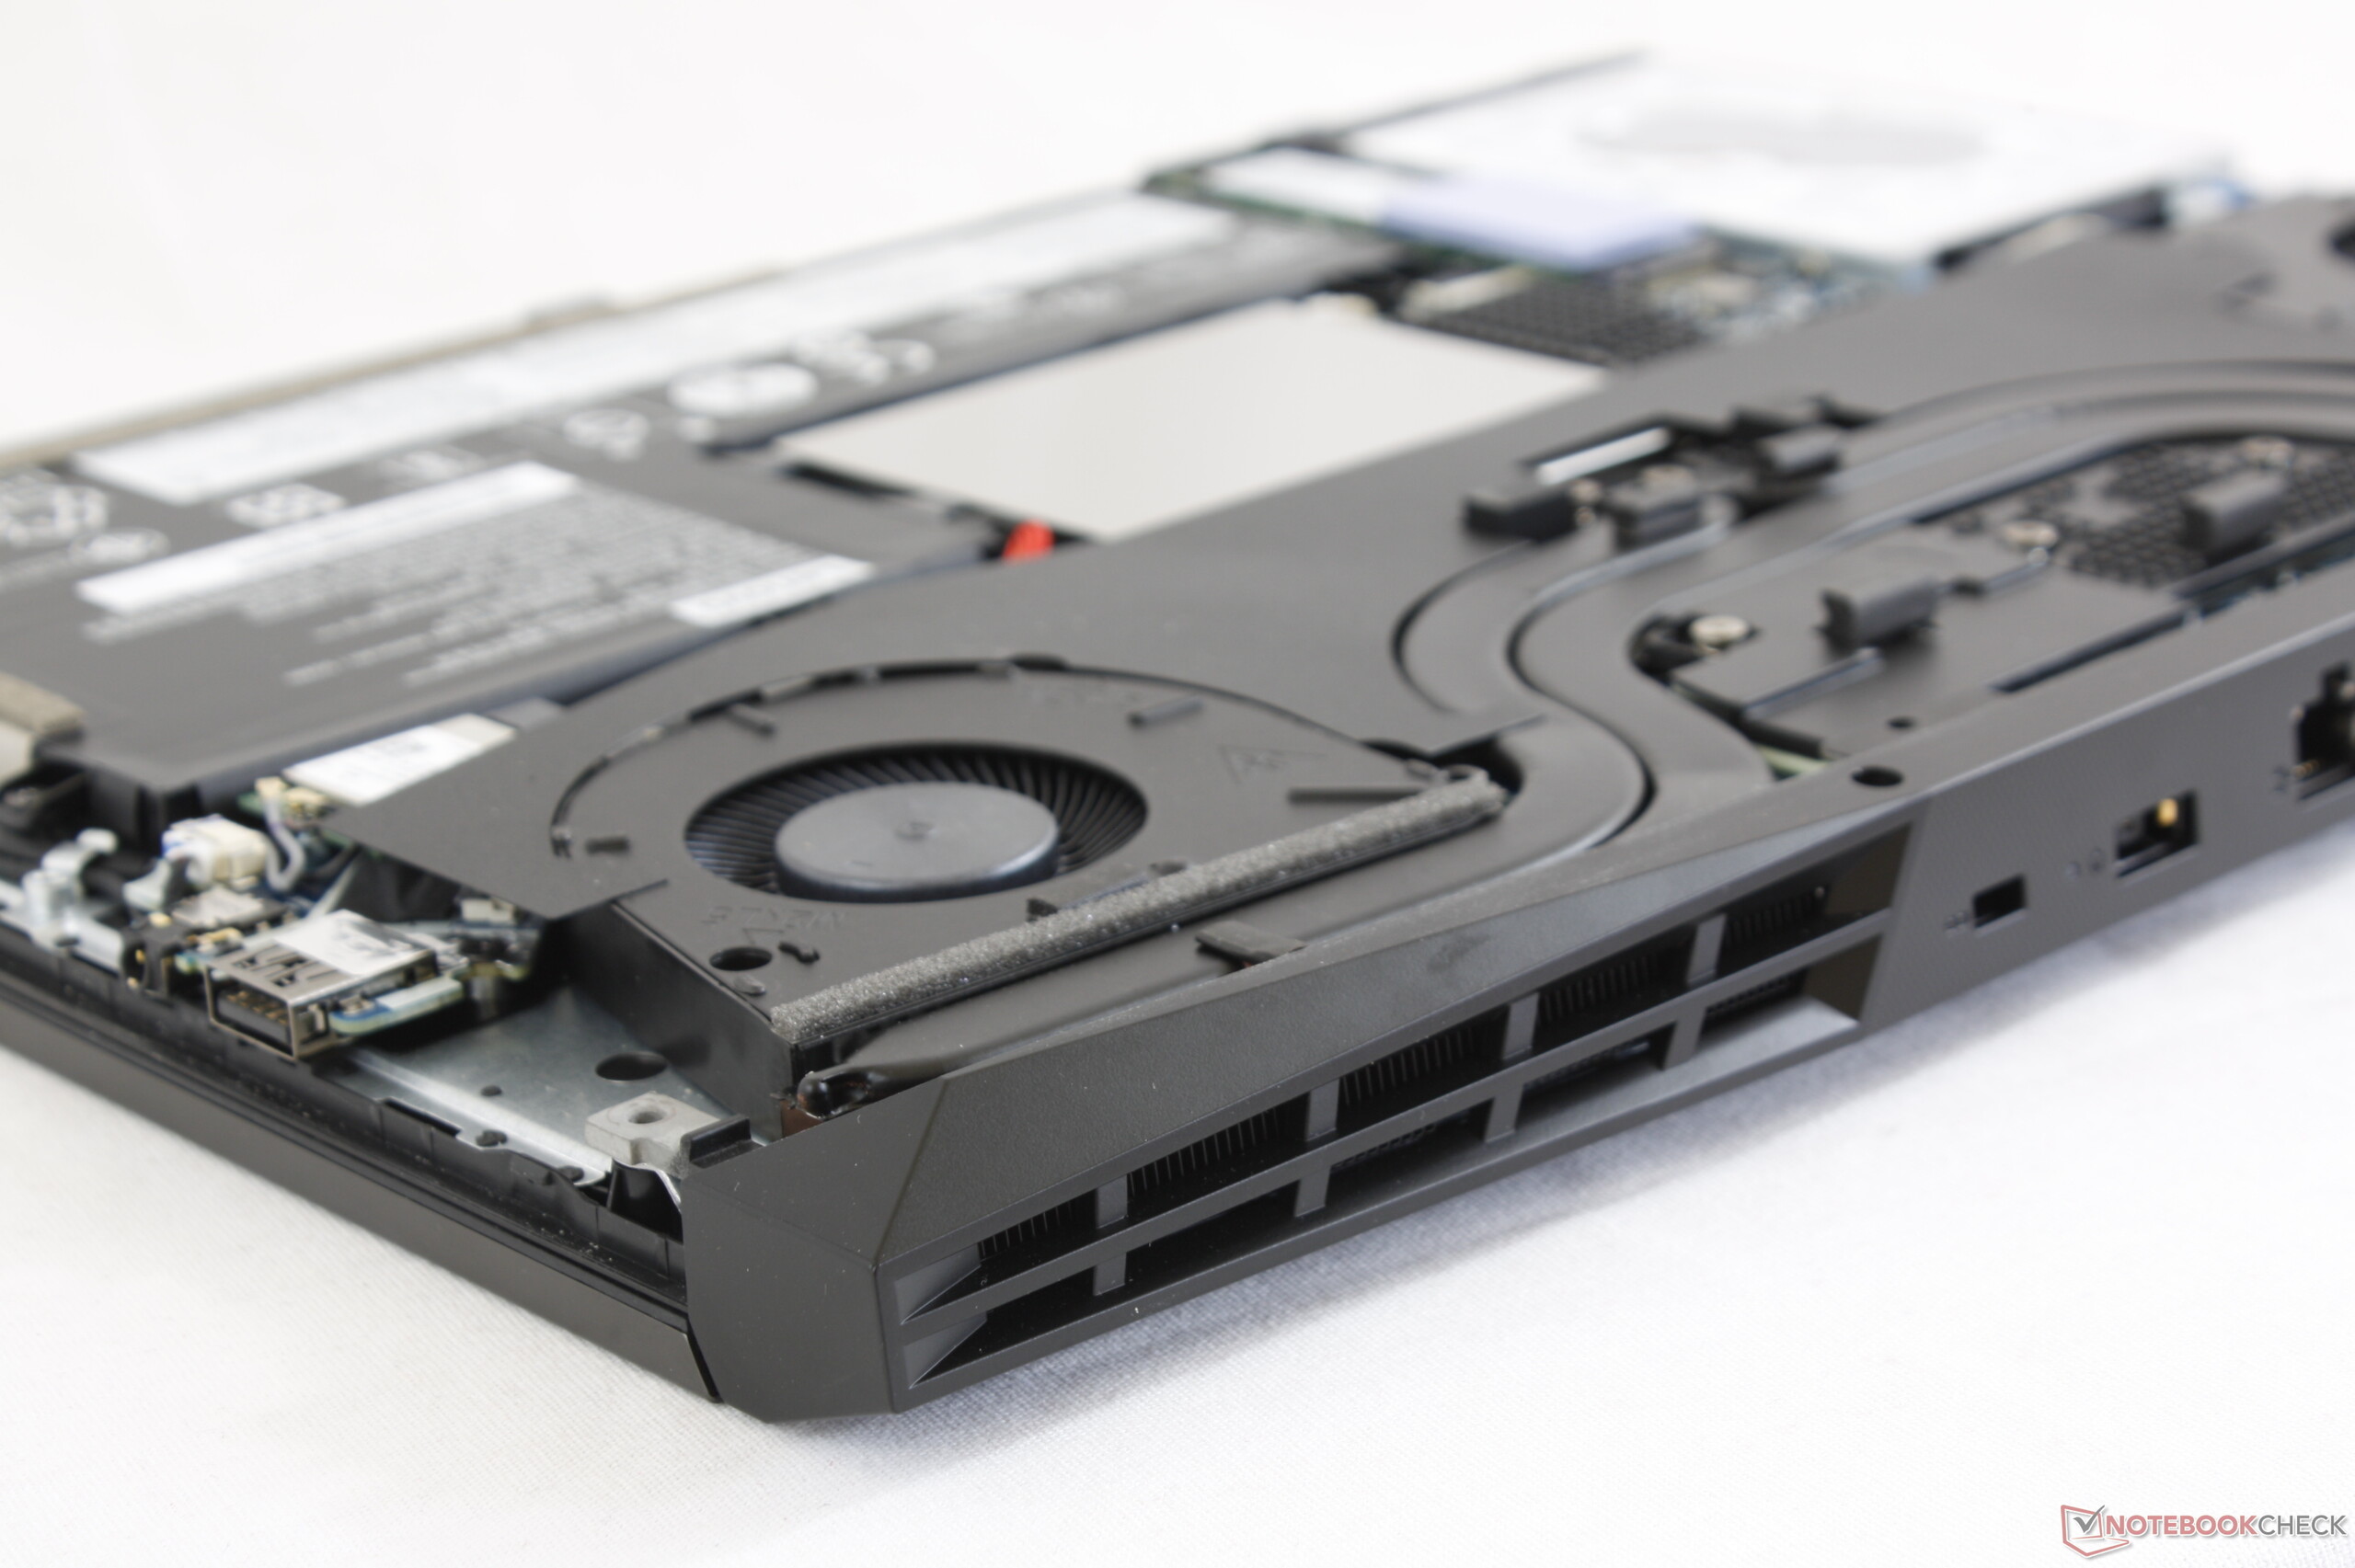
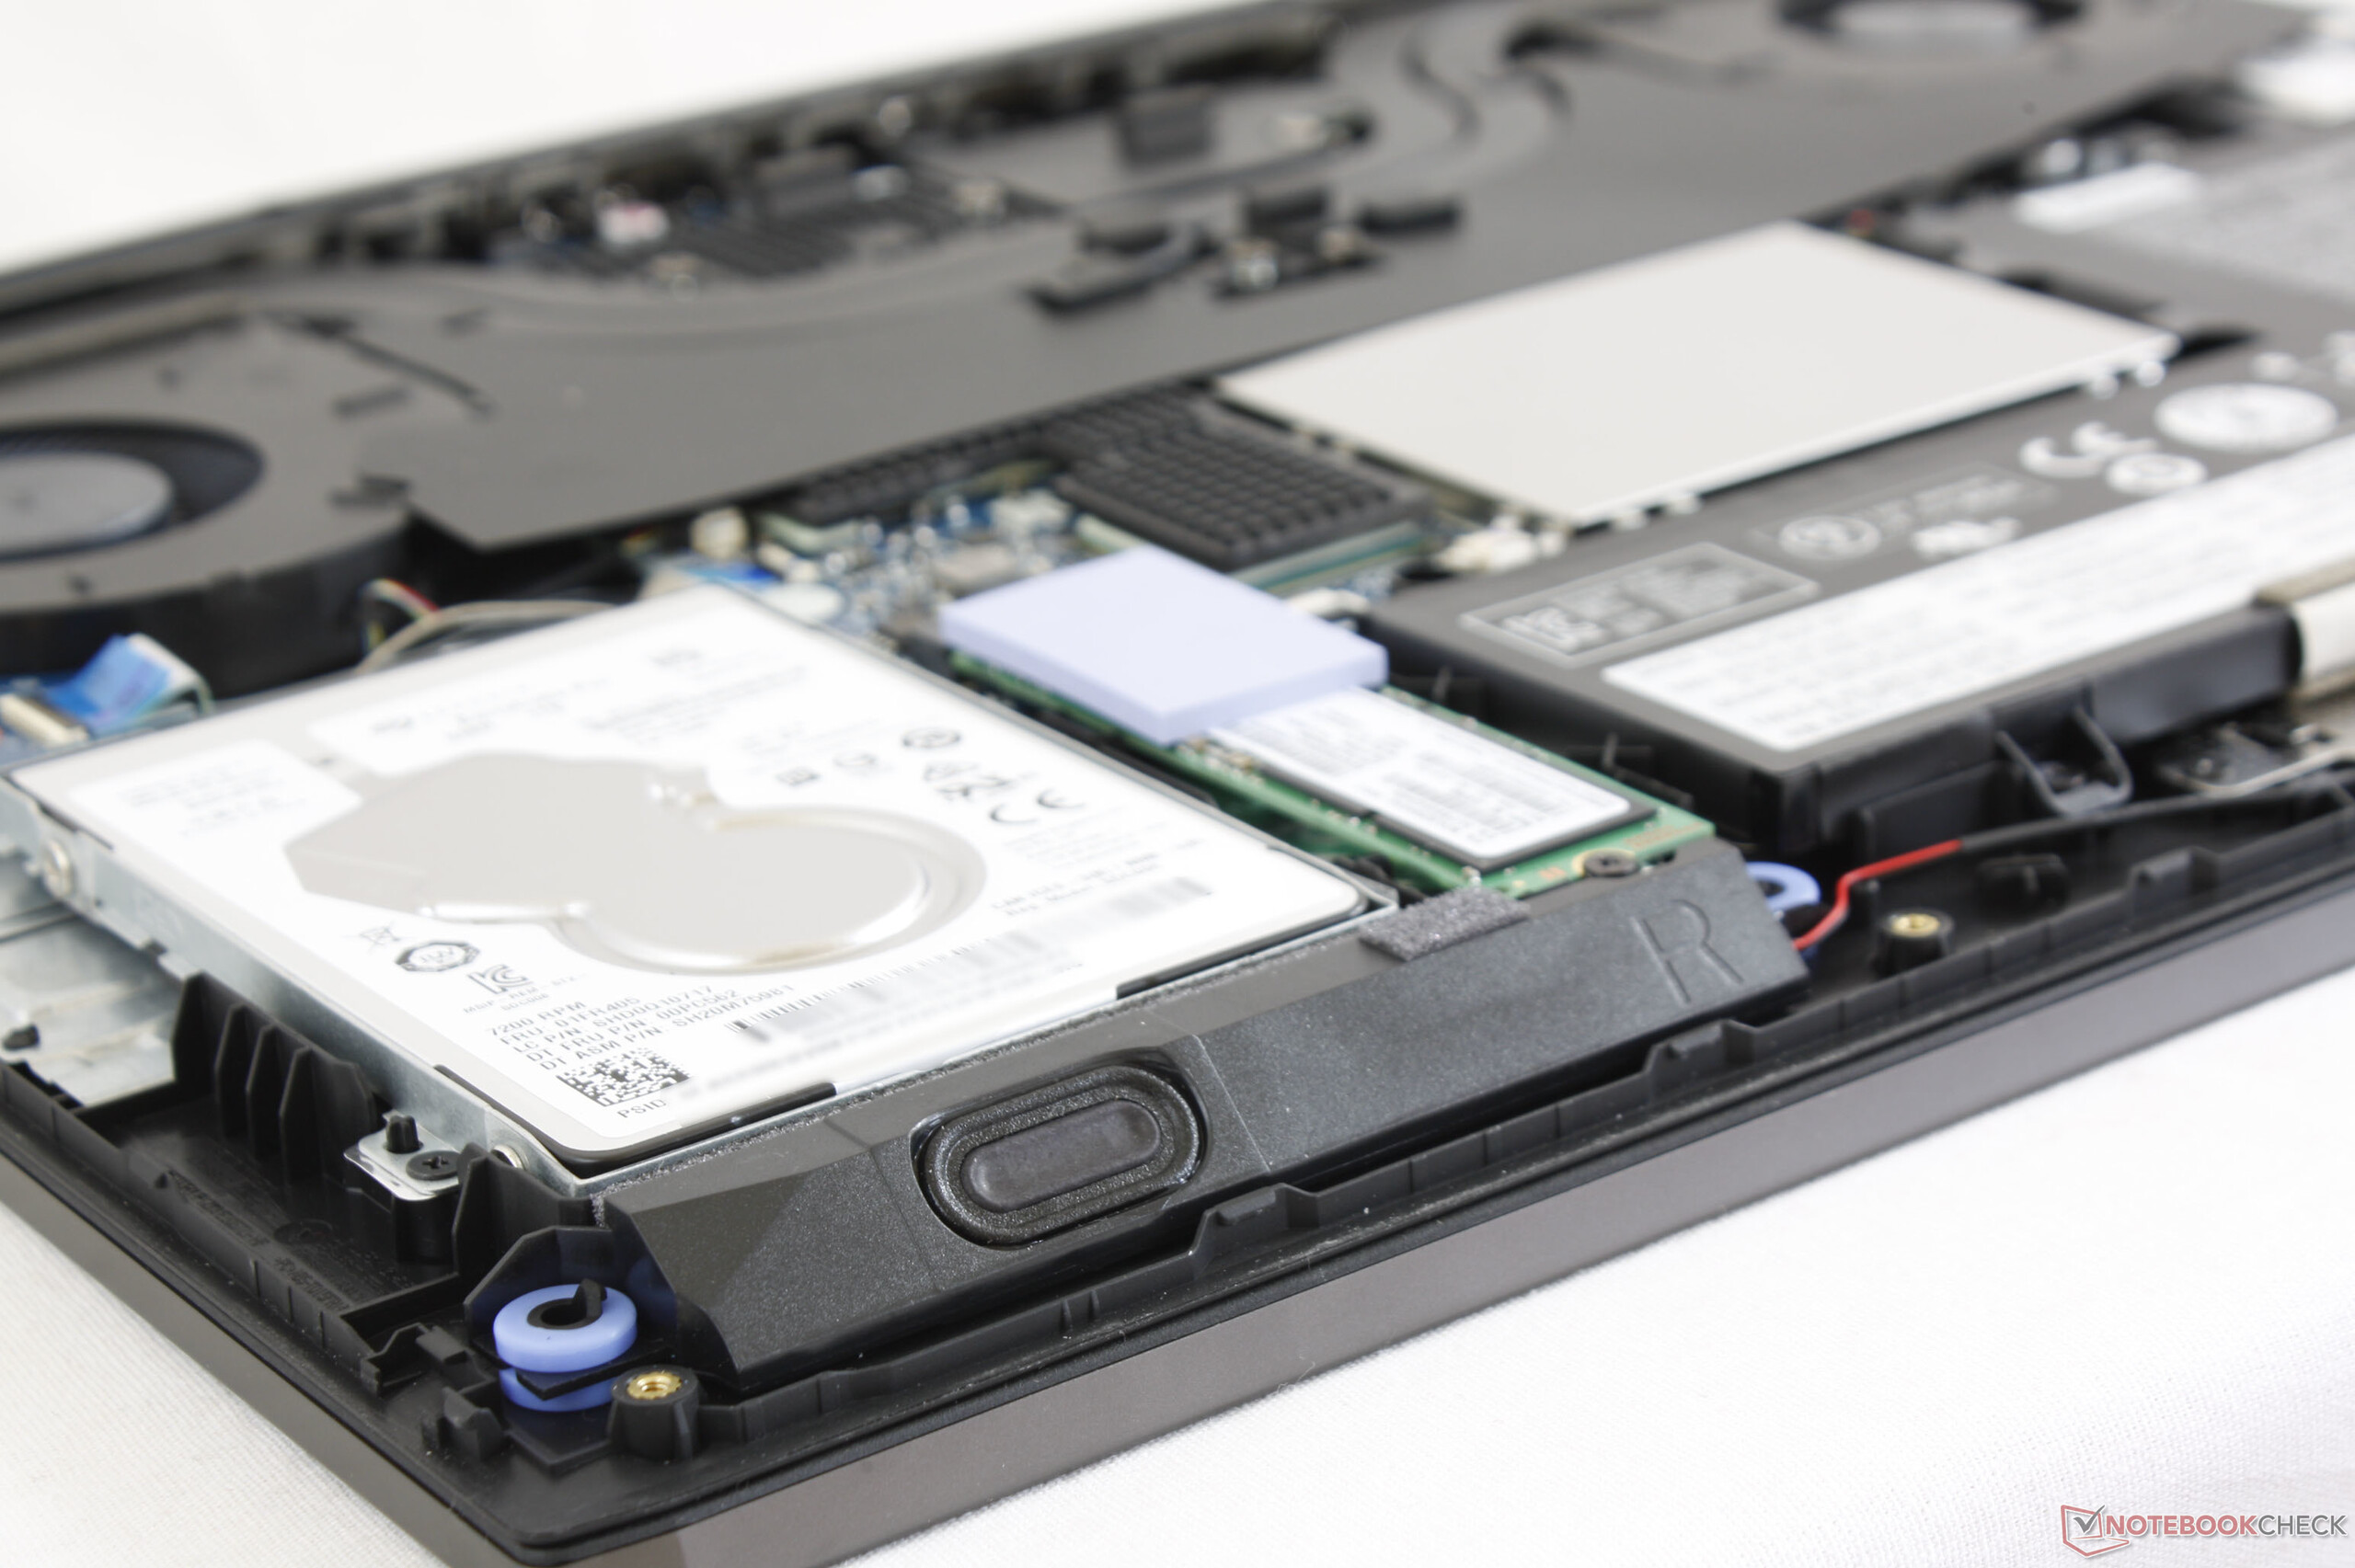
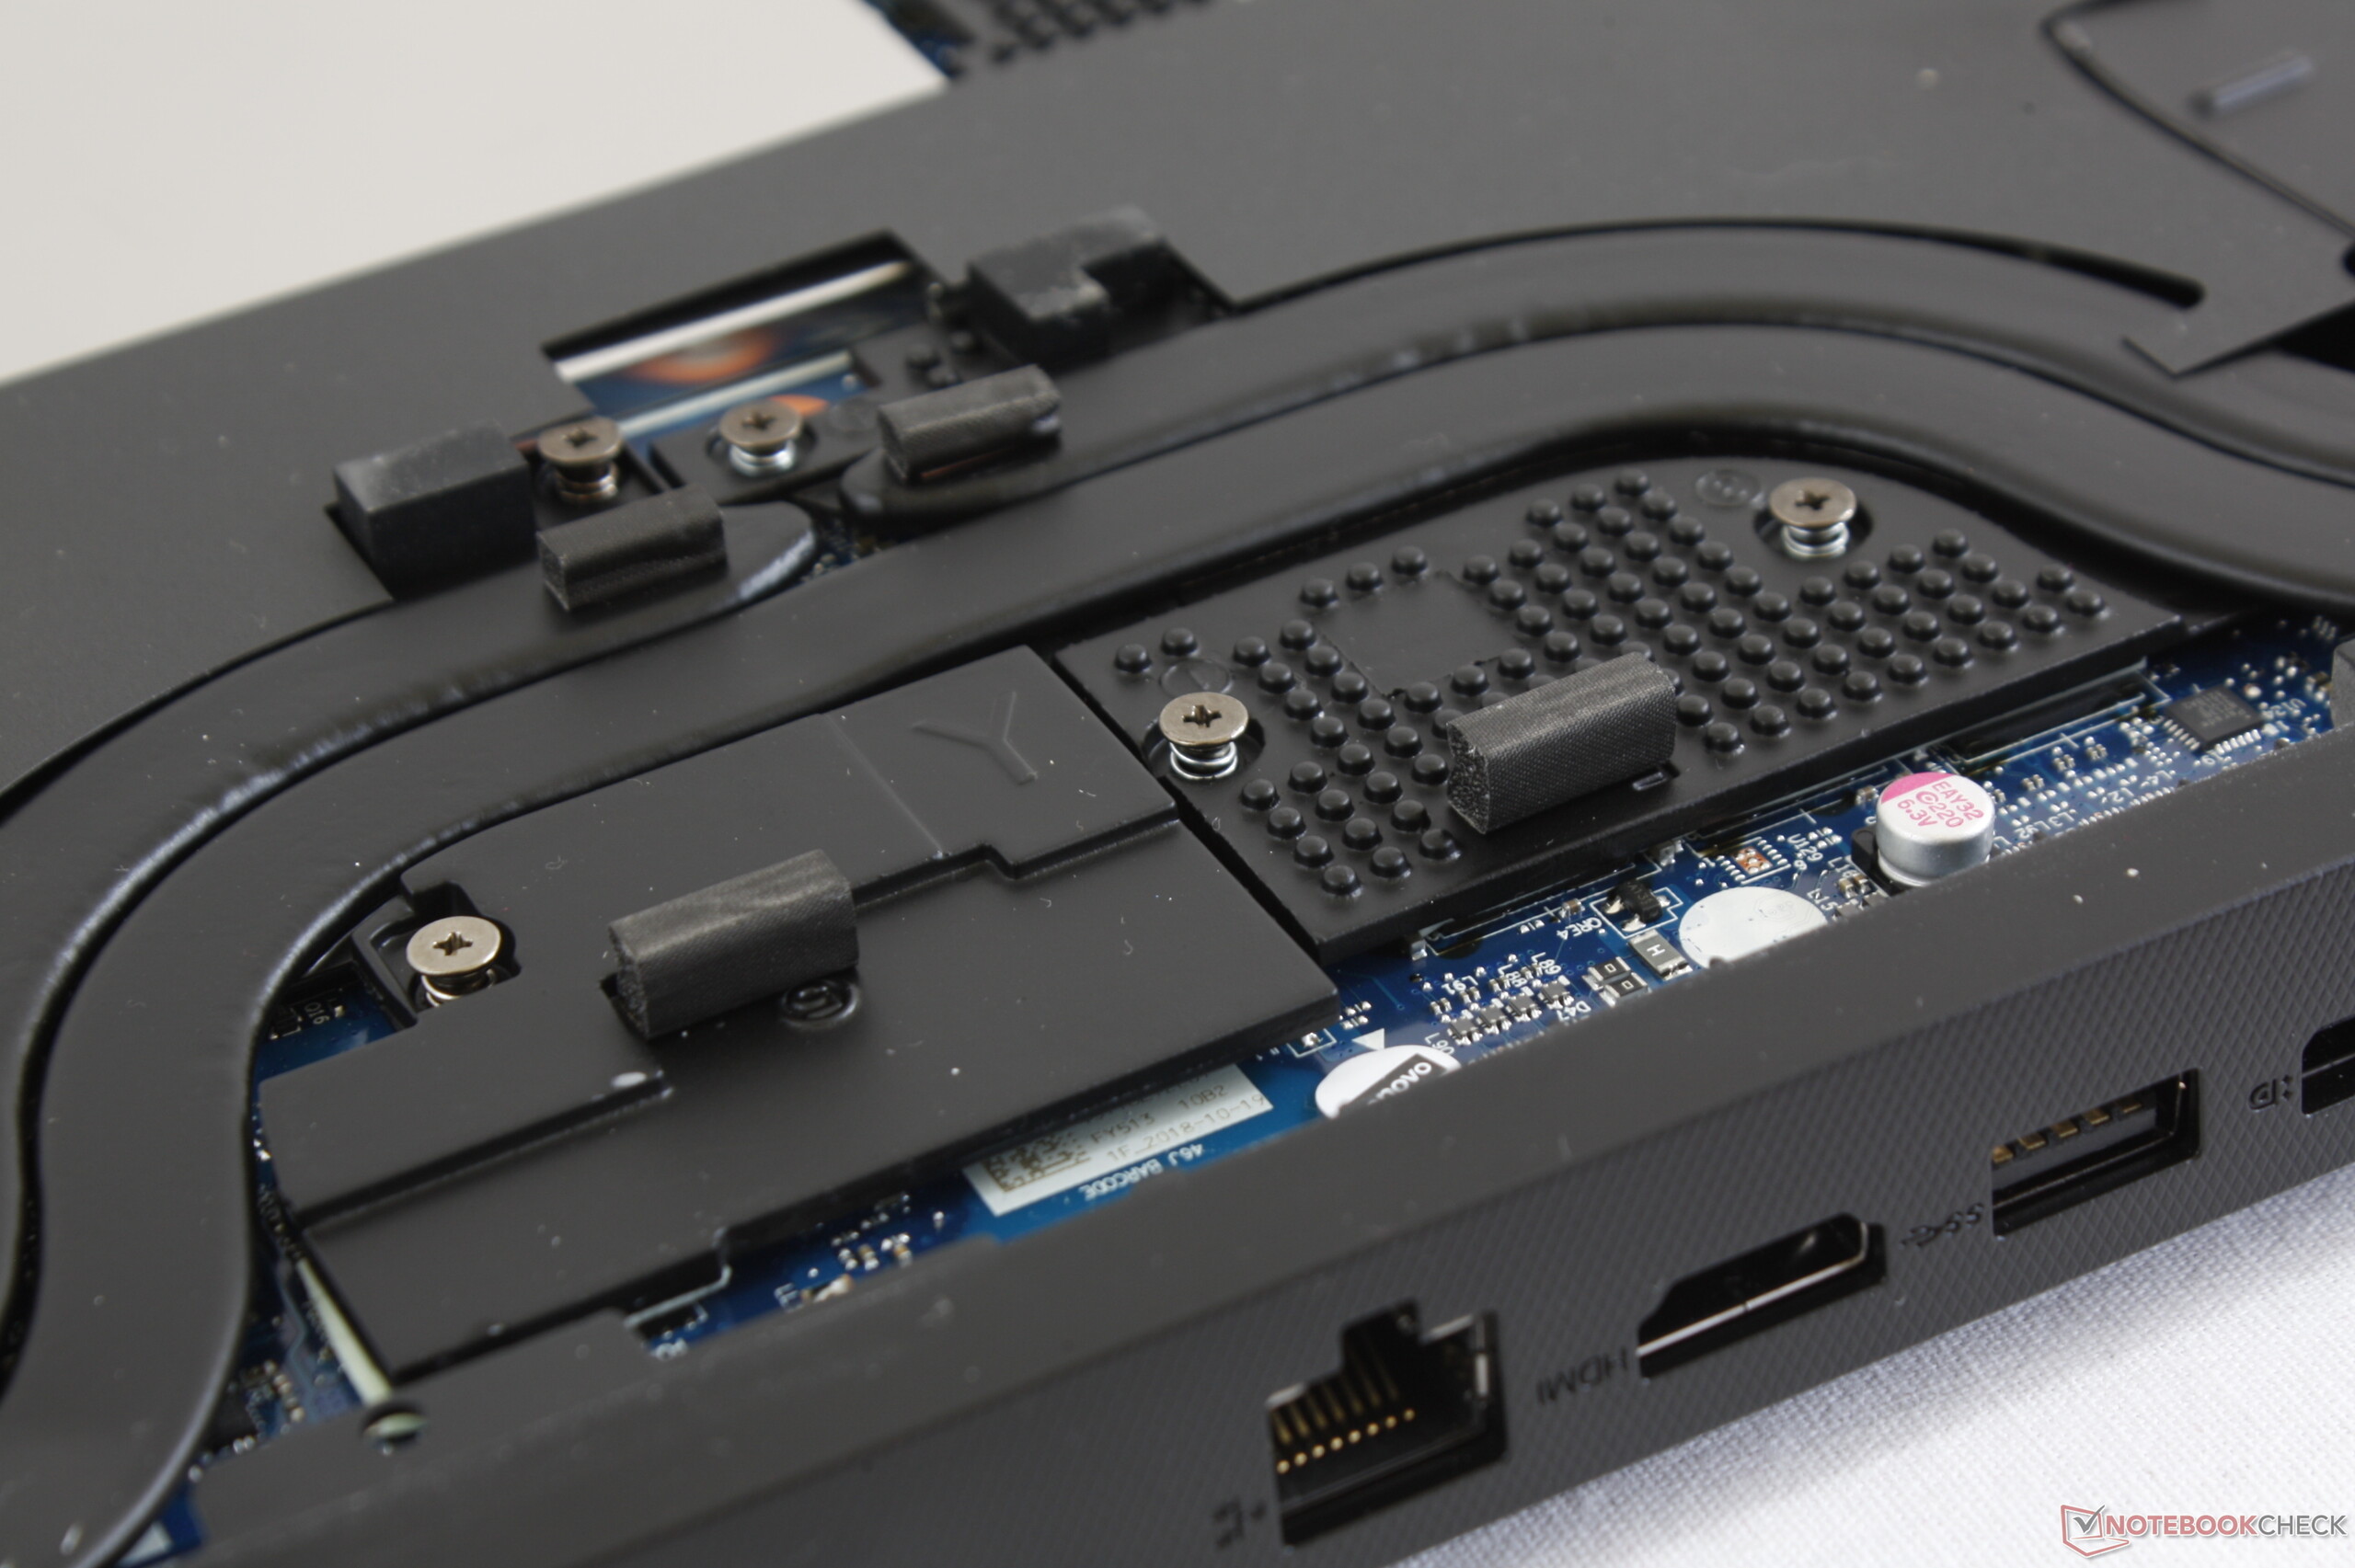
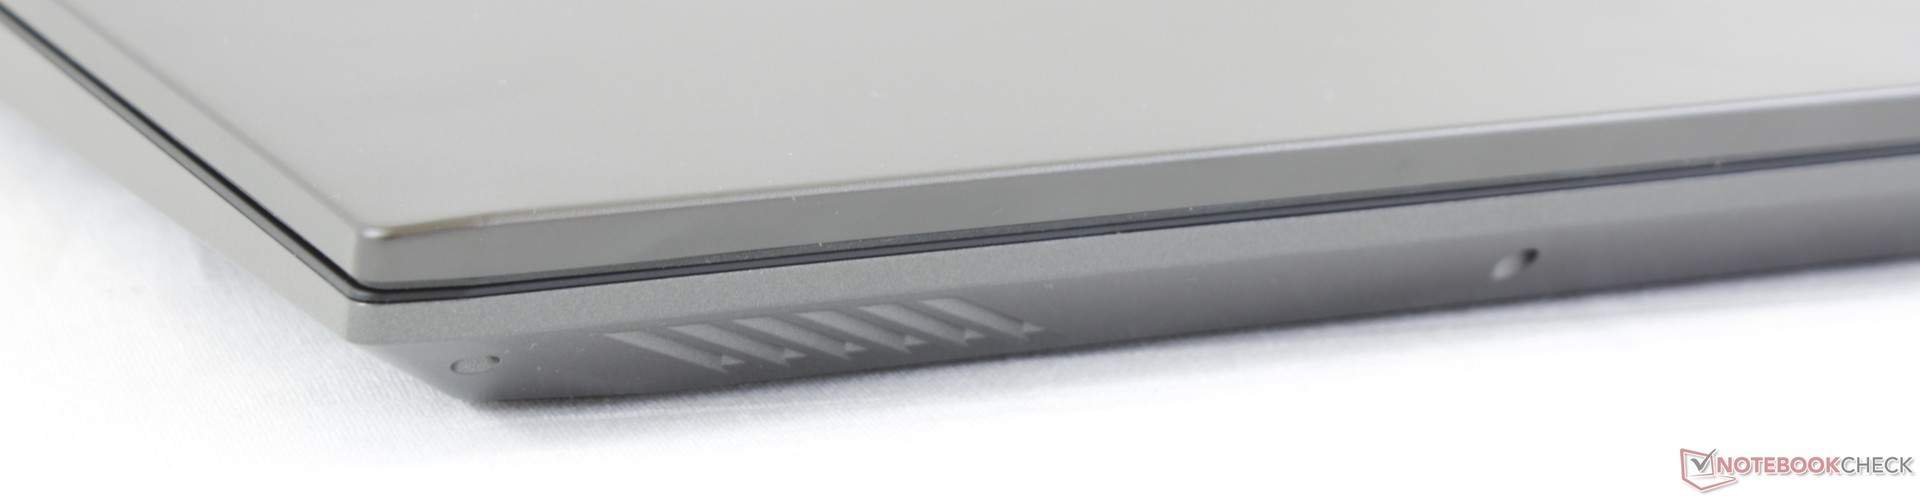
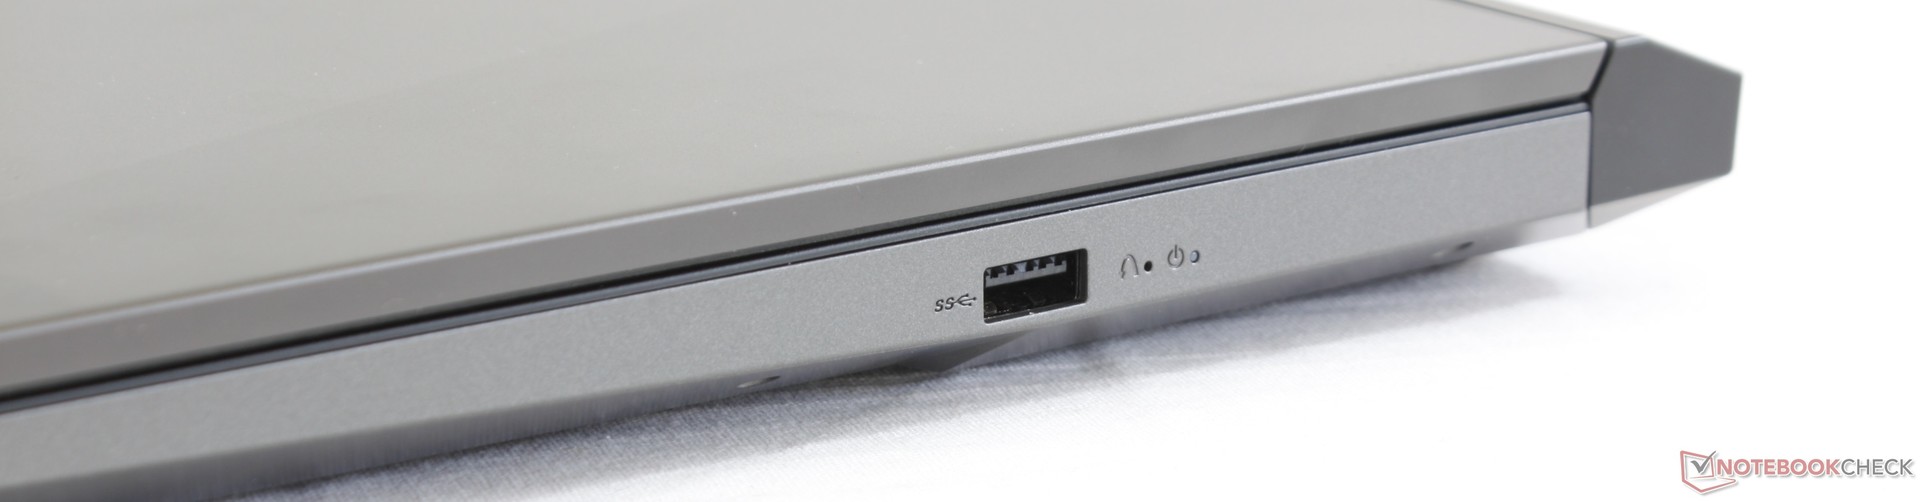
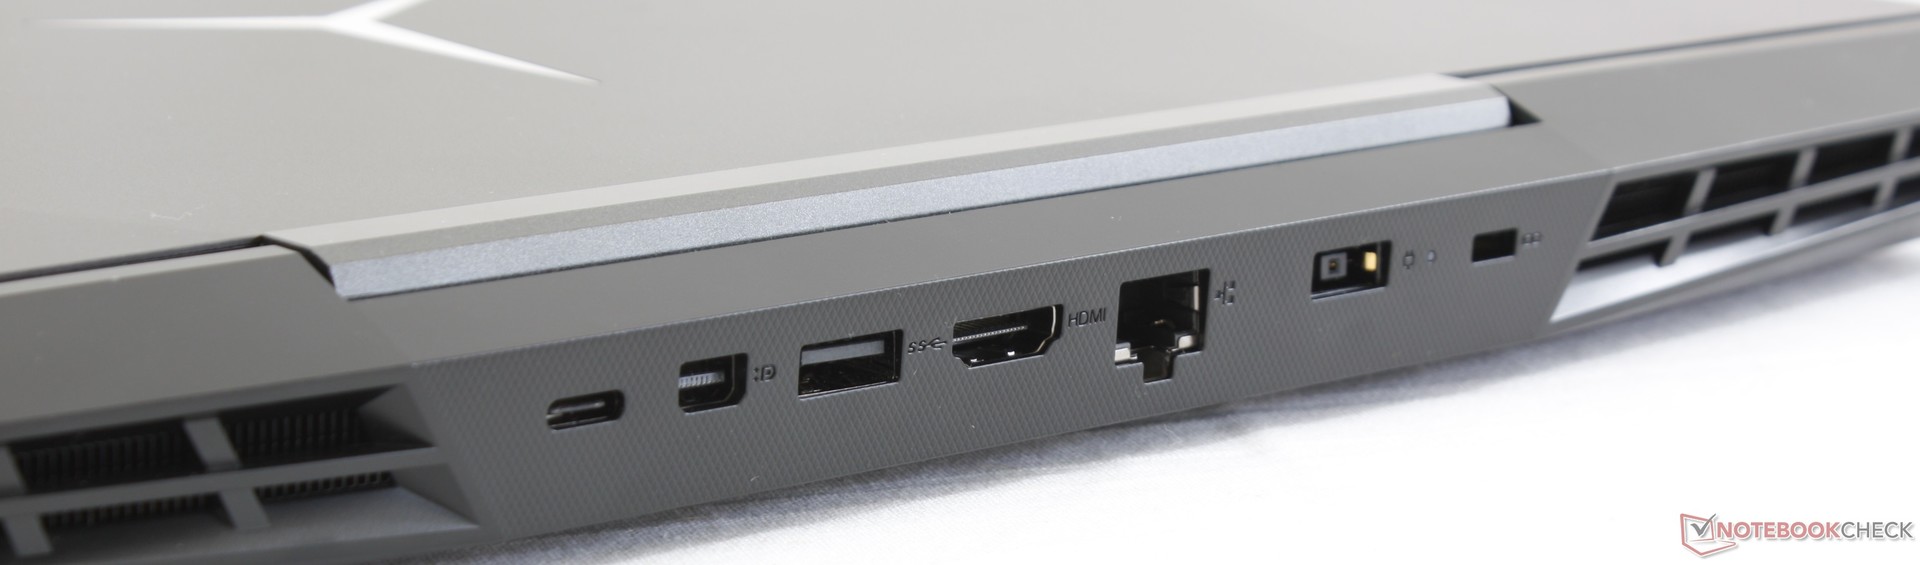
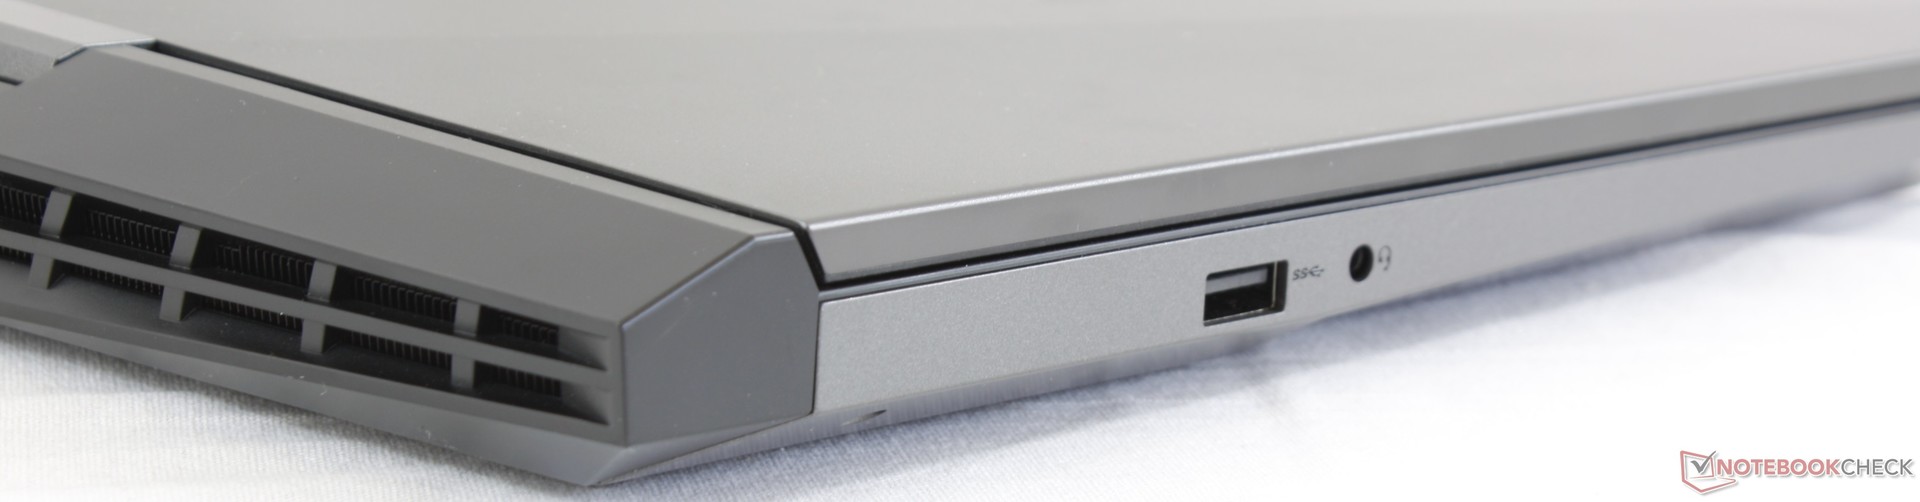
As desvantagens do sistema são relativamente pequenas, mas certamente se somam. O posicionamento de portas pode não ser ideal para alguns usuários e a capacidade de manutenção poderia ter sido mais fácil. Melhor controle dos ventiladores e posicionamento da webcam, uma tampa mais rígida, trackpad mais rígido e talvez menos superfícies suscetíveis a impressões digitais, melhorariam a experiência do usuário, sem precisar aumentar o preço. Também é um pouco mais pesado ou mais grosso do que alternativas concorrentes de marcos estreitos como o MSI GF63 e o ROG GL504 mencionado anteriormente. Jogadores de FPS mais sérios devem ser cautelosos com a opção de tela básica de 60 Hz, devido a seus tempos de resposta em preto-branco relativamente lentos.
Uma máquina de jogos de valor sem sentir ou parecer um produto ordinário e barato. O Lenovo Legion Y7000 obtém o desempenho principal ao mesmo tempo em que descarta recursos auxiliares para manter os preços sob controle. Algumas das novas opções de design podem irritar os usuários, como as superfícies propensas às digitais, a localização inconveniente das portas e a capacidade de manutenção relativamente complexa
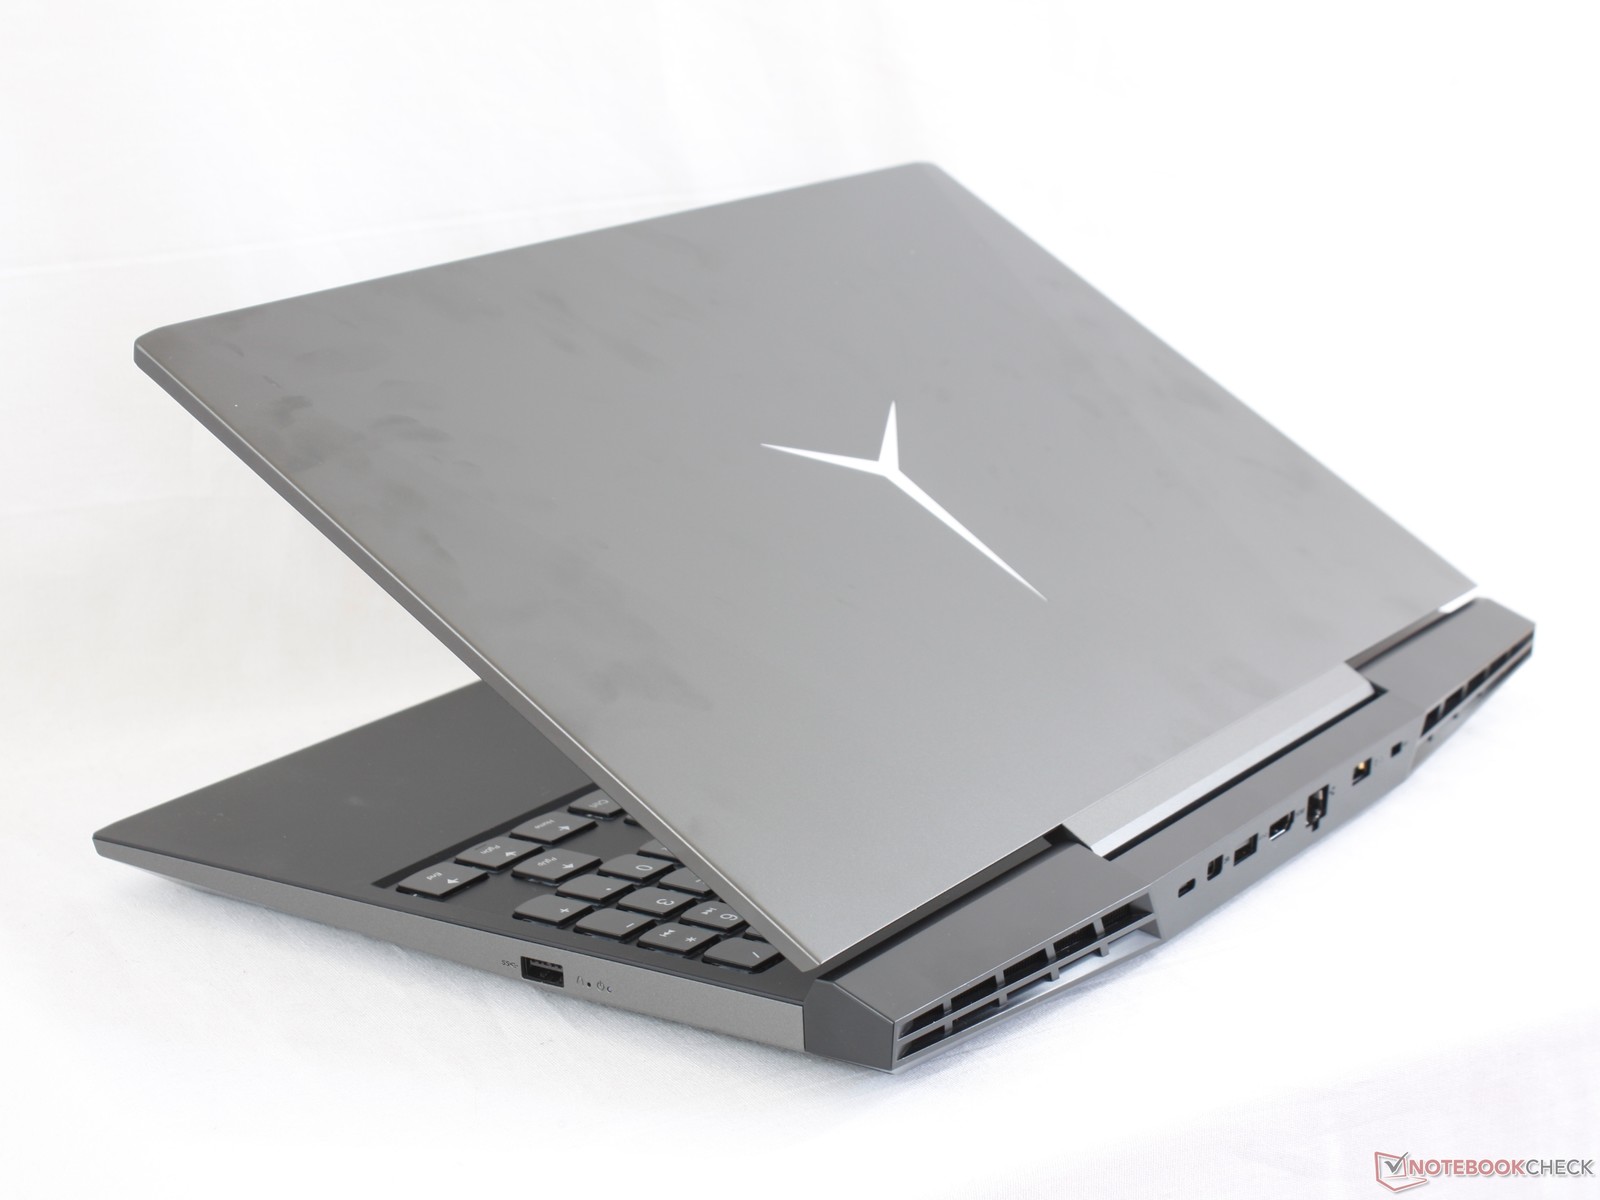
Lenovo Legion Y7000P-1060
- 09/20/2019 v7 (old)
Allen Ngo
Price comparison
