Breve Análise do Portátil MSI P65 Creator 8RF (i7-8750H, GTX 1070 Max-Q, 512 GB SSD, 144 Hz)


| |||||||||||||||||||||||||
iluminação: 85 %
iluminação com acumulador: 238 cd/m²
Contraste: 1068:1 (Preto: 0.22 cd/m²)
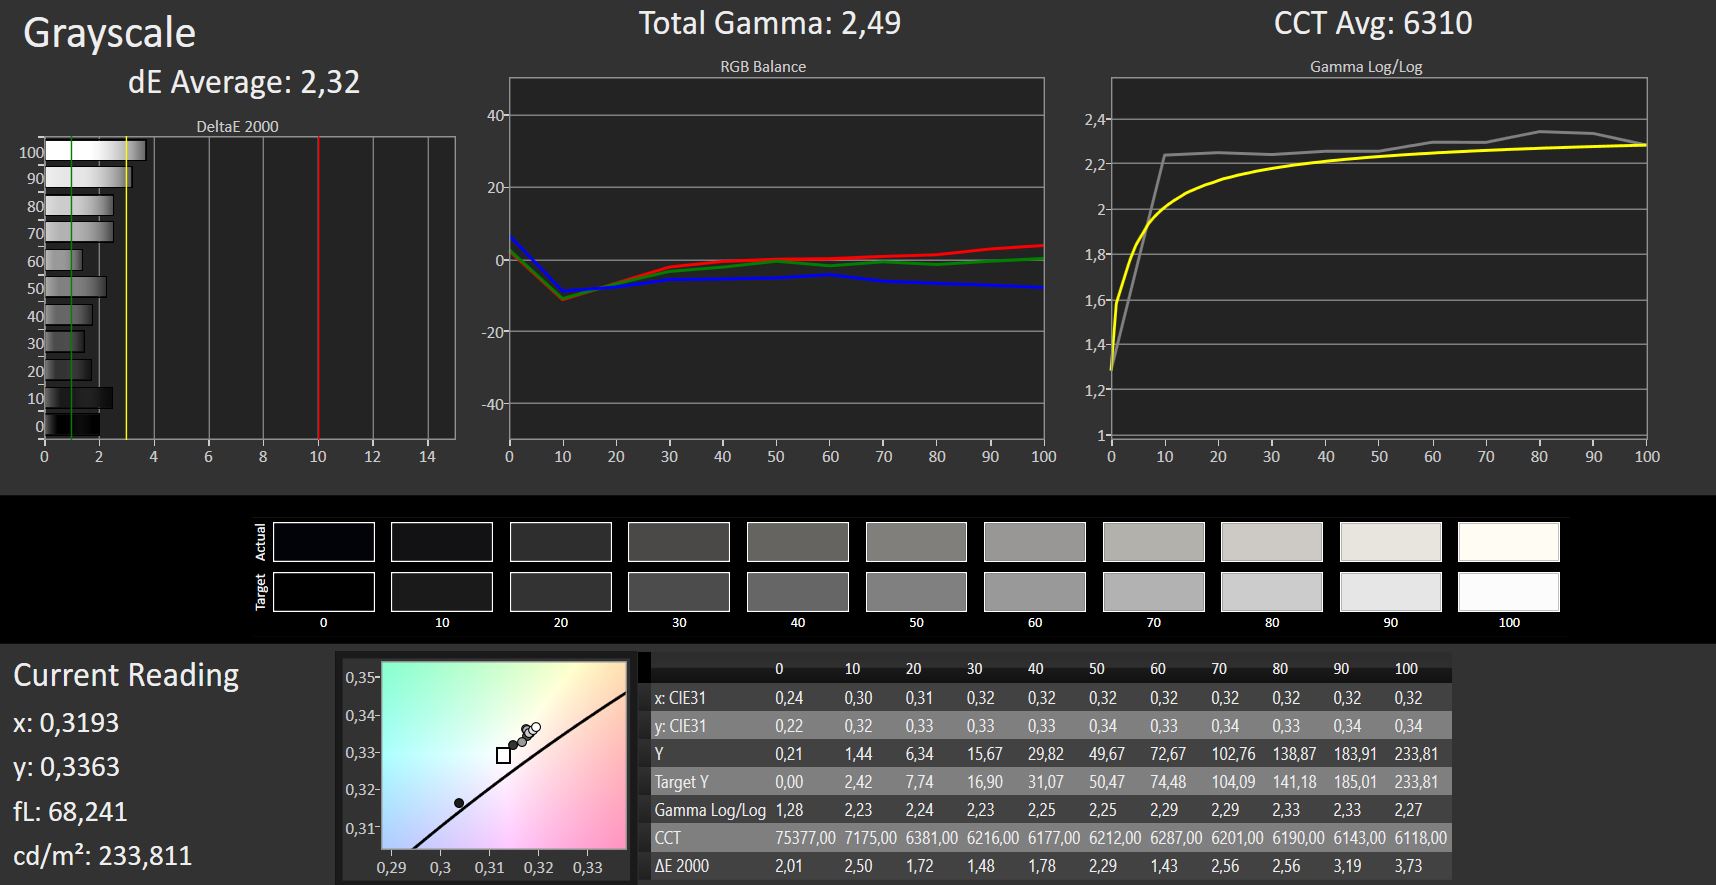
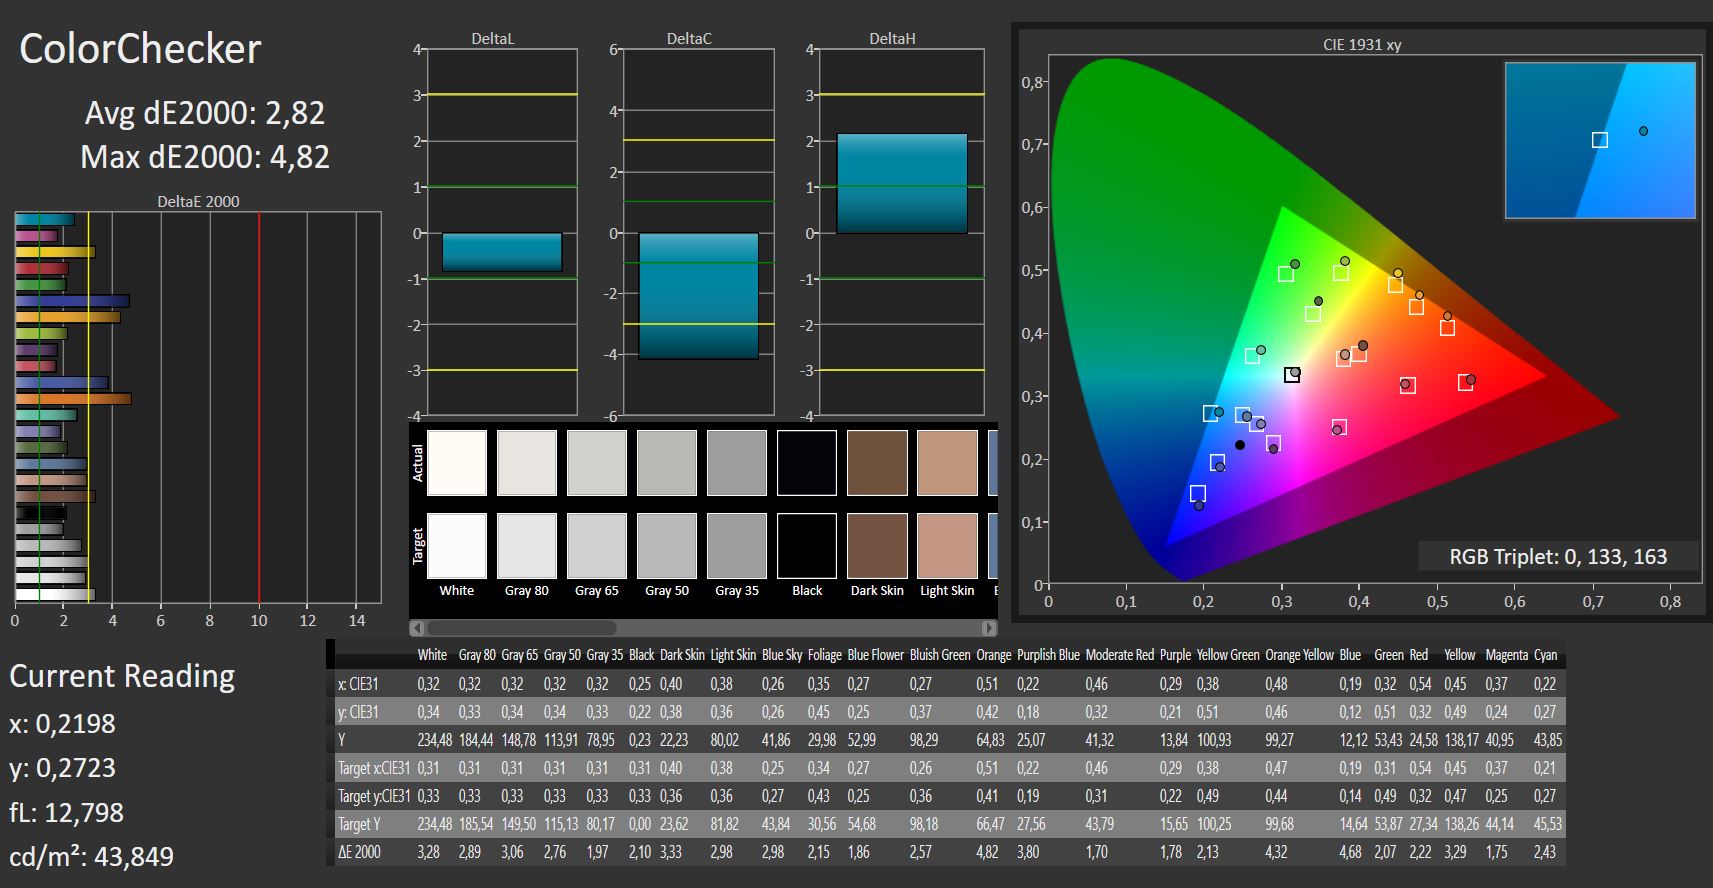
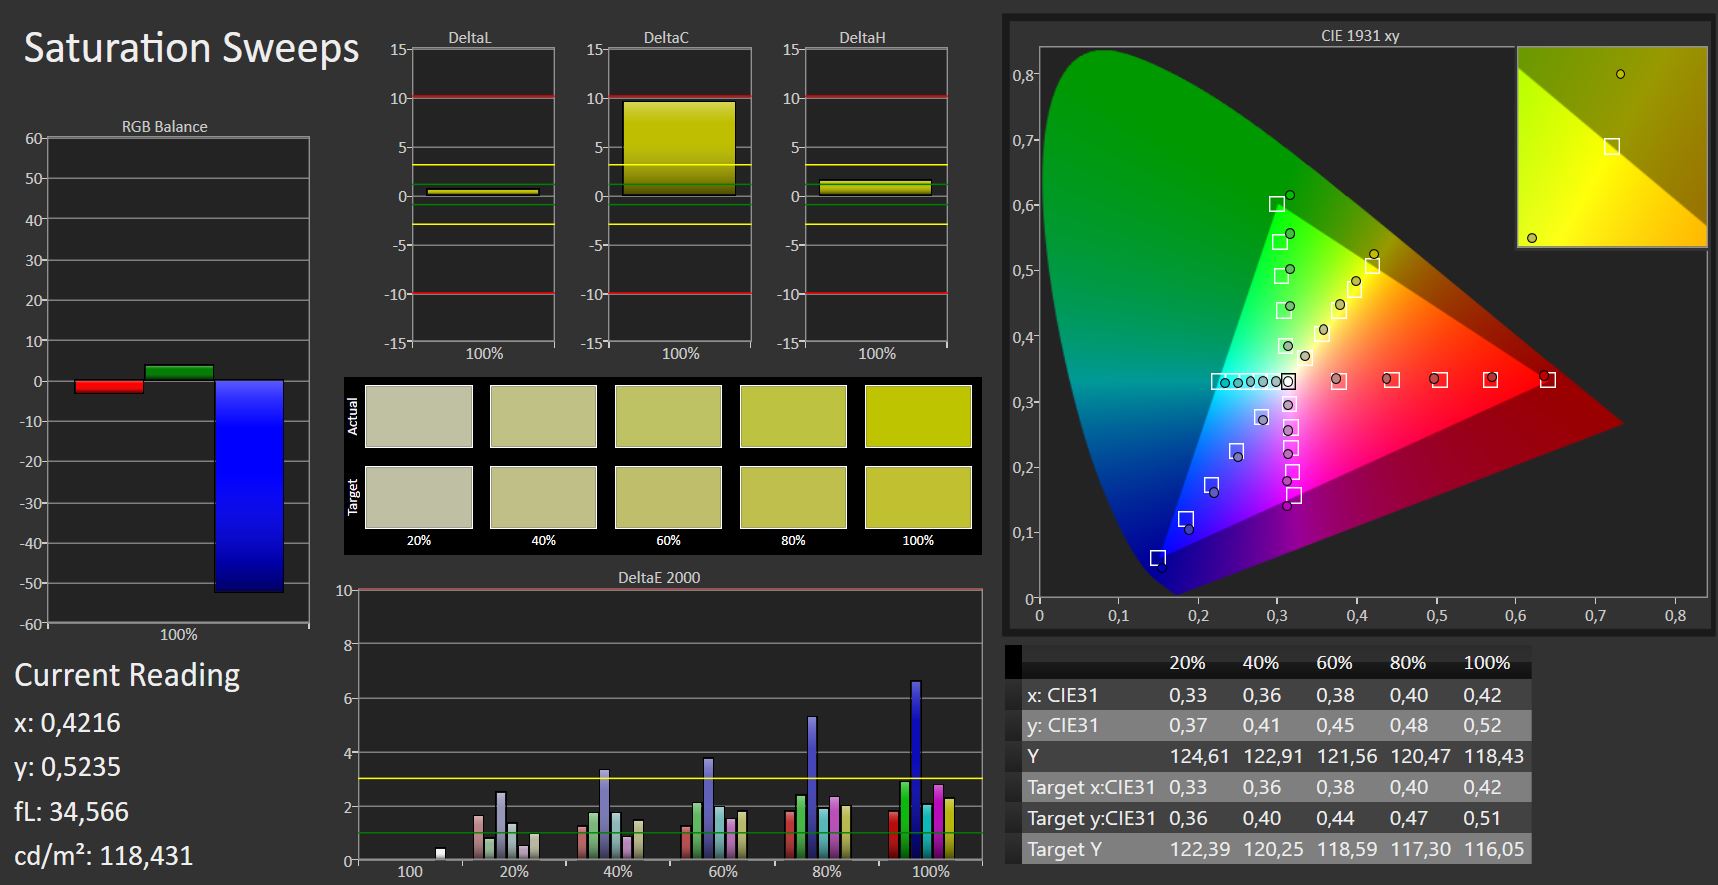
ΔE ColorChecker Calman: 2.82 | ∀{0.5-29.43 Ø4.72}
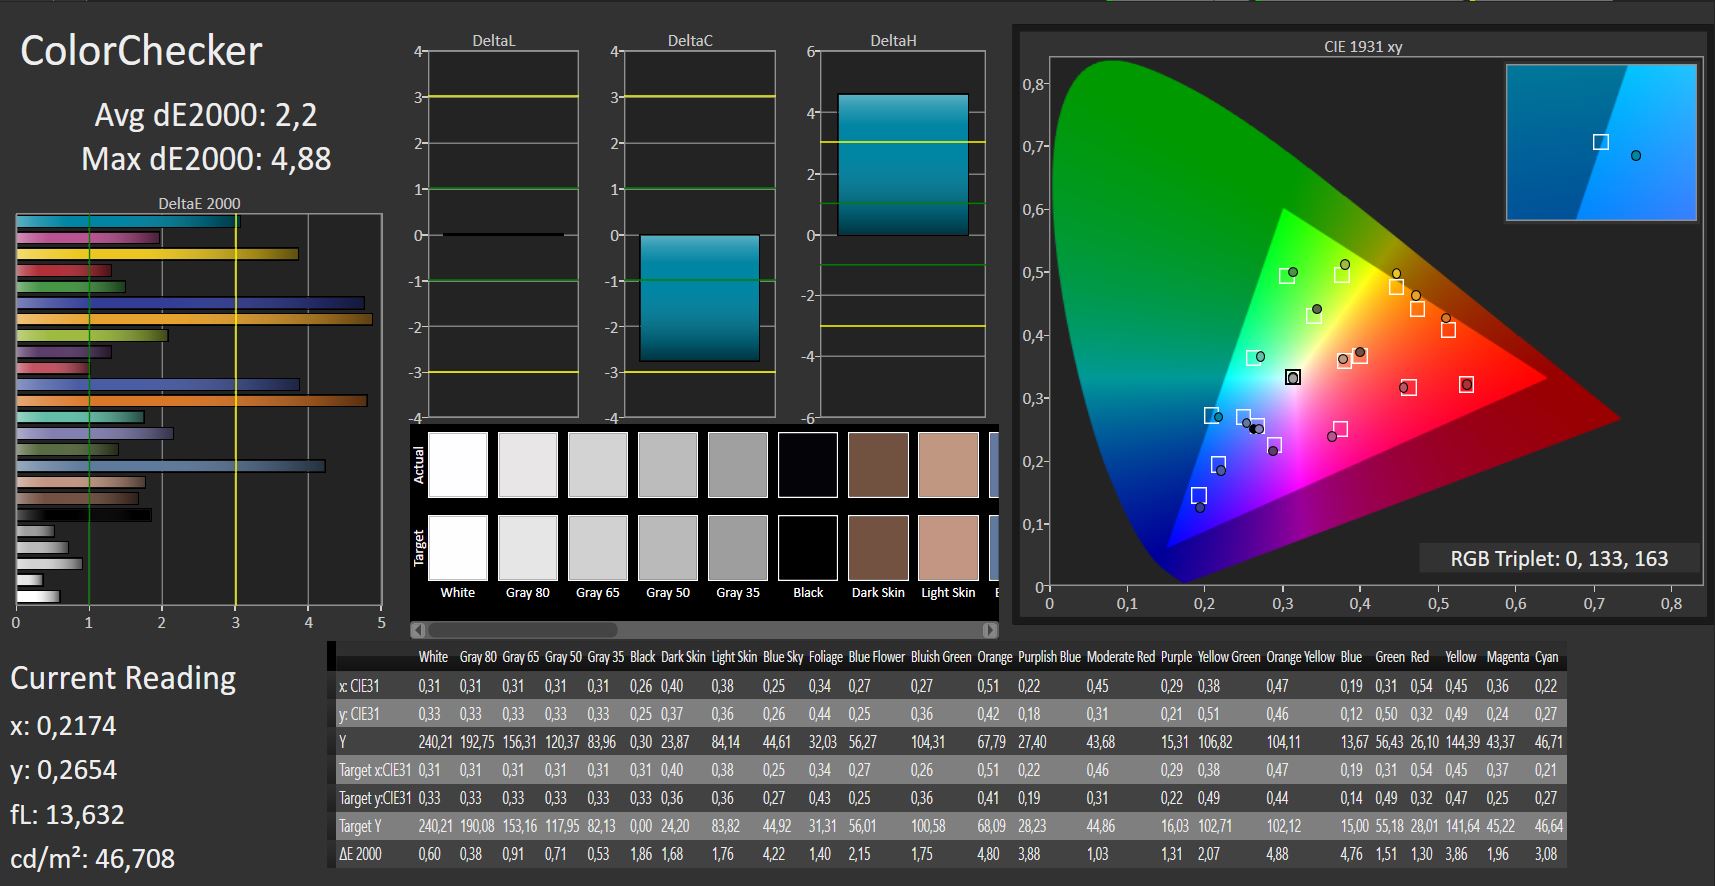
calibrated: 4.88
ΔE Greyscale Calman: 2.32 | ∀{0.09-98 Ø4.97}
92% sRGB (Argyll 1.6.3 3D)
59% AdobeRGB 1998 (Argyll 1.6.3 3D)
65.9% AdobeRGB 1998 (Argyll 3D)
91.1% sRGB (Argyll 3D)
65.1% Display P3 (Argyll 3D)
Gamma: 2.49
CCT: 6310 K
| MSI P65 8RF-451 - Creator AU Optronics B156HAN08.0 (AUO80ED), IPS, 1920x1080, 15.6" | Asus ZenBook Pro 15 UX580GE AU Optronics B156ZAN03.1, IPS, 3840x2160, 15.6" | Gigabyte Aero 15X v8 LGD05C0, IPS, 1920x1080, 15.6" | Asus GL504GS AU Optronics B156HAN08.2 (AUO82ED), IPS, 1920x1080, 15.6" | MSI GS65 8RF-019DE Stealth Thin AU Optronics B156HAN08.0 (AUO80ED), IPS, 1920x1080, 15.6" | Lenovo ThinkPad X1 Extreme-20MF000XGE B156ZAN03.2, IPS, 3840x2160, 15.6" | |
|---|---|---|---|---|---|---|
| Display | 31% | -0% | 0% | 2% | 31% | |
| Display P3 Coverage (%) | 65.1 | 85.9 32% | 63.6 -2% | 66.4 2% | 66.2 2% | 86.3 33% |
| sRGB Coverage (%) | 91.1 | 100 10% | 93.8 3% | 90.2 -1% | 92.1 1% | 100 10% |
| AdobeRGB 1998 Coverage (%) | 65.9 | 99.1 50% | 64.9 -2% | 66 0% | 67.2 2% | 99.4 51% |
| Response Times | -141% | -4% | 38% | -13% | -238% | |
| Response Time Grey 50% / Grey 80% * (ms) | 16 ? | 44 ? -175% | 16.8 ? -5% | 7.2 ? 55% | 17.6 ? -10% | 61.6 ? -285% |
| Response Time Black / White * (ms) | 11 ? | 22.8 ? -107% | 11.2 ? -2% | 8.8 ? 20% | 12.8 ? -16% | 32 ? -191% |
| PWM Frequency (Hz) | ||||||
| Screen | -2% | 18% | 3% | 13% | 2% | |
| Brightness middle (cd/m²) | 235 | 357.6 52% | 313 33% | 271 15% | 254 8% | 396 69% |
| Brightness (cd/m²) | 235 | 350 49% | 300 28% | 261 11% | 262 11% | 380 62% |
| Brightness Distribution (%) | 85 | 85 0% | 78 -8% | 86 1% | 89 5% | 90 6% |
| Black Level * (cd/m²) | 0.22 | 0.35 -59% | 0.33 -50% | 0.32 -45% | 0.22 -0% | 0.28 -27% |
| Contrast (:1) | 1068 | 1022 -4% | 948 -11% | 847 -21% | 1155 8% | 1414 32% |
| Colorchecker dE 2000 * | 2.82 | 4.12 -46% | 1.29 54% | 2.61 7% | 2.37 16% | 4 -42% |
| Colorchecker dE 2000 max. * | 4.82 | 9.91 -106% | 2.04 58% | 4.93 -2% | 4.71 2% | 7.6 -58% |
| Colorchecker dE 2000 calibrated * | 4.88 | 4.23 13% | 2.33 52% | 1.84 62% | 0.9 82% | |
| Greyscale dE 2000 * | 2.32 | 1.8 22% | 0.69 70% | 1.97 15% | 1.58 32% | 6.1 -163% |
| Gamma | 2.49 88% | 2.17 101% | 2.43 91% | 2.4 92% | 2.48 89% | 2.25 98% |
| CCT | 6310 103% | 6613 98% | 6550 99% | 6398 102% | 6785 96% | 7786 83% |
| Color Space (Percent of AdobeRGB 1998) (%) | 59 | 87.5 48% | 60 2% | 59 0% | 60 2% | 88.5 50% |
| Color Space (Percent of sRGB) (%) | 92 | 100 9% | 94 2% | 90 -2% | 92 0% | 100 9% |
| Média Total (Programa/Configurações) | -37% /
-13% | 5% /
11% | 14% /
7% | 1% /
8% | -68% /
-23% |
* ... menor é melhor

Exibir tempos de resposta
| ↔ Tempo de resposta preto para branco | ||
|---|---|---|
| 11 ms ... ascensão ↗ e queda ↘ combinadas | ↗ 7 ms ascensão | 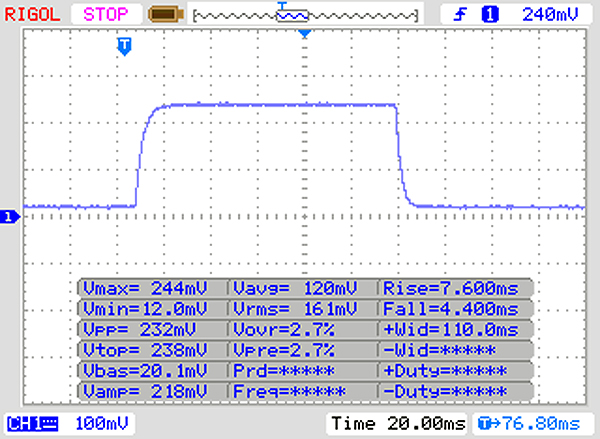 |
| ↘ 4 ms queda | ||
| A tela mostra boas taxas de resposta em nossos testes, mas pode ser muito lenta para jogadores competitivos. Em comparação, todos os dispositivos testados variam de 0.1 (mínimo) a 240 (máximo) ms. » 30 % de todos os dispositivos são melhores. Isso significa que o tempo de resposta medido é melhor que a média de todos os dispositivos testados (19.8 ms). | ||
| ↔ Tempo de resposta 50% cinza a 80% cinza | ||
| 16 ms ... ascensão ↗ e queda ↘ combinadas | ↗ 9 ms ascensão | 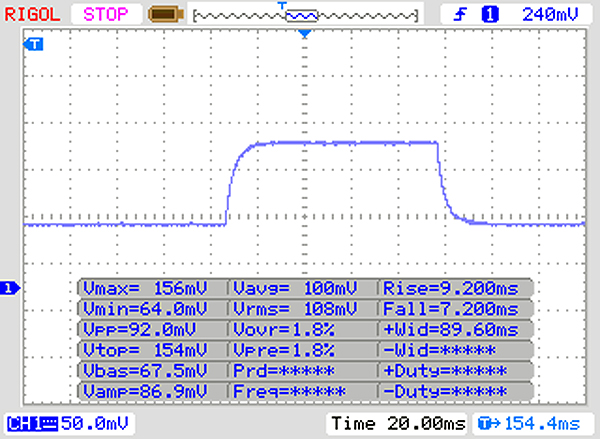 |
| ↘ 7 ms queda | ||
| A tela mostra boas taxas de resposta em nossos testes, mas pode ser muito lenta para jogadores competitivos. Em comparação, todos os dispositivos testados variam de 0.165 (mínimo) a 636 (máximo) ms. » 30 % de todos os dispositivos são melhores. Isso significa que o tempo de resposta medido é melhor que a média de todos os dispositivos testados (31 ms). | ||
Cintilação da tela / PWM (modulação por largura de pulso)
| Tela tremeluzindo / PWM não detectado | 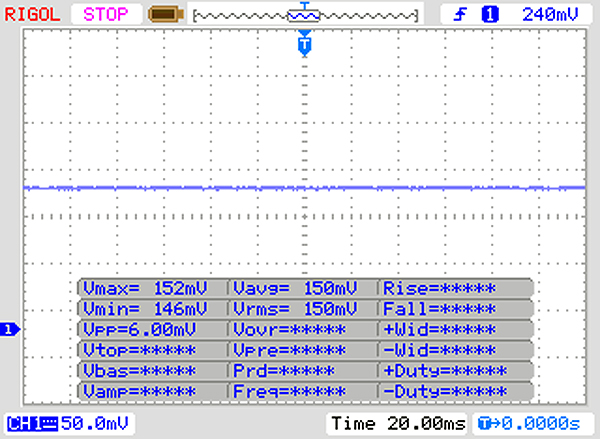 | ||
[pwm_comparison] Em comparação: 52 % de todos os dispositivos testados não usam PWM para escurecer a tela. Se PWM foi detectado, uma média de 7747 (mínimo: 5 - máximo: 343500) Hz foi medida. | |||
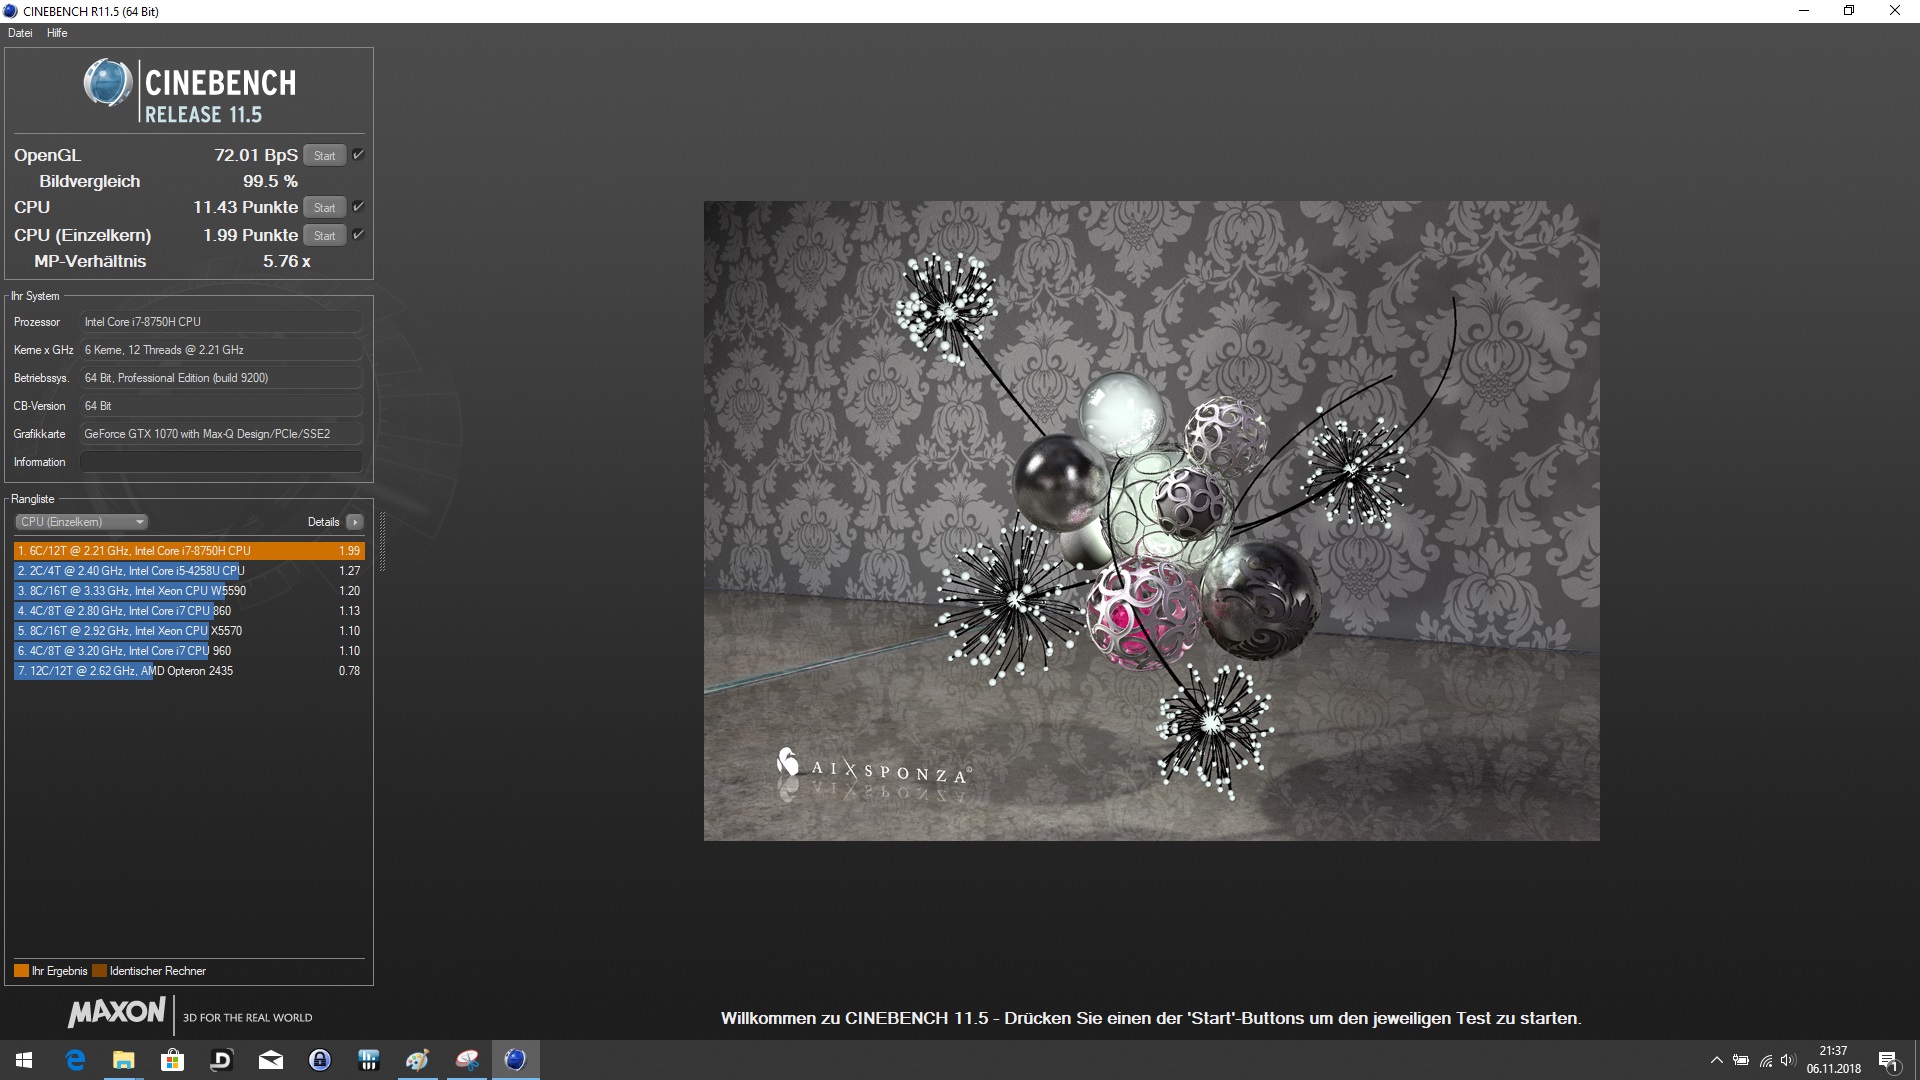
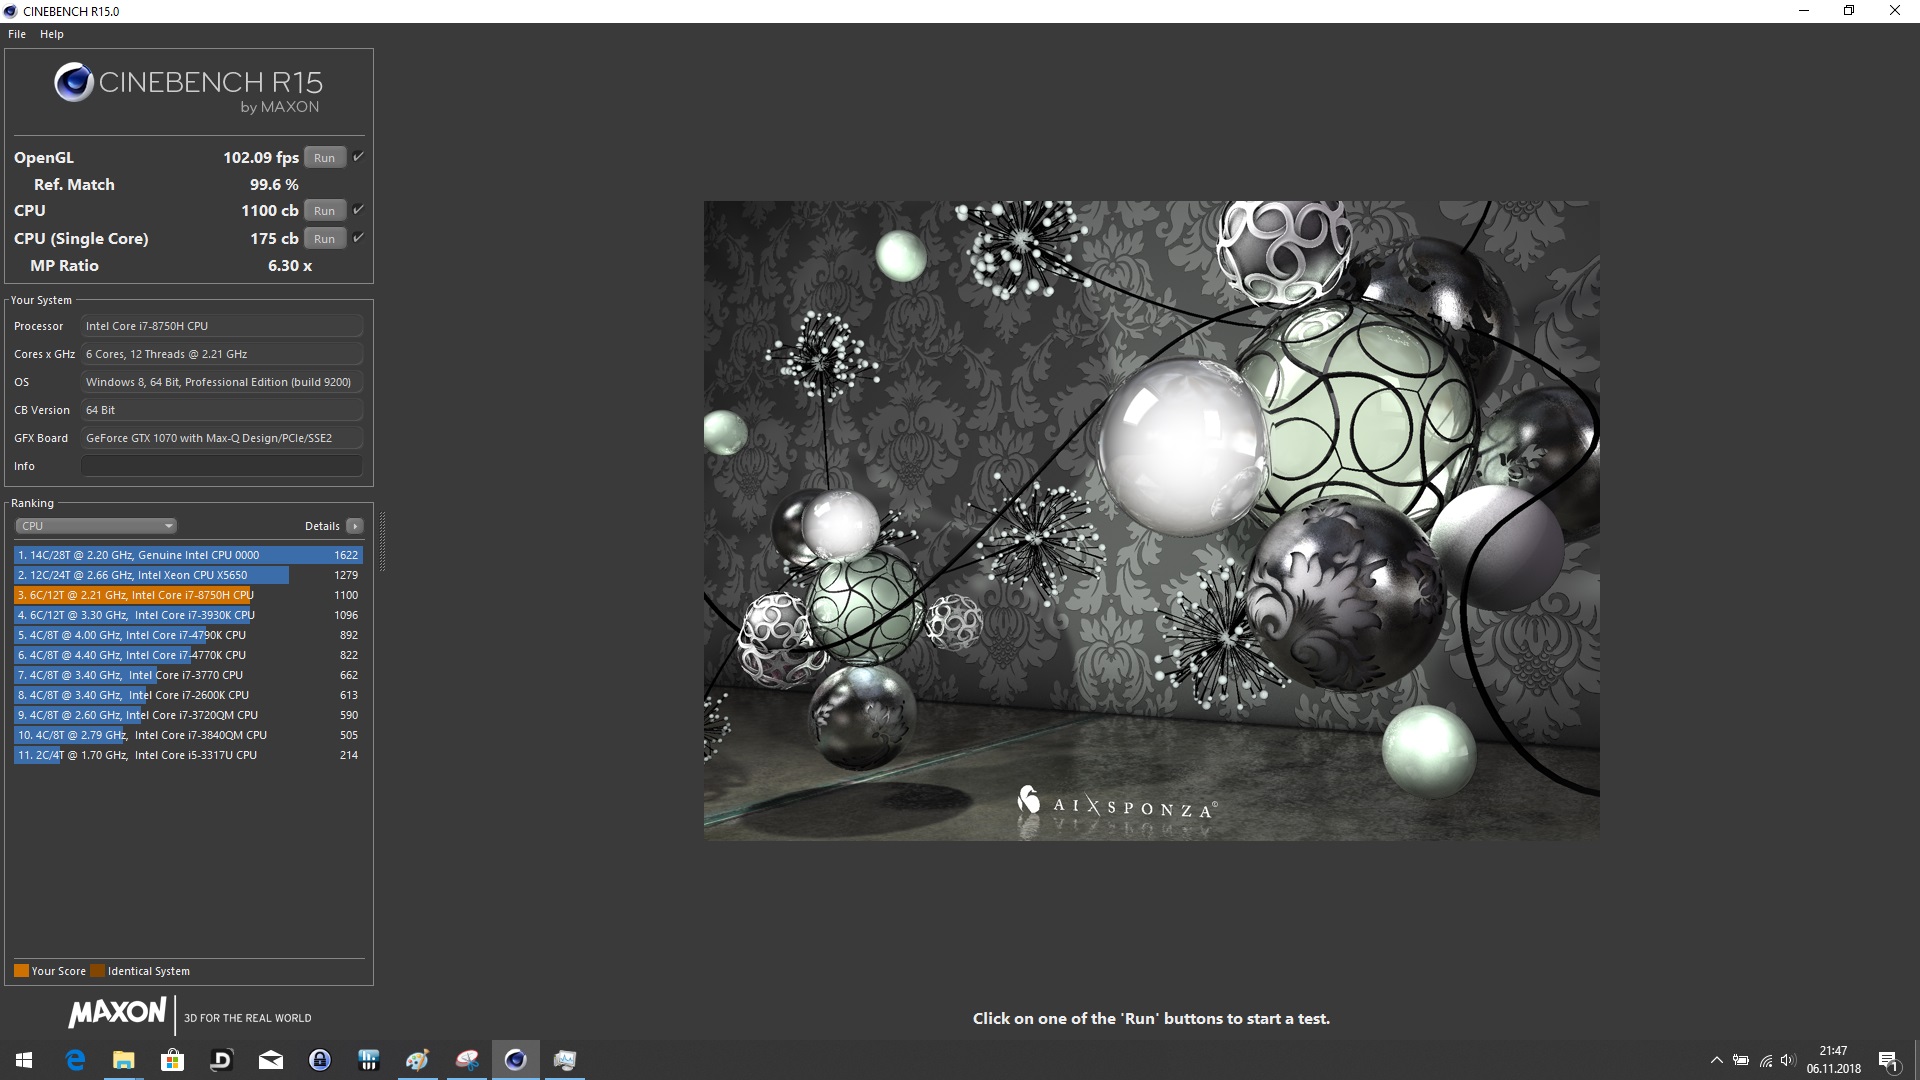
| HWBOT x265 Benchmark v2.2 - 4k Preset | |
| Média da turma Multimedia (5.26 - 36.1, n=59, últimos 2 anos) | |
| Média Intel Core i7-8750H (7.56 - 9.55, n=5) | |
| MSI P65 8RF-451 - Creator | |
| Blender - v2.79 BMW27 CPU | |
| MSI P65 8RF-451 - Creator | |
| Média Intel Core i7-8750H (396 - 486, n=6) | |
| Média da turma Multimedia (100 - 557, n=61, últimos 2 anos) | |
* ... menor é melhor

| PCMark 8 Home Score Accelerated v2 | 4446 pontos | |
| PCMark 8 Creative Score Accelerated v2 | 5264 pontos | |
| PCMark 8 Work Score Accelerated v2 | 5651 pontos | |
| PCMark 10 Score | 4910 pontos | |
Ajuda | ||
| MSI P65 8RF-451 - Creator Kingston RBUSNS8154P3512GJ | Asus ZenBook Pro 15 UX580GE Samsung SSD PM961 1TB M.2 PCIe 3.0 x4 NVMe (MZVLW1T0) | Gigabyte Aero 15X v8 Toshiba NVMe THNSN5512GPU7 | Asus GL504GS Samsung SSD PM981 MZVLB512HAJQ | MSI GS65 8RF-019DE Stealth Thin Samsung SSD PM981 MZVLB512HAJQ | Lenovo ThinkPad X1 Extreme-20MF000XGE Samsung SSD PM981 MZVLB1T0HALR | |
|---|---|---|---|---|---|---|
| CrystalDiskMark 5.2 / 6 | 33% | 21% | 42% | 35% | 71% | |
| Write 4K (MB/s) | 89.2 | 125 40% | 94.4 6% | 97.9 10% | 95.3 7% | 123.7 39% |
| Read 4K (MB/s) | 34.36 | 44.68 30% | 37.65 10% | 41.23 20% | 40.13 17% | 44.07 28% |
| Write Seq (MB/s) | 949 | 1059 12% | 1335 41% | 1852 95% | 1883 98% | 2215 133% |
| Read Seq (MB/s) | 899 | 772 -14% | 1404 56% | 1761 96% | 1322 47% | 2242 149% |
| Write 4K Q32T1 (MB/s) | 371.4 | 507 37% | 268.6 -28% | 297.7 -20% | 309.9 -17% | 313.9 -15% |
| Read 4K Q32T1 (MB/s) | 399 | 614 54% | 332.8 -17% | 344.2 -14% | 353.7 -11% | 359.8 -10% |
| Write Seq Q32T1 (MB/s) | 1035 | 1763 70% | 1375 33% | 1864 80% | 1919 85% | 2404 132% |
| Read Seq Q32T1 (MB/s) | 1603 | 2171 35% | 2627 64% | 2738 71% | 2466 54% | 3333 108% |
| AS SSD | 72% | 19% | 83% | 72% | 123% | |
| Seq Read (MB/s) | 850 | 2099 147% | 2213 160% | 1837 116% | 1266 49% | 2703 218% |
| Seq Write (MB/s) | 869 | 1729 99% | 1163 34% | 1730 99% | 1834 111% | 2336 169% |
| 4K Read (MB/s) | 36.43 | 37.78 4% | 23.36 -36% | 53.3 46% | 48.94 34% | 56.8 56% |
| 4K Write (MB/s) | 84.4 | 100.9 20% | 80.4 -5% | 105.7 25% | 107.2 27% | 130.9 55% |
| 4K-64 Read (MB/s) | 839 | 1431 71% | 847 1% | 1305 56% | 1170 39% | 1805 115% |
| 4K-64 Write (MB/s) | 602 | 1273 111% | 742 23% | 1704 183% | 1760 192% | 1782 196% |
| Access Time Read * (ms) | 0.104 | 0.04 62% | 0.119 -14% | 0.049 53% | 0.073 30% | 0.034 67% |
| Access Time Write * (ms) | 0.044 | 0.036 18% | 0.046 -5% | 0.035 20% | 0.035 20% | 0.028 36% |
| Score Read (Points) | 960 | 1679 75% | 1092 14% | 1542 61% | 1346 40% | 2132 122% |
| Score Write (Points) | 773 | 1547 100% | 939 21% | 1983 157% | 2051 165% | 2147 178% |
| Score Total (Points) | 2233 | 4065 82% | 2536 14% | 4318 93% | 4122 85% | 5355 140% |
| Média Total (Programa/Configurações) | 53% /
55% | 20% /
20% | 63% /
66% | 54% /
56% | 97% /
101% |
* ... menor é melhor

| 3DMark 06 Standard Score | 33475 pontos | |
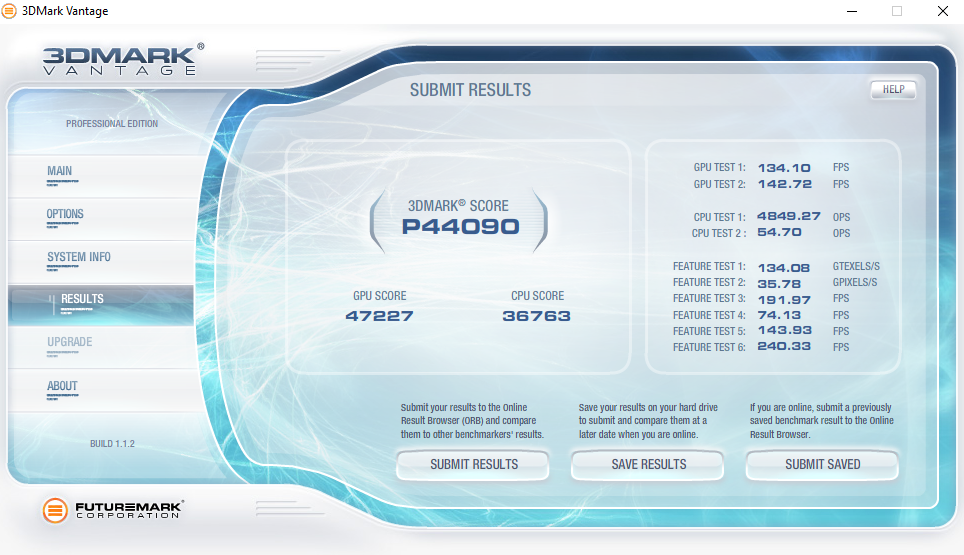
| 3DMark Vantage P Result | 44090 pontos | |
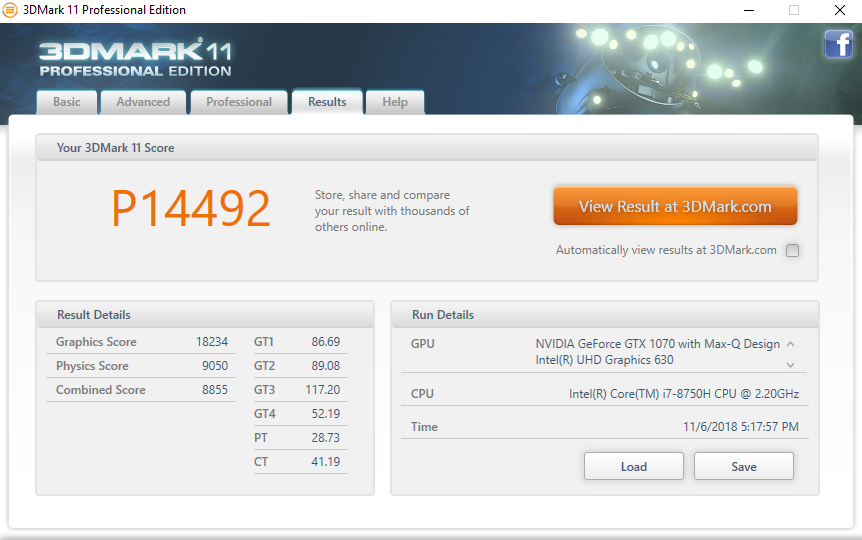
| 3DMark 11 Performance | 14492 pontos | |
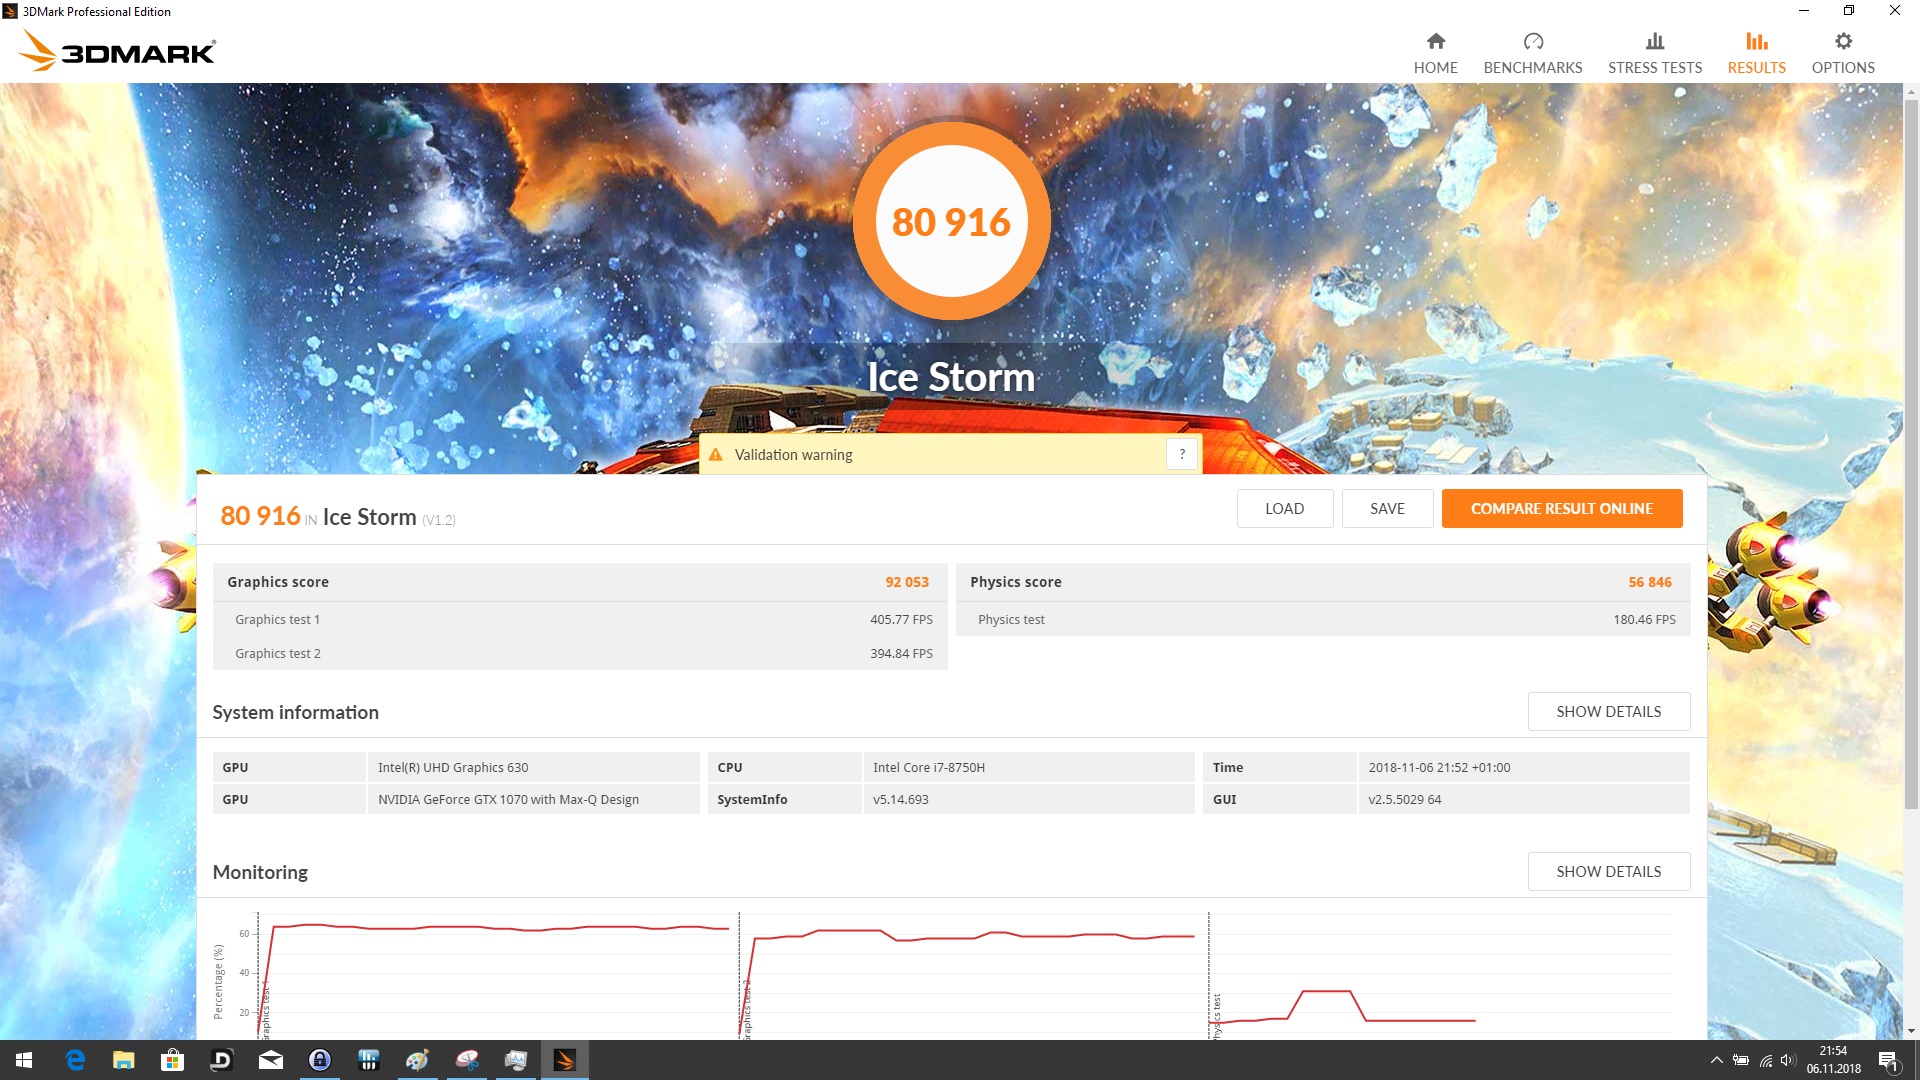
| 3DMark Ice Storm Standard Score | 80916 pontos | |
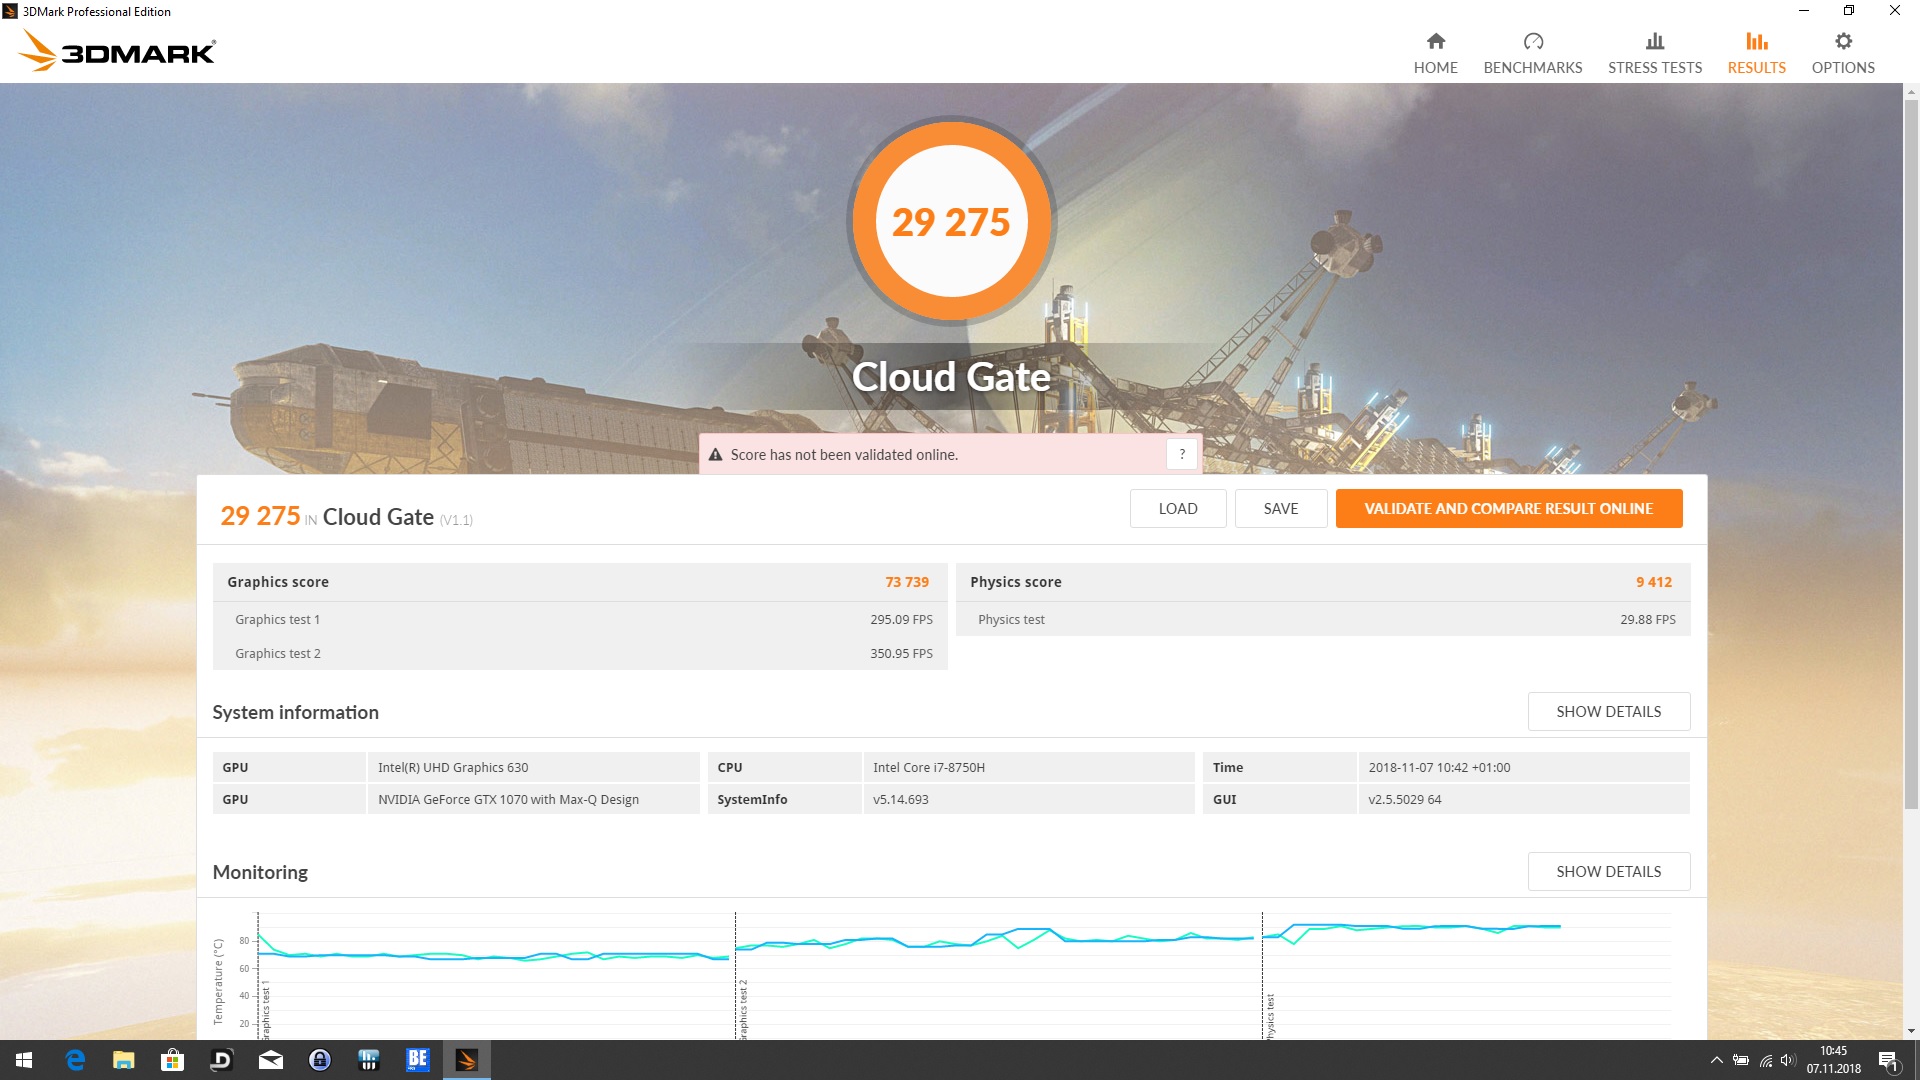
| 3DMark Cloud Gate Standard Score | 29275 pontos | |
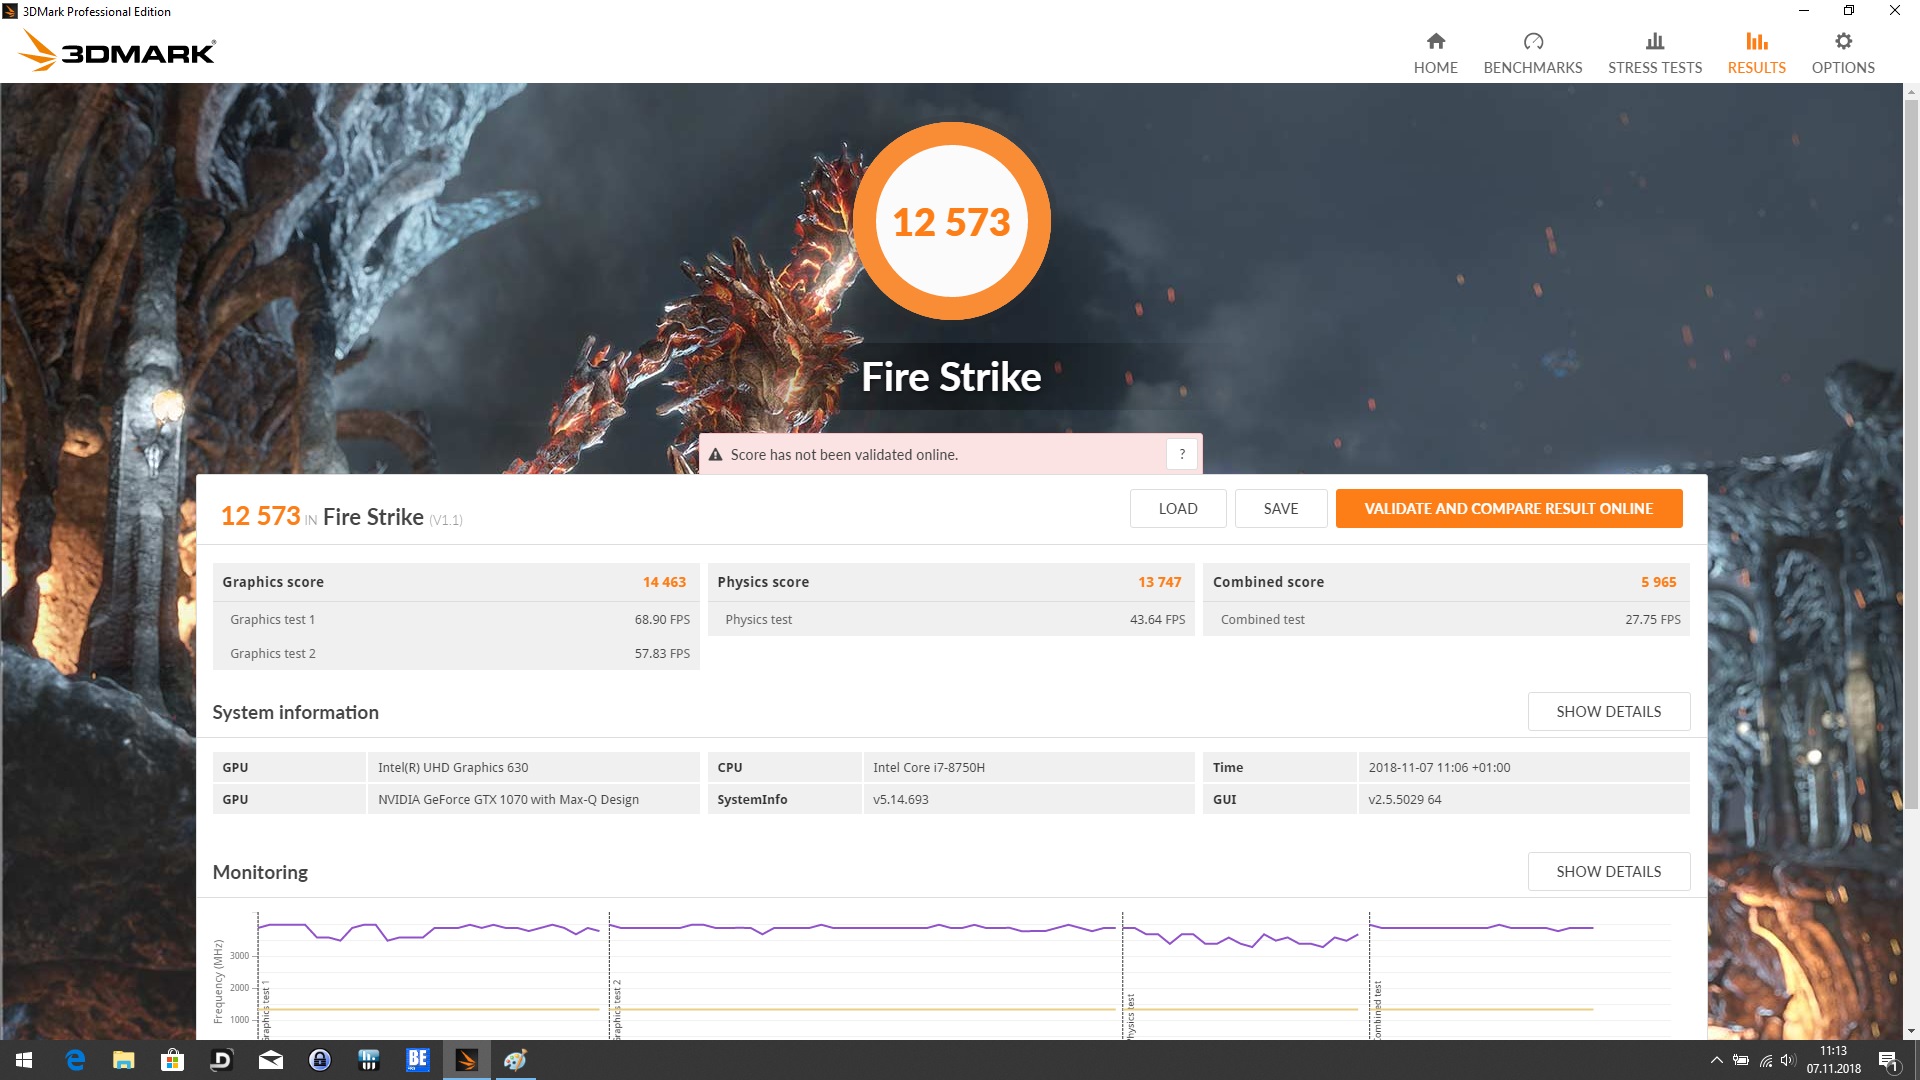
| 3DMark Fire Strike Score | 12573 pontos | |
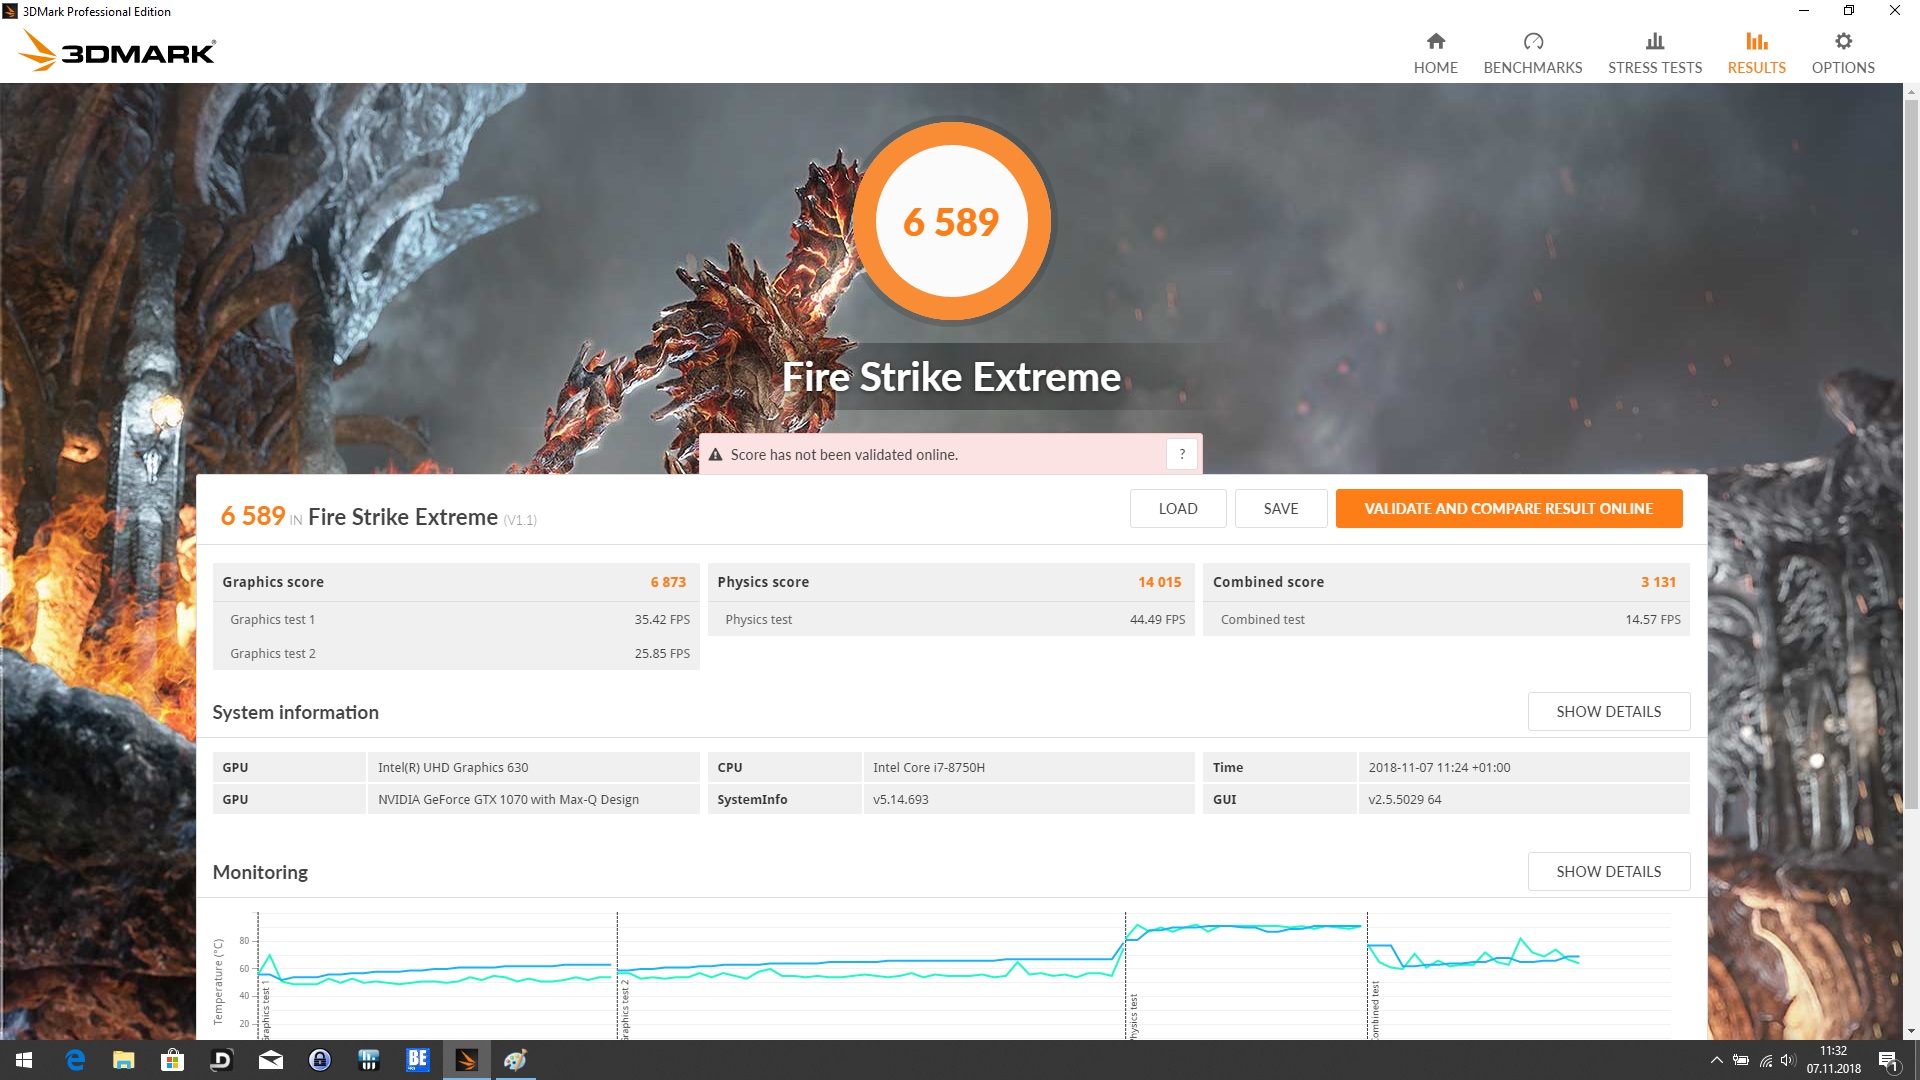
| 3DMark Fire Strike Extreme Score | 6589 pontos | |
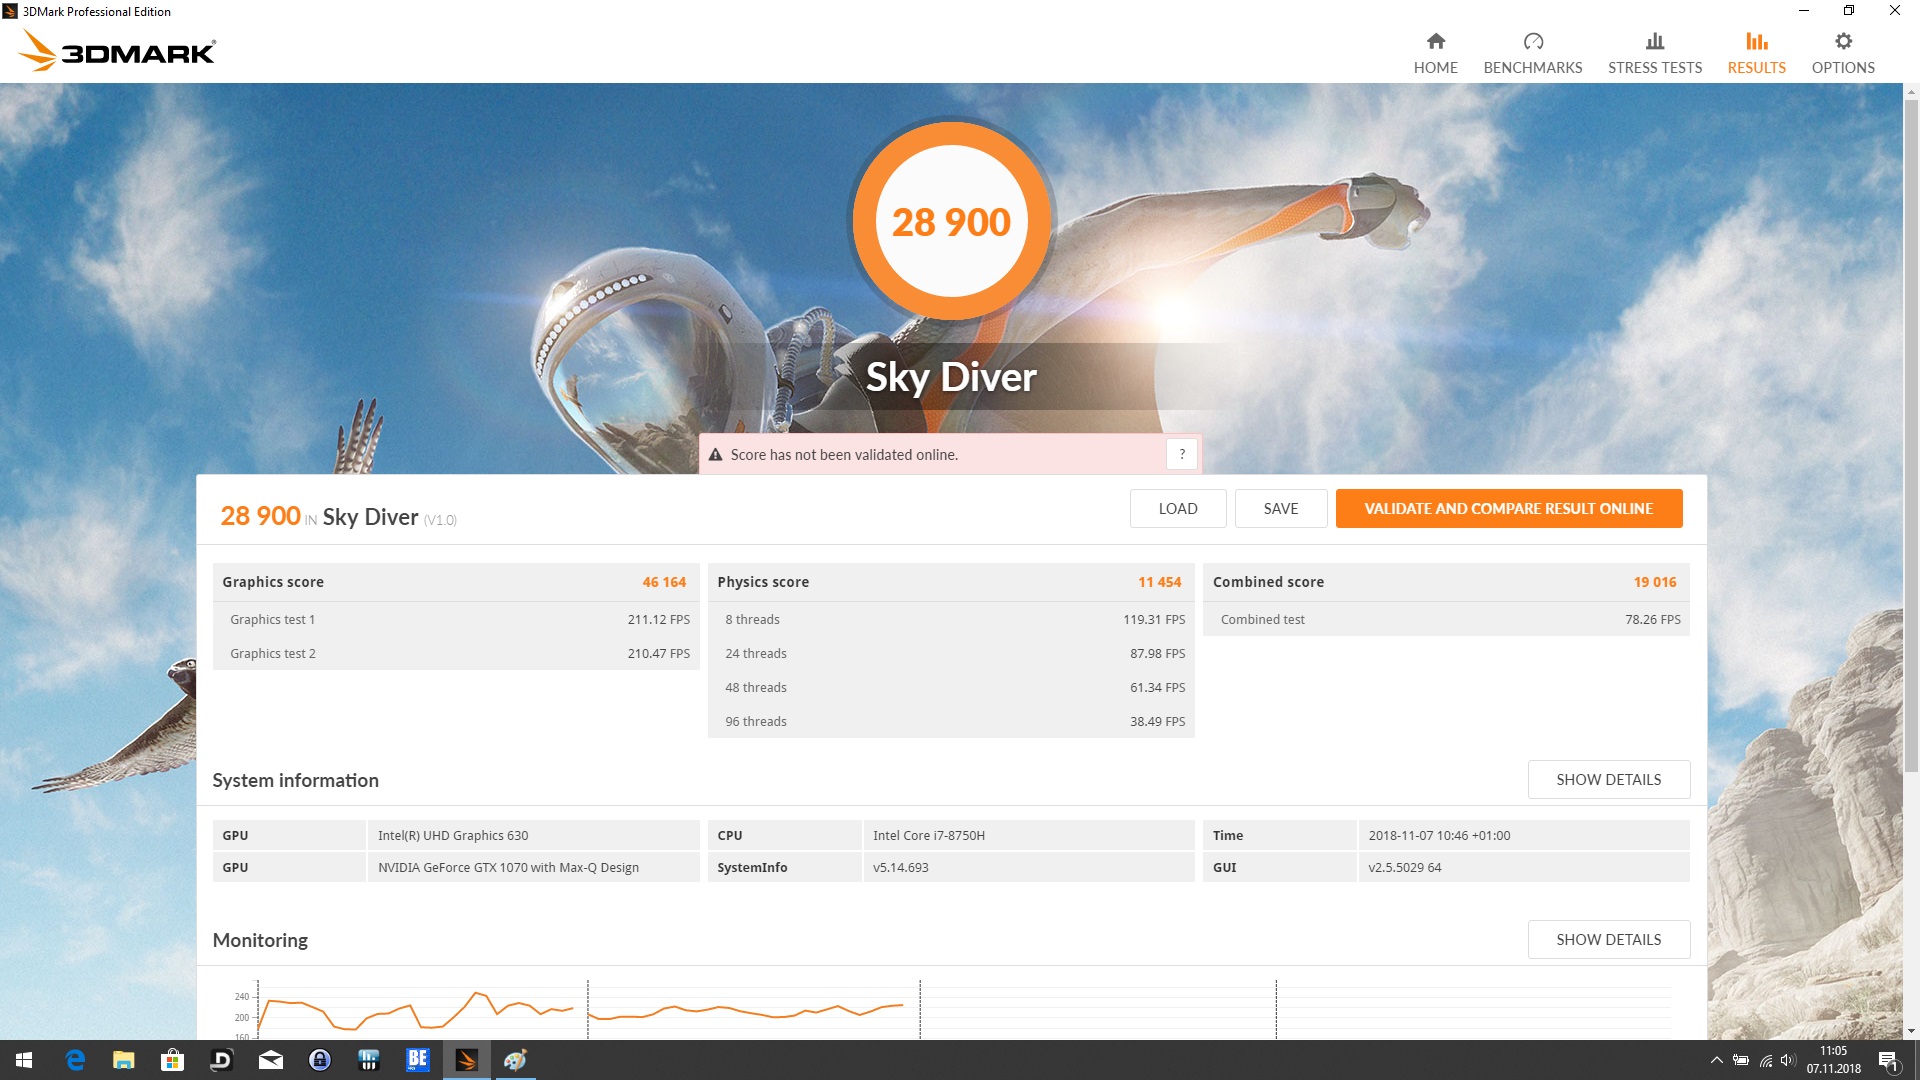
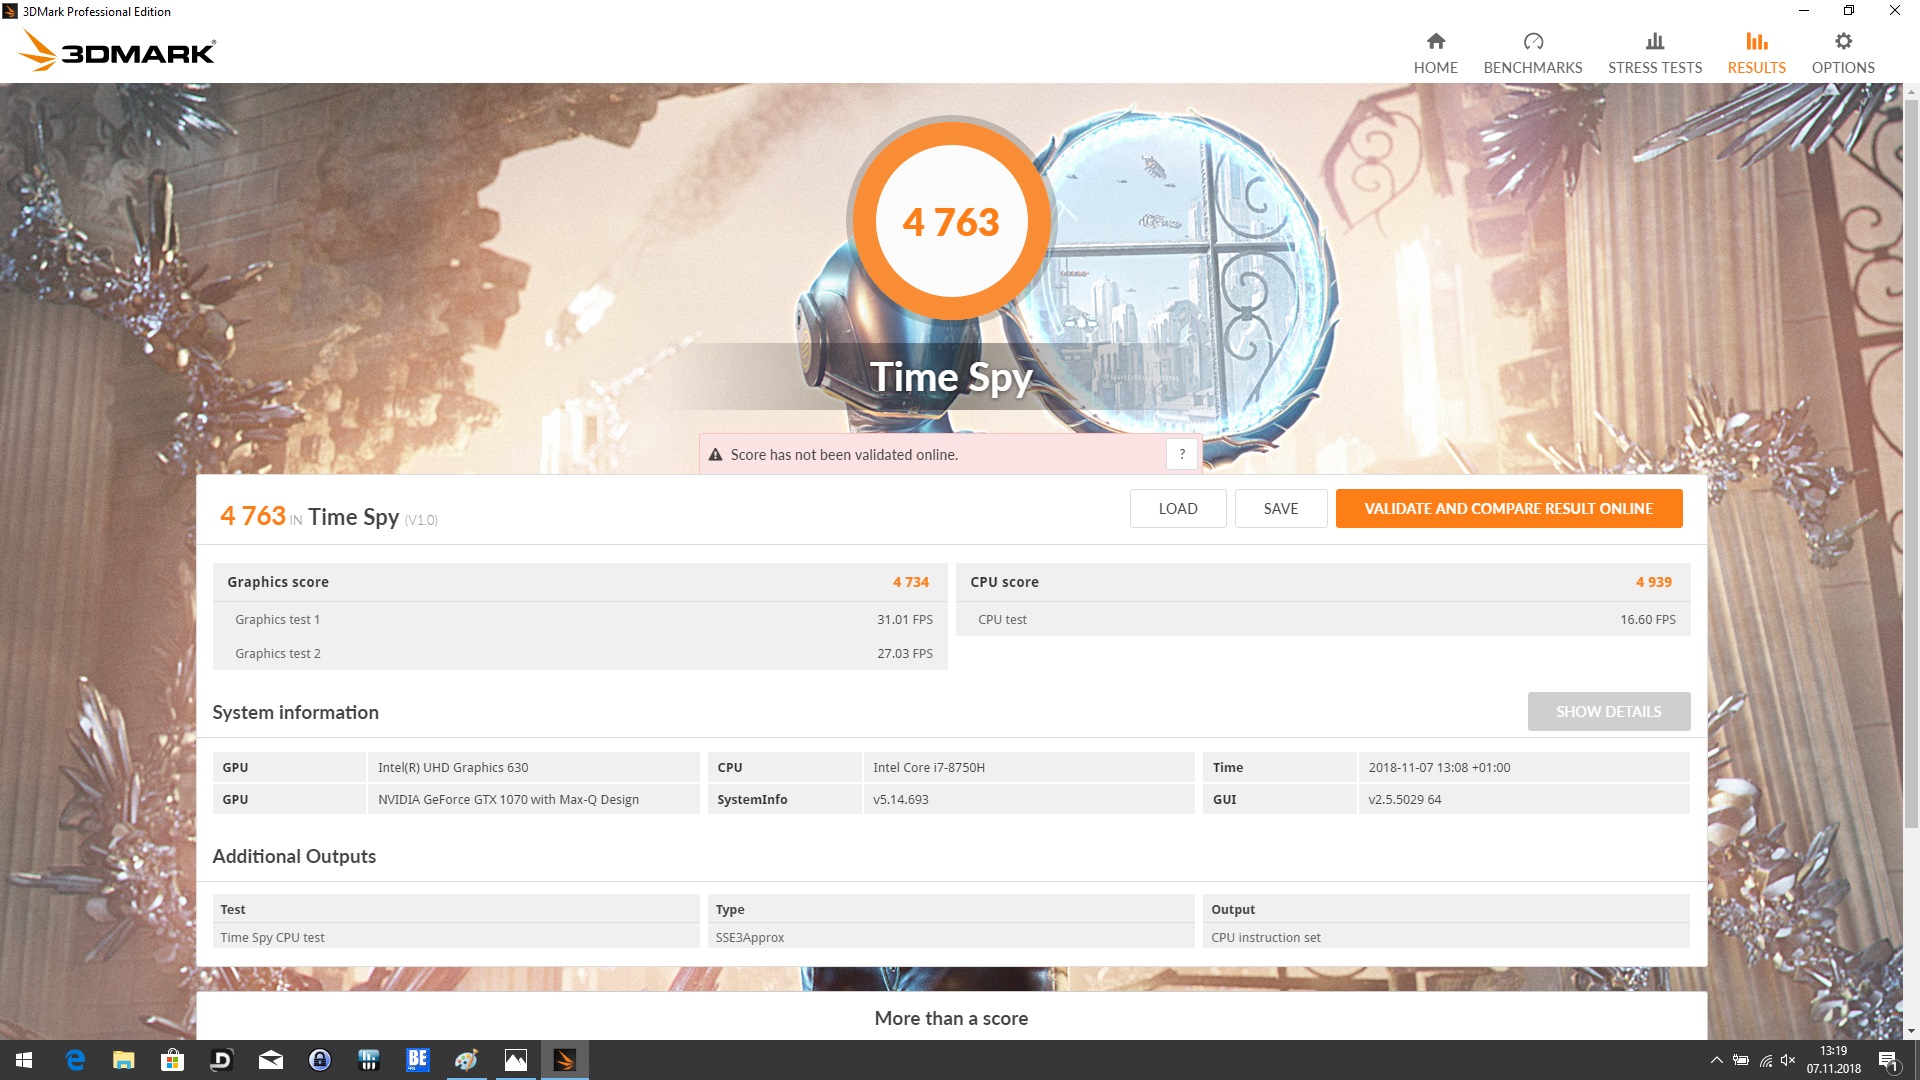
| 3DMark Time Spy Score | 4763 pontos | |
Ajuda | ||
| The Witcher 3 - 1920x1080 Ultra Graphics & Postprocessing (HBAO+) | |
| Asus GL504GS | |
| MSI GS65 8RF-019DE Stealth Thin | |
| Gigabyte Aero 15X v8 | |
| Média da turma Multimedia (11 - 121, n=11, últimos 2 anos) | |
| MSI P65 8RF-451 - Creator | |
| Média NVIDIA GeForce GTX 1070 Max-Q (46 - 55.3, n=19) | |
| MSI WS63 7RF-290US | |
| Lenovo ThinkPad X1 Extreme-20MF000XGE | |
| Asus ZenBook Pro 15 UX580GE | |
| Shadow of the Tomb Raider - 1920x1080 Highest Preset AA:T | |
| Média da turma Multimedia (23 - 129, n=8, últimos 2 anos) | |
| Média NVIDIA GeForce GTX 1070 Max-Q (58 - 61, n=3) | |
| MSI P65 8RF-451 - Creator | |
| Lenovo ThinkPad X1 Extreme-20MF000XGE | |
| F1 2018 - 1920x1080 Ultra High Preset AA:T AF:16x | |
| MSI P65 8RF-451 - Creator | |
| Média NVIDIA GeForce GTX 1070 Max-Q (70 - 76, n=3) | |
| Lenovo ThinkPad X1 Extreme-20MF000XGE | |
| Forza Horizon 4 - 1920x1080 Ultra Preset AA:2xMS | |
| Média NVIDIA GeForce GTX 1070 Max-Q (78 - 80, n=2) | |
| MSI P65 8RF-451 - Creator | |
| baixo | média | alto | ultra | 4K | |
|---|---|---|---|---|---|
| BioShock Infinite (2013) | 249.1 | 222.1 | 204.7 | 118 | |
| The Witcher 3 (2015) | 218.5 | 156.7 | 93.2 | 51.5 | 27.7 |
| Rise of the Tomb Raider (2016) | 131.1 | 126.7 | 85.7 | 77.1 | 32.1 |
| Battlefield 1 (2016) | 123.2 | 105.5 | 91.5 | 90.7 | 39.1 |
| Assassin´s Creed Origins (2017) | 70 | 64 | 62 | 53 | 26 |
| Far Cry 5 (2018) | 103 | 81 | 77 | 74 | 27 |
| F1 2018 (2018) | 163 | 130 | 100 | 76 | 59 |
| Shadow of the Tomb Raider (2018) | 91 | 65 | 62 | 58 | 20 |
| Forza Horizon 4 (2018) | 127 | 101 | 95 | 78 | 43 |
| Assassin´s Creed Odyssey (2018) | 64 | 62 | 52 | 39 | 21 |
Barulho
| Ocioso |
| 32.1 / 32.1 / 32.4 dB |
| Carga |
| 39 / 40.2 dB |
 | ||
30 dB silencioso 40 dB(A) audível 50 dB(A) ruidosamente alto |
||
min: | ||
| MSI P65 8RF-451 - Creator Intel Core i7-8750H, NVIDIA GeForce GTX 1070 Max-Q | Asus ZenBook Pro 15 UX580GE Intel Core i9-8950HK, NVIDIA GeForce GTX 1050 Ti Mobile | Lenovo ThinkPad X1 Extreme-20MF000XGE Intel Core i7-8750H, NVIDIA GeForce GTX 1050 Ti Max-Q | Gigabyte Aero 15X v8 Intel Core i7-8750H, NVIDIA GeForce GTX 1070 Max-Q | Asus GL504GS Intel Core i7-8750H, NVIDIA GeForce GTX 1070 Mobile | MSI GS65 8RF-019DE Stealth Thin Intel Core i7-8750H, NVIDIA GeForce GTX 1070 Max-Q | MSI WS63 7RF-290US Intel Core i7-7700HQ, NVIDIA Quadro P3000 | |
|---|---|---|---|---|---|---|---|
| Noise | 2% | 6% | -9% | -13% | -2% | 3% | |
| desligado / ambiente * (dB) | 30.7 | 28 9% | 28.8 6% | 29 6% | 29 6% | 30 2% | 28.1 8% |
| Idle Minimum * (dB) | 32.1 | 28.6 11% | 28.8 10% | 30 7% | 32 -0% | 30 7% | 28.1 12% |
| Idle Average * (dB) | 32.1 | 29.9 7% | 28.8 10% | 31 3% | 33 -3% | 31 3% | 28.1 12% |
| Idle Maximum * (dB) | 32.4 | 30.5 6% | 31.3 3% | 35 -8% | 40 -23% | 34 -5% | 32 1% |
| Load Average * (dB) | 39 | 42.5 -9% | 36.4 7% | 49 -26% | 49 -26% | 43 -10% | 38 3% |
| Load Maximum * (dB) | 40.2 | 44.8 -11% | 39.2 2% | 54 -34% | 53 -32% | 44 -9% | 47.2 -17% |
| Witcher 3 ultra * (dB) | 44.8 | 36.4 | 51 | 51 | 42 | 35.8 |
* ... menor é melhor
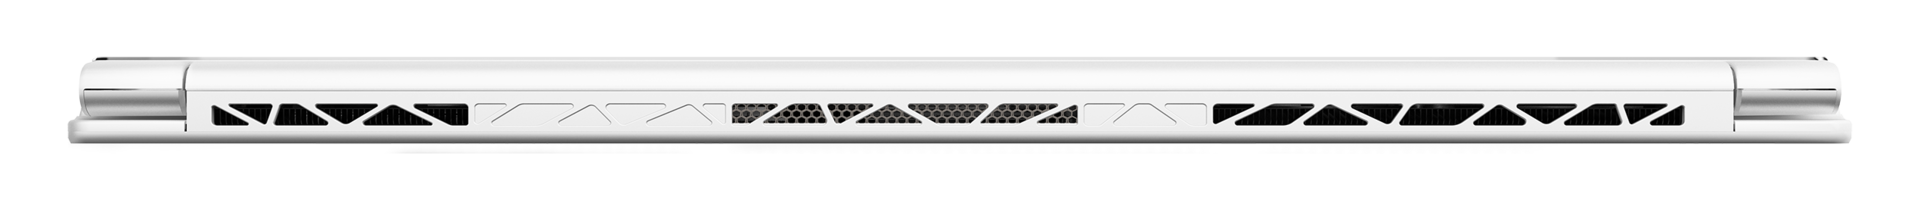
(-) A temperatura máxima no lado superior é 46.6 °C / 116 F, em comparação com a média de 36.8 °C / 98 F , variando de 21 a 71 °C para a classe Multimedia.
(-) A parte inferior aquece até um máximo de 56.6 °C / 134 F, em comparação com a média de 39.1 °C / 102 F
(+) Em uso inativo, a temperatura média para o lado superior é 27 °C / 81 F, em comparação com a média do dispositivo de 31.3 °C / ### class_avg_f### F.
(-) Os apoios para as mãos e o touchpad podem ficar muito quentes ao toque, com um máximo de 41.7 °C / 107.1 F.
(-) A temperatura média da área do apoio para as mãos de dispositivos semelhantes foi 28.7 °C / 83.7 F (-13 °C / -23.4 F).
| MSI P65 8RF-451 - Creator GeForce GTX 1070 Max-Q, i7-8750H, Kingston RBUSNS8154P3512GJ | Asus ZenBook Pro 15 UX580GE GeForce GTX 1050 Ti Mobile, i9-8950HK, Samsung SSD PM961 1TB M.2 PCIe 3.0 x4 NVMe (MZVLW1T0) | Lenovo ThinkPad X1 Extreme-20MF000XGE GeForce GTX 1050 Ti Max-Q, i7-8750H, Samsung SSD PM981 MZVLB1T0HALR | Gigabyte Aero 15X v8 GeForce GTX 1070 Max-Q, i7-8750H, Toshiba NVMe THNSN5512GPU7 | Asus GL504GS GeForce GTX 1070 Mobile, i7-8750H, Samsung SSD PM981 MZVLB512HAJQ | MSI GS65 8RF-019DE Stealth Thin GeForce GTX 1070 Max-Q, i7-8750H, Samsung SSD PM981 MZVLB512HAJQ | MSI WS63 7RF-290US Quadro P3000, i7-7700HQ, Samsung SM961 MZVKW512HMJP m.2 PCI-e | |
|---|---|---|---|---|---|---|---|
| Heat | -5% | 7% | -6% | -17% | 3% | -2% | |
| Maximum Upper Side * (°C) | 46.6 | 42.4 9% | 45.4 3% | 53 -14% | 55 -18% | 49 -5% | 46.4 -0% |
| Maximum Bottom * (°C) | 56.6 | 50.8 10% | 53.4 6% | 65 -15% | 55 3% | 63 -11% | 62 -10% |
| Idle Upper Side * (°C) | 28.8 | 33 -15% | 26.3 9% | 26 10% | 36 -25% | 24 17% | 28.2 2% |
| Idle Bottom * (°C) | 28.5 | 35.2 -24% | 26.2 8% | 30 -5% | 36 -26% | 25 12% | 28.8 -1% |
* ... menor é melhor
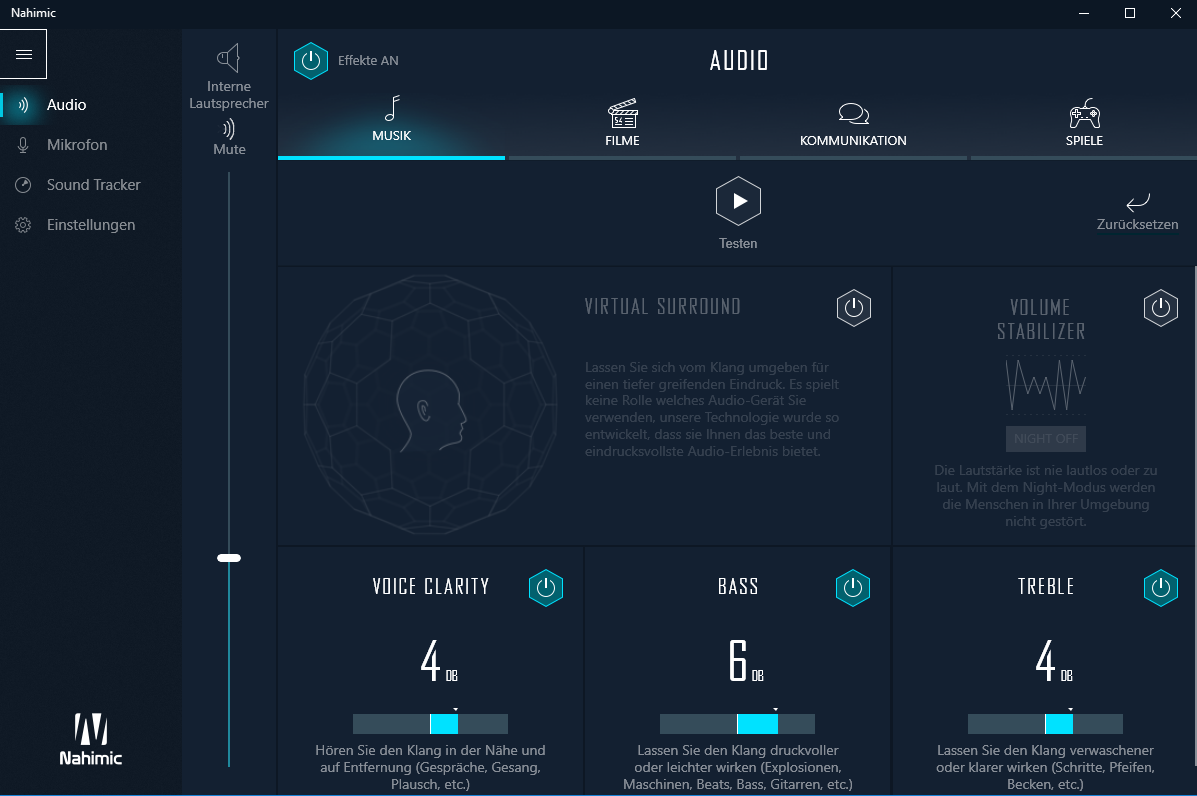
MSI P65 8RF-451 - Creator análise de áudio
(±) | o volume do alto-falante é médio, mas bom (###valor### dB)
Graves 100 - 315Hz
(-) | quase nenhum baixo - em média 15.5% menor que a mediana
(+) | o baixo é linear (3.6% delta para a frequência anterior)
Médios 400 - 2.000 Hz
(±) | médios mais altos - em média 7.3% maior que a mediana
(±) | a linearidade dos médios é média (7.3% delta para frequência anterior)
Altos 2 - 16 kHz
(±) | máximos mais altos - em média 7.1% maior que a mediana
(+) | os máximos são lineares (6.8% delta da frequência anterior)
Geral 100 - 16.000 Hz
(±) | a linearidade do som geral é média (20.4% diferença em relação à mediana)
Comparado com a mesma classe
» 69% de todos os dispositivos testados nesta classe foram melhores, 8% semelhantes, 23% piores
» O melhor teve um delta de 5%, a média foi 17%, o pior foi 45%
Comparado com todos os dispositivos testados
» 54% de todos os dispositivos testados foram melhores, 8% semelhantes, 38% piores
» O melhor teve um delta de 4%, a média foi 23%, o pior foi 134%
Asus ZenBook Pro 15 UX580GE análise de áudio
(±) | o volume do alto-falante é médio, mas bom (###valor### dB)
Graves 100 - 315Hz
(-) | quase nenhum baixo - em média 22.3% menor que a mediana
(±) | a linearidade dos graves é média (11.5% delta para a frequência anterior)
Médios 400 - 2.000 Hz
(+) | médios equilibrados - apenas 2.4% longe da mediana
(±) | a linearidade dos médios é média (7.5% delta para frequência anterior)
Altos 2 - 16 kHz
(+) | agudos equilibrados - apenas 4% longe da mediana
(+) | os máximos são lineares (6.2% delta da frequência anterior)
Geral 100 - 16.000 Hz
(±) | a linearidade do som geral é média (17.7% diferença em relação à mediana)
Comparado com a mesma classe
» 51% de todos os dispositivos testados nesta classe foram melhores, 7% semelhantes, 42% piores
» O melhor teve um delta de 5%, a média foi 17%, o pior foi 45%
Comparado com todos os dispositivos testados
» 35% de todos os dispositivos testados foram melhores, 8% semelhantes, 57% piores
» O melhor teve um delta de 4%, a média foi 23%, o pior foi 134%
| desligado | |
| Ocioso | |
| Carga |
|
Key:
min: | |
| MSI P65 8RF-451 - Creator i7-8750H, GeForce GTX 1070 Max-Q, Kingston RBUSNS8154P3512GJ, IPS, 1920x1080, 15.6" | Asus ZenBook Pro 15 UX580GE i9-8950HK, GeForce GTX 1050 Ti Mobile, Samsung SSD PM961 1TB M.2 PCIe 3.0 x4 NVMe (MZVLW1T0), IPS, 3840x2160, 15.6" | Lenovo ThinkPad X1 Extreme-20MF000XGE i7-8750H, GeForce GTX 1050 Ti Max-Q, Samsung SSD PM981 MZVLB1T0HALR, IPS, 3840x2160, 15.6" | Gigabyte Aero 15X v8 i7-8750H, GeForce GTX 1070 Max-Q, Toshiba NVMe THNSN5512GPU7, IPS, 1920x1080, 15.6" | Asus GL504GS i7-8750H, GeForce GTX 1070 Mobile, Samsung SSD PM981 MZVLB512HAJQ, IPS, 1920x1080, 15.6" | MSI GS65 8RF-019DE Stealth Thin i7-8750H, GeForce GTX 1070 Max-Q, Samsung SSD PM981 MZVLB512HAJQ, IPS, 1920x1080, 15.6" | MSI WS63 7RF-290US i7-7700HQ, Quadro P3000, Samsung SM961 MZVKW512HMJP m.2 PCI-e, IPS, 1920x1080, 15.6" | Média NVIDIA GeForce GTX 1070 Max-Q | Média da turma Multimedia | |
|---|---|---|---|---|---|---|---|---|---|
| Power Consumption | -24% | 2% | -34% | -124% | -3% | -6% | -23% | 26% | |
| Idle Minimum * (Watt) | 7.4 | 11.7 -58% | 7.6 -3% | 14 -89% | 29 -292% | 7 5% | 11 -49% | 11.4 ? -54% | 5.68 ? 23% |
| Idle Average * (Watt) | 11.7 | 18.5 -58% | 14.8 -26% | 18 -54% | 32 -174% | 11 6% | 14.2 -21% | 15.7 ? -34% | 10.2 ? 13% |
| Idle Maximum * (Watt) | 16.8 | 22.8 -36% | 17.6 -5% | 22 -31% | 38 -126% | 20 -19% | 14.6 13% | 20.7 ? -23% | 12.4 ? 26% |
| Load Average * (Watt) | 94 | 97.5 -4% | 86 9% | 91 3% | 100 -6% | 98 -4% | 77.7 17% | 98.1 ? -4% | 65.4 ? 30% |
| Load Maximum * (Watt) | 177 | 111.1 37% | 118.9 33% | 173 2% | 217 -23% | 182 -3% | 161.7 9% | 173.8 ? 2% | 113.3 ? 36% |
| Witcher 3 ultra * (Watt) | 102.9 | 85 | 142 | 170 | 132 | 89.1 |
* ... menor é melhor

| MSI P65 8RF-451 - Creator i7-8750H, GeForce GTX 1070 Max-Q, 82 Wh | Asus ZenBook Pro 15 UX580GE i9-8950HK, GeForce GTX 1050 Ti Mobile, 71 Wh | Lenovo ThinkPad X1 Extreme-20MF000XGE i7-8750H, GeForce GTX 1050 Ti Max-Q, 80 Wh | Gigabyte Aero 15X v8 i7-8750H, GeForce GTX 1070 Max-Q, 94.24 Wh | Asus GL504GS i7-8750H, GeForce GTX 1070 Mobile, 66 Wh | MSI GS65 8RF-019DE Stealth Thin i7-8750H, GeForce GTX 1070 Max-Q, 82 Wh | Média da turma Multimedia | |
|---|---|---|---|---|---|---|---|
| Duração da bateria | 23% | 23% | 55% | -50% | -1% | 126% | |
| Reader / Idle (h) | 7.5 | 14 87% | 11.5 53% | 12.7 69% | 2.9 -61% | 8.5 13% | 25.2 ? 236% |
| H.264 (h) | 5.9 | 6.2 5% | 8.4 42% | 2.5 -58% | 5.9 0% | 16.4 ? 178% | |
| WiFi v1.3 (h) | 7.1 | 6.3 -11% | 6.4 -10% | 8.6 21% | 2.4 -66% | 6 -15% | 12.2 ? 72% |
| Load (h) | 1.4 | 1.3 -7% | 2 43% | 2.6 86% | 1.2 -14% | 1.4 0% | 1.662 ? 19% |
| Witcher 3 ultra (h) | 1.1 |
Pro
Contra

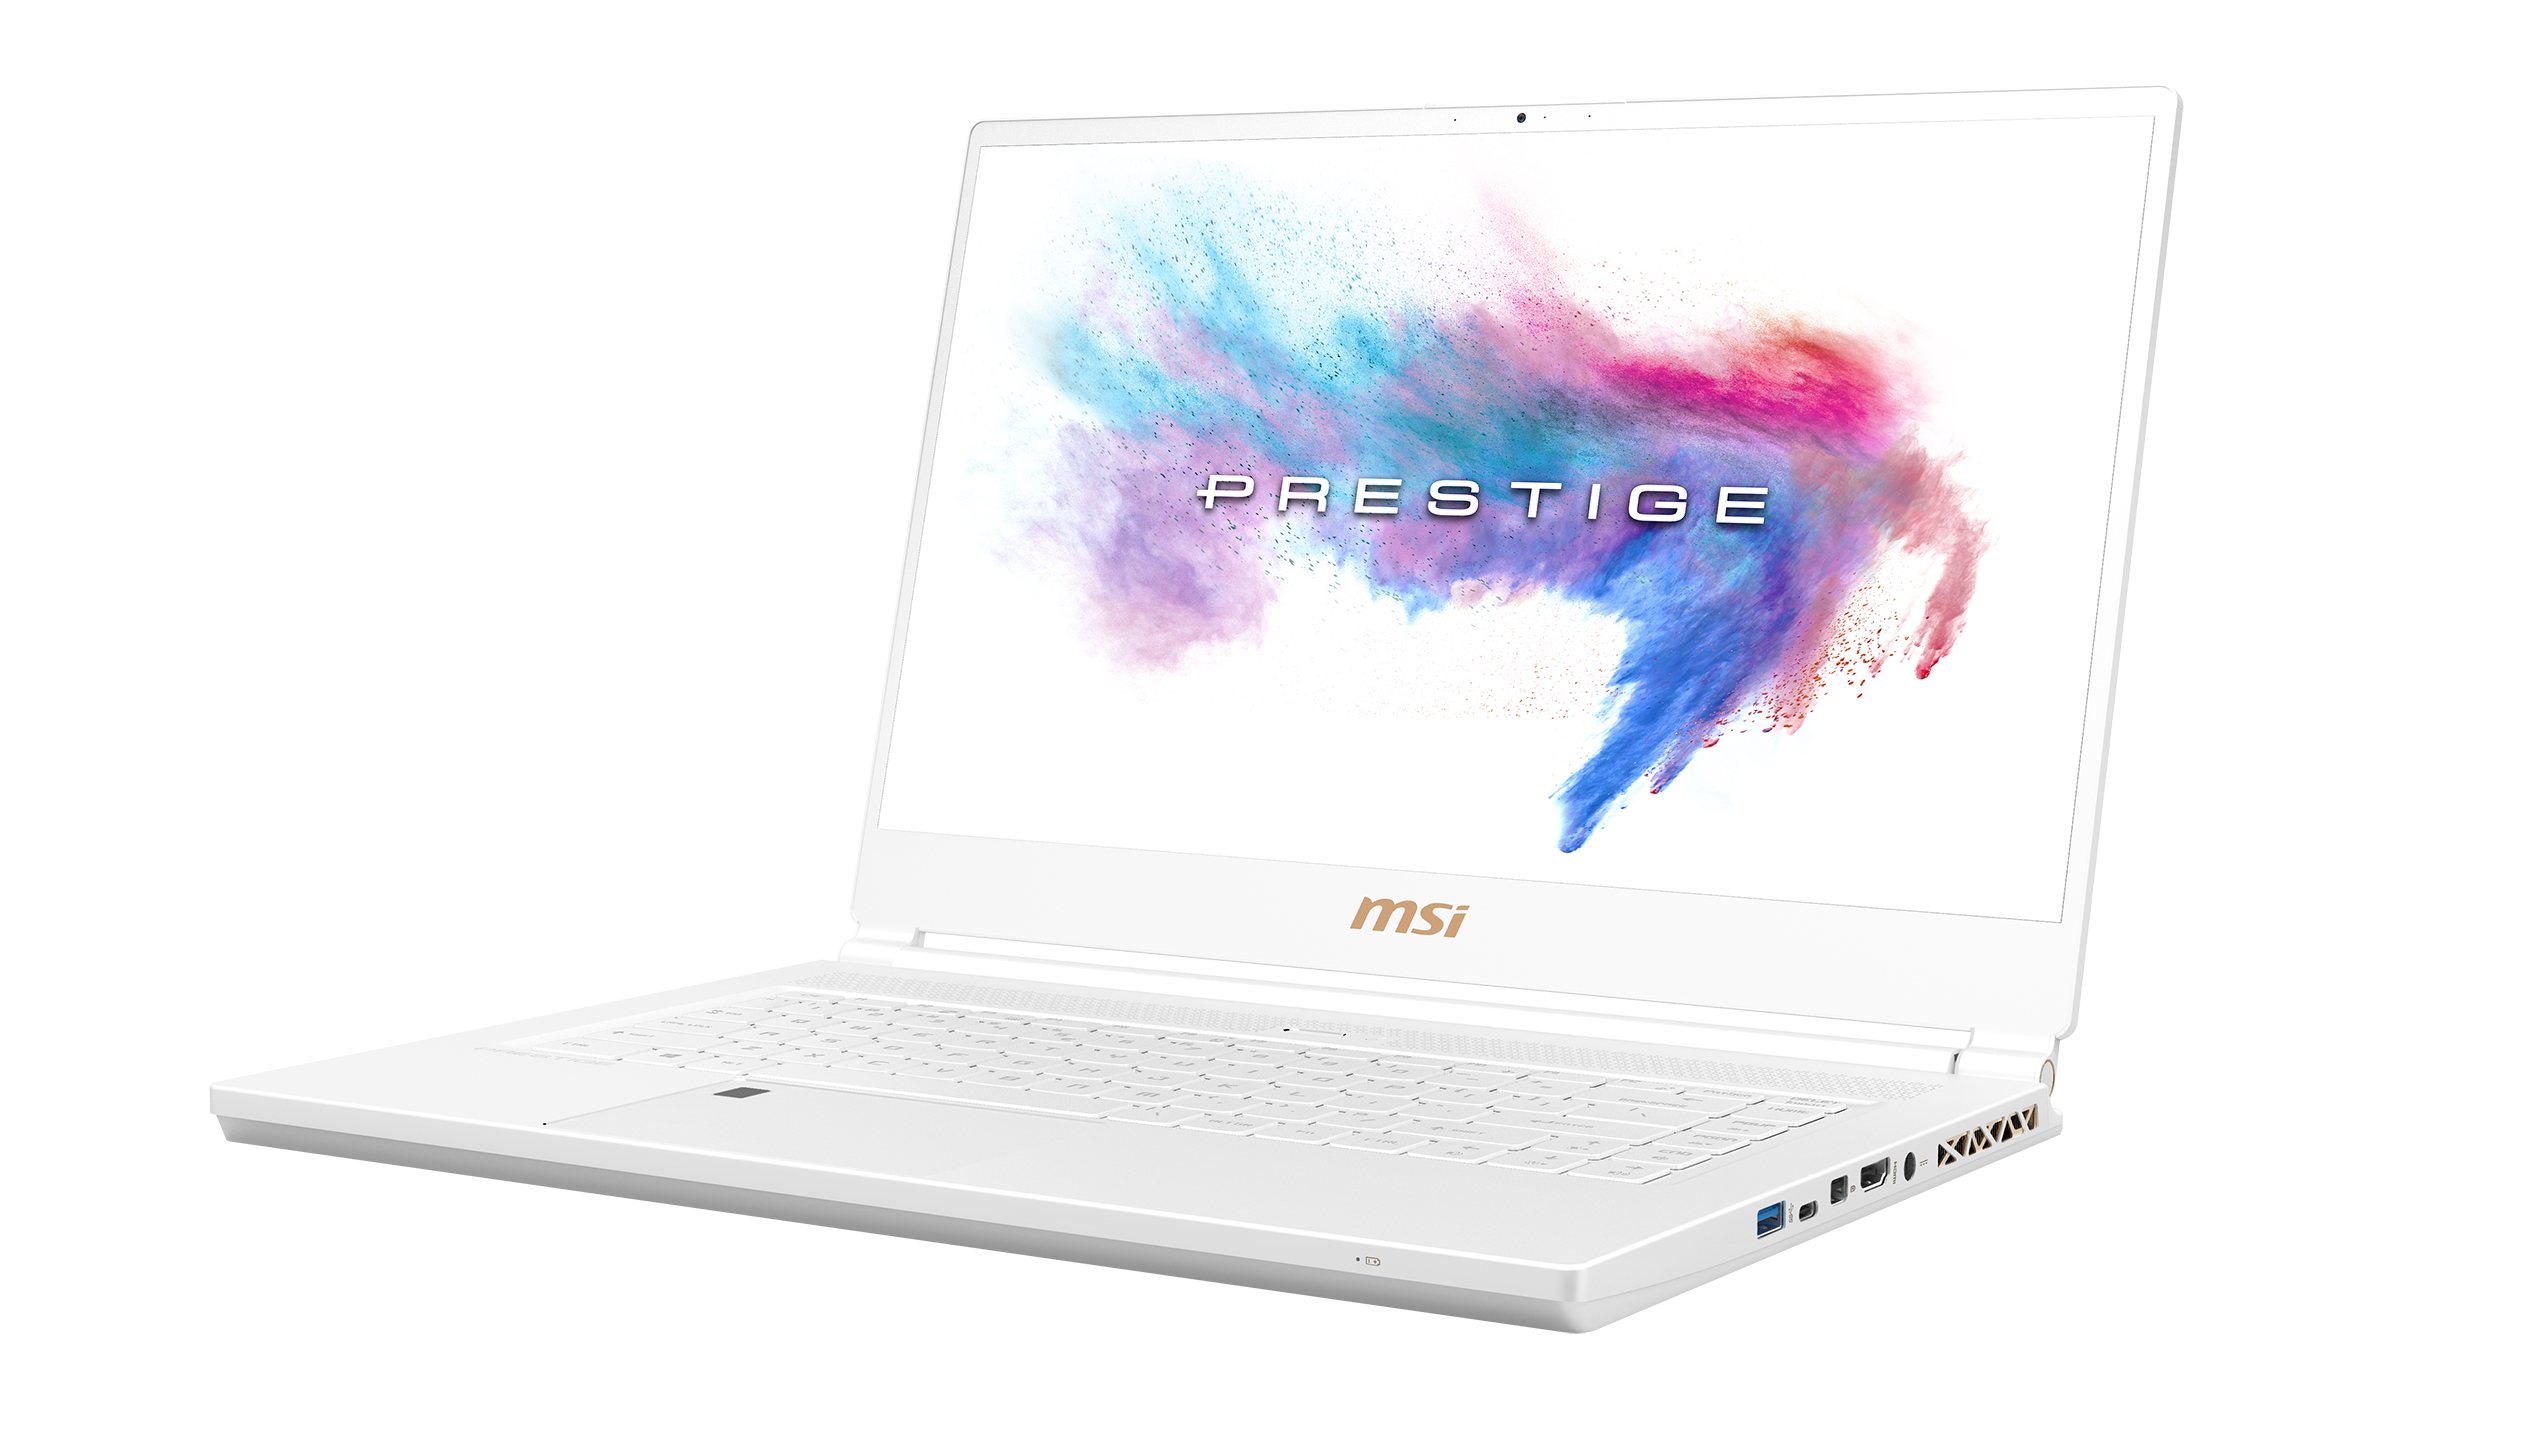
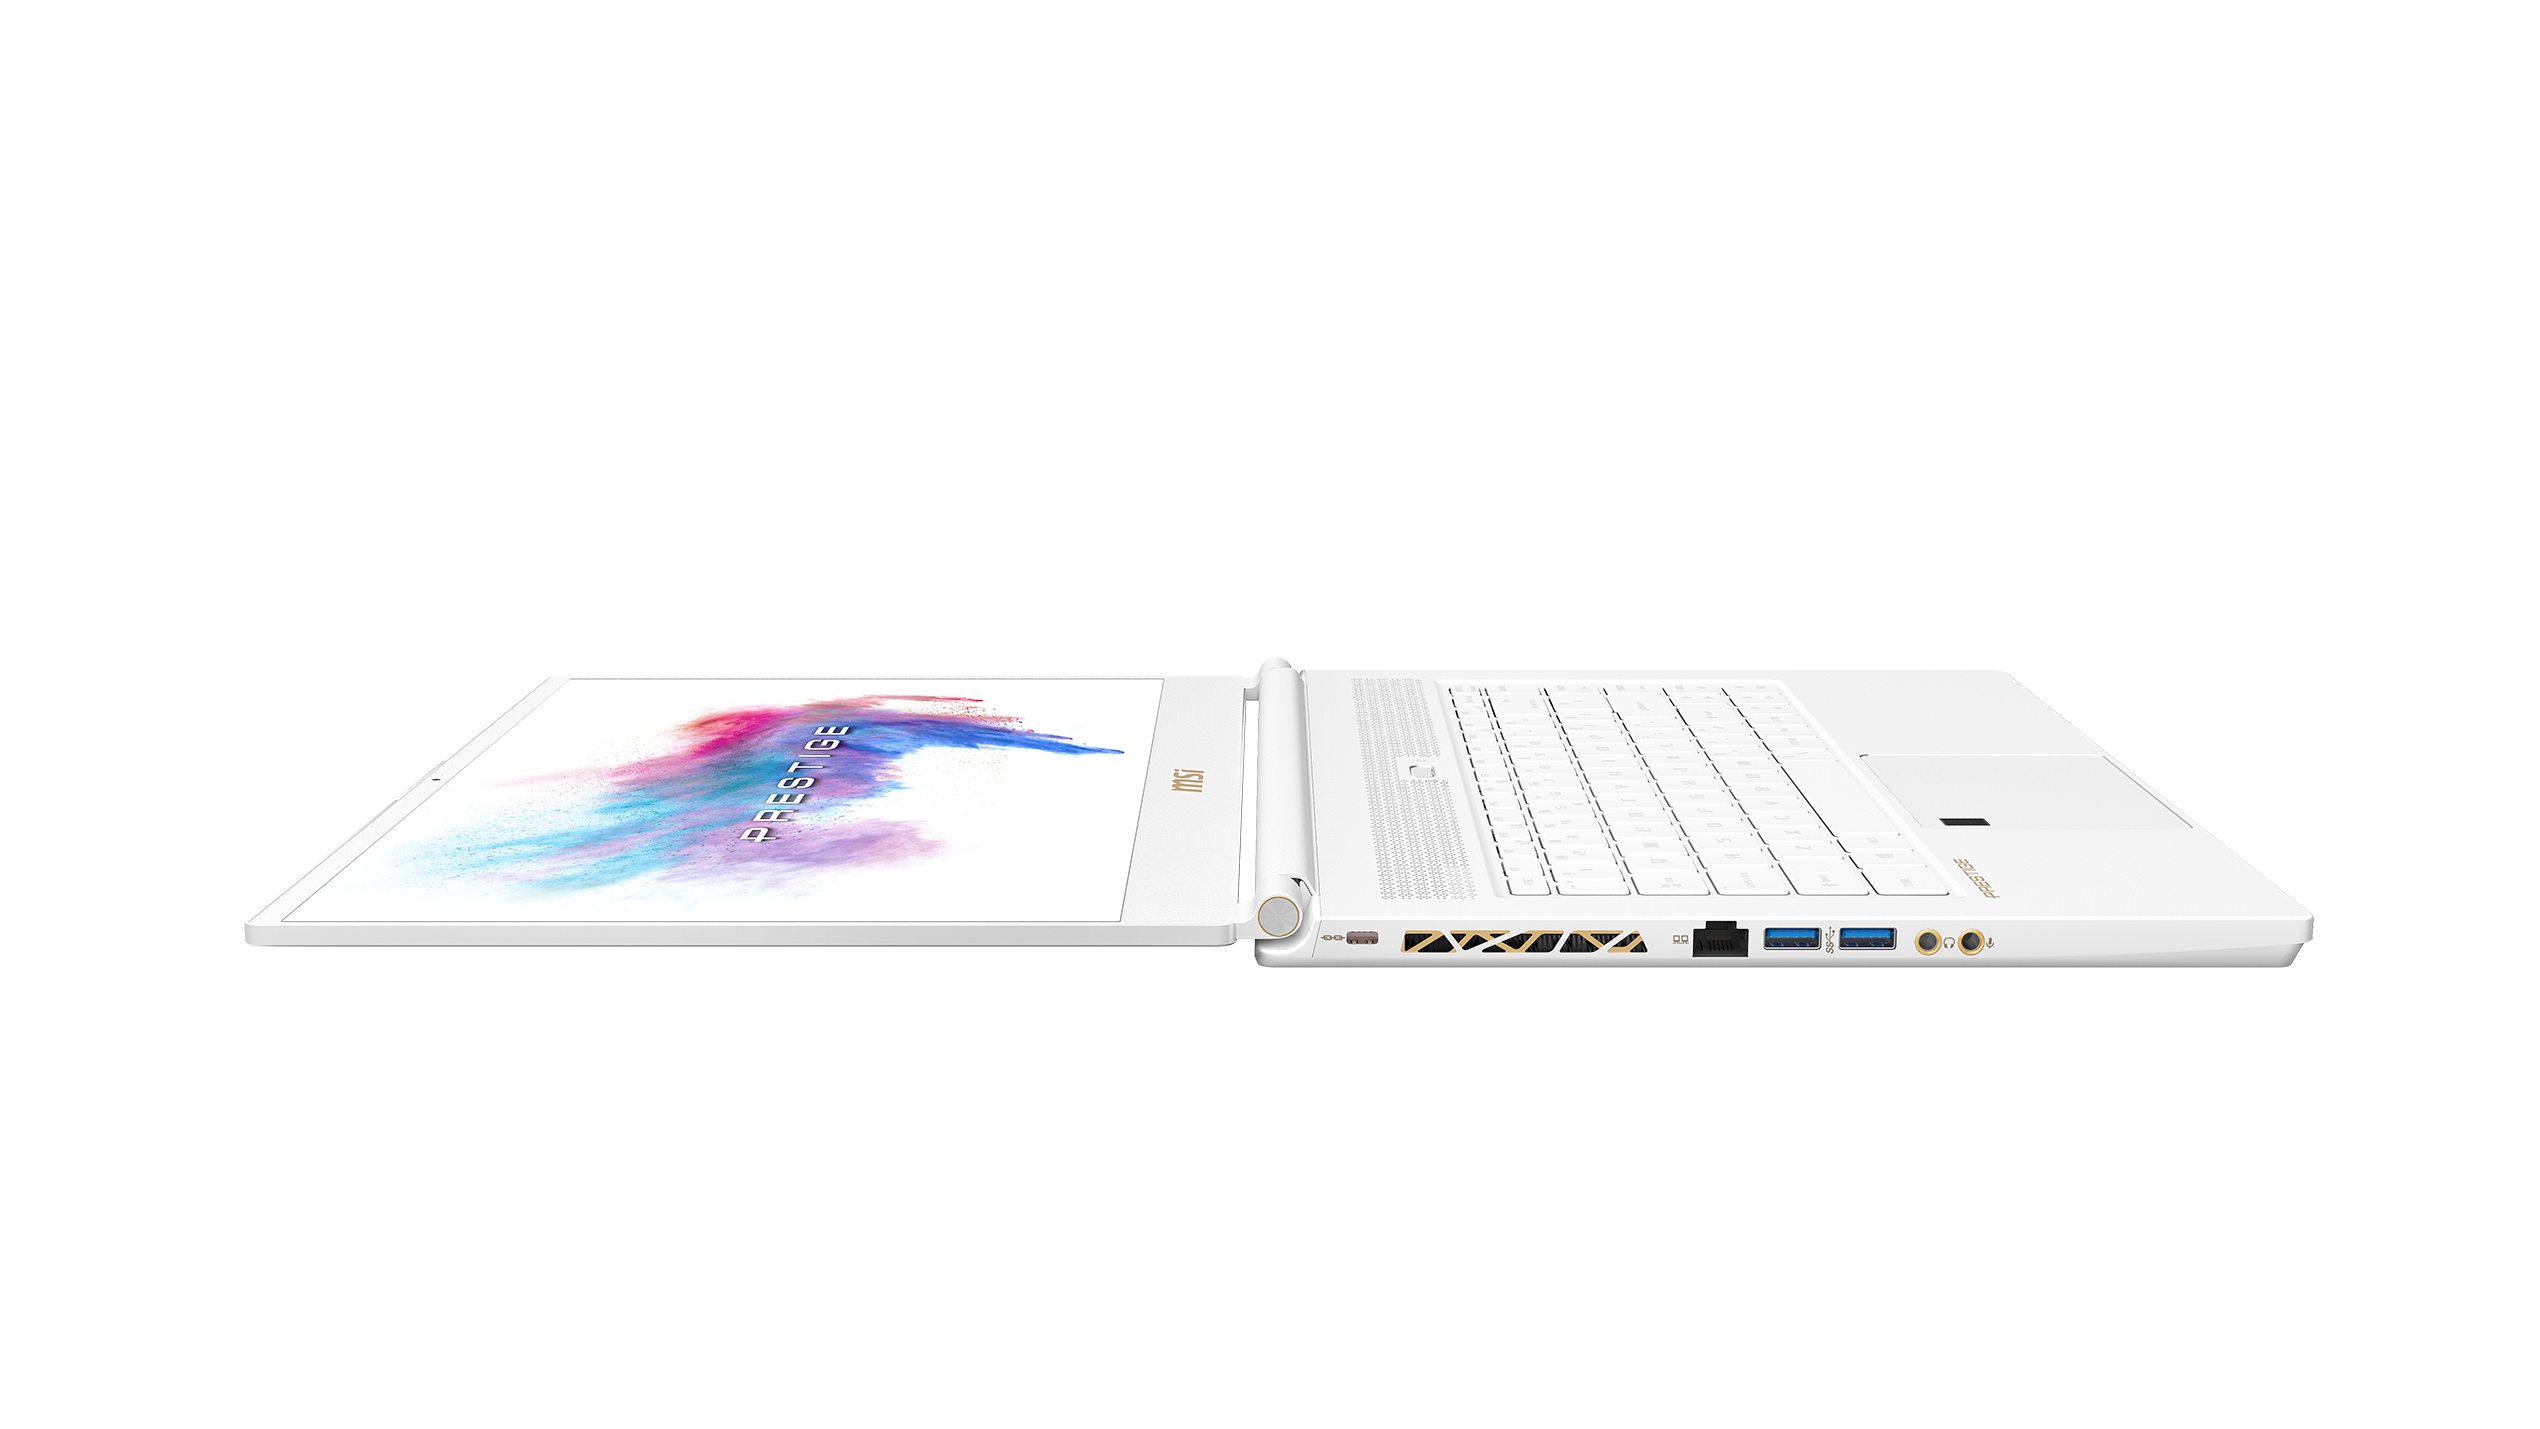
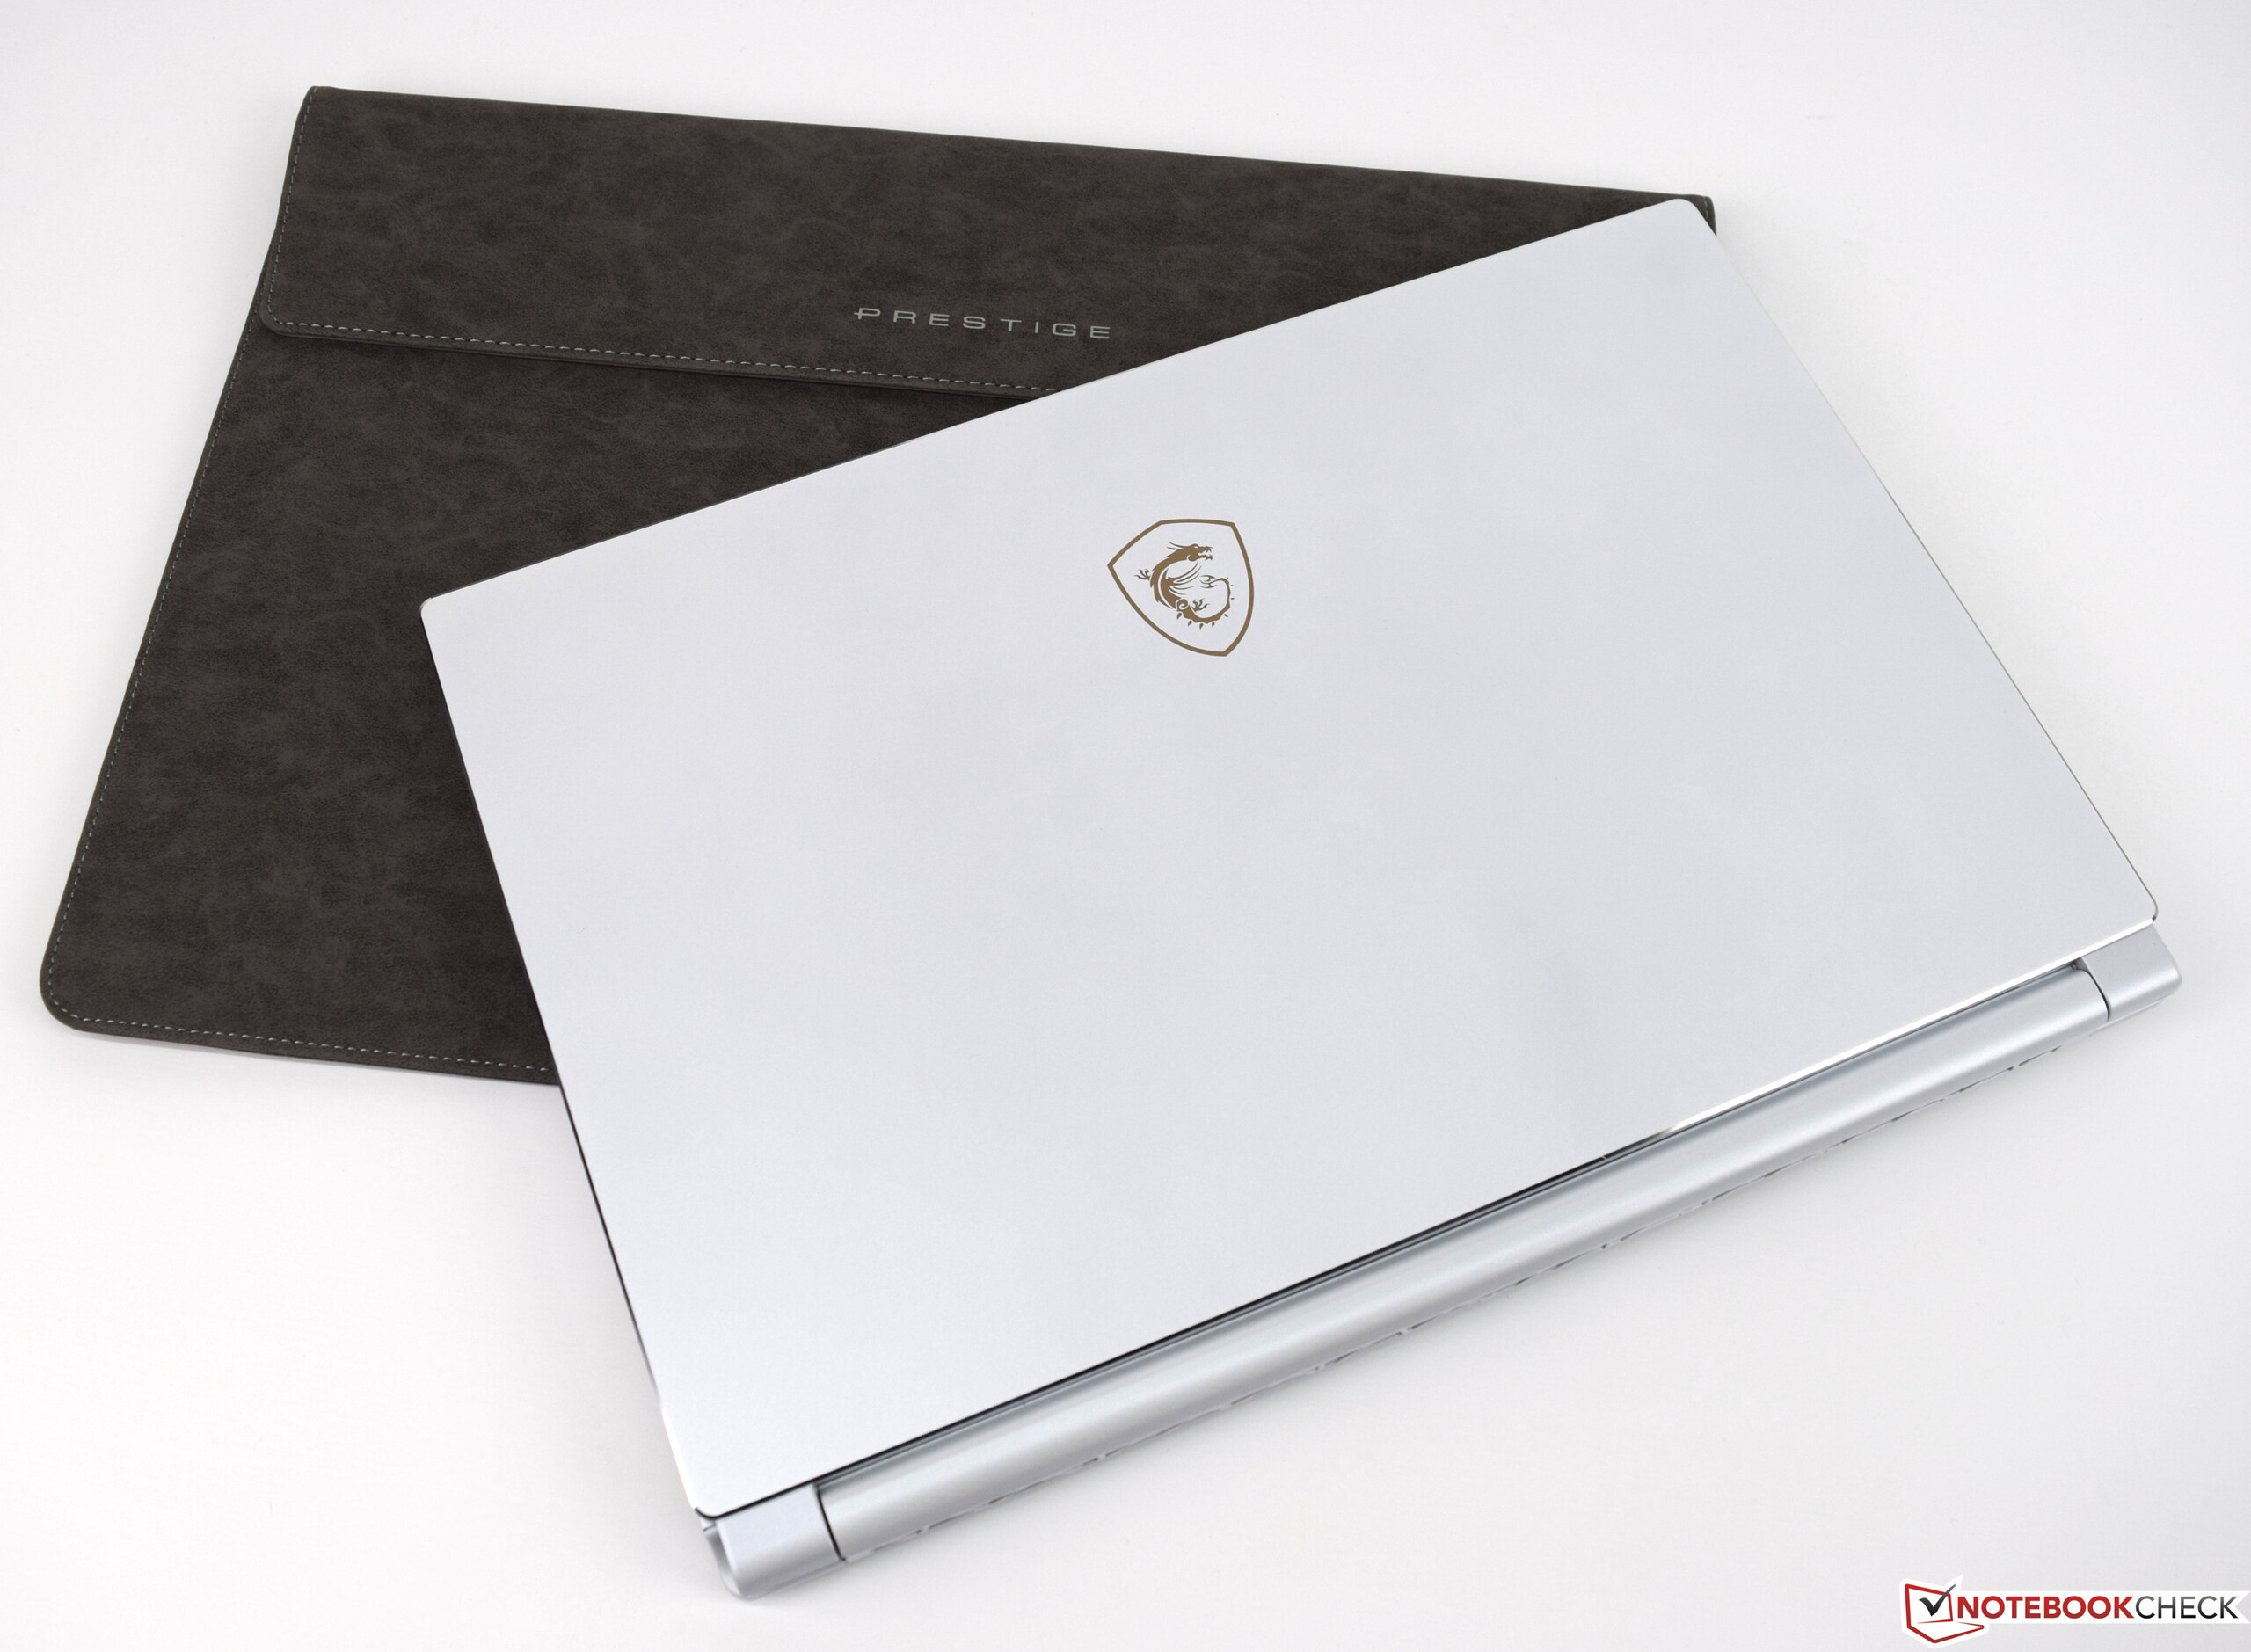
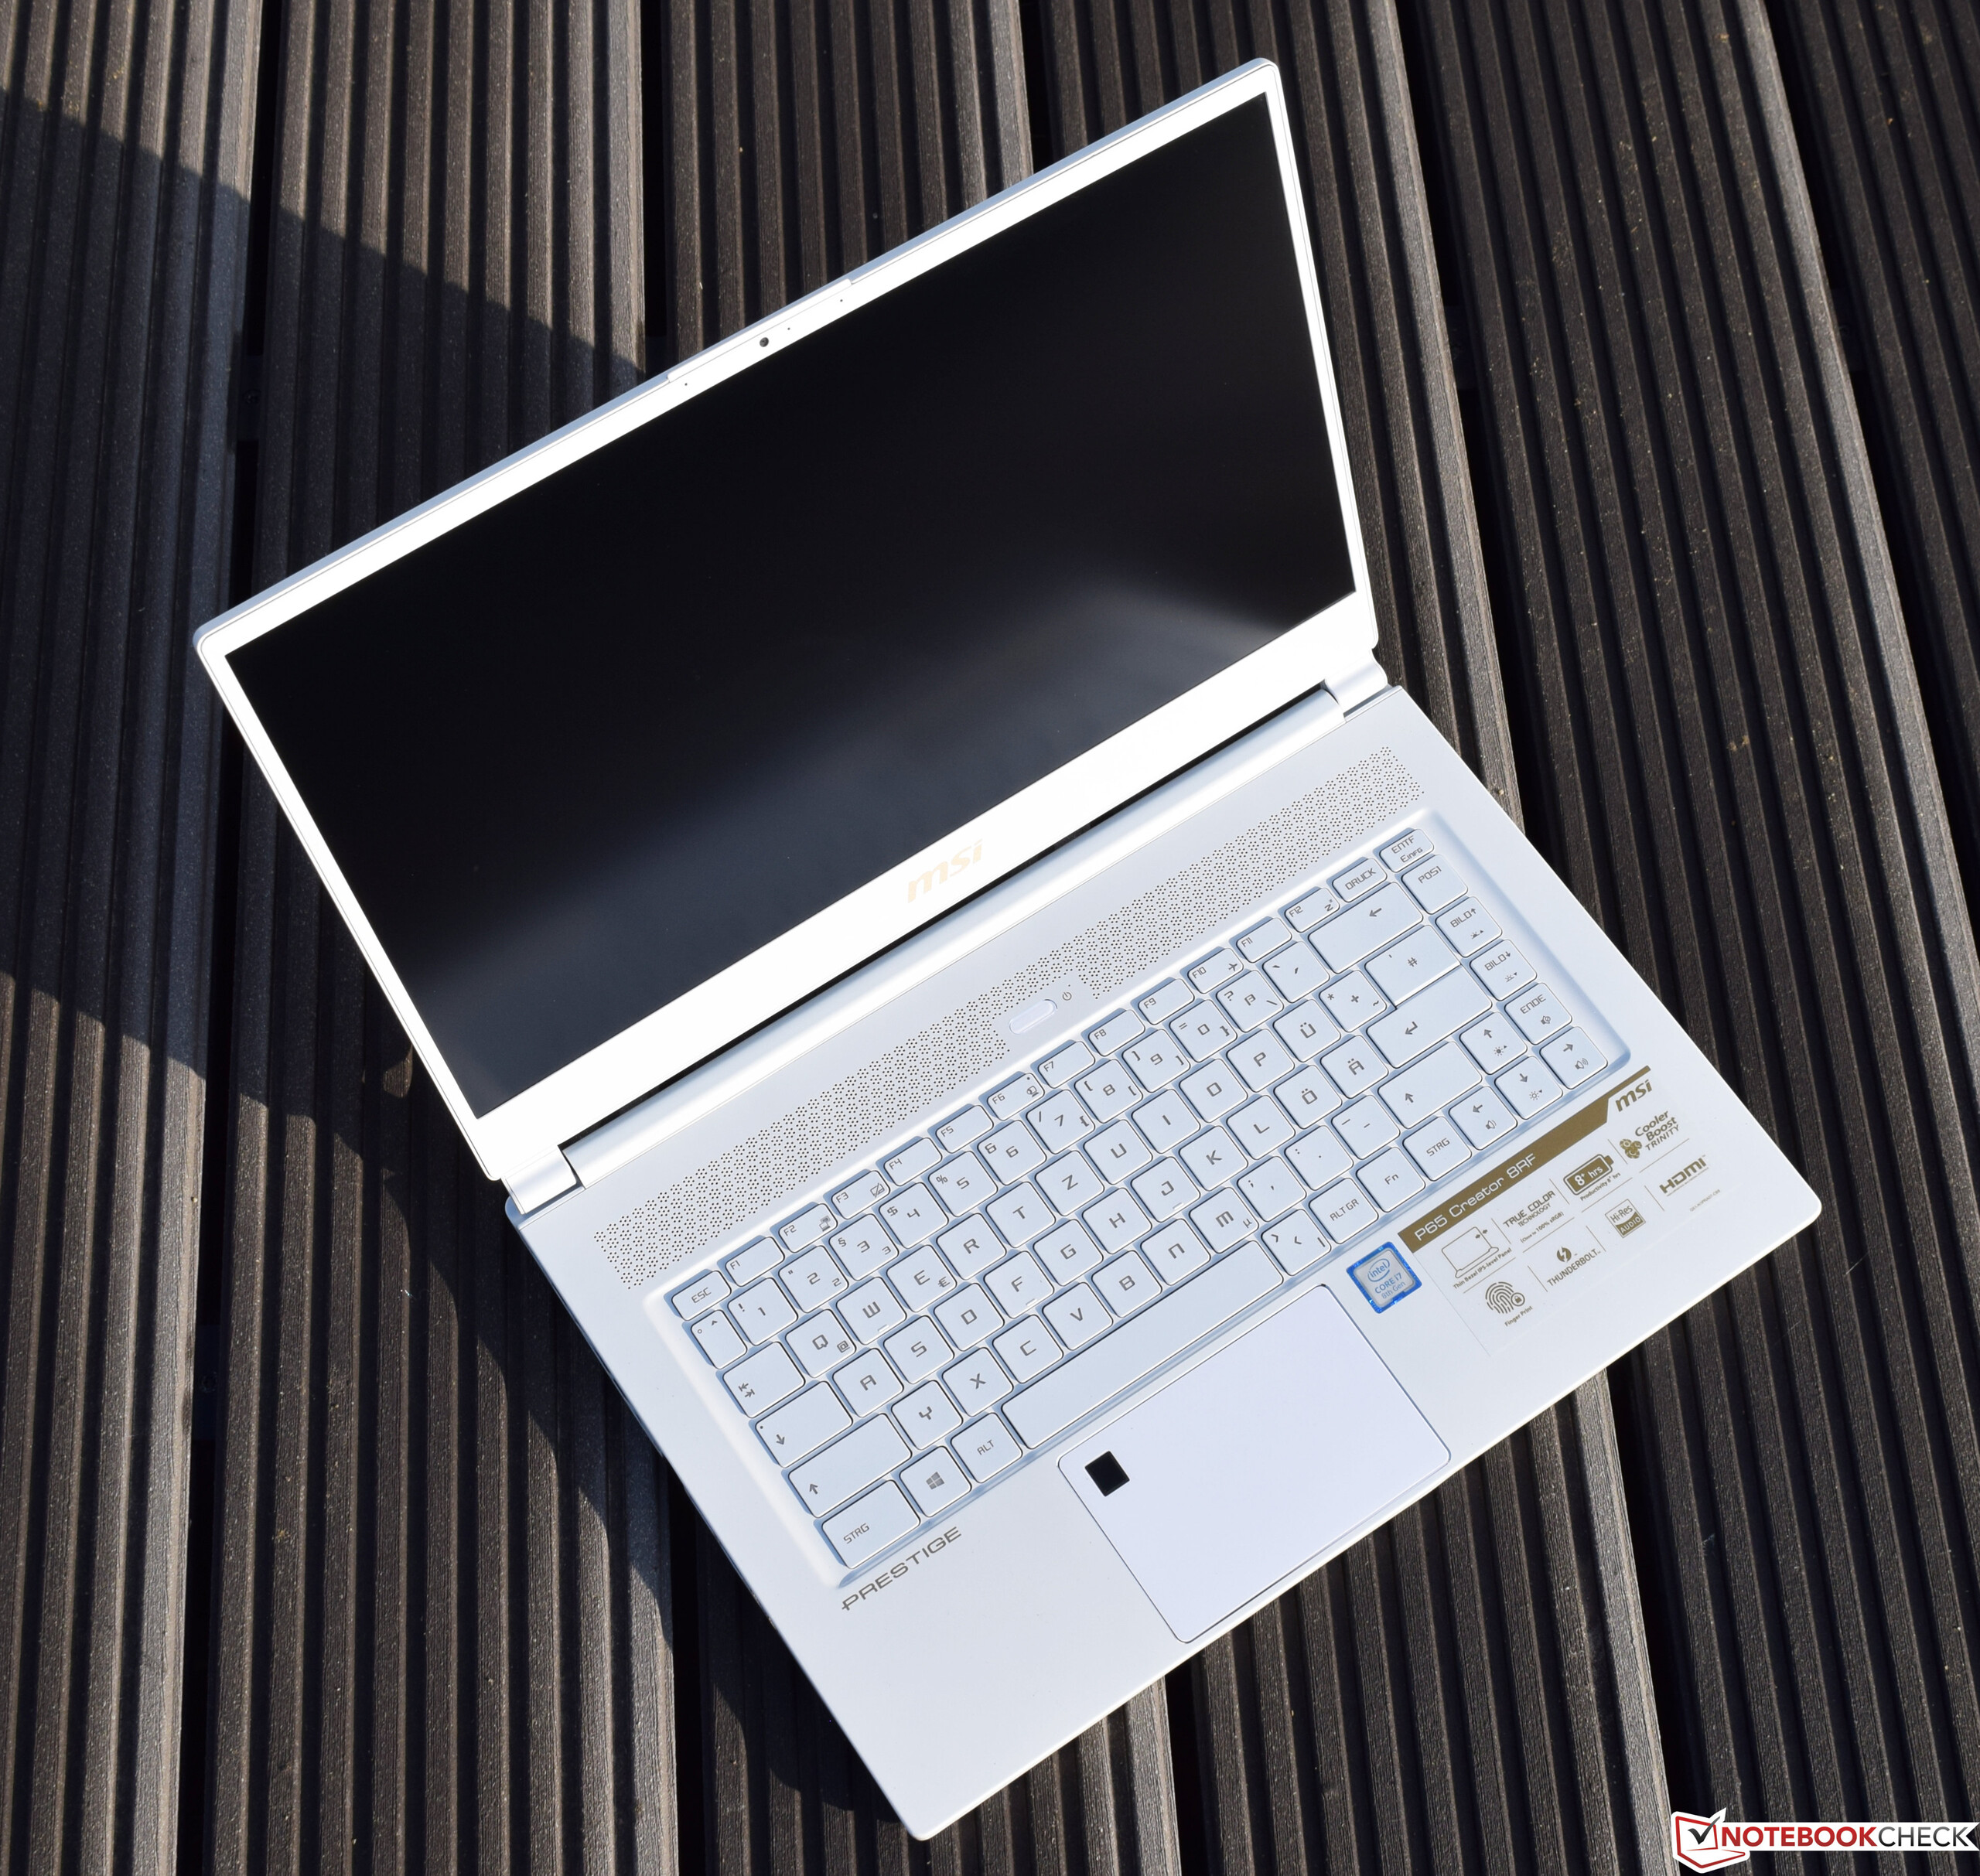
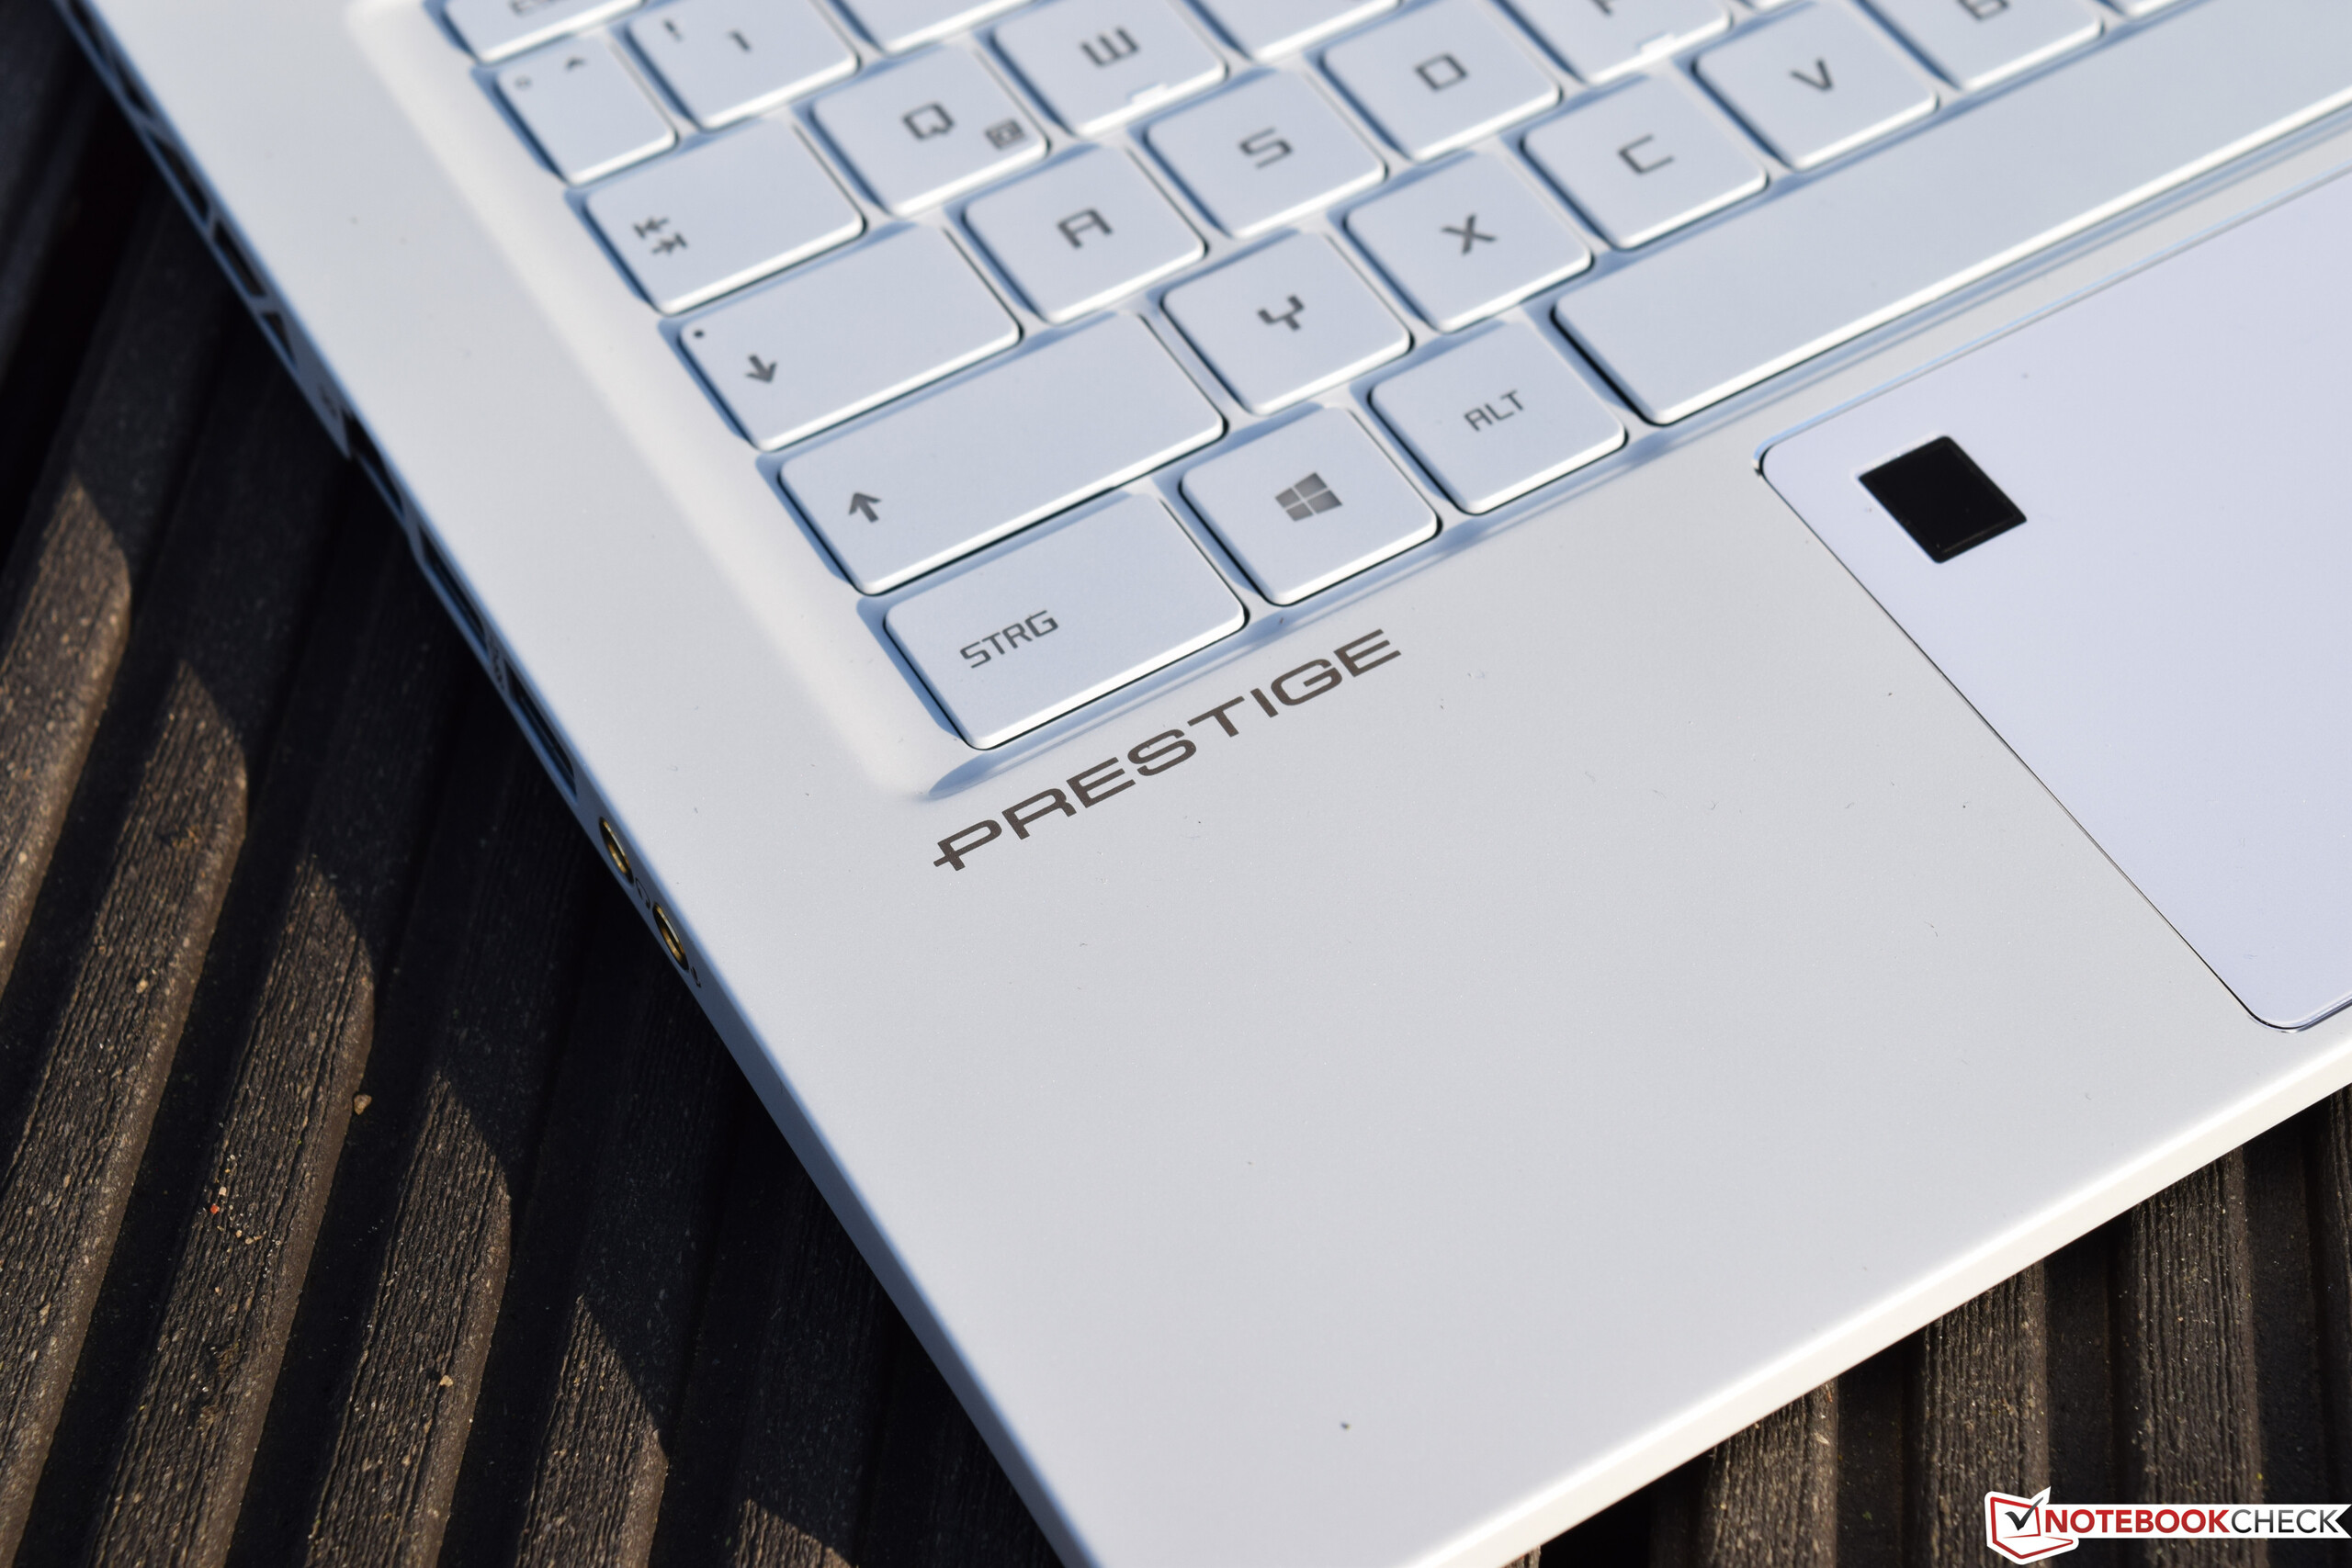
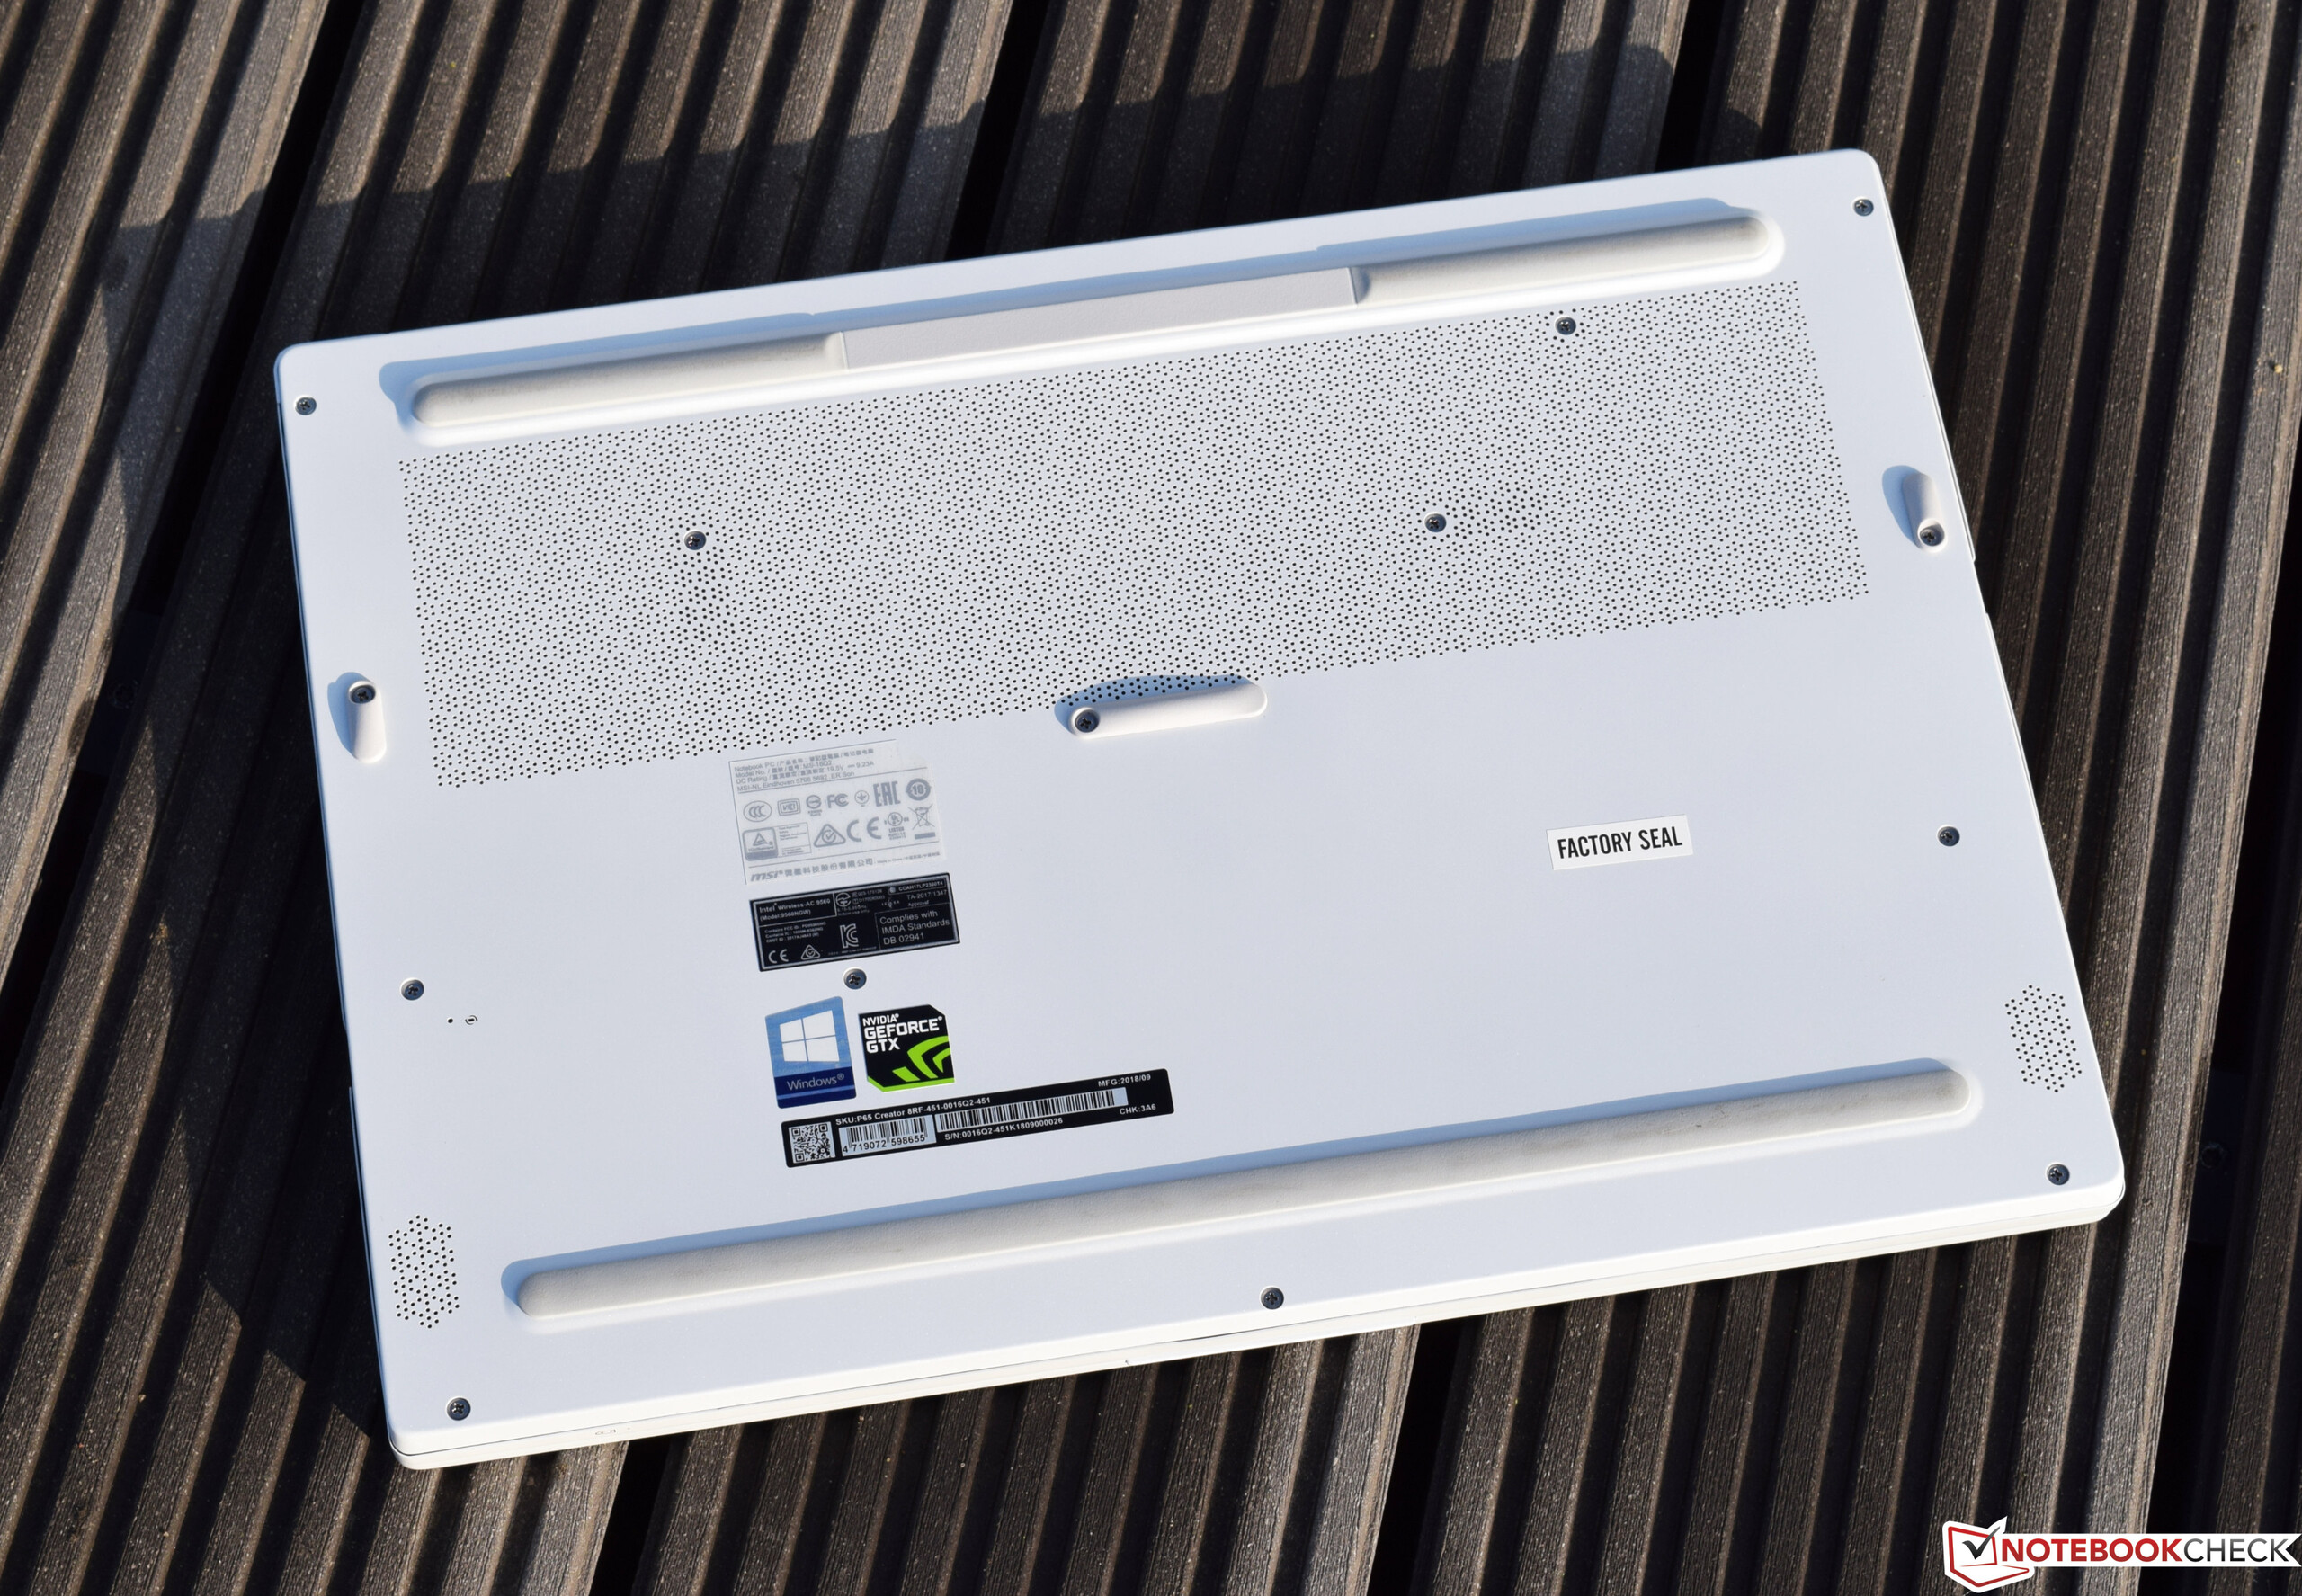
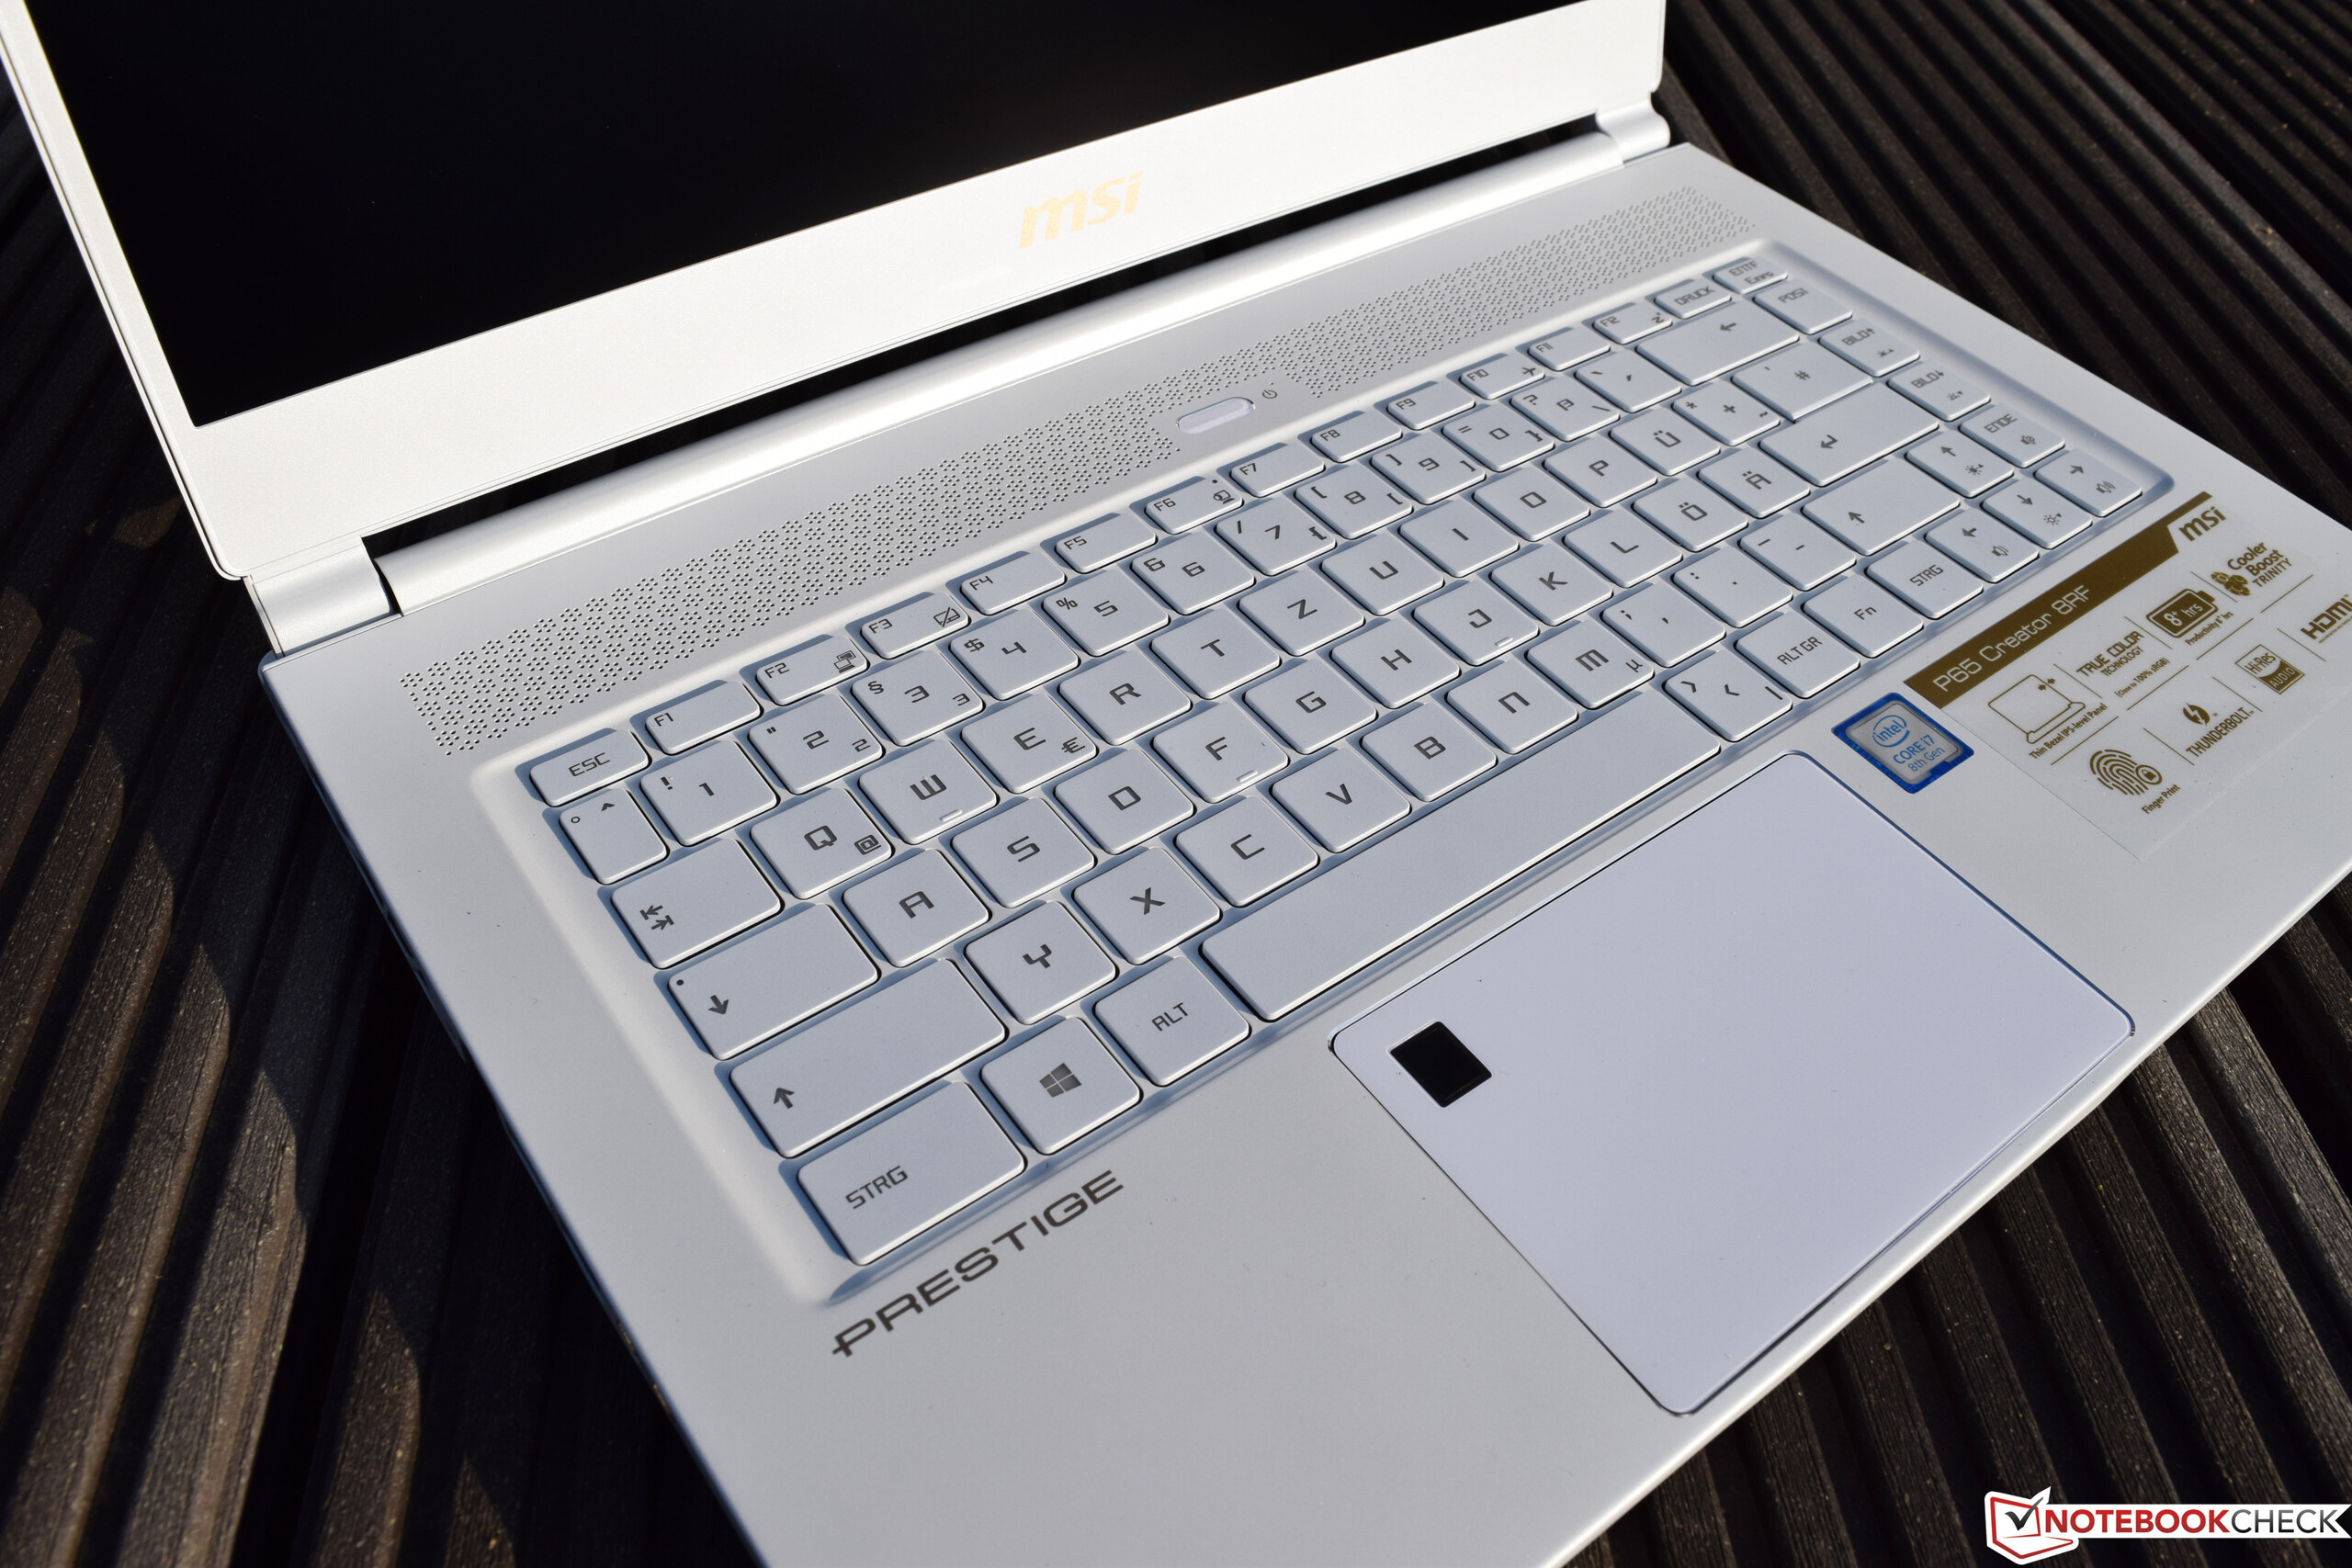
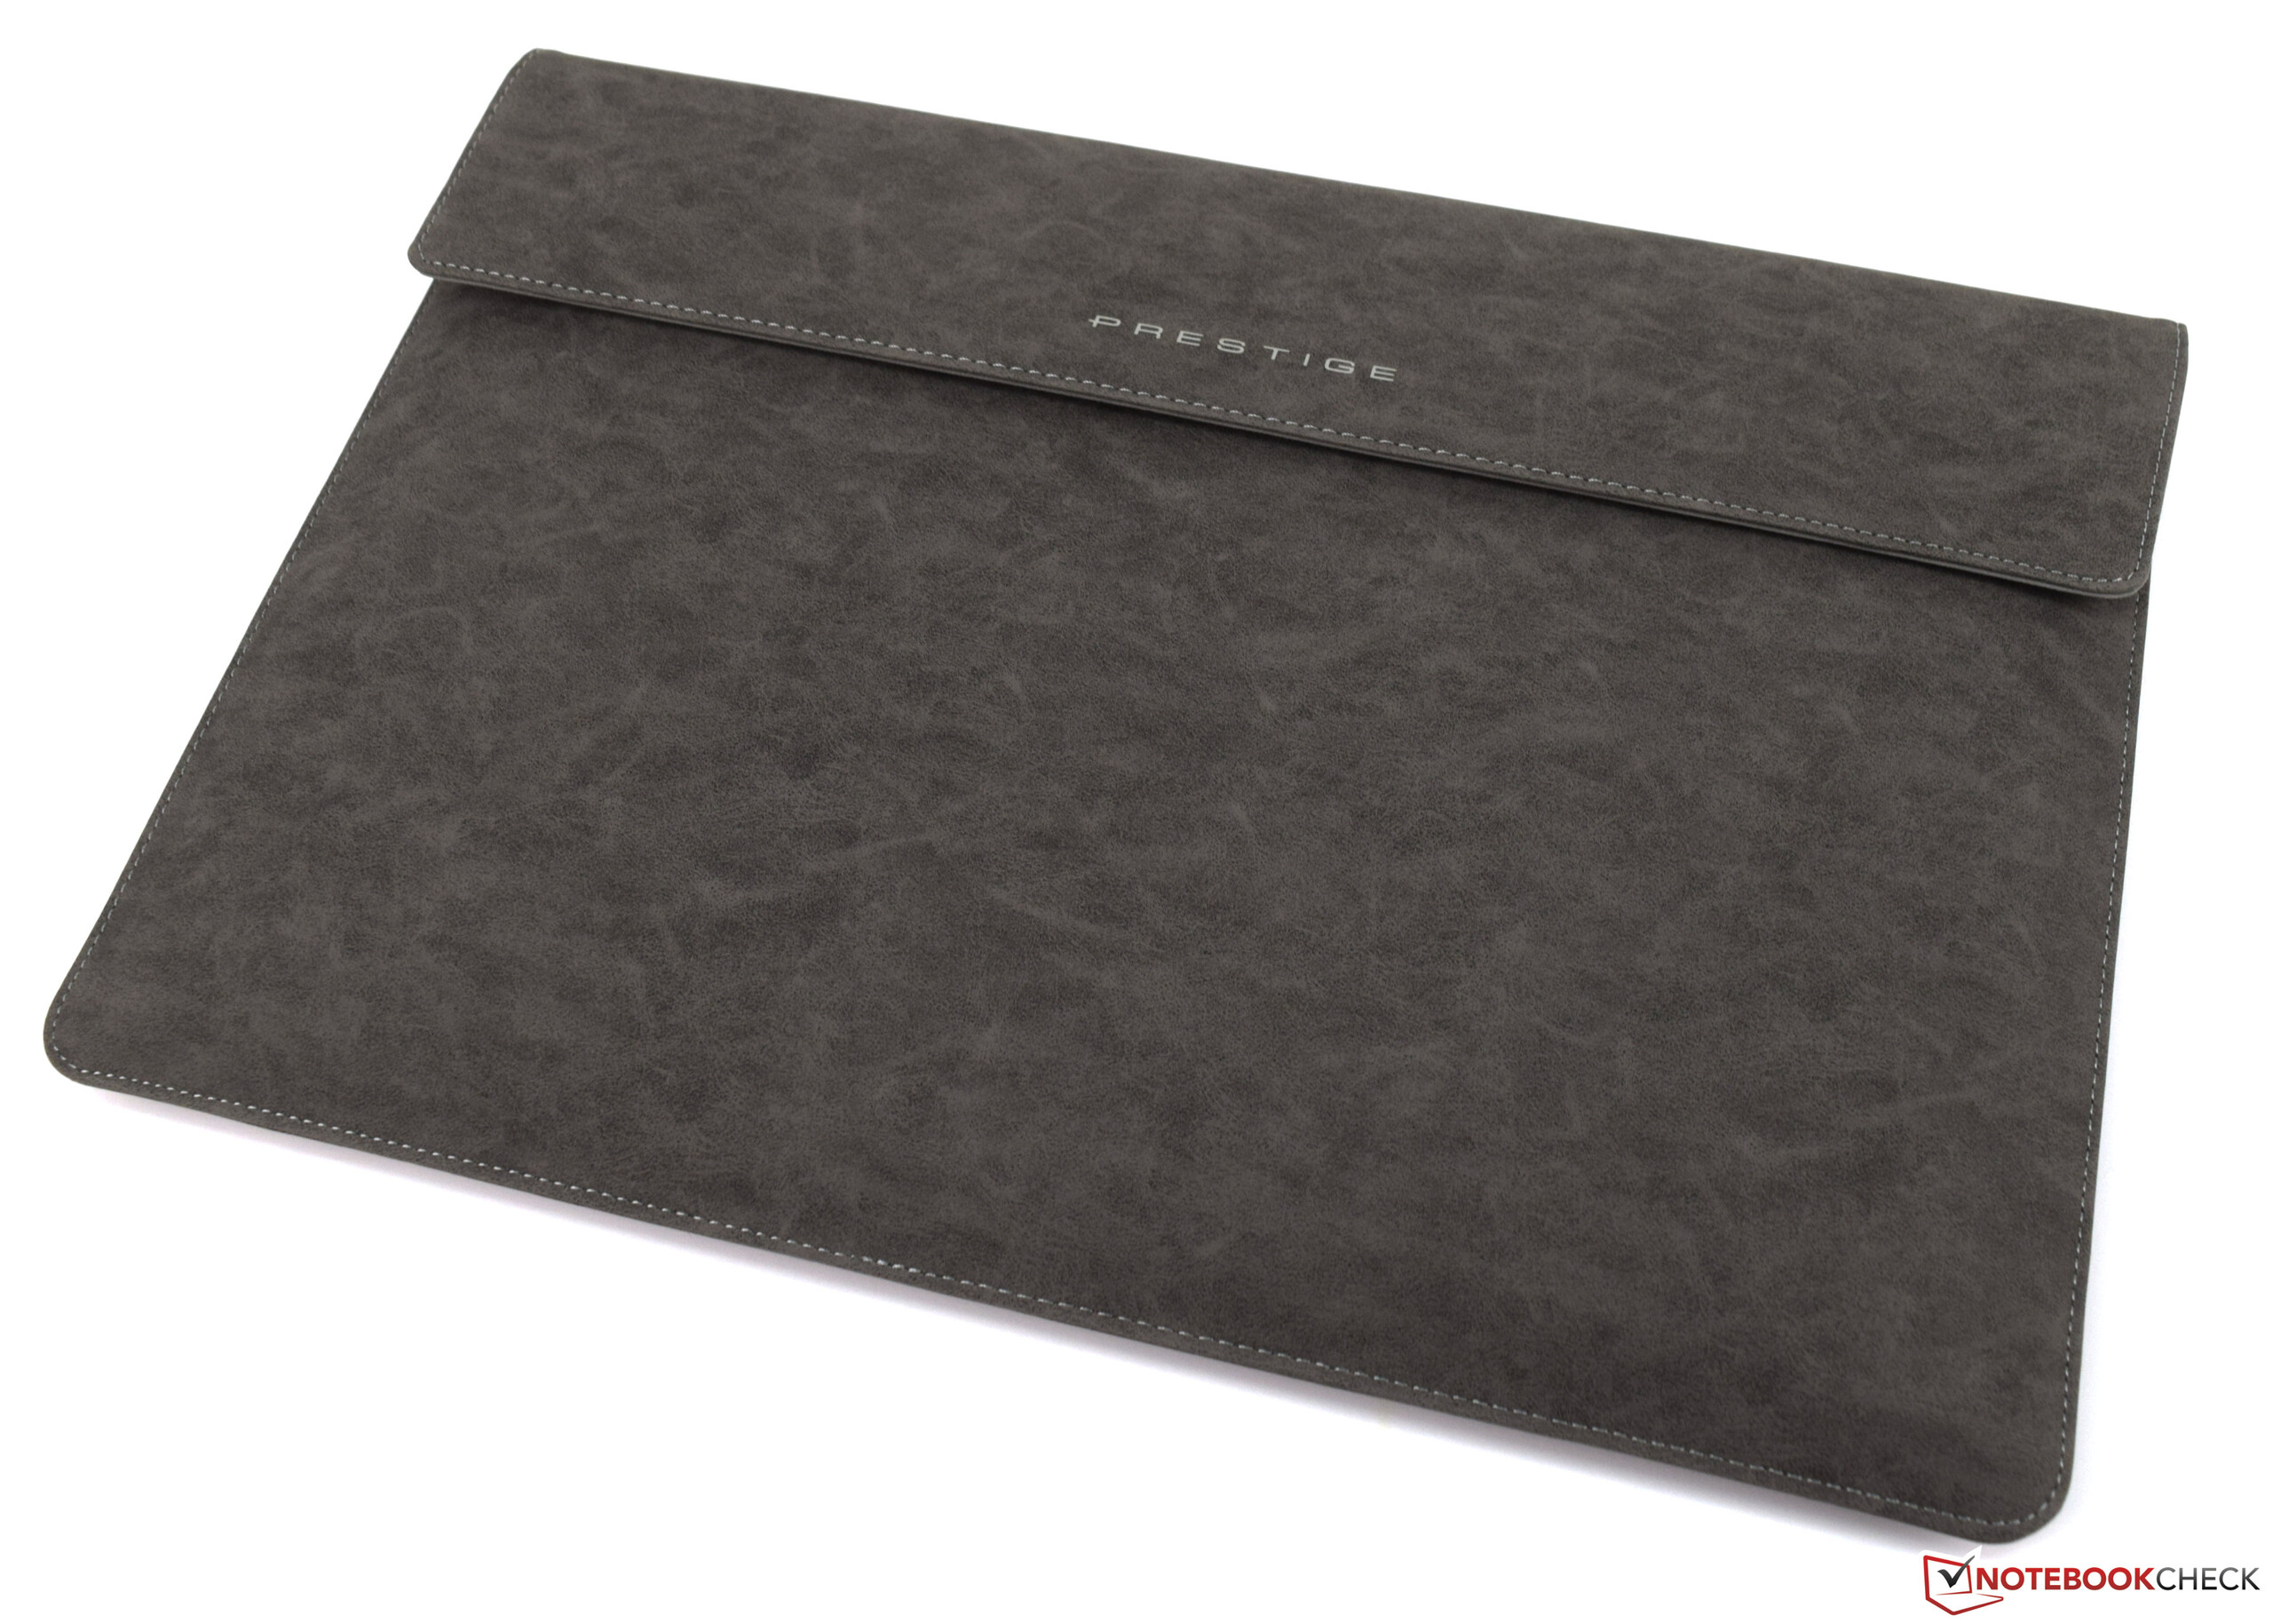
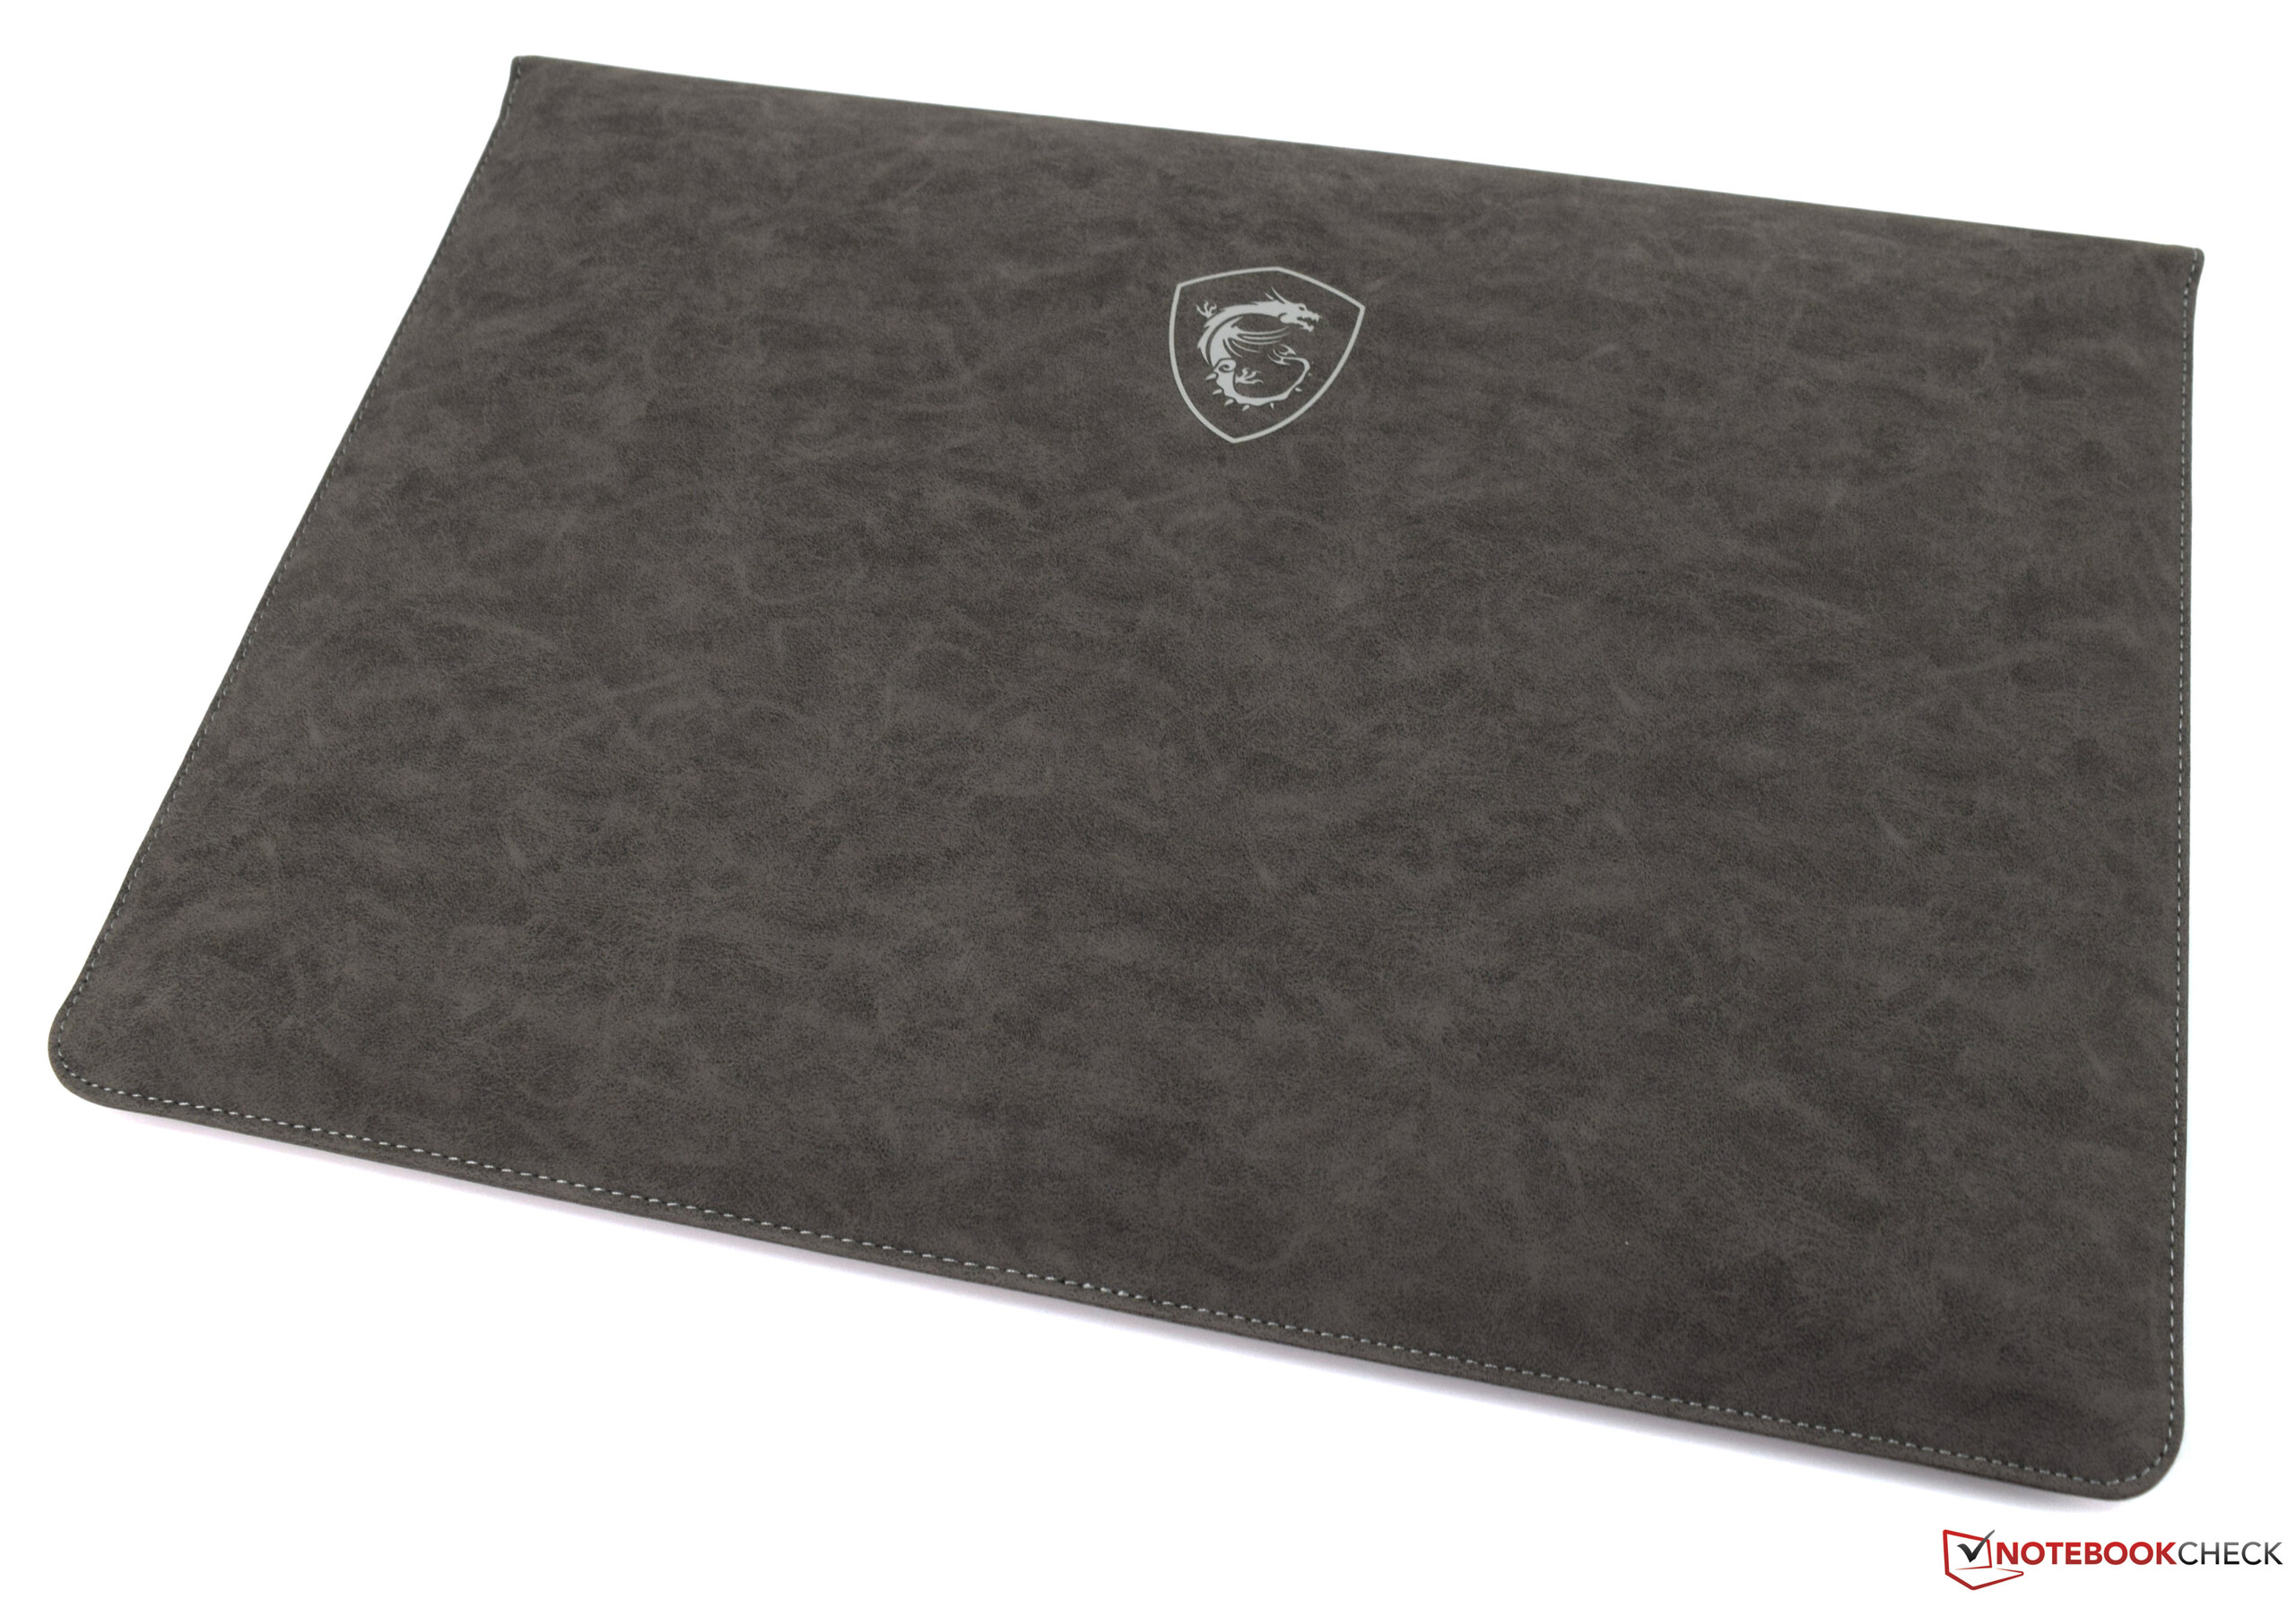
Como o nome já sugere, o P65 8RF Creator da MSI baseia-se no GS65 8RF. No entanto, destina-se principalmente ao público criativo que usa o Adobe Photoshop ou o Adobe Premiere na estrada. A Edição Limitada oferece mais do que apenas sua carcaça branca, como uma GPU potente e uma embalagem de alta qualidade, incluindo uma capa protetora. Além disso, uma extensão de garantia gratuita para um total de 36 meses está disponível mediante o registro do produto com a MSI.
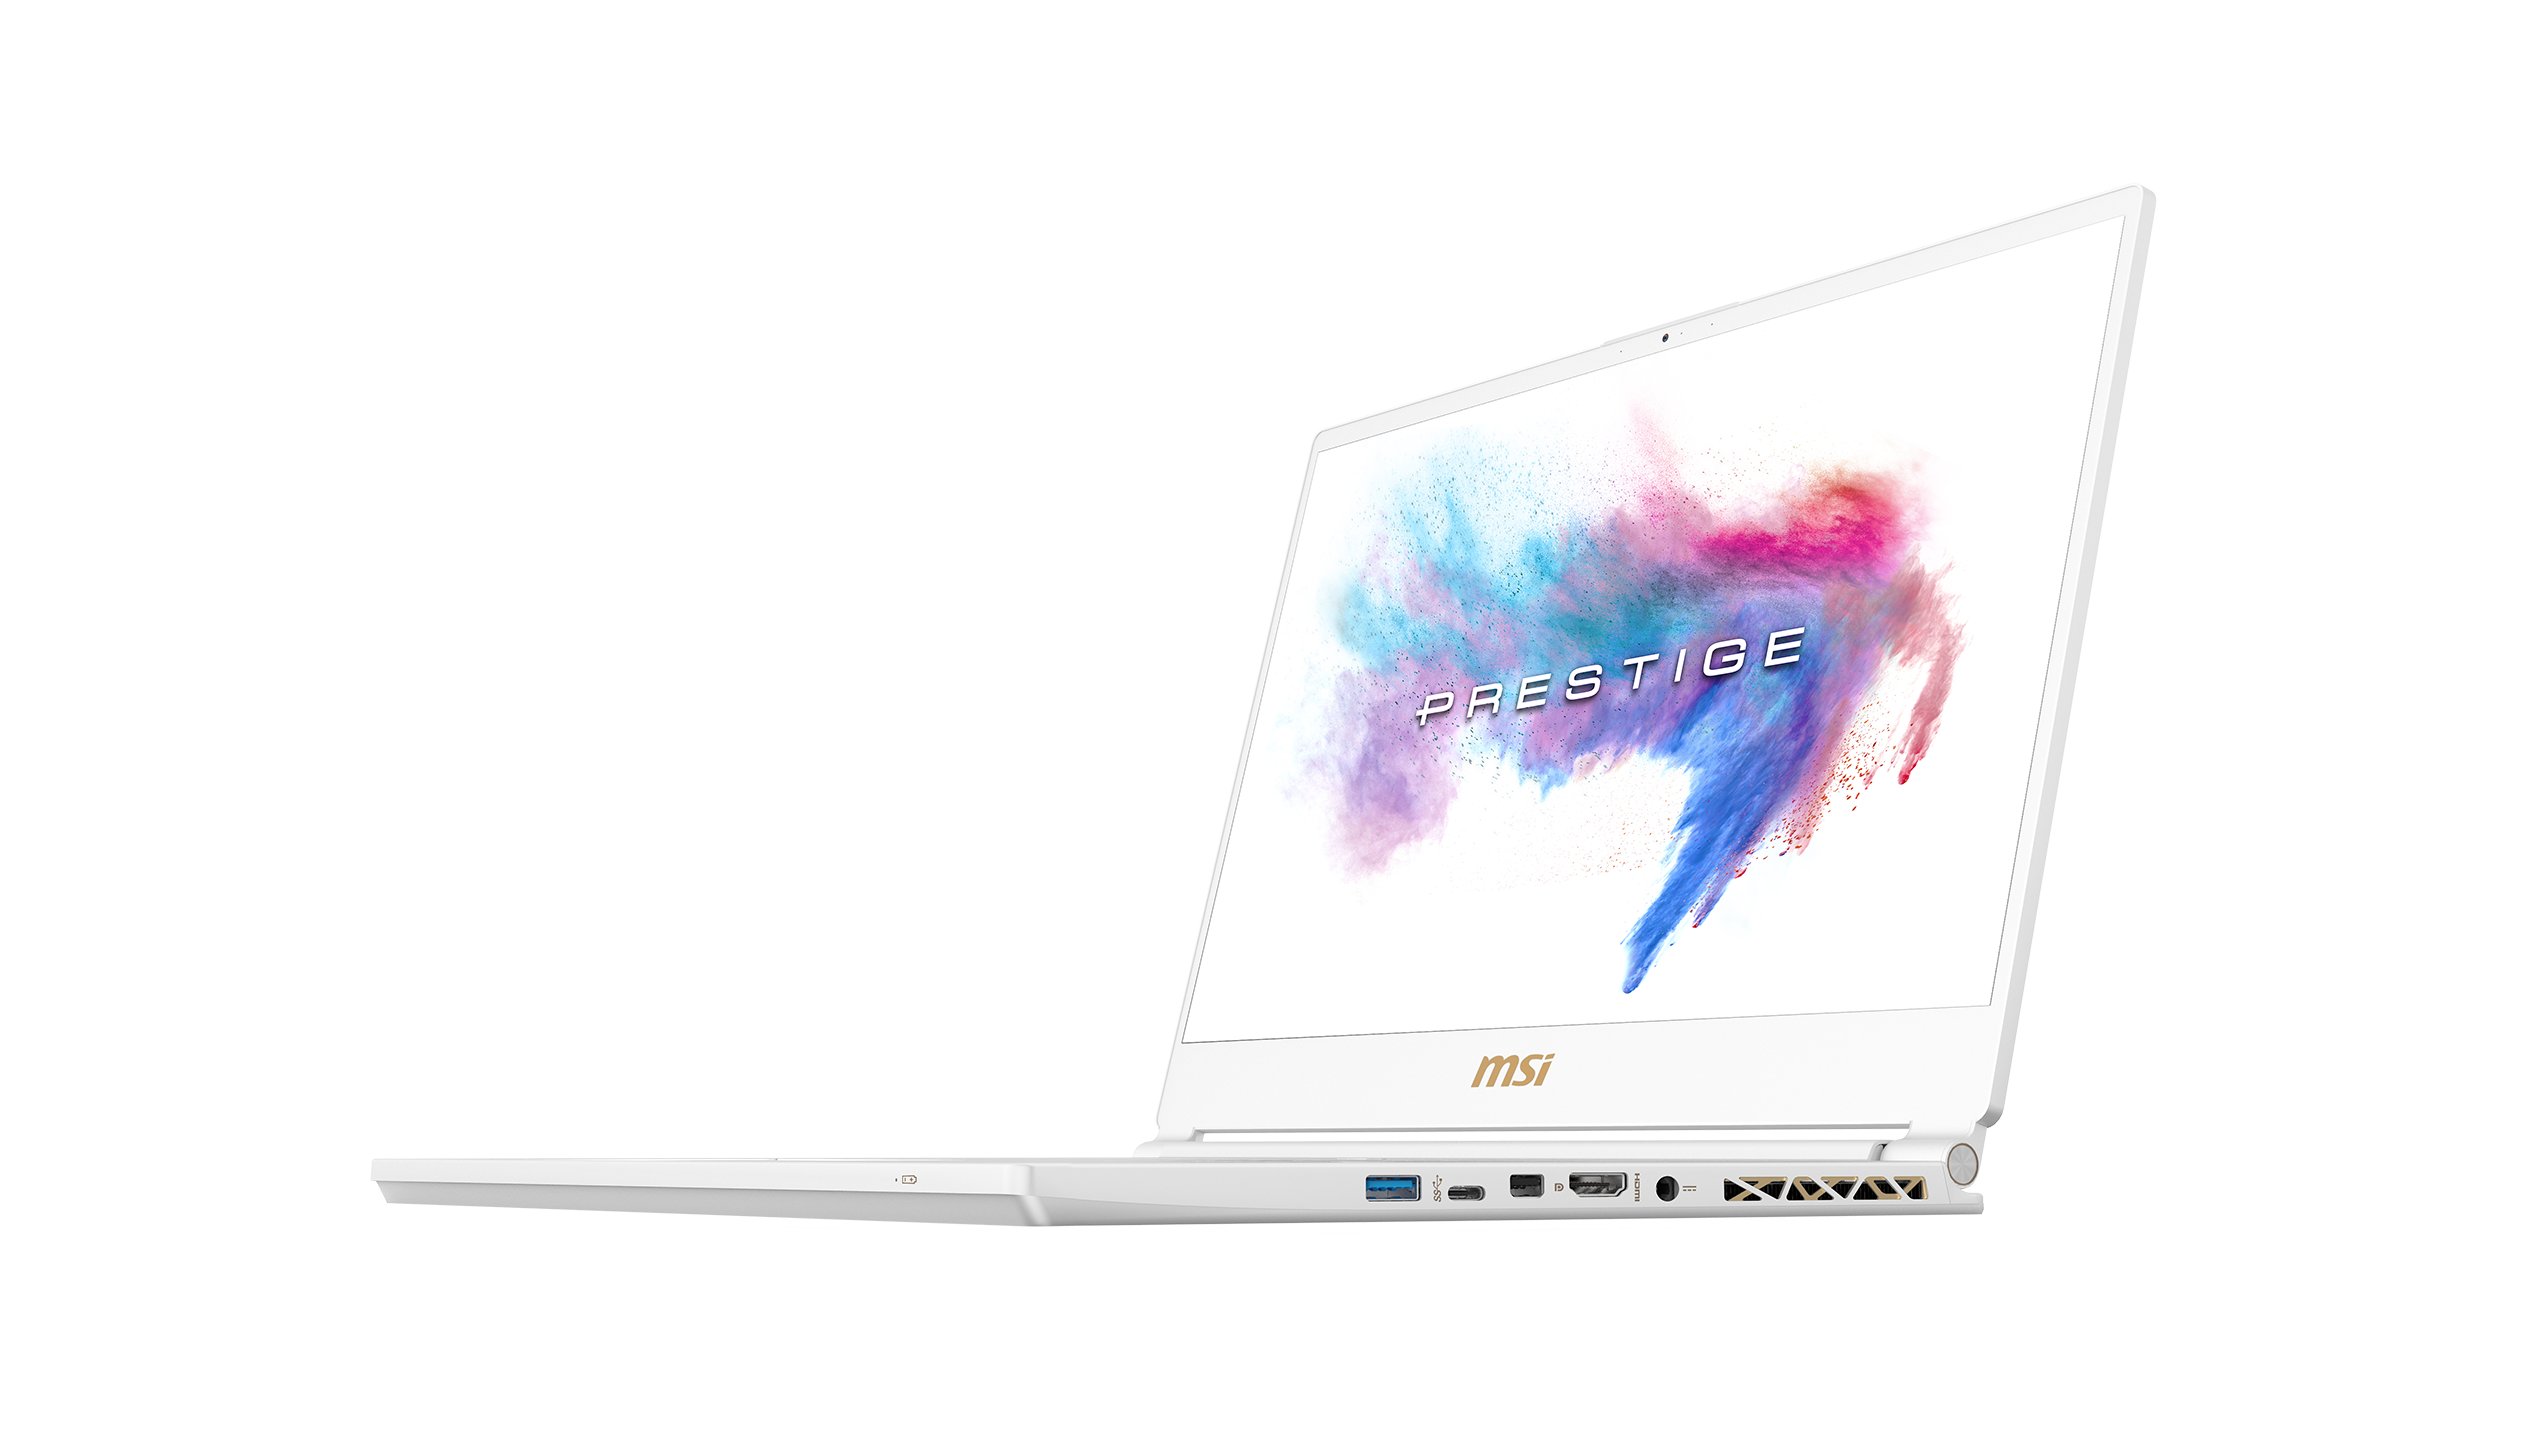
A questão é: para quem este dispositivo foi feito? Se você estiver procurando por um dispositivo estiloso e pouco comum, o P65 8RF pode ser o portátil certo para você. Ele oferece um ótimo visual durante as apresentações sem sacrificar o desempenho dos jogos, e sua falta de detalhes gamers resultam em uma aparência muito séria. É aqui que o P65 8RF realmente brilha.
O MSI P65 8RF é como ter seu bolo e comê-lo também. Durante o dia, ele desempenha seu papel como um dispositivo empresarial comum. À noite, ele pode ser usado para rodar até mesmo os últimos jogos, sem problemas, em 1080p, com detalhes máximos.
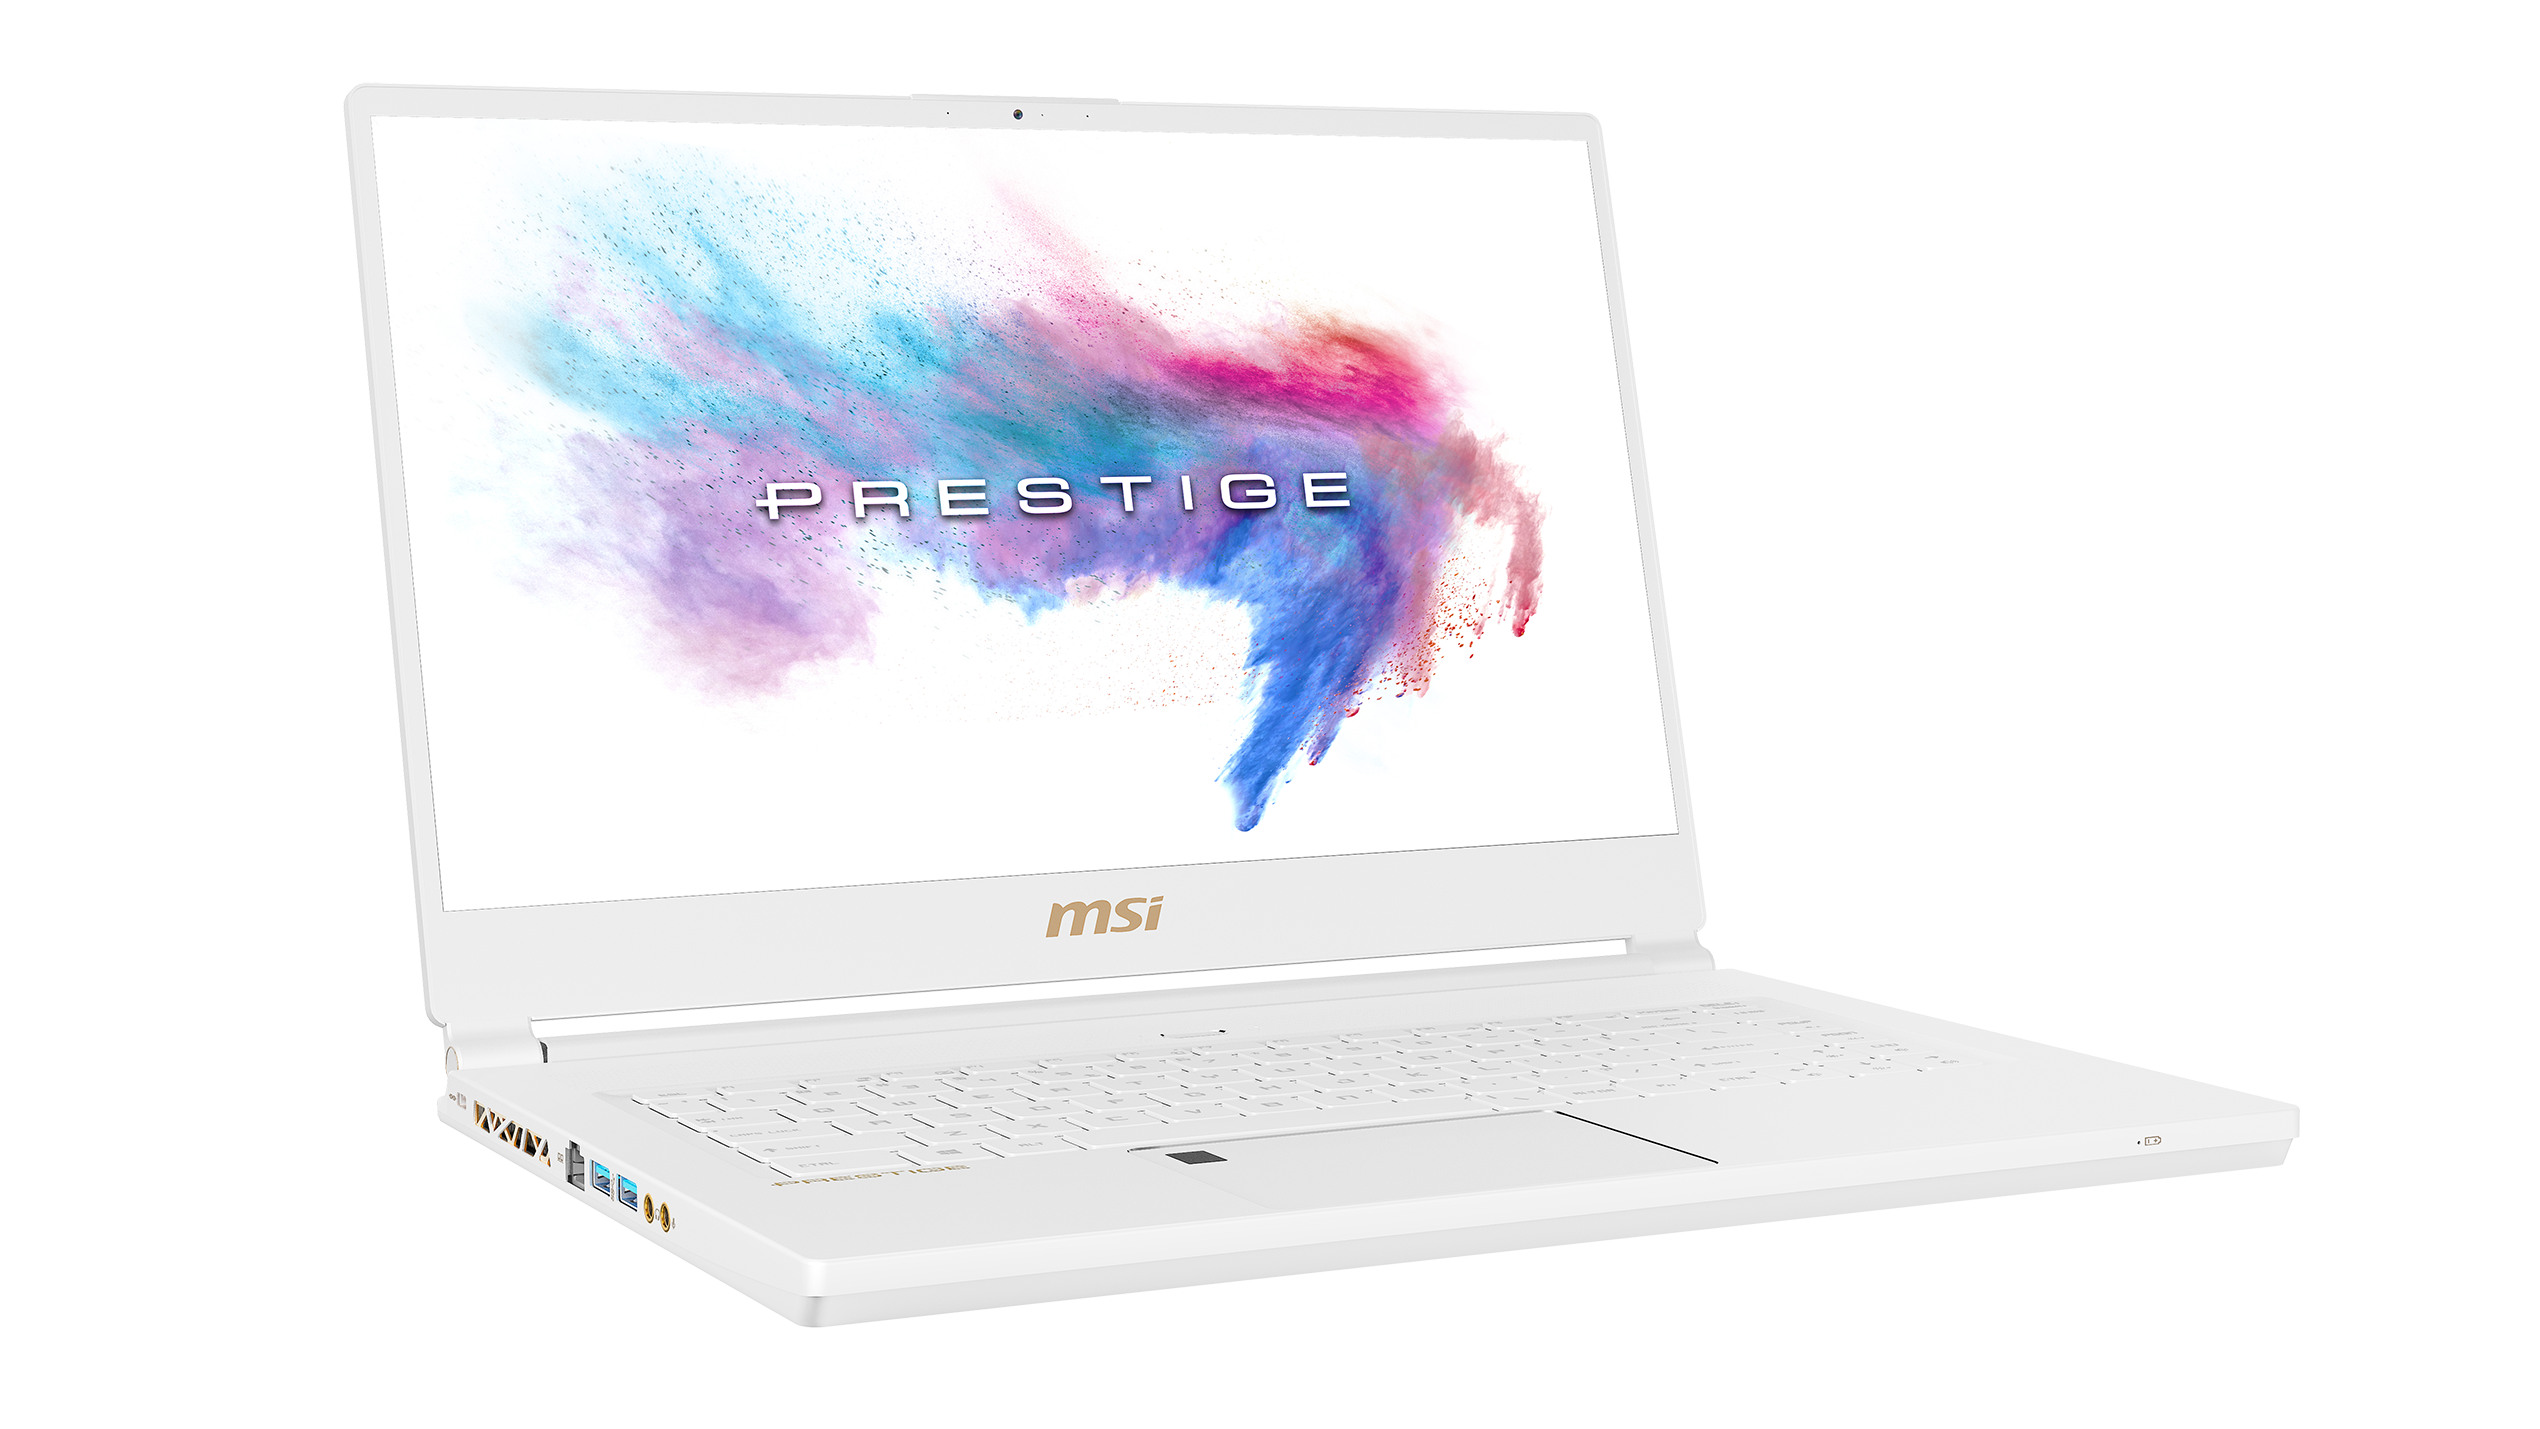
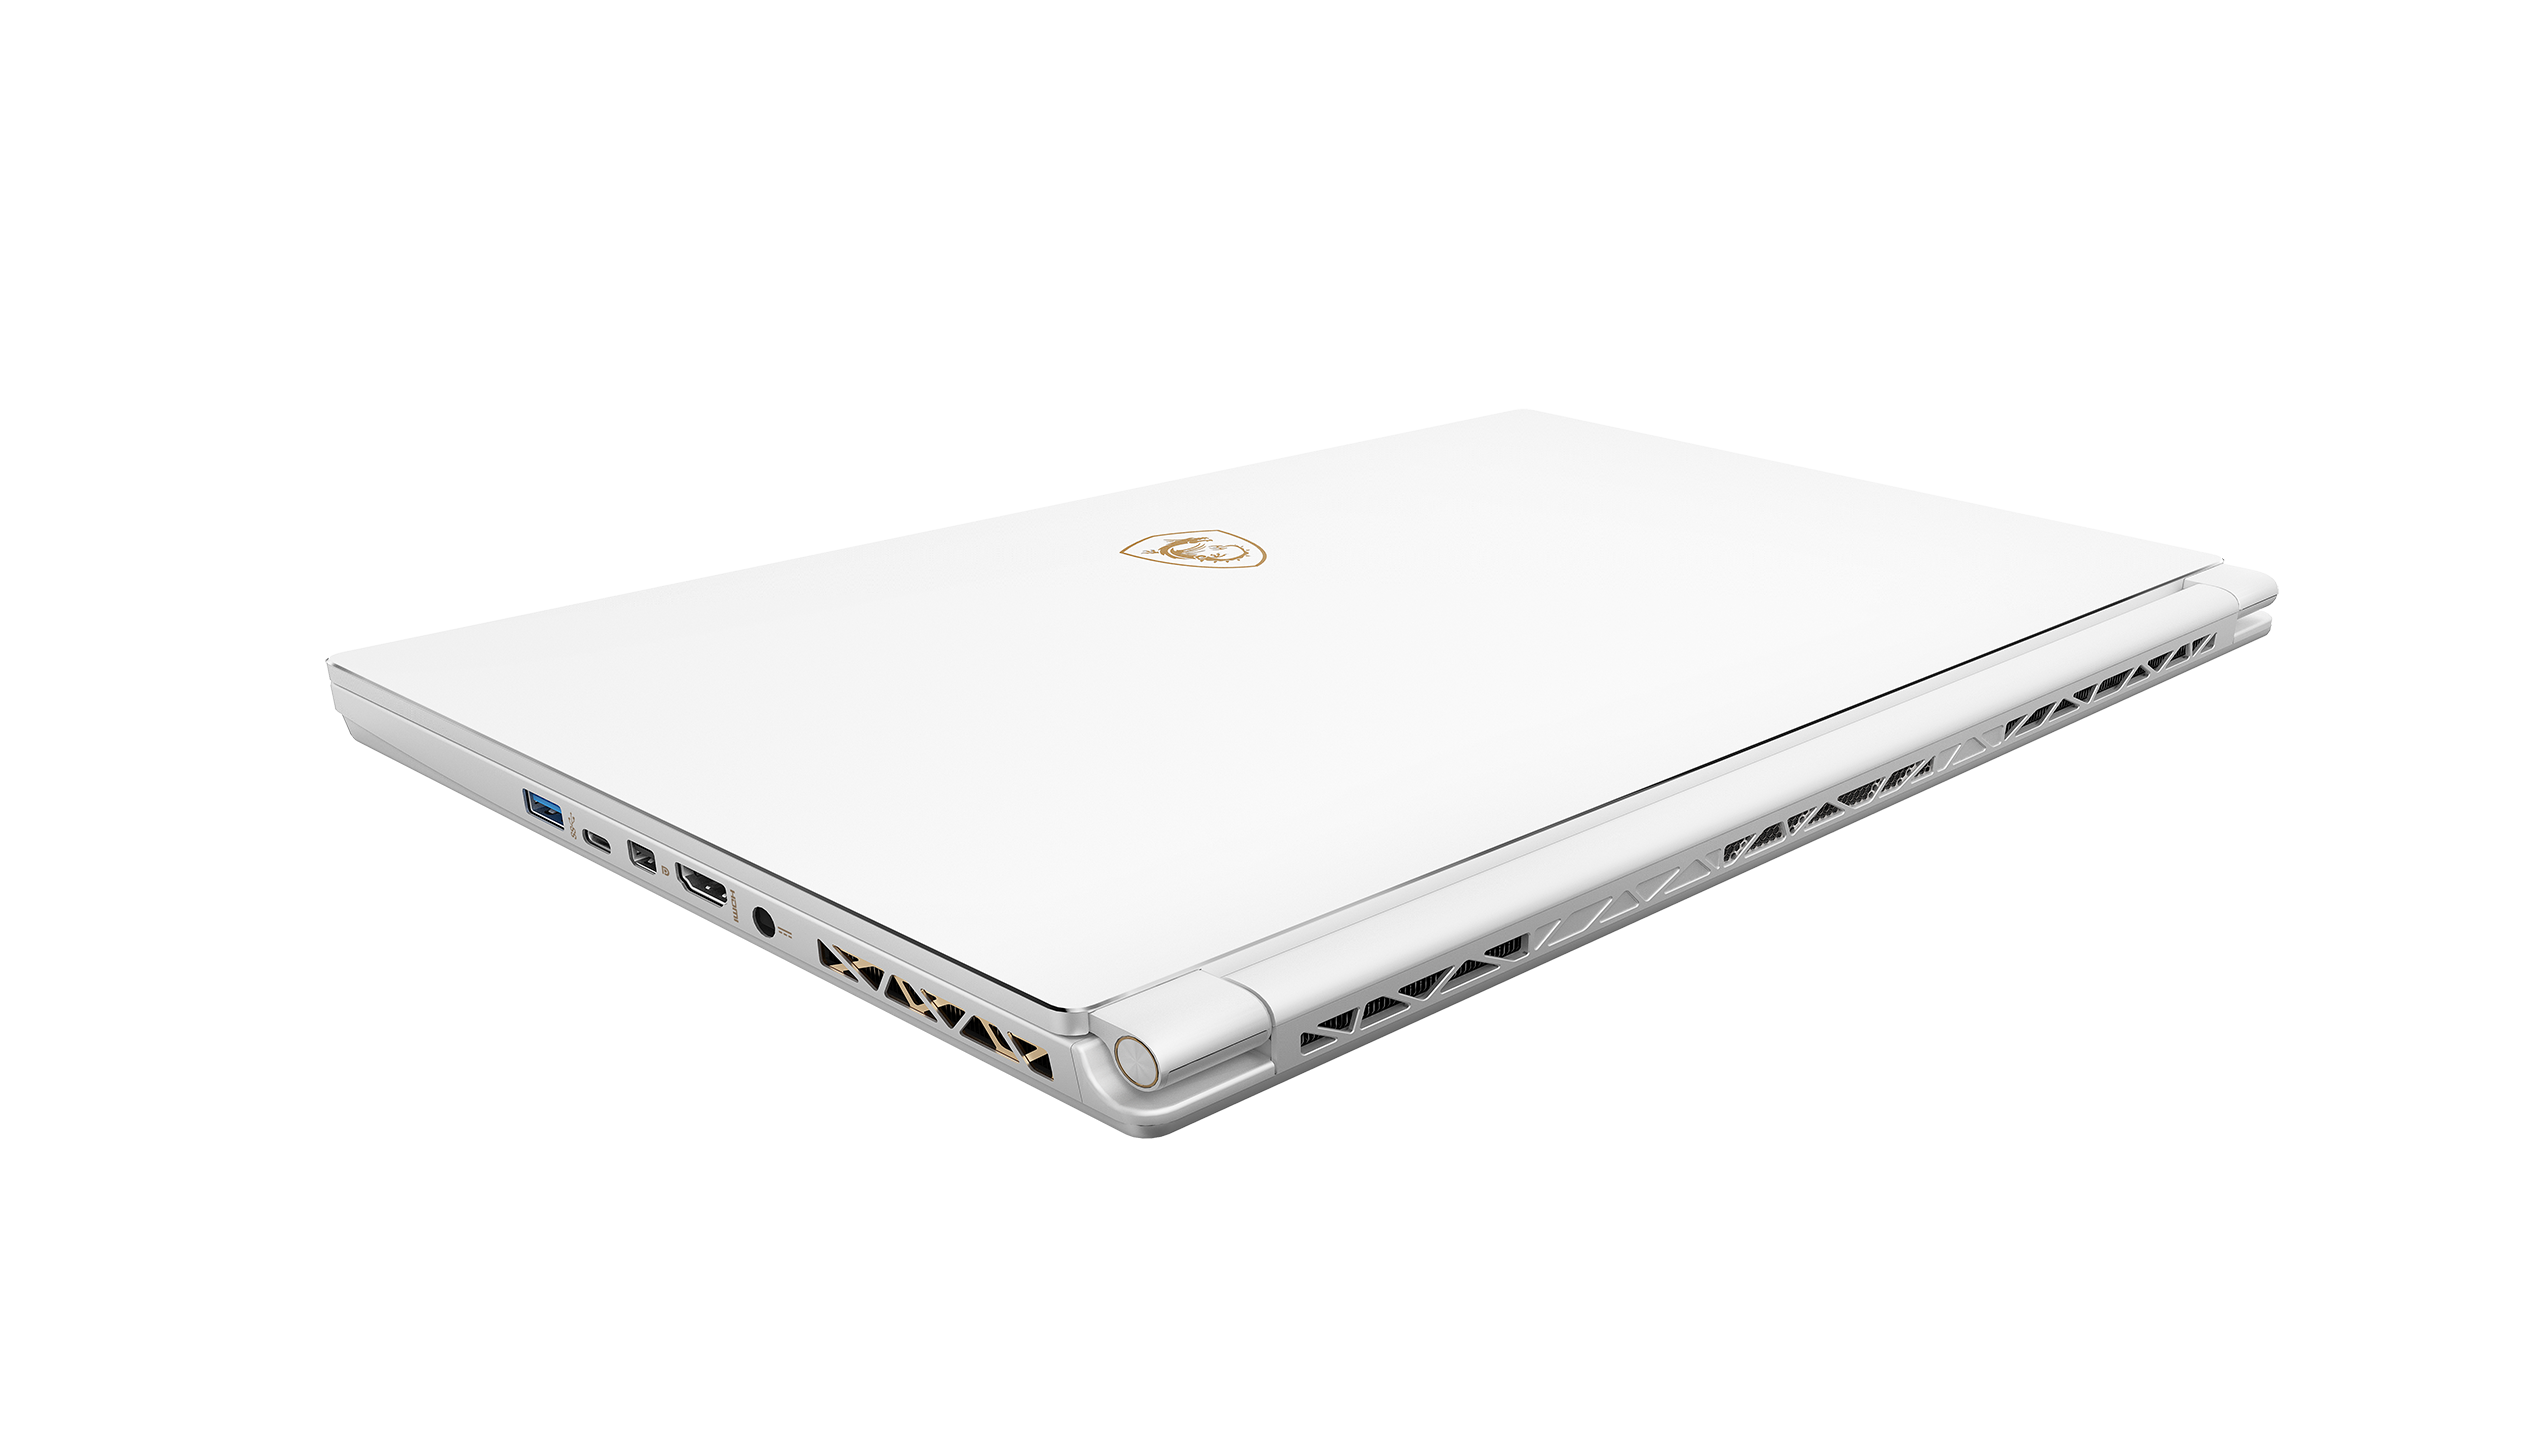
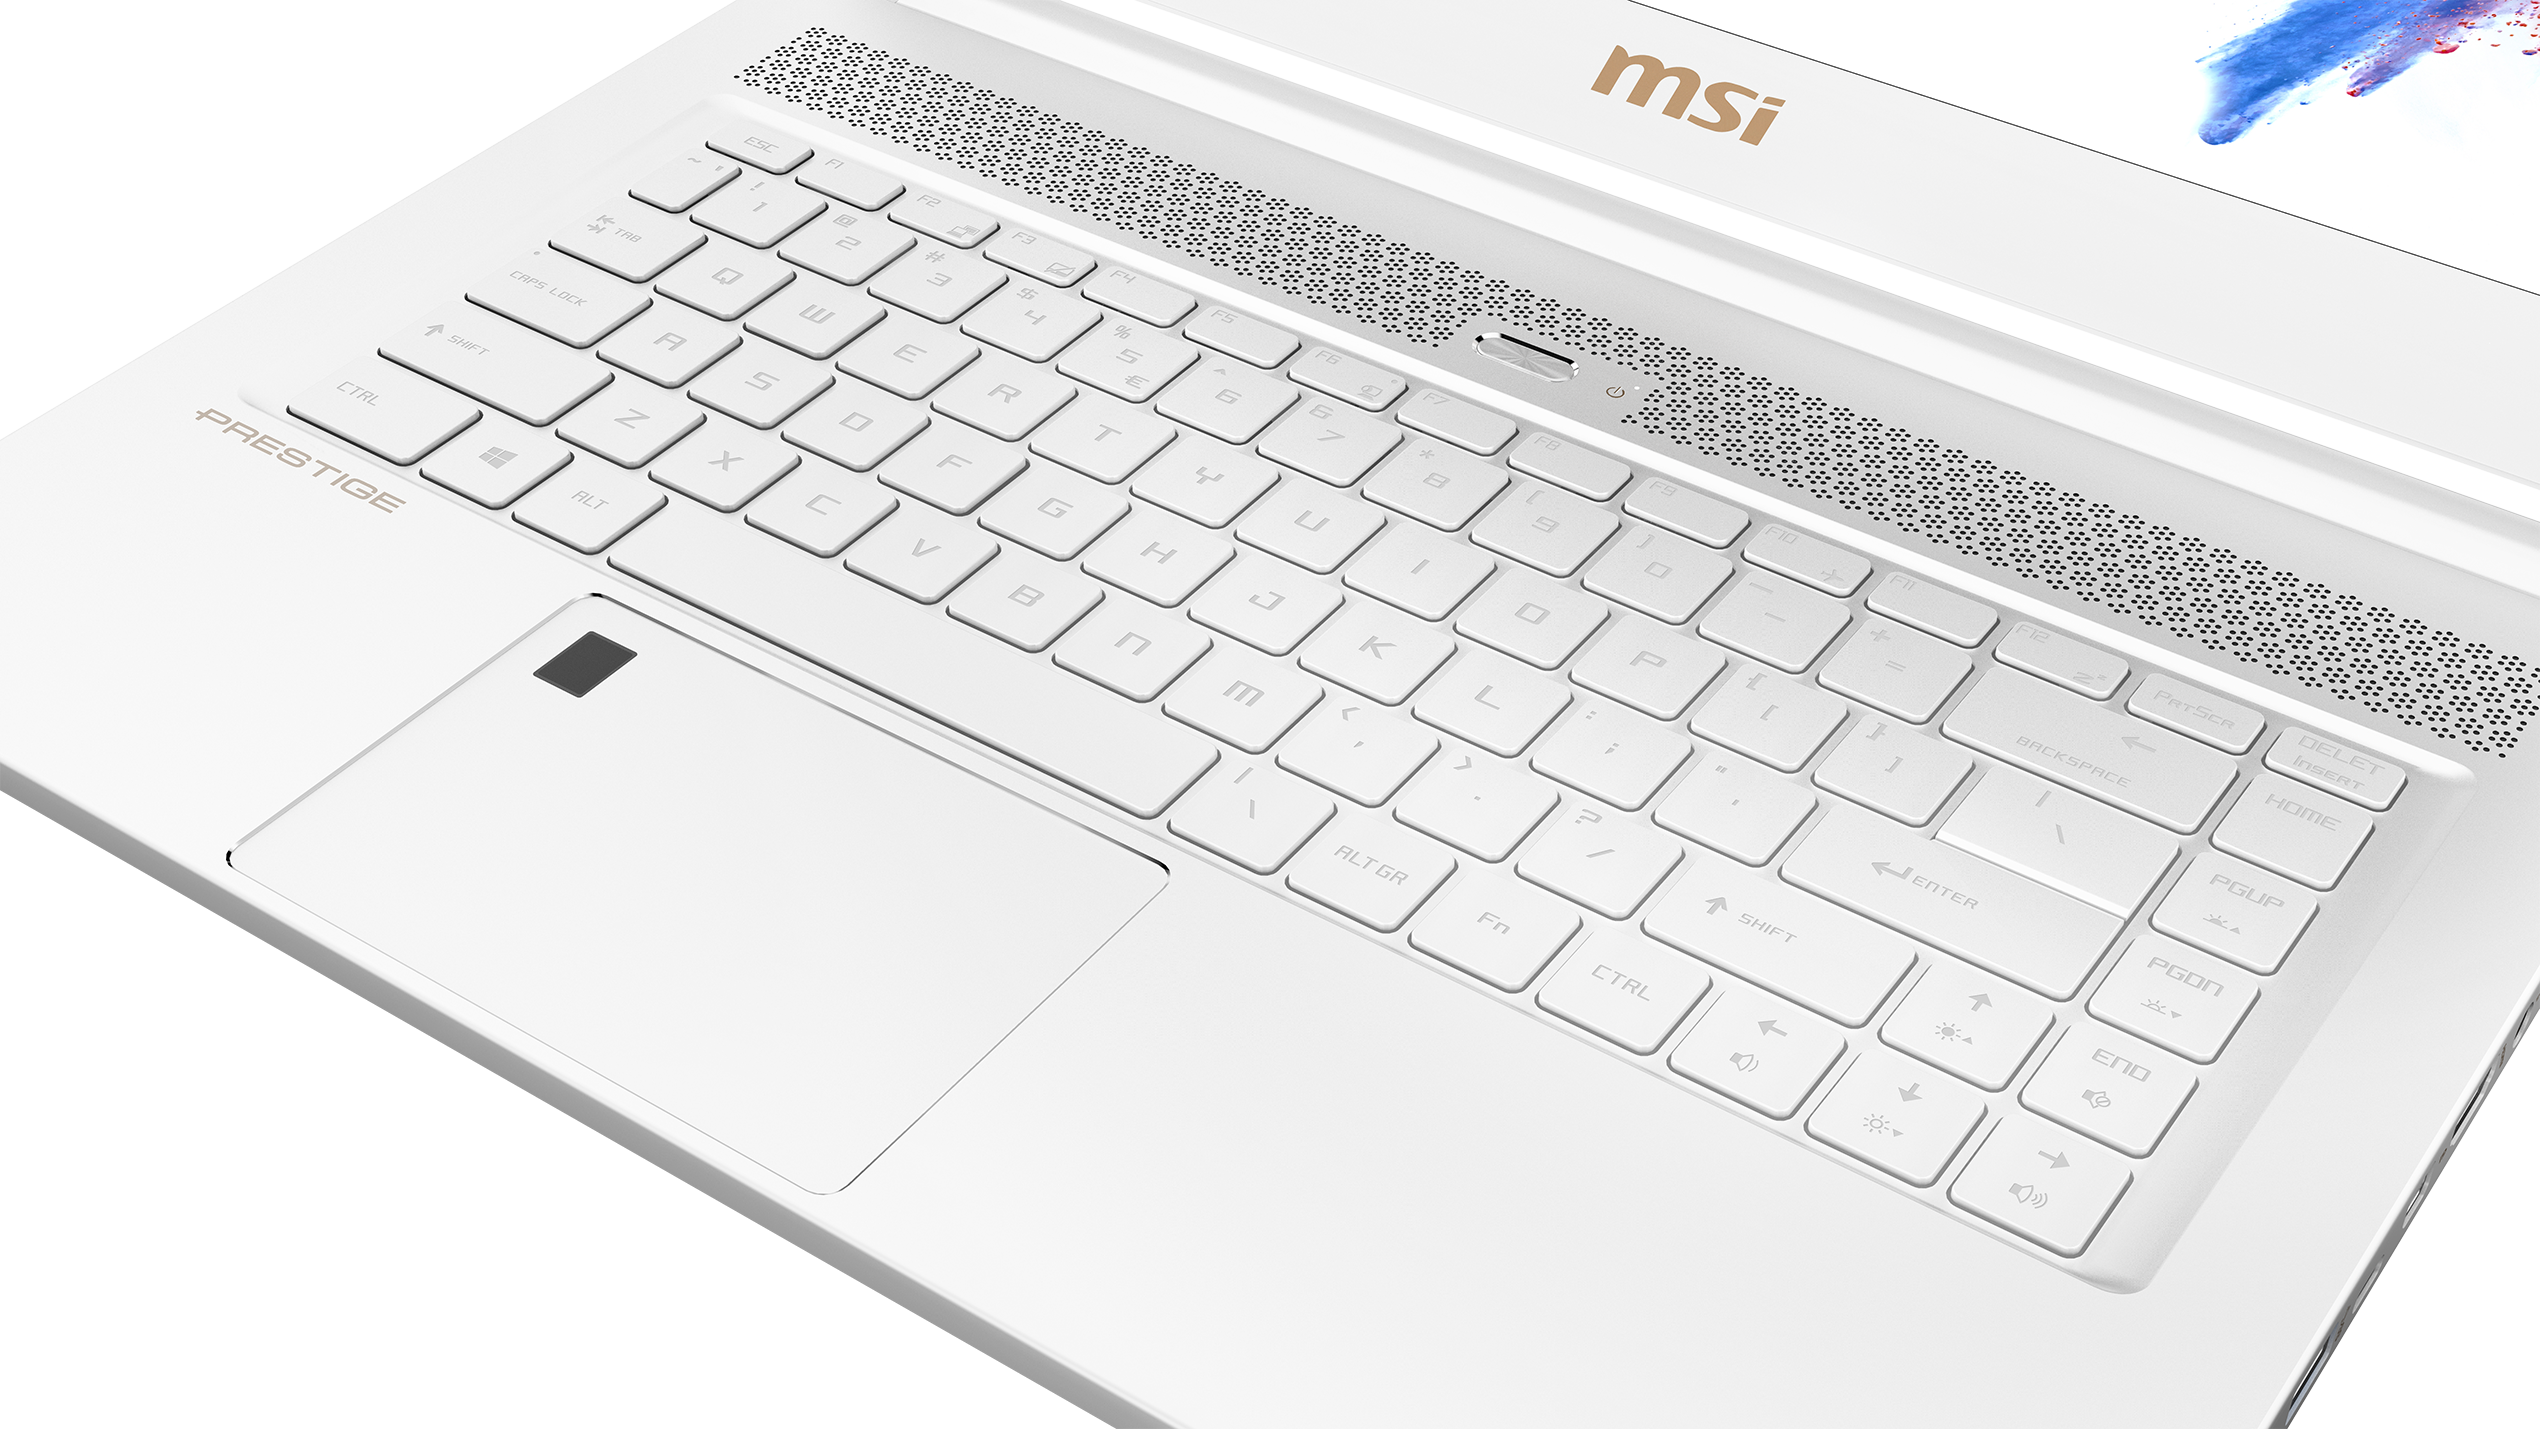
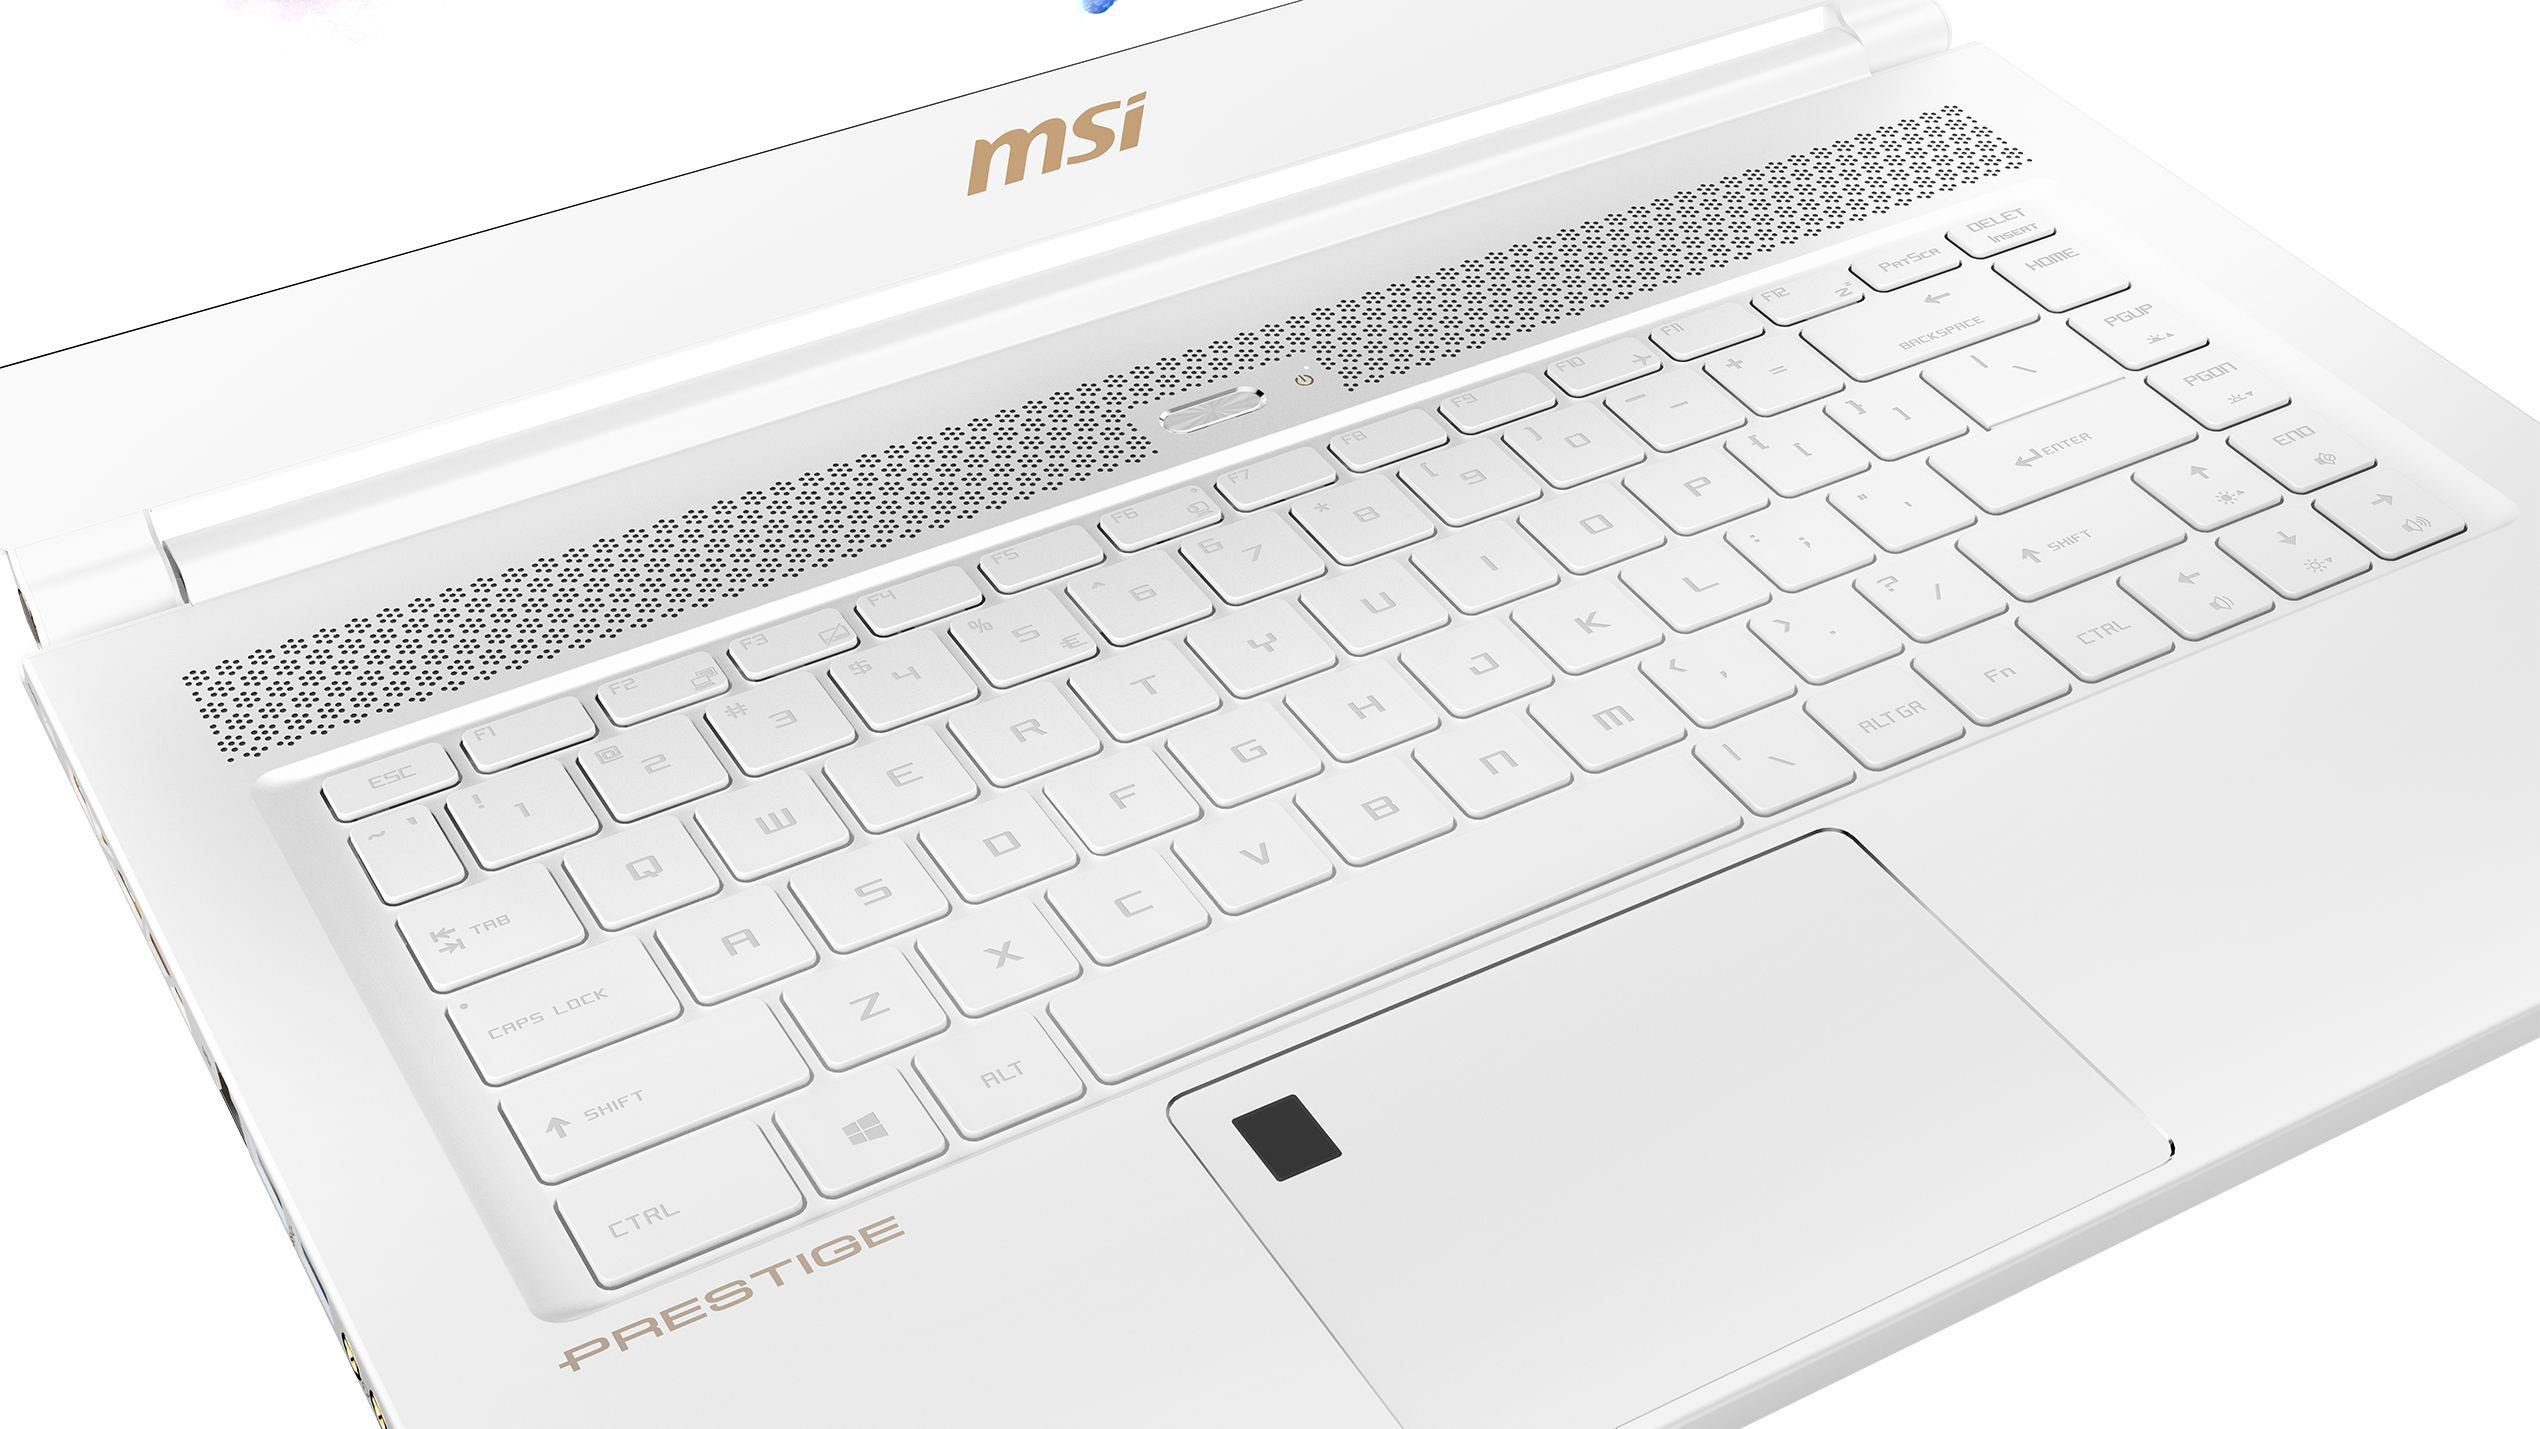
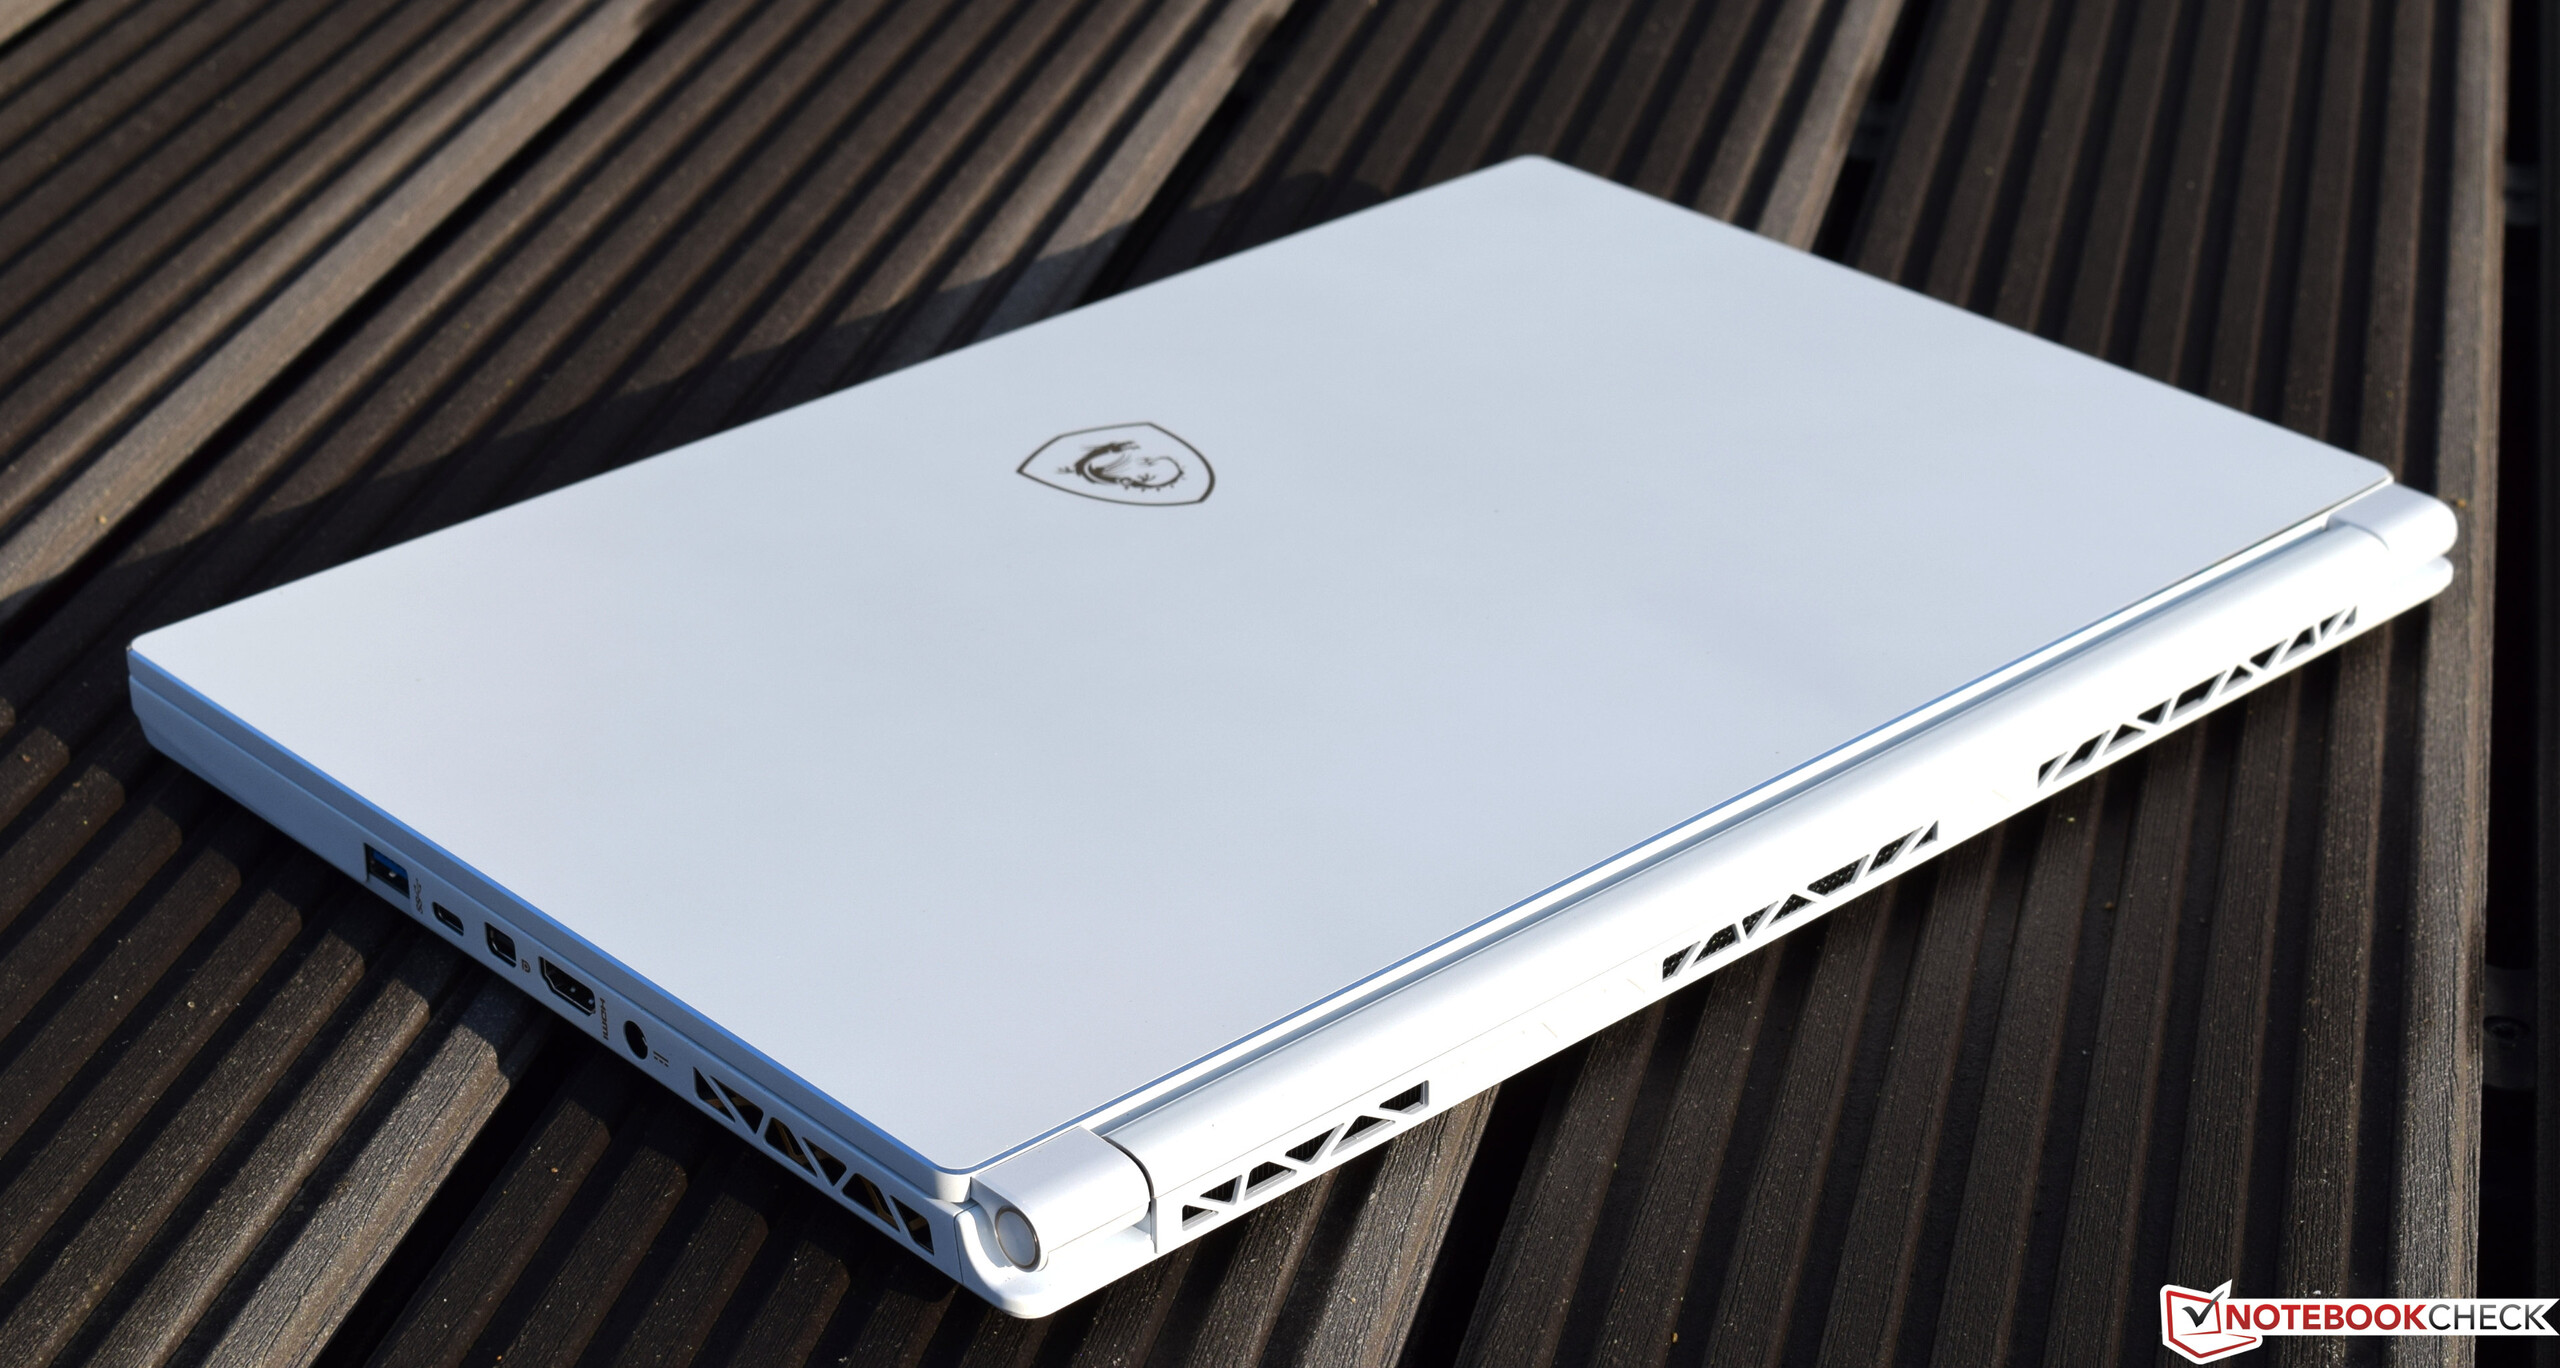
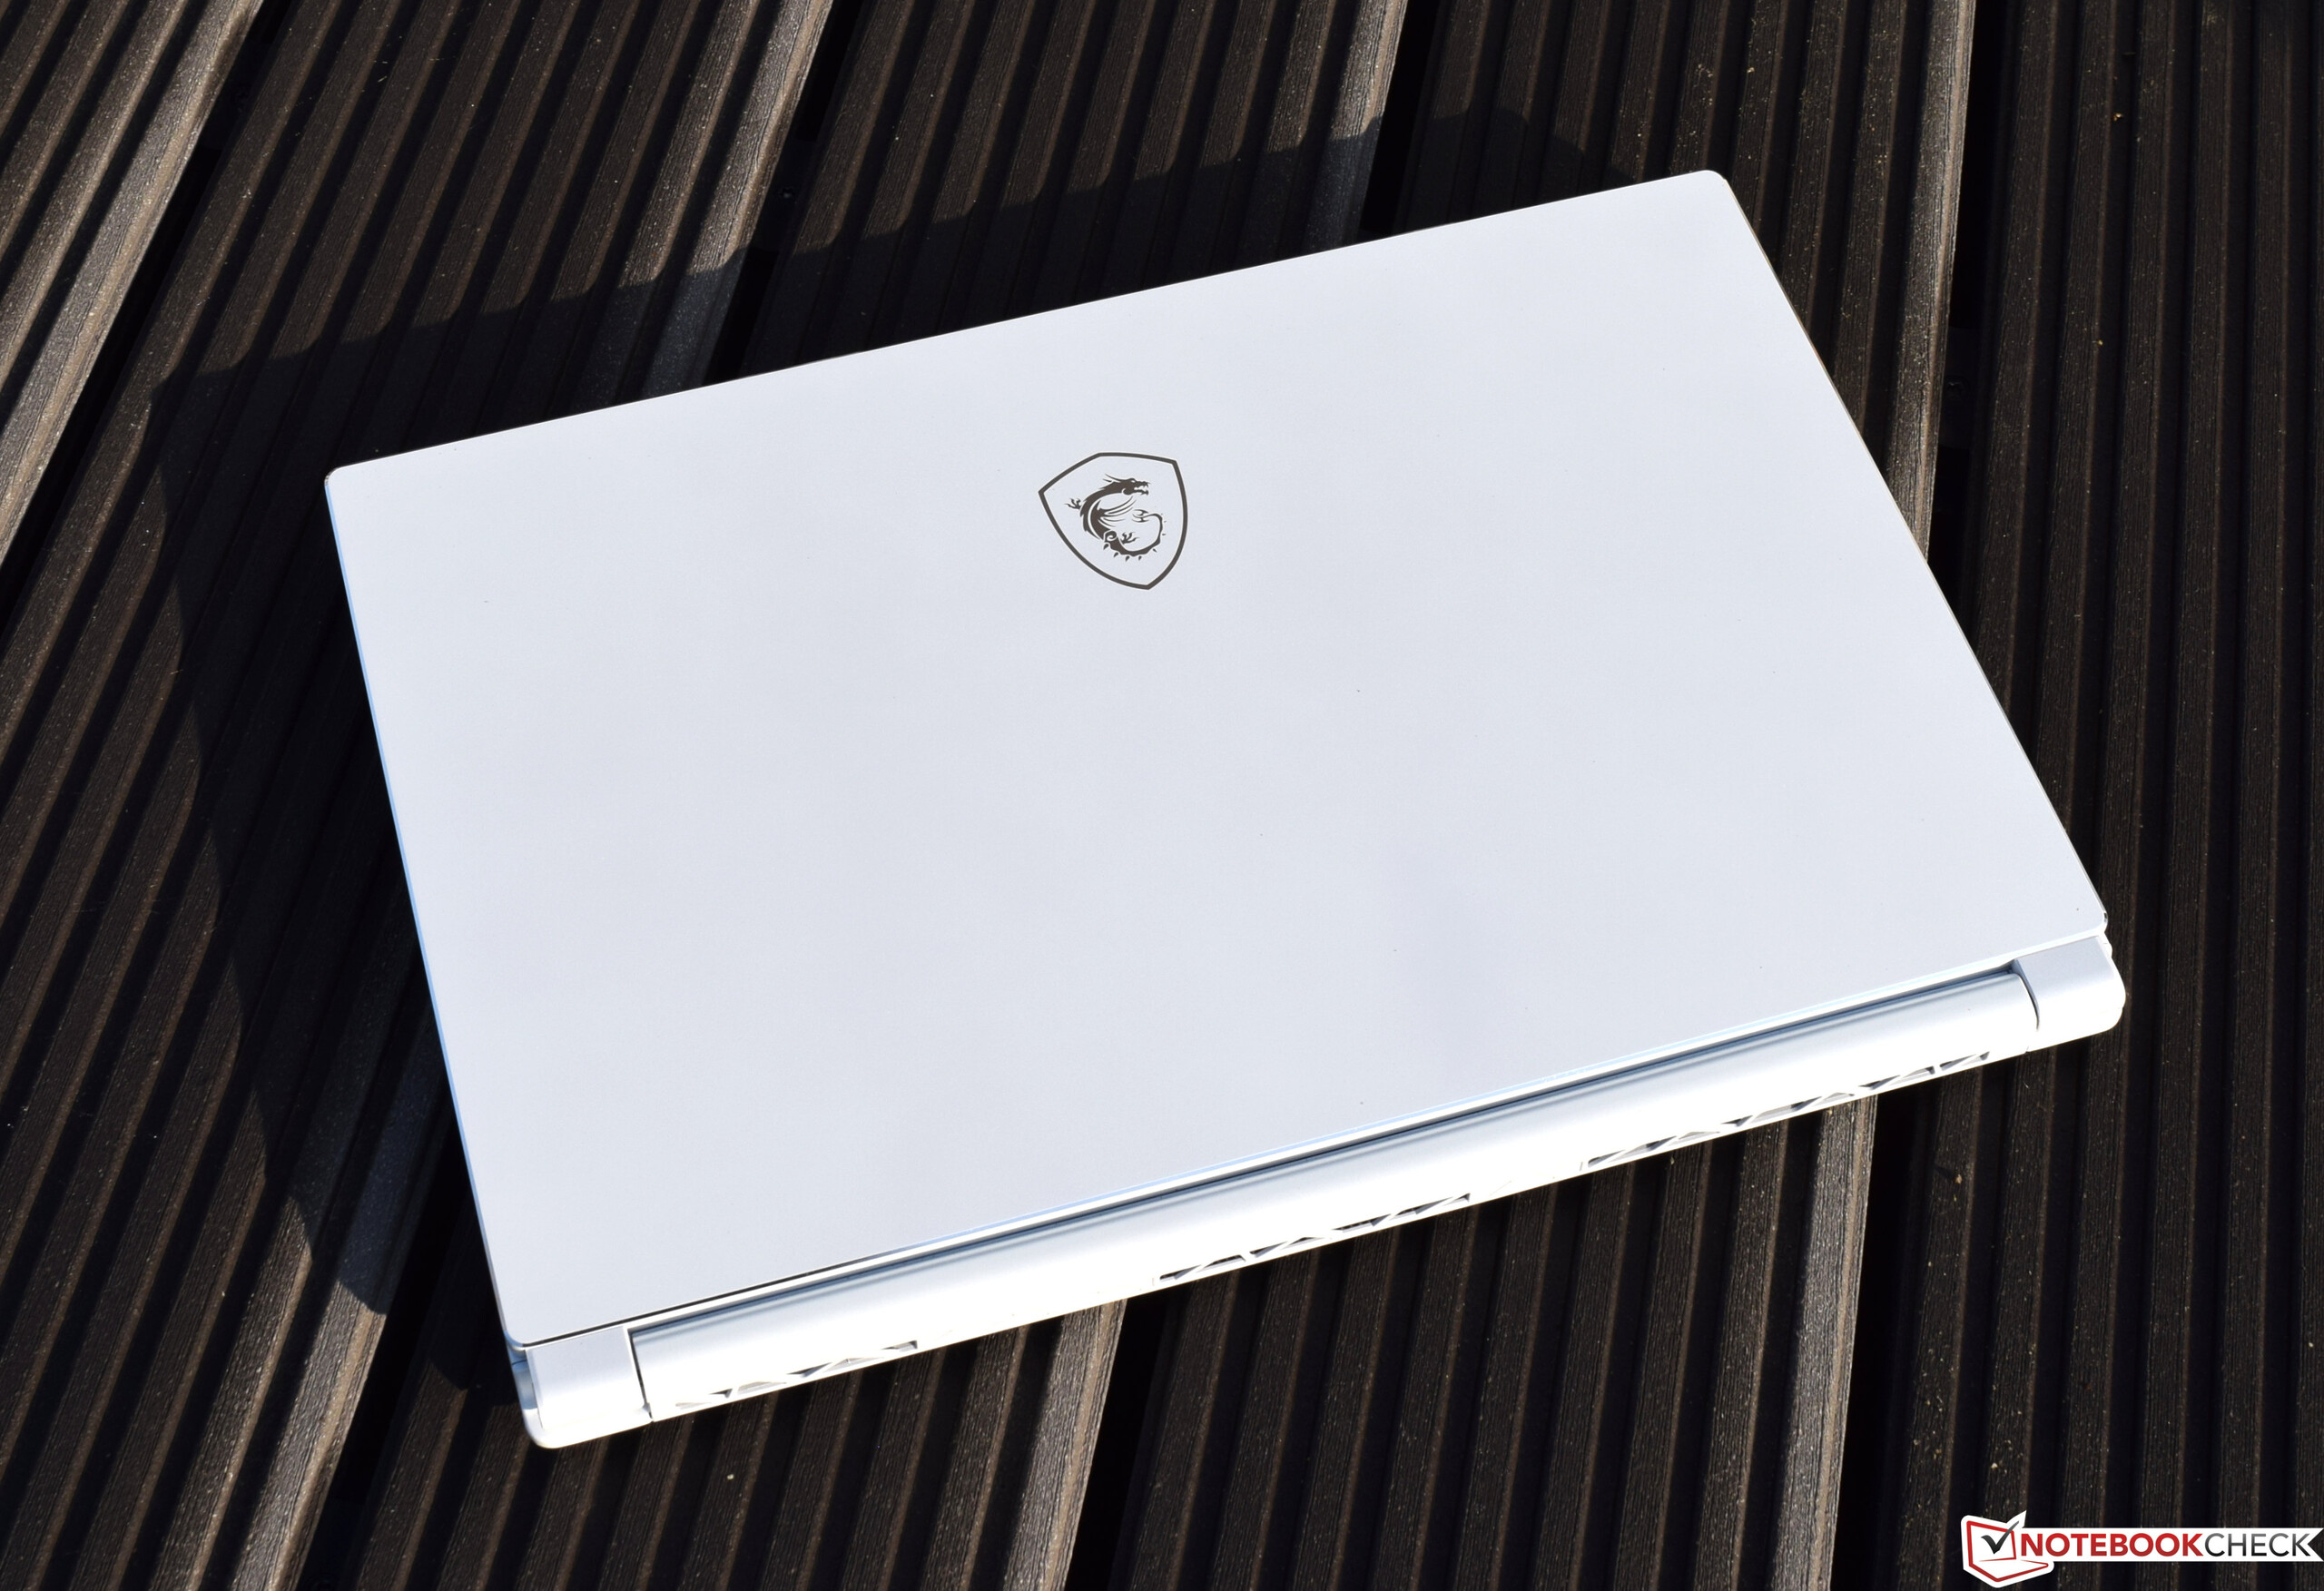
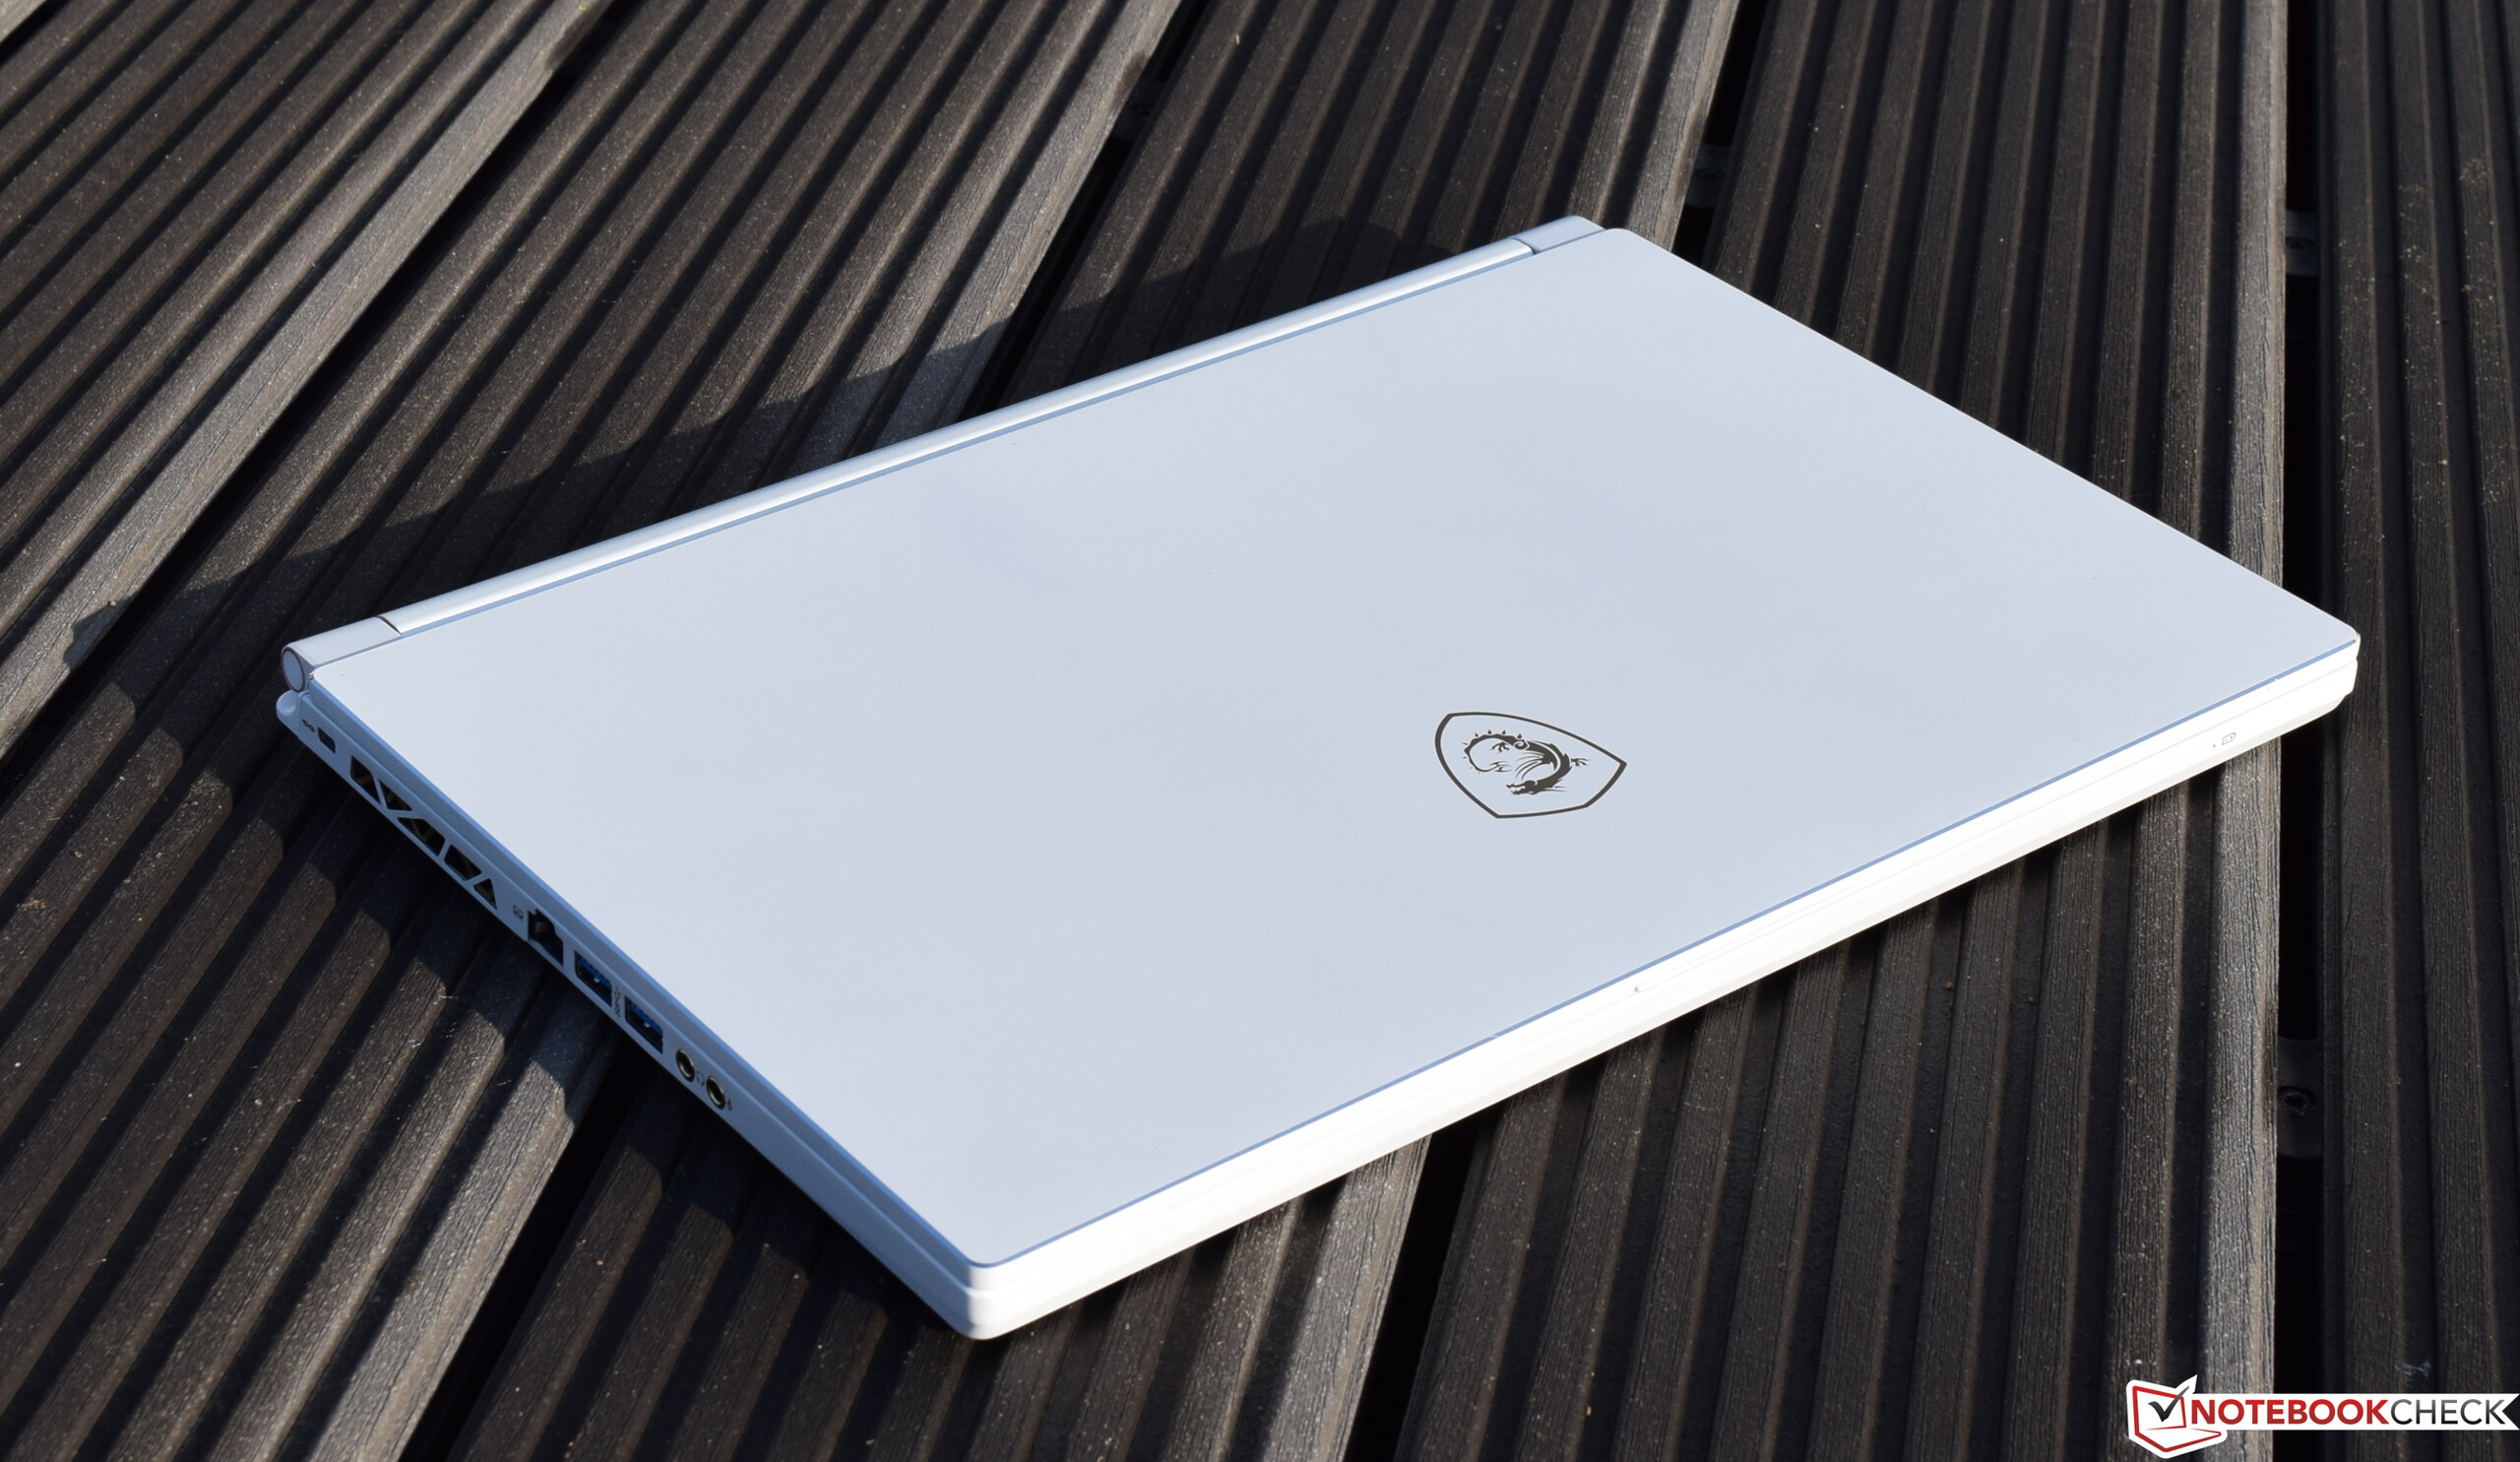
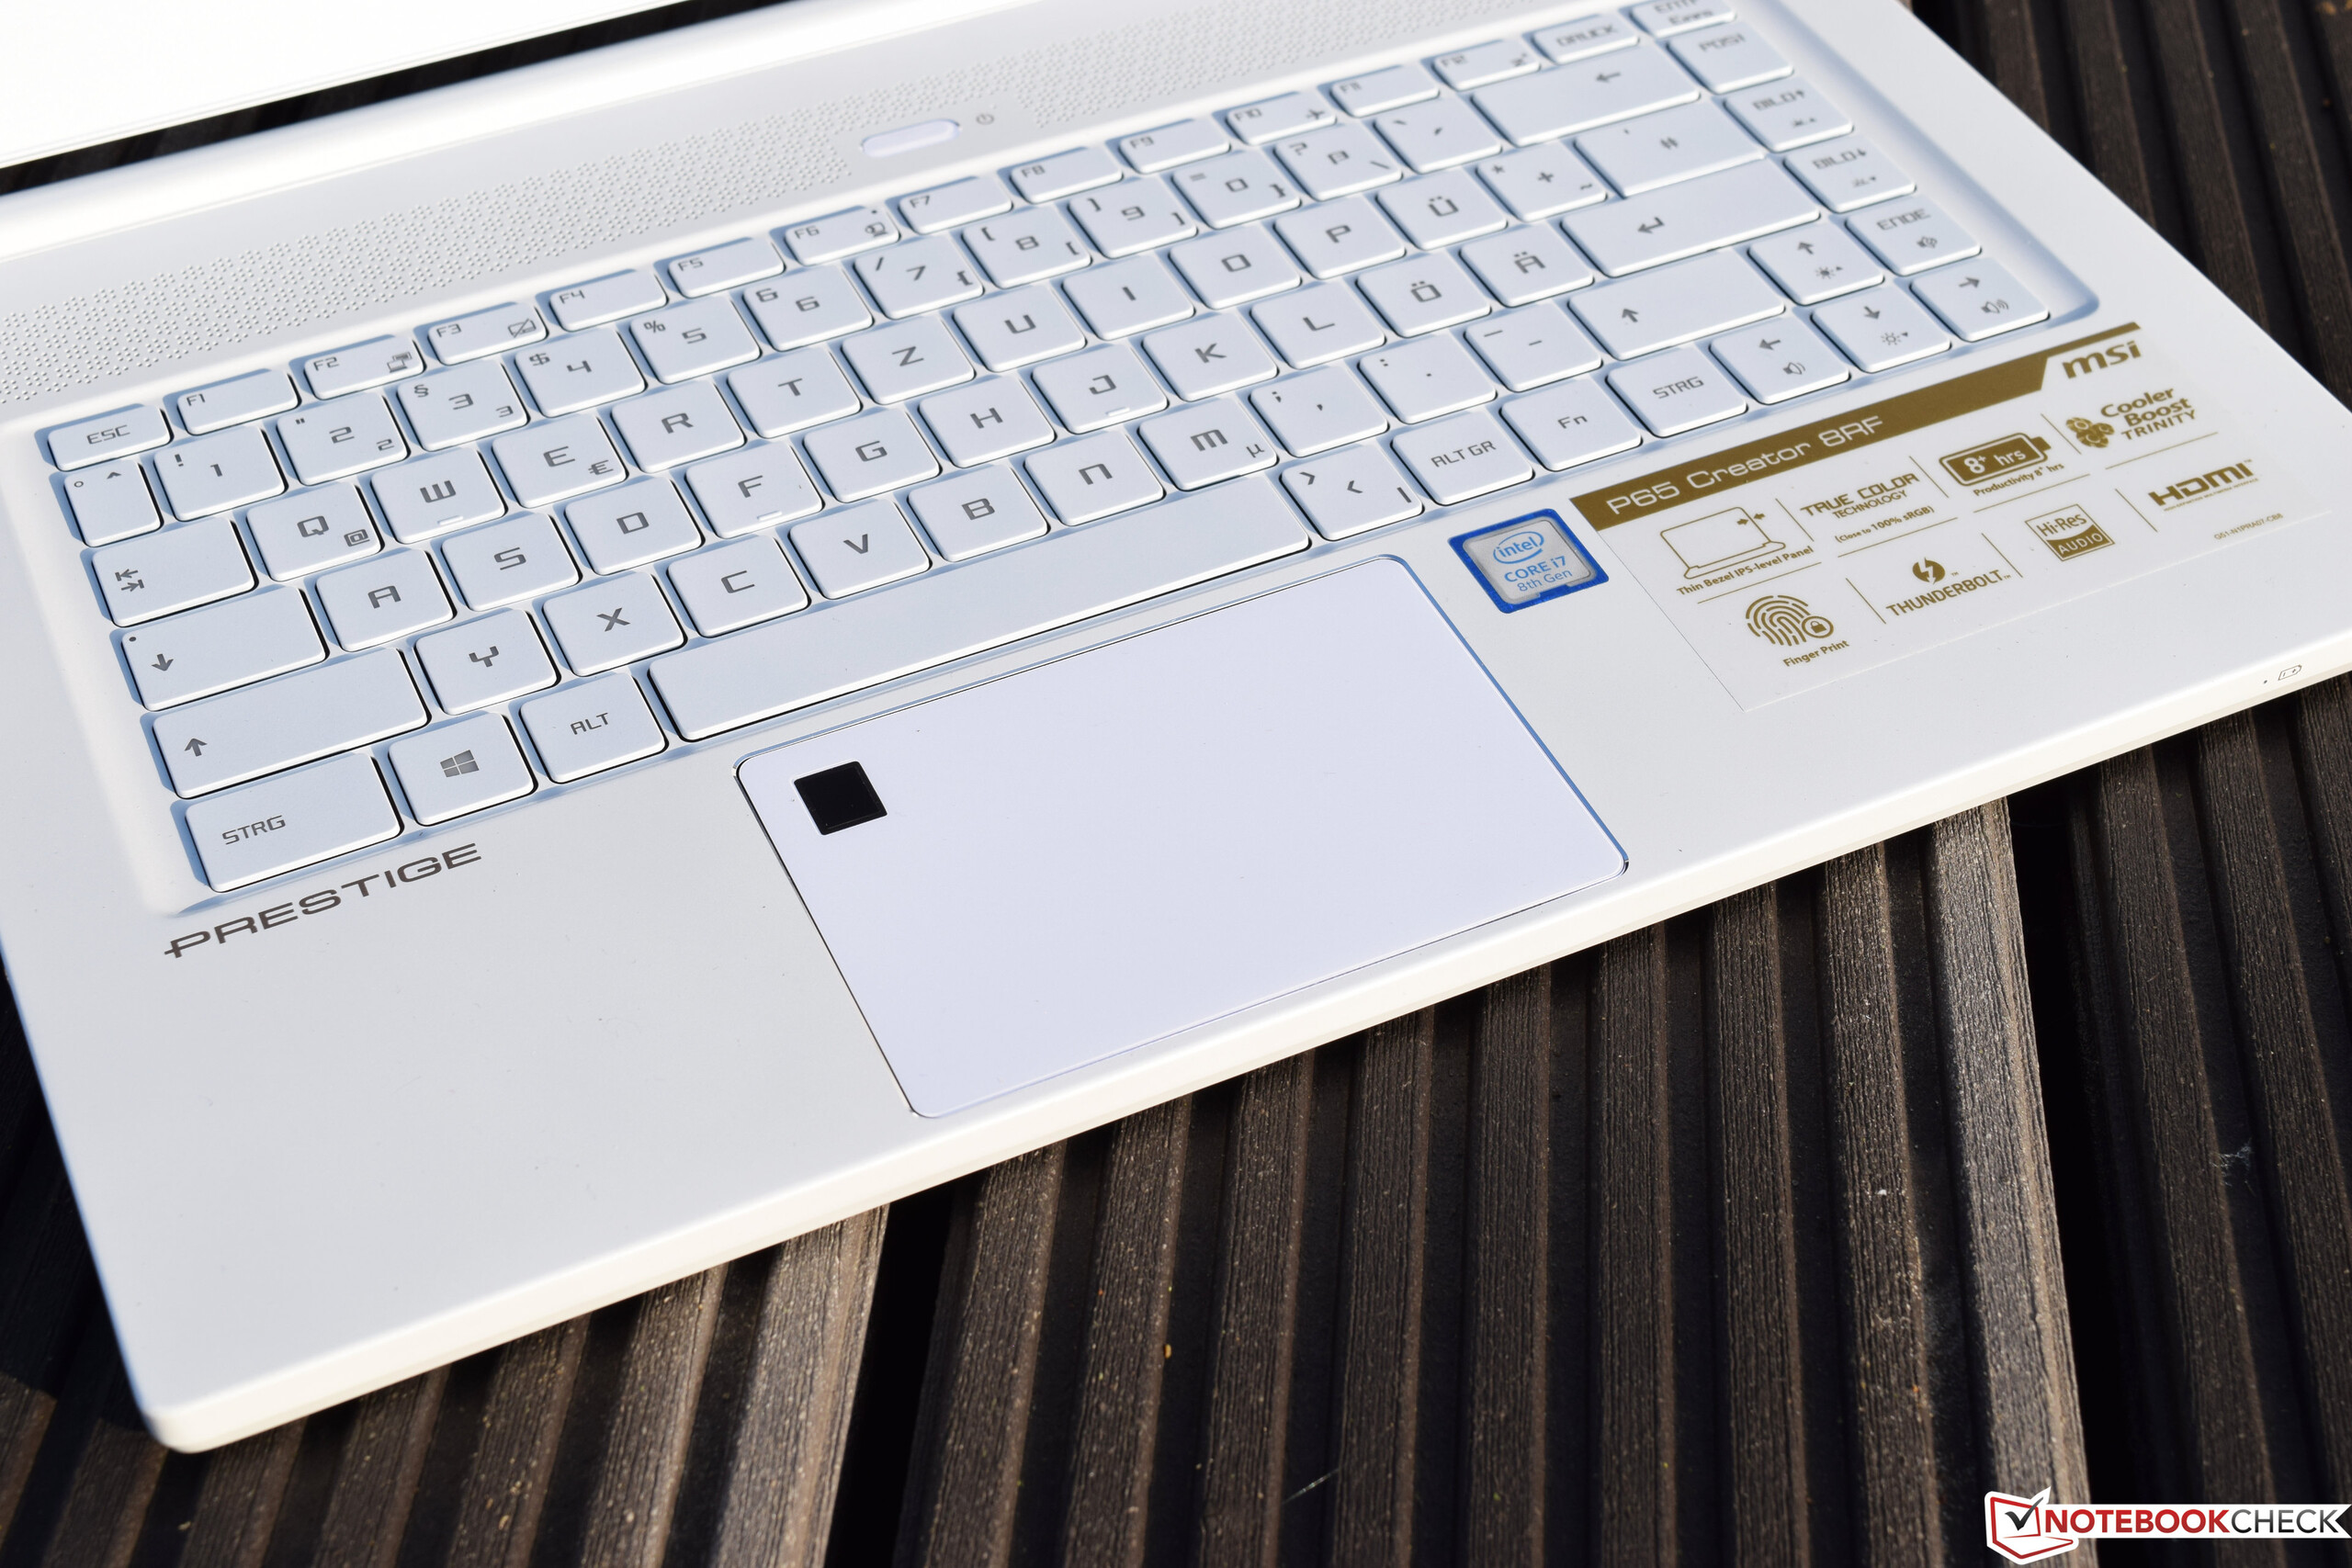
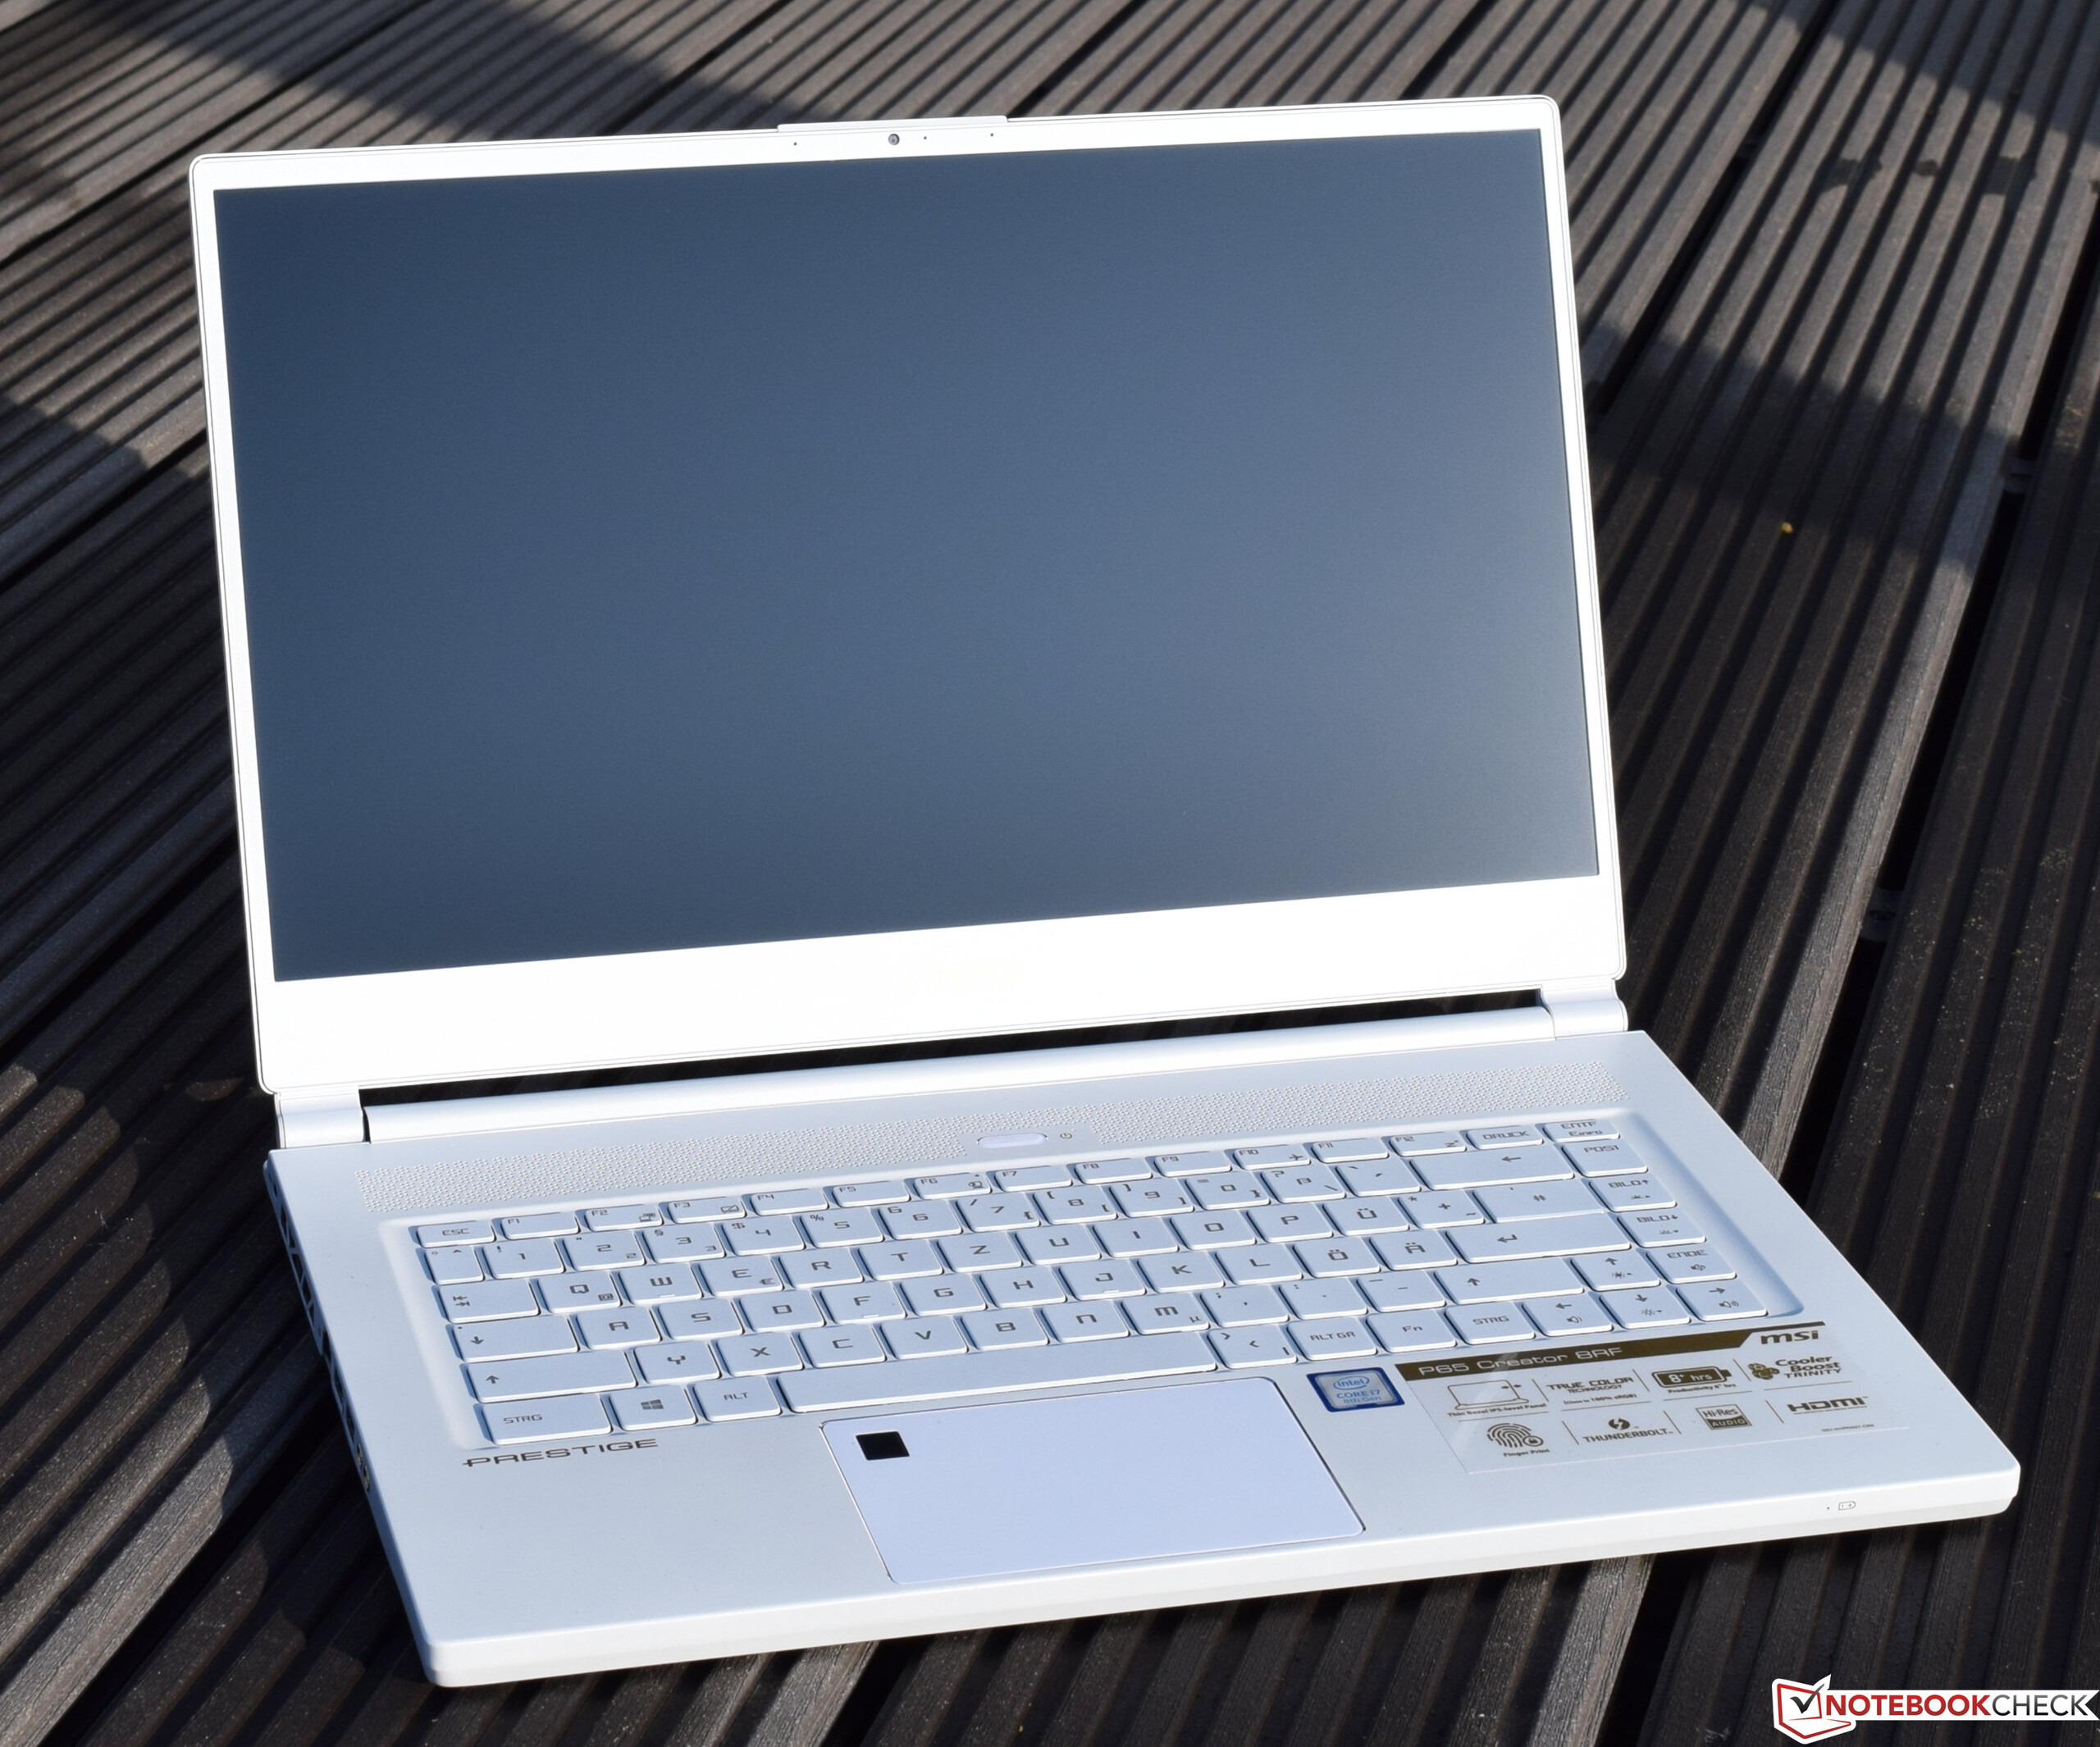
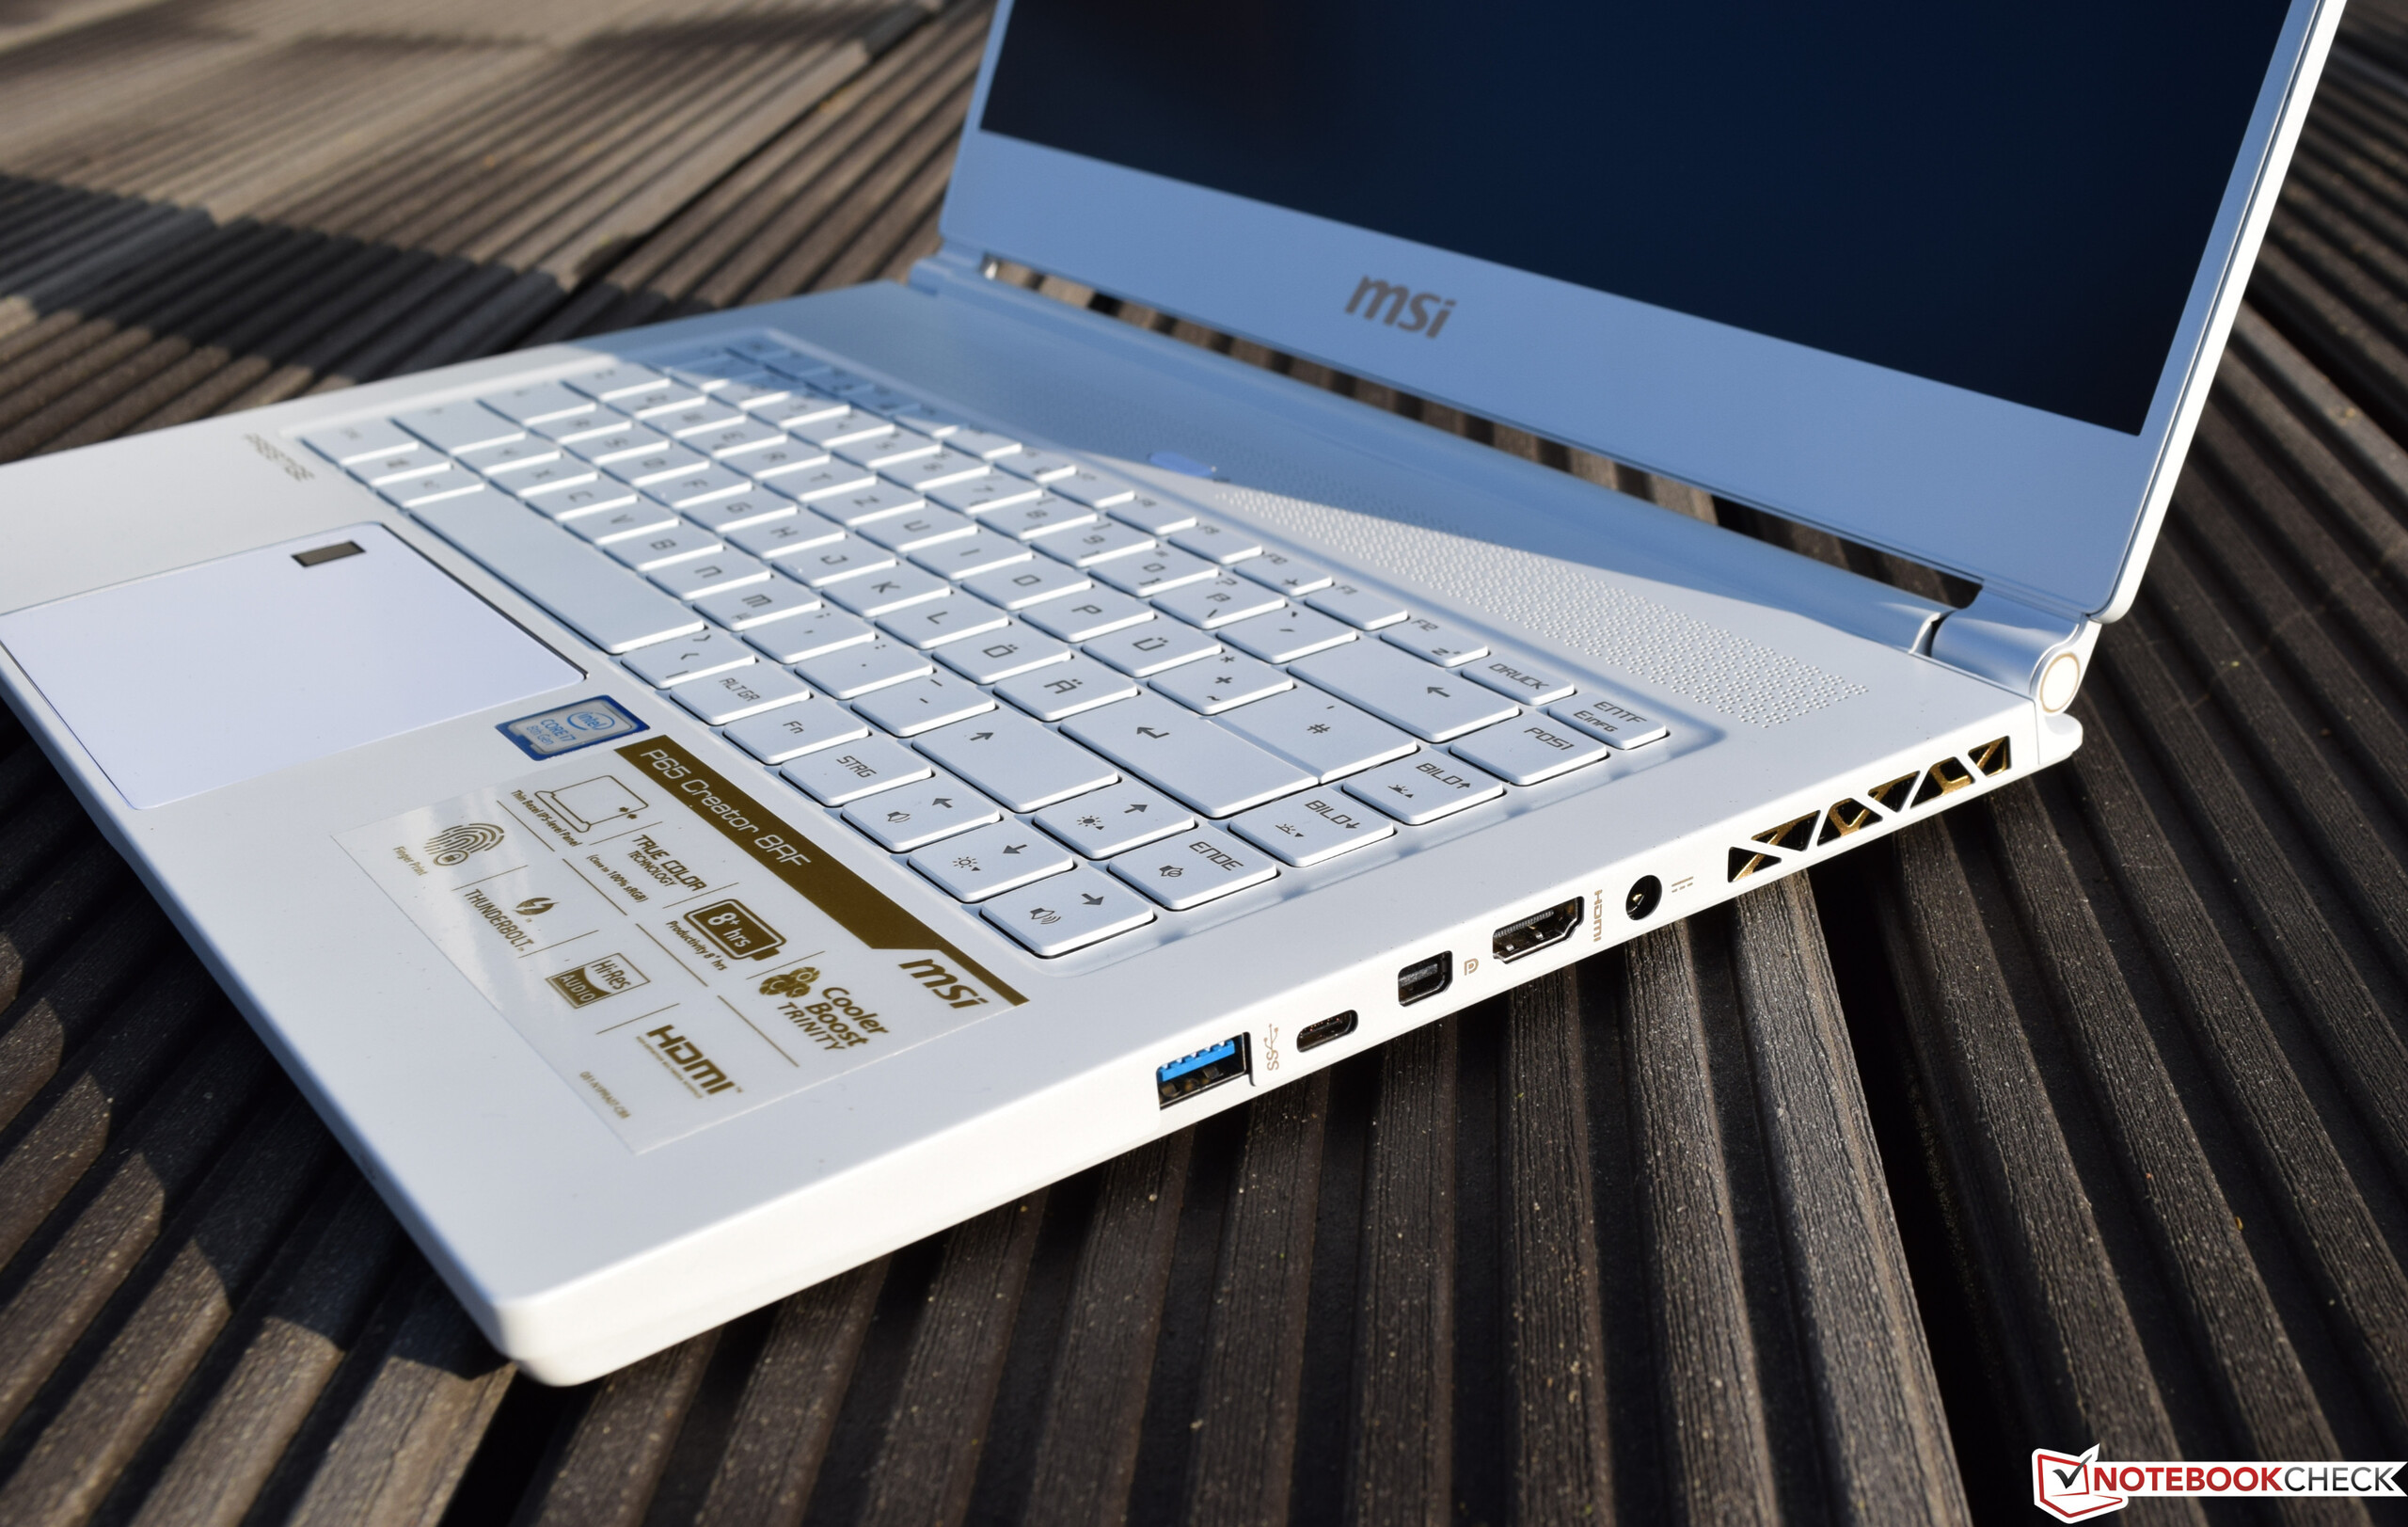
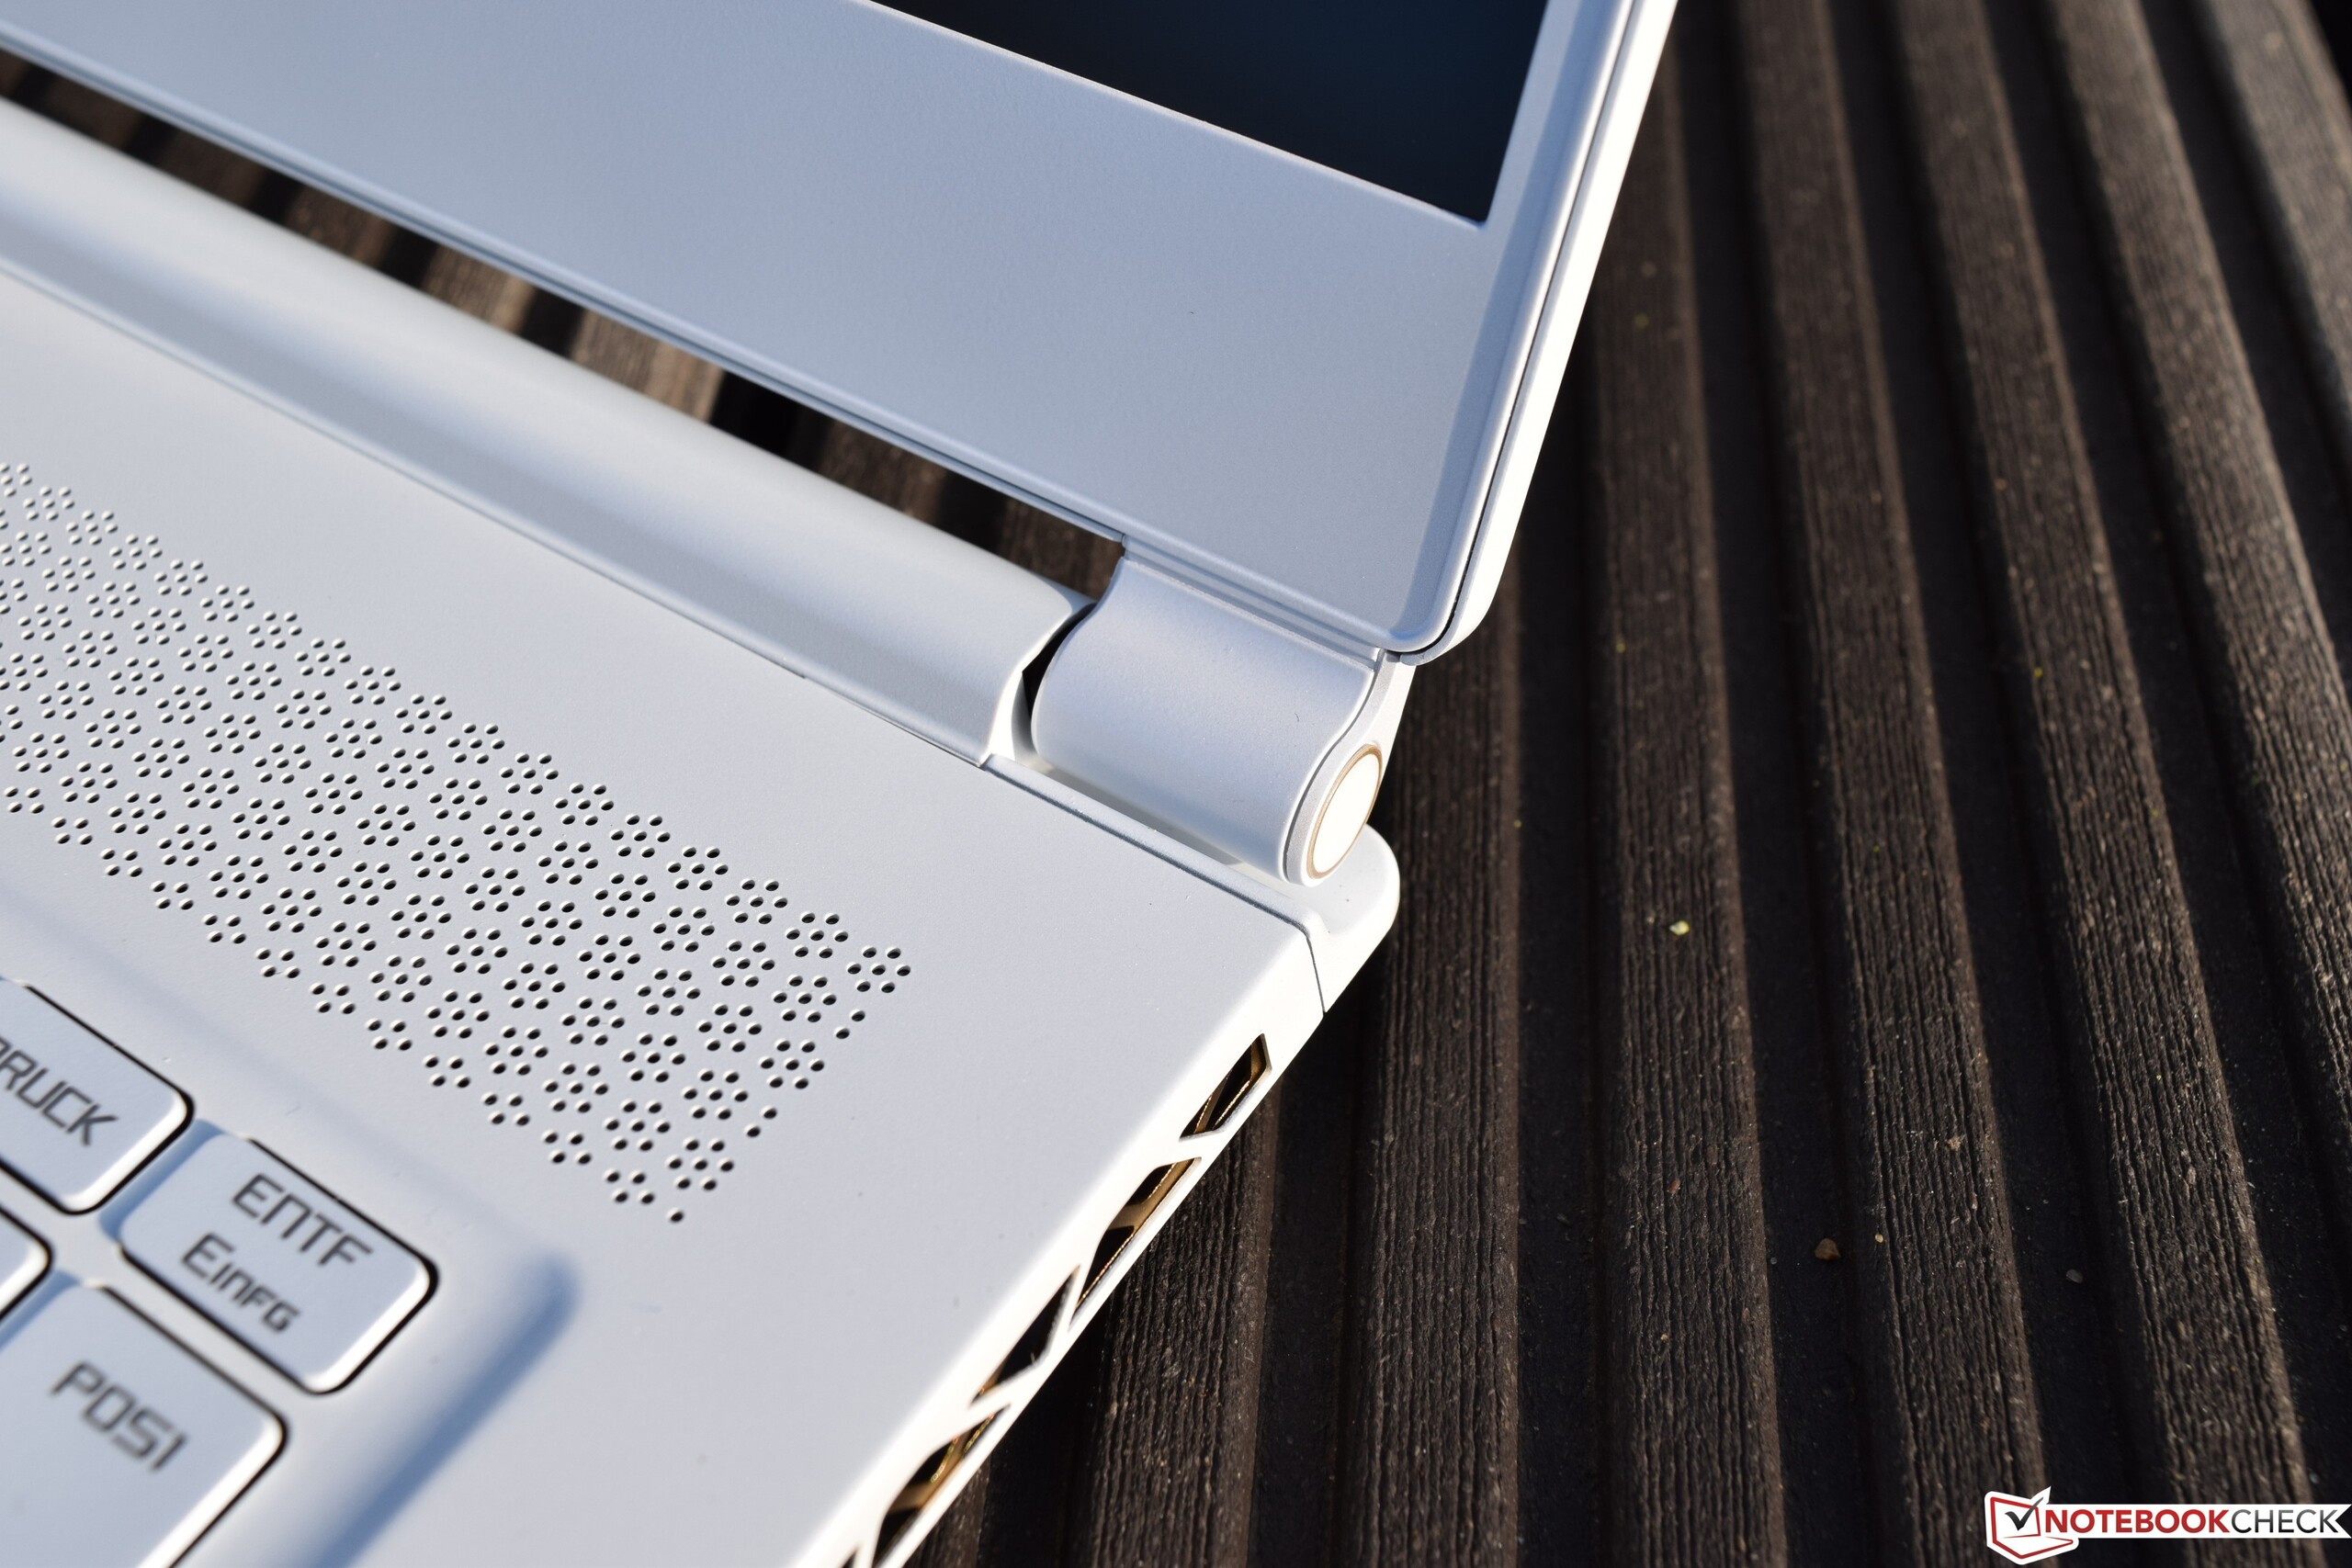
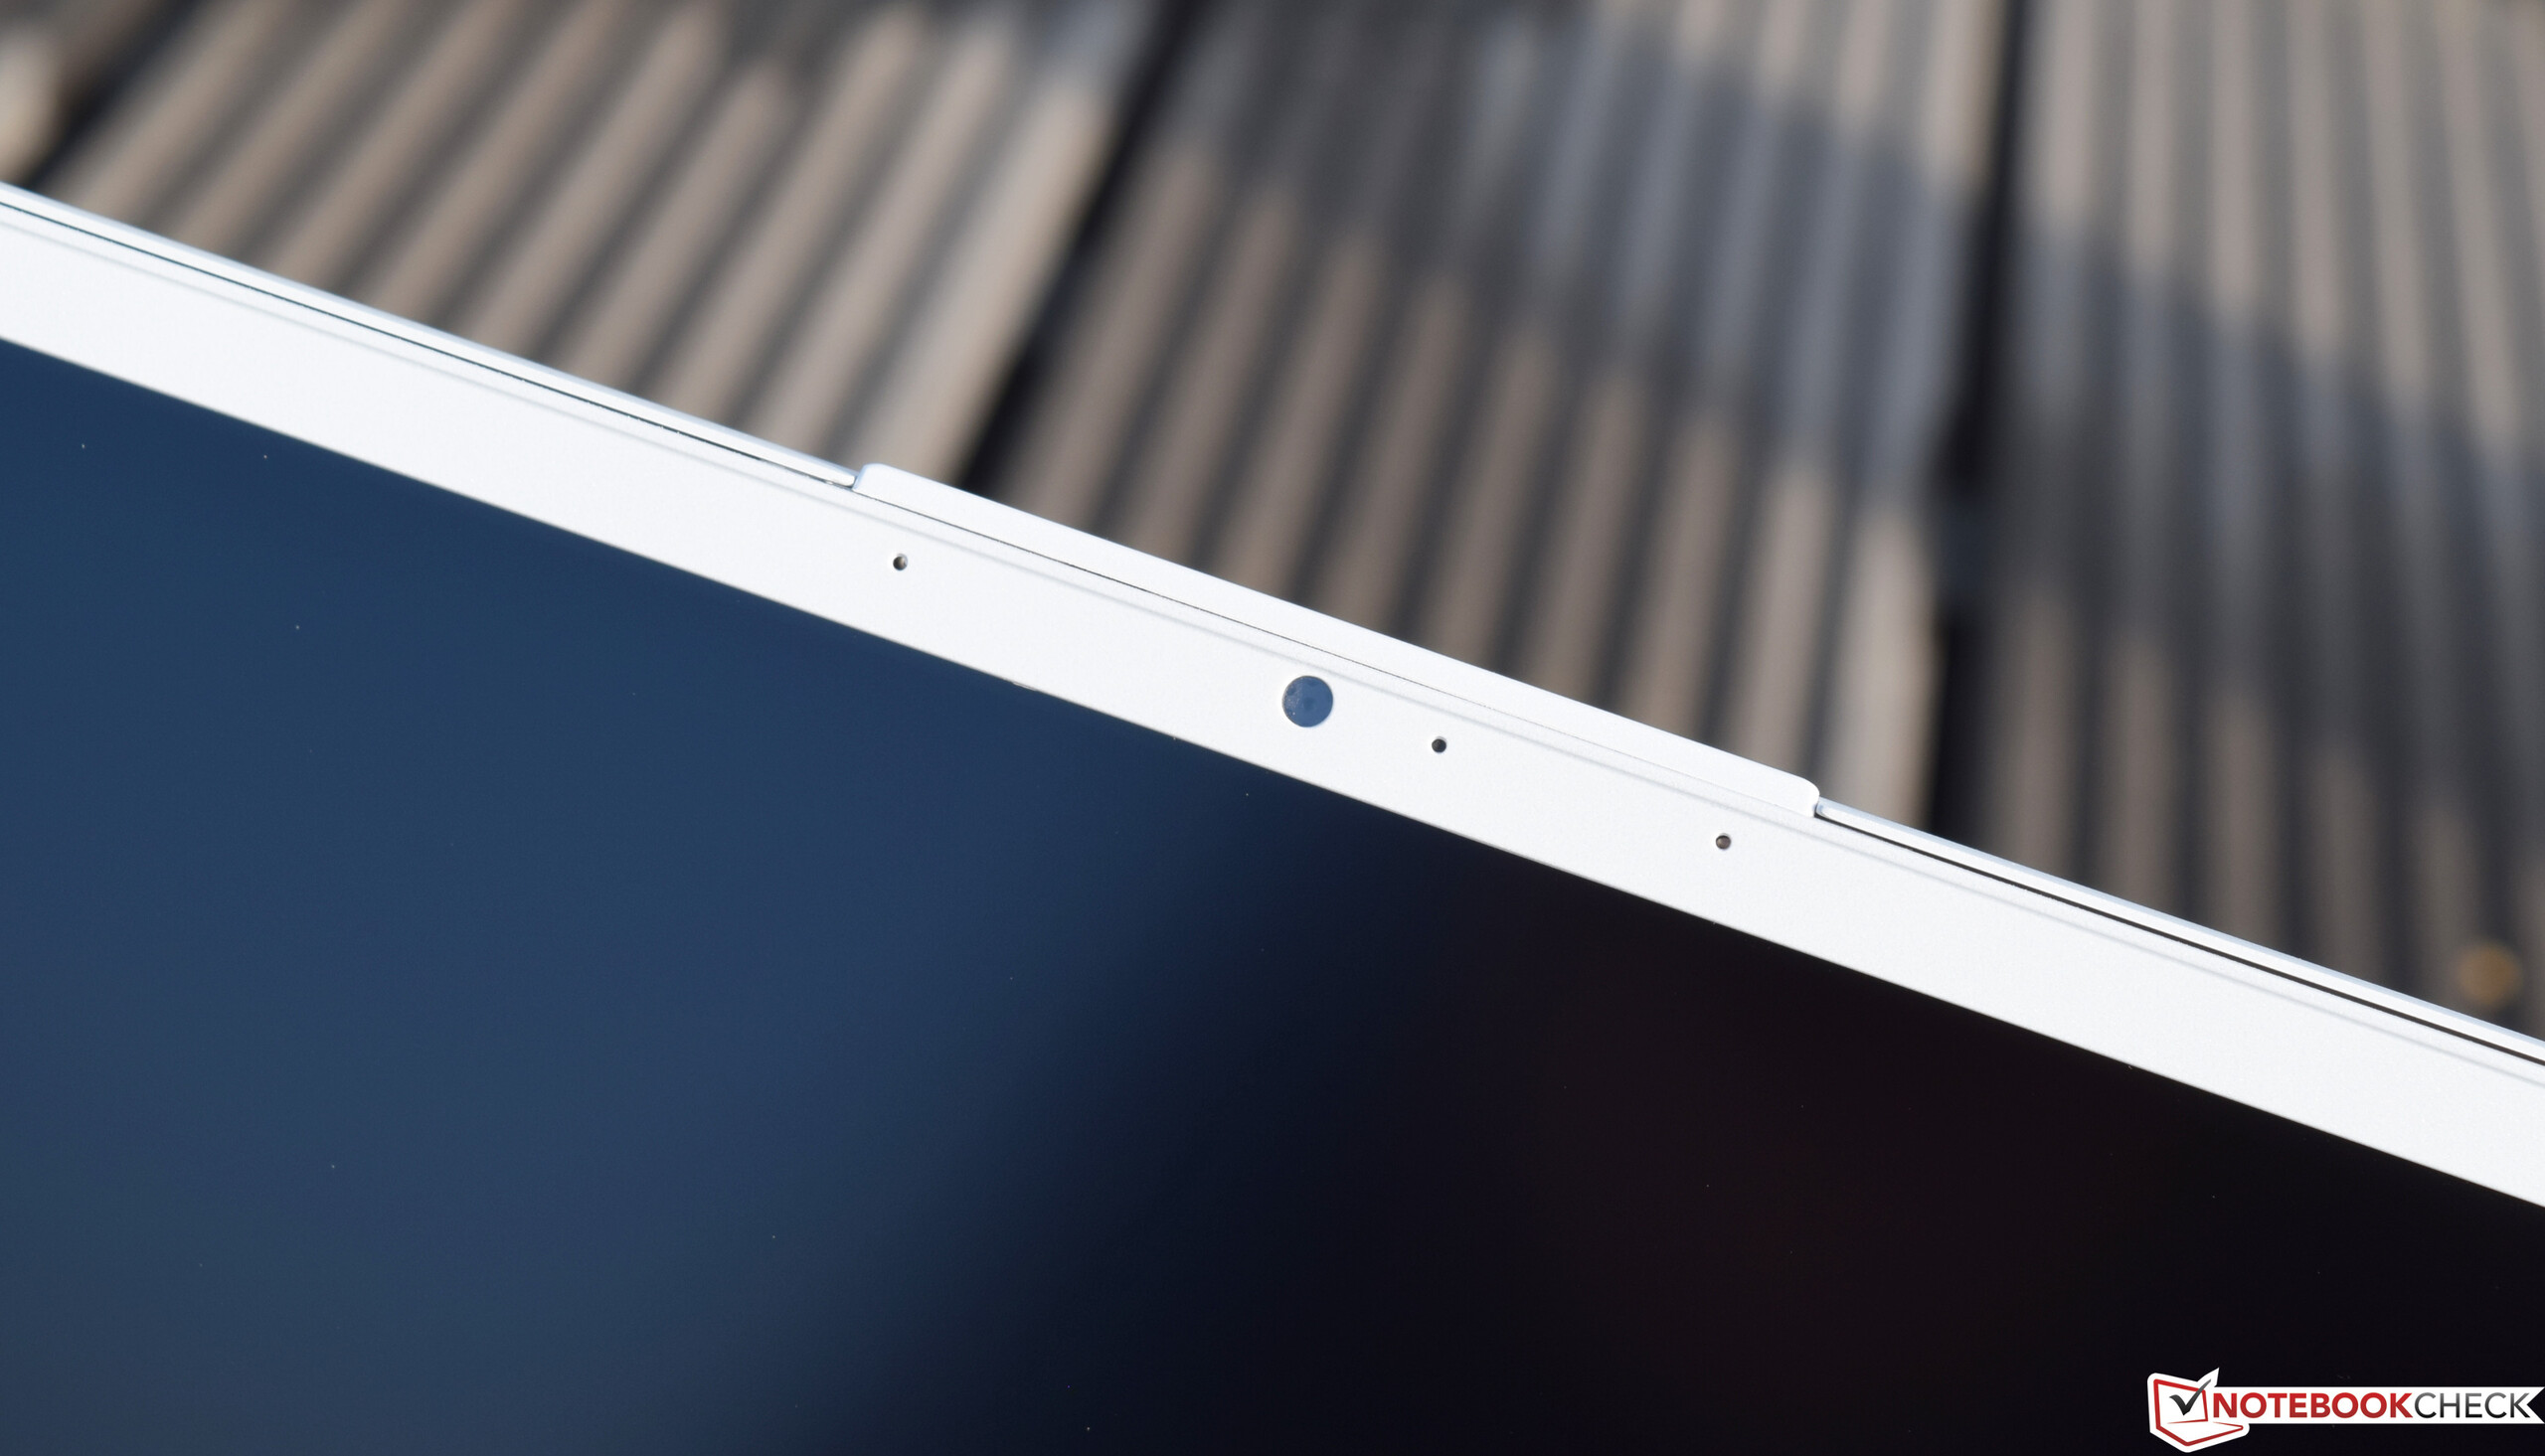
A carcaça é um compromisso bem feito entre mobilidade e rigidez. O material usado é muito premium, mas gostaríamos de ter um design mais robusto. A tela deixa uma impressão confusa. Por um lado, oferece um painel de 144 Hz e tempos de resposta rápidos. Por outro, é muito escuro e praticamente inutilizável em exteriores. O teclado também não era o melhor. A rotulagem foi incrivelmente difícil de ler e o layout incomum leva mais tempo para se acostumar do que aquele com o que nos sentimos confortáveis.
O desempenho, por outro lado, está, sem dúvida, em um nível que você nunca esperaria de um dispositivo tão fino e leve. O Core i7-8750H da Intel funcionou muito bem, apesar do fato de que seu desempenho sofreu um pouco sob carga sustentada, e a GeForce GTX 1070 Max-Q da Nvidia ofereceu um desempenho incrível considerando o design fino.
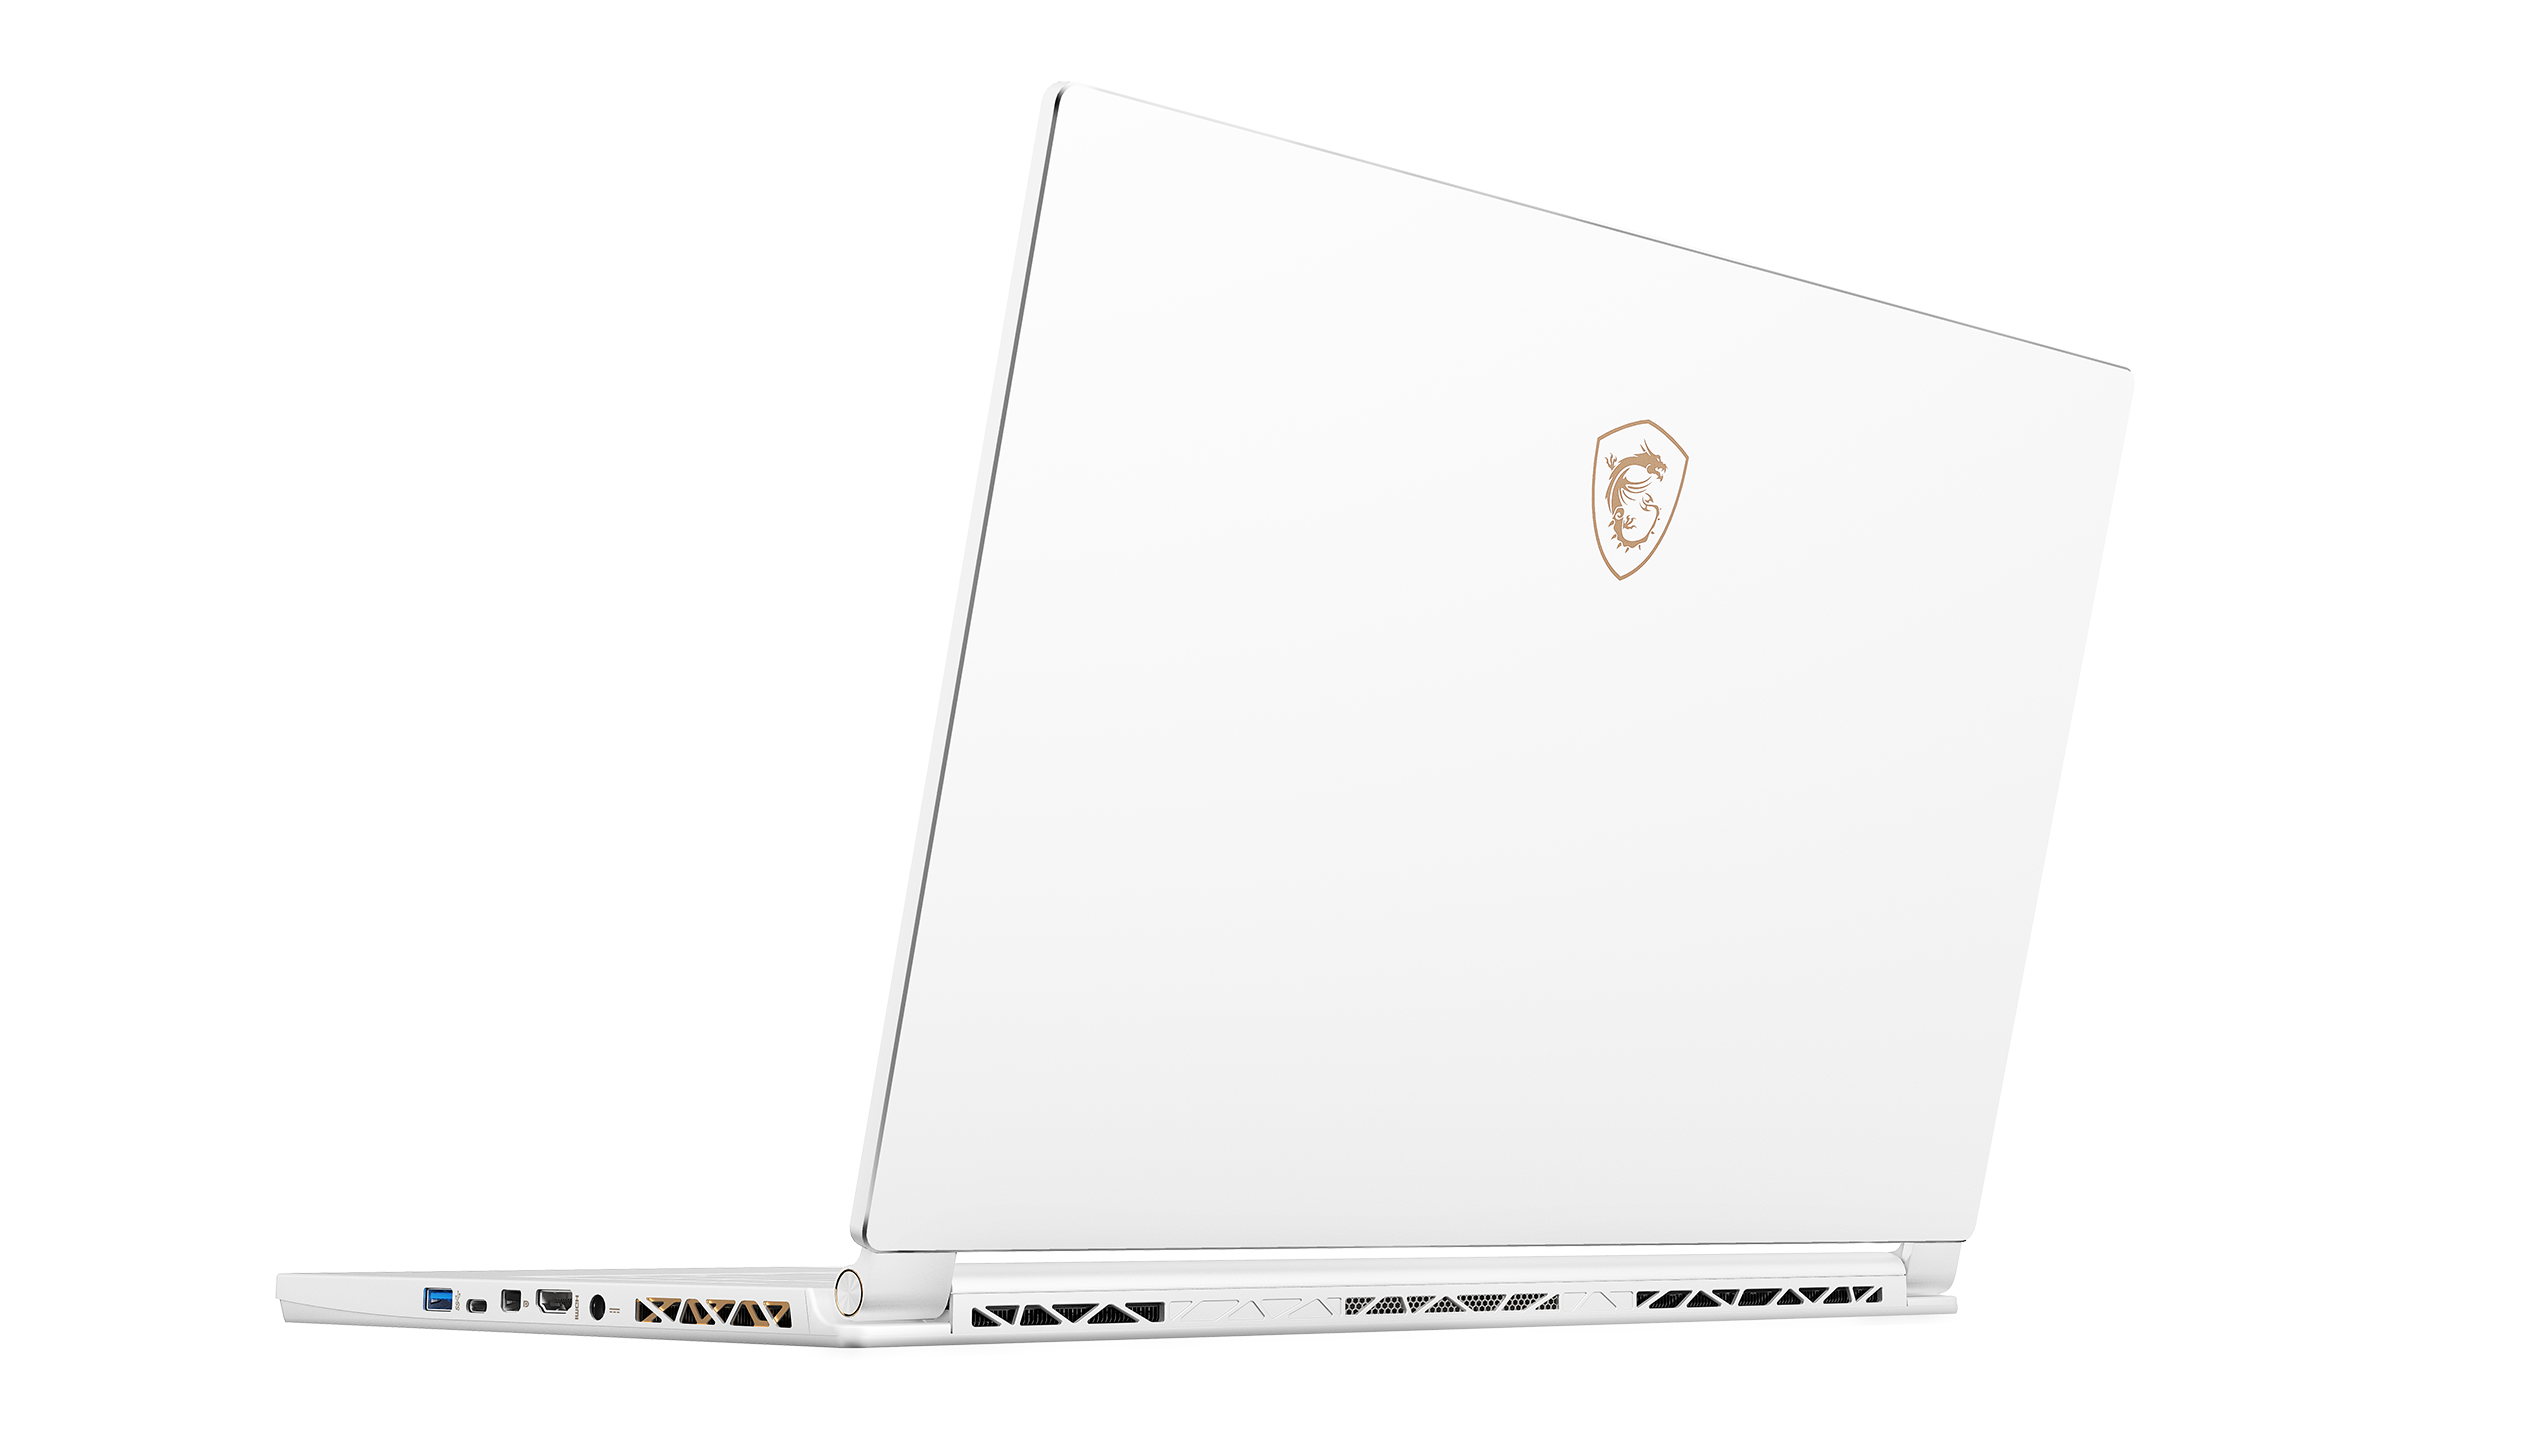
Com mais de $ 2.300, ele custa tanto quanto o GS65 8RF, mas oferece alguns extras, como o leitor de digitai ou a garantia estendida. Se você deseja evitar o design preto típico e bling-bling RGB, você pode querer considerar a P65.
Se você decidir comprar o P65 Creator até o 31/12/2018, a MSI lançará um pacote de software com valor de mais de $300 para iniciar sua viagem na pista da criação de conteúdo.
MSI P65 8RF-451 - Creator
- 11/10/2018 v6 (old)
Sebastian Bade
Price comparison
