Breve Análise do Portátil HP Omen 15: GeForce RTX 2070 Max-Q e 144 Hz
| SD Card Reader | |
| average JPG Copy Test (av. of 3 runs) | |
| Média da turma Gaming (20.9 - 210, n=54, últimos 2 anos) | |
| Aorus 15 X9 (Toshiba Exceria Pro M501 64 GB UHS-II) | |
| HP Omen 15-dc0015ng (Toshiba Exceria Pro SDXC 64 GB UHS-II) | |
| HP Omen 15-dc1303ng (Toshiba Exceria Pro SDXC 64 GB UHS-II) | |
| Dell G5 15 5590 (Toshiba Exceria Pro SDXC 64 GB UHS-II) | |
| maximum AS SSD Seq Read Test (1GB) | |
| Média da turma Gaming (25.5 - 261, n=51, últimos 2 anos) | |
| Aorus 15 X9 (Toshiba Exceria Pro M501 64 GB UHS-II) | |
| HP Omen 15-dc0015ng (Toshiba Exceria Pro SDXC 64 GB UHS-II) | |
| HP Omen 15-dc1303ng (Toshiba Exceria Pro SDXC 64 GB UHS-II) | |
| Dell G5 15 5590 (Toshiba Exceria Pro SDXC 64 GB UHS-II) | |
| |||||||||||||||||||||||||
iluminação: 84 %
iluminação com acumulador: 324 cd/m²
Contraste: 752:1 (Preto: 0.42 cd/m²)
ΔE ColorChecker Calman: 2.7 | ∀{0.5-29.43 Ø4.71}
calibrated: 1.58
ΔE Greyscale Calman: 2.35 | ∀{0.09-98 Ø4.96}
93% sRGB (Argyll 1.6.3 3D)
60% AdobeRGB 1998 (Argyll 1.6.3 3D)
65% AdobeRGB 1998 (Argyll 3D)
93.4% sRGB (Argyll 3D)
63.8% Display P3 (Argyll 3D)
Gamma: 2.41
CCT: 6904 K
| HP Omen 15-dc1303ng LG Philips LGD05C0, , 1920x1080, 15.6" | Aorus 15 X9 LG Philips LP156WFG-SPB2, , 1920x1080, 15.6" | Alienware m15 P79F Samsung SDCA029, 156WR04, , 3840x2160, 15.6" | Dell G5 15 5590 AU Optronics B156HAN, , 1920x1080, 15.6" | HP Omen 15-dc0015ng LG Philips LGD05C0, , 1920x1080, 15.6" | |
|---|---|---|---|---|---|
| Display | 2% | 39% | -38% | 0% | |
| Display P3 Coverage (%) | 63.8 | 64.9 2% | 99.9 57% | 39.26 -38% | 64.2 1% |
| sRGB Coverage (%) | 93.4 | 95.6 2% | 100 7% | 59.1 -37% | 93.4 0% |
| AdobeRGB 1998 Coverage (%) | 65 | 66.3 2% | 100 54% | 40.56 -38% | 65.1 0% |
| Response Times | -11% | 80% | -197% | -11% | |
| Response Time Grey 50% / Grey 80% * (ms) | 14 ? | 15.2 ? -9% | 2.6 ? 81% | 45 ? -221% | 17 ? -21% |
| Response Time Black / White * (ms) | 11 ? | 12.4 ? -13% | 2.3 ? 79% | 30 ? -173% | 11 ? -0% |
| PWM Frequency (Hz) | 60.2 ? | ||||
| Screen | 3% | -15% | -76% | -9% | |
| Brightness middle (cd/m²) | 316 | 305.1 -3% | 452.1 43% | 234 -26% | 317 0% |
| Brightness (cd/m²) | 295 | 295 0% | 452 53% | 219 -26% | 283 -4% |
| Brightness Distribution (%) | 84 | 78 -7% | 90 7% | 82 -2% | 76 -10% |
| Black Level * (cd/m²) | 0.42 | 0.33 21% | 0.17 60% | 0.62 -48% | |
| Contrast (:1) | 752 | 925 23% | 1376 83% | 511 -32% | |
| Colorchecker dE 2000 * | 2.7 | 2.58 4% | 6.34 -135% | 8.6 -219% | 2.83 -5% |
| Colorchecker dE 2000 max. * | 5.65 | 4.32 24% | 12.97 -130% | 17.49 -210% | 5.78 -2% |
| Colorchecker dE 2000 calibrated * | 1.58 | 1.33 16% | 4.06 -157% | ||
| Greyscale dE 2000 * | 2.35 | 3.4 -45% | 2.8 -19% | 8.55 -264% | 2 15% |
| Gamma | 2.41 91% | 2.28 96% | 2.21 100% | 3.02 73% | 2.28 96% |
| CCT | 6904 94% | 6374 102% | 6114 106% | 7802 83% | 6493 100% |
| Color Space (Percent of AdobeRGB 1998) (%) | 60 | 60.7 1% | 91 52% | 37 -38% | 60 0% |
| Color Space (Percent of sRGB) (%) | 93 | 95.2 2% | 100 8% | 59 -37% | 93 0% |
| Média Total (Programa/Configurações) | -2% /
1% | 35% /
12% | -104% /
-84% | -7% /
-7% |
* ... menor é melhor
Exibir tempos de resposta
| ↔ Tempo de resposta preto para branco | ||
|---|---|---|
| 11 ms ... ascensão ↗ e queda ↘ combinadas | ↗ 7 ms ascensão | 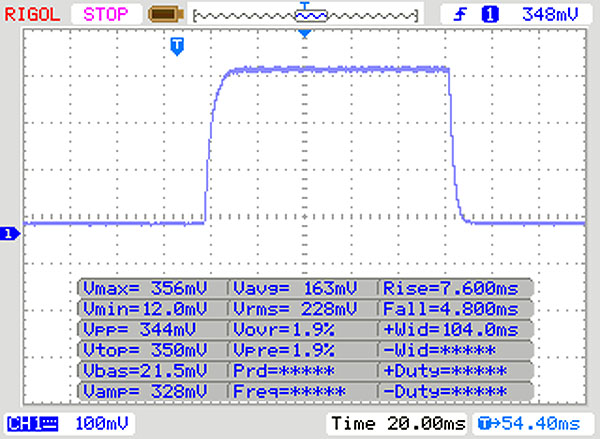 |
| ↘ 4 ms queda | ||
| A tela mostra boas taxas de resposta em nossos testes, mas pode ser muito lenta para jogadores competitivos. Em comparação, todos os dispositivos testados variam de 0.1 (mínimo) a 240 (máximo) ms. » 30 % de todos os dispositivos são melhores. Isso significa que o tempo de resposta medido é melhor que a média de todos os dispositivos testados (19.8 ms). | ||
| ↔ Tempo de resposta 50% cinza a 80% cinza | ||
| 14 ms ... ascensão ↗ e queda ↘ combinadas | ↗ 7 ms ascensão | 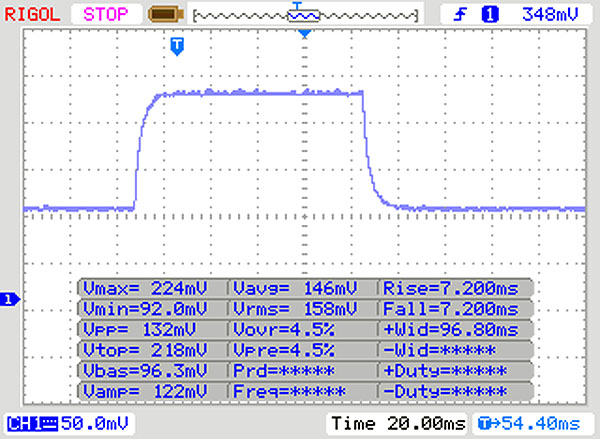 |
| ↘ 7 ms queda | ||
| A tela mostra boas taxas de resposta em nossos testes, mas pode ser muito lenta para jogadores competitivos. Em comparação, todos os dispositivos testados variam de 0.165 (mínimo) a 636 (máximo) ms. » 28 % de todos os dispositivos são melhores. Isso significa que o tempo de resposta medido é melhor que a média de todos os dispositivos testados (30.9 ms). | ||
Cintilação da tela / PWM (modulação por largura de pulso)
| Tela tremeluzindo / PWM não detectado | 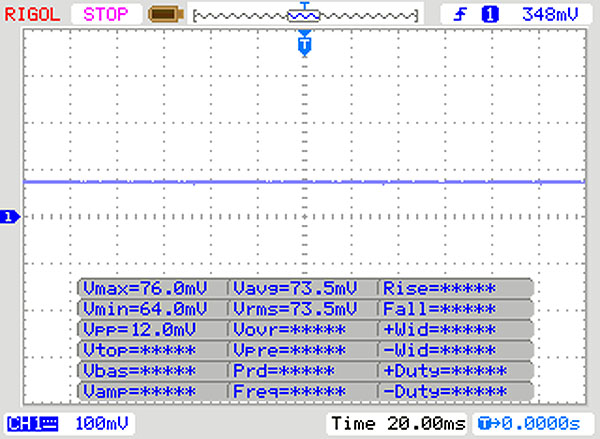 | ||
[pwm_comparison] Em comparação: 52 % de todos os dispositivos testados não usam PWM para escurecer a tela. Se PWM foi detectado, uma média de 7744 (mínimo: 5 - máximo: 343500) Hz foi medida. | |||

| PCMark 8 Home Score Accelerated v2 | 5077 pontos | |
| PCMark 8 Work Score Accelerated v2 | 5857 pontos | |
| PCMark 10 Score | 5609 pontos | |
Ajuda | ||
| HP Omen 15-dc1303ng Samsung SSD PM981 MZVLB256HAHQ | Aorus 15 X9 Intel SSD 760p SSDPEKKW512G8 | Alienware m15 P79F Toshiba XG5 KXG50ZNV512G | Dell G5 15 5590 KBG30ZMS128G | HP Omen 15-dc0015ng Toshiba XG5 KXG50ZNV512G | Média Samsung SSD PM981 MZVLB256HAHQ | |
|---|---|---|---|---|---|---|
| CrystalDiskMark 5.2 / 6 | 53% | 35% | -53% | -21% | 70% | |
| Write 4K (MB/s) | 50.2 | 147.2 193% | 148.4 196% | 64.3 28% | 87.5 74% | 116.1 ? 131% |
| Read 4K (MB/s) | 35.32 | 63.7 80% | 49.65 41% | 29.3 -17% | 16.08 -54% | 189.5 ? 437% |
| Write Seq (MB/s) | 991 | 1573 59% | 1139 15% | 131.1 -87% | 614 -38% | 1409 ? 42% |
| Read Seq (MB/s) | 1526 | 2602 71% | 2353 54% | 776 -49% | 1341 -12% | 1624 ? 6% |
| Write 4K Q32T1 (MB/s) | 445.1 | 531 19% | 484.7 9% | 96.8 -78% | 307.9 -31% | 360 ? -19% |
| Read 4K Q32T1 (MB/s) | 526 | 598 14% | 542 3% | 198.6 -62% | 358.4 -32% | 396 ? -25% |
| Write Seq Q32T1 (MB/s) | 1647 | 1592 -3% | 1139 -31% | 127.8 -92% | 525 -68% | 1492 ? -9% |
| Read Seq Q32T1 (MB/s) | 3427 | 2981 -13% | 3108 -9% | 1044 -70% | 3077 -10% | 3313 ? -3% |
| AS SSD | -8% | -9% | -347% | -45% | -17% | |
| Seq Read (MB/s) | 2485 | 1912 -23% | 1937 -22% | 1036 -58% | 2432 -2% | 2032 ? -18% |
| Seq Write (MB/s) | 1575 | 1553 -1% | 1066 -32% | 115.1 -93% | 843 -46% | 1339 ? -15% |
| 4K Read (MB/s) | 53.4 | 56.5 6% | 31.76 -41% | 29.6 -45% | 21.24 -60% | 46.1 ? -14% |
| 4K Write (MB/s) | 113.5 | 119.6 5% | 102.6 -10% | 67.8 -40% | 99.3 -13% | 107.4 ? -5% |
| 4K-64 Read (MB/s) | 725 | 869 20% | 1140 57% | 184.5 -75% | 730 1% | 712 ? -2% |
| 4K-64 Write (MB/s) | 1371 | 584 -57% | 938 -32% | 95.2 -93% | 484.4 -65% | 999 ? -27% |
| Access Time Read * (ms) | 0.059 | 0.049 17% | 0.058 2% | 1.519 -2475% | 0.126 -114% | 0.07076 ? -20% |
| Access Time Write * (ms) | 0.032 | 0.031 3% | 0.04 -25% | 0.255 -697% | 0.063 -97% | 0.04352 ? -36% |
| Score Read (Points) | 1027 | 1116 9% | 1366 33% | 318 -69% | 994 -3% | 961 ? -6% |
| Score Write (Points) | 1642 | 859 -48% | 1147 -30% | 174 -89% | 668 -59% | 1240 ? -24% |
| Score Total (Points) | 3163 | 2544 -20% | 3168 0% | 620 -80% | 2091 -34% | 2671 ? -16% |
| Copy ISO MB/s (MB/s) | 1329 | 946 | 159.2 | 1632 | 1297 ? | |
| Copy Program MB/s (MB/s) | 404.3 | 452.8 | 94.4 | 30.89 | 409 ? | |
| Copy Game MB/s (MB/s) | 1071 | 1013 | 106.3 | 980 | 786 ? | |
| Média Total (Programa/Configurações) | 23% /
17% | 13% /
9% | -200% /
-223% | -33% /
-35% | 27% /
20% |
* ... menor é melhor

| 3DMark 11 Performance | 13166 pontos | |
| 3DMark Cloud Gate Standard Score | 31932 pontos | |
| 3DMark Fire Strike Score | 10797 pontos | |
Ajuda | ||
| BioShock Infinite | |
| 1920x1080 Ultra Preset, DX11 (DDOF) | |
| Aorus 15 X9 | |
| Alienware m15 P79F | |
| Média NVIDIA GeForce RTX 2070 Max-Q (115.8 - 211, n=15) | |
| HP Omen 15-dc0015ng | |
| Dell G5 15 5590 | |
| HP Omen 15-dc1303ng | |
| 1366x768 High Preset | |
| HP Omen 15-dc0015ng | |
| Média NVIDIA GeForce RTX 2070 Max-Q (203 - 297, n=14) | |
| HP Omen 15-dc1303ng | |
| Alienware m15 P79F | |
| Dell G5 15 5590 | |
| Aorus 15 X9 | |
| Dota 2 Reborn | |
| 1920x1080 ultra (3/3) best looking | |
| Média da turma Gaming (84.8 - 252, n=104, últimos 2 anos) | |
| Média NVIDIA GeForce RTX 2070 Max-Q (105.8 - 126, n=13) | |
| HP Omen 15-dc0015ng | |
| HP Omen 15-dc1303ng | |
| 1920x1080 high (2/3) | |
| Média da turma Gaming (82.8 - 280, n=103, últimos 2 anos) | |
| Média NVIDIA GeForce RTX 2070 Max-Q (111.4 - 135, n=13) | |
| HP Omen 15-dc0015ng | |
| HP Omen 15-dc1303ng | |
| Anno 1800 | |
| 1920x1080 Ultra Graphics Quality (DX11) | |
| Média da turma Gaming (n=1últimos 2 anos) | |
| Dell G5 15 5590 | |
| Média NVIDIA GeForce RTX 2070 Max-Q (28.5 - 40, n=5) | |
| HP Omen 15-dc1303ng | |
| 1920x1080 High Graphics Quality (DX11) | |
| Média da turma Gaming (n=1últimos 2 anos) | |
| Média NVIDIA GeForce RTX 2070 Max-Q (58.5 - 70.6, n=4) | |
| Dell G5 15 5590 | |
| HP Omen 15-dc1303ng | |
| baixo | média | alto | ultra | |
|---|---|---|---|---|
| BioShock Infinite (2013) | 308.7 | 264.3 | 244.6 | 115.8 |
| Dota 2 Reborn (2015) | 126.5 | 117.4 | 111.4 | 105.8 |
| Anno 1800 (2019) | 58.5 | 28.45 |
Barulho
| Ocioso |
| 32.8 / 32.8 / 32.8 dB |
| Carga |
| 42.5 / 47.5 dB |
 | ||
30 dB silencioso 40 dB(A) audível 50 dB(A) ruidosamente alto |
||
min: | ||
(-) A temperatura máxima no lado superior é 47.6 °C / 118 F, em comparação com a média de 40.4 °C / 105 F , variando de 21.2 a 68.8 °C para a classe Gaming.
(-) A parte inferior aquece até um máximo de 59.6 °C / 139 F, em comparação com a média de 43.2 °C / 110 F
(+) Em uso inativo, a temperatura média para o lado superior é 31.6 °C / 89 F, em comparação com a média do dispositivo de 33.9 °C / ### class_avg_f### F.
(+) Os apoios para as mãos e o touchpad estão atingindo a temperatura máxima da pele (33 °C / 91.4 F) e, portanto, não estão quentes.
(-) A temperatura média da área do apoio para as mãos de dispositivos semelhantes foi 28.8 °C / 83.8 F (-4.2 °C / -7.6 F).
HP Omen 15-dc1303ng análise de áudio
(-) | alto-falantes não muito altos (###valor### dB)
Graves 100 - 315Hz
(-) | quase nenhum baixo - em média 20.2% menor que a mediana
(±) | a linearidade dos graves é média (11.4% delta para a frequência anterior)
Médios 400 - 2.000 Hz
(+) | médios equilibrados - apenas 2.2% longe da mediana
(±) | a linearidade dos médios é média (8.2% delta para frequência anterior)
Altos 2 - 16 kHz
(+) | agudos equilibrados - apenas 2.5% longe da mediana
(+) | os máximos são lineares (5.9% delta da frequência anterior)
Geral 100 - 16.000 Hz
(±) | a linearidade do som geral é média (20.3% diferença em relação à mediana)
Comparado com a mesma classe
» 72% de todos os dispositivos testados nesta classe foram melhores, 6% semelhantes, 23% piores
» O melhor teve um delta de 6%, a média foi 18%, o pior foi 132%
Comparado com todos os dispositivos testados
» 53% de todos os dispositivos testados foram melhores, 8% semelhantes, 39% piores
» O melhor teve um delta de 4%, a média foi 23%, o pior foi 134%
Apple MacBook 12 (Early 2016) 1.1 GHz análise de áudio
(+) | os alto-falantes podem tocar relativamente alto (###valor### dB)
Graves 100 - 315Hz
(±) | graves reduzidos - em média 11.3% menor que a mediana
(±) | a linearidade dos graves é média (14.2% delta para a frequência anterior)
Médios 400 - 2.000 Hz
(+) | médios equilibrados - apenas 2.4% longe da mediana
(+) | médios são lineares (5.5% delta para frequência anterior)
Altos 2 - 16 kHz
(+) | agudos equilibrados - apenas 2% longe da mediana
(+) | os máximos são lineares (4.5% delta da frequência anterior)
Geral 100 - 16.000 Hz
(+) | o som geral é linear (10.2% diferença em relação à mediana)
Comparado com a mesma classe
» 7% de todos os dispositivos testados nesta classe foram melhores, 2% semelhantes, 90% piores
» O melhor teve um delta de 5%, a média foi 18%, o pior foi 53%
Comparado com todos os dispositivos testados
» 5% de todos os dispositivos testados foram melhores, 1% semelhantes, 94% piores
» O melhor teve um delta de 4%, a média foi 23%, o pior foi 134%
| desligado | |
| Ocioso | |
| Carga |
|
Key:
min: | |
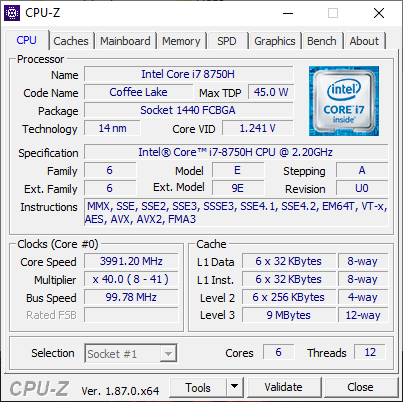
| HP Omen 15-dc1303ng i7-8750H, GeForce RTX 2070 Max-Q, Samsung SSD PM981 MZVLB256HAHQ, IPS, 1920x1080, 15.6" | Aorus 15 X9 i7-8750H, GeForce RTX 2070 Mobile, Intel SSD 760p SSDPEKKW512G8, IPS, 1920x1080, 15.6" | Alienware m15 P79F i7-8750H, GeForce RTX 2070 Max-Q, Toshiba XG5 KXG50ZNV512G, OLED, 3840x2160, 15.6" | Dell G5 15 5590 i7-8750H, GeForce RTX 2060 Mobile, KBG30ZMS128G, IPS, 1920x1080, 15.6" | HP Omen 15-dc0015ng i7-8750H, GeForce GTX 1070 Max-Q, Toshiba XG5 KXG50ZNV512G, IPS, 1920x1080, 15.6" | Média NVIDIA GeForce RTX 2070 Max-Q | Média da turma Gaming | |
|---|---|---|---|---|---|---|---|
| Power Consumption | -60% | -4% | 22% | -23% | -23% | -28% | |
| Idle Minimum * (Watt) | 14.7 | 26 -77% | 10.9 26% | 3.5 76% | 14 5% | 15.4 ? -5% | 13.1 ? 11% |
| Idle Average * (Watt) | 18.6 | 30.8 -66% | 12.3 34% | 6.9 63% | 18.2 2% | 20 ? -8% | 19 ? -2% |
| Idle Maximum * (Watt) | 22.6 | 34.9 -54% | 19 16% | 8.5 62% | 24 -6% | 26.7 ? -18% | 24.6 ? -9% |
| Load Average * (Watt) | 90 | 90.7 -1% | 96 -7% | 127 -41% | 143 -59% | 105.2 ? -17% | 111.3 ? -24% |
| Load Maximum * (Watt) | 120 | 241.2 -101% | 229.1 -91% | 179 -49% | 190 -58% | 201 ? -68% | 260 ? -117% |
| Witcher 3 ultra * (Watt) | 175 | 161.7 | 126 |
* ... menor é melhor
| HP Omen 15-dc1303ng i7-8750H, GeForce RTX 2070 Max-Q, 70 Wh | Aorus 15 X9 i7-8750H, GeForce RTX 2070 Mobile, 62 Wh | Alienware m15 P79F i7-8750H, GeForce RTX 2070 Max-Q, 90 Wh | Dell G5 15 5590 i7-8750H, GeForce RTX 2060 Mobile, 60 Wh | HP Omen 15-dc0015ng i7-8750H, GeForce GTX 1070 Max-Q, 70.07 Wh | Média da turma Gaming | |
|---|---|---|---|---|---|---|
| Duração da bateria | -44% | 58% | 154% | 53% | 66% | |
| Reader / Idle (h) | 5 | 1.8 -64% | 14.8 196% | 7.7 54% | 7.84 ? 57% | |
| WiFi v1.3 (h) | 3.3 | 1.6 -52% | 5.2 58% | 7.7 133% | 4.6 39% | 7.08 ? 115% |
| Load (h) | 1.2 | 1 -17% | 2.8 133% | 2 67% | 1.496 ? 25% |
Pro
Contra
O HP Omen 15 continua sendo um portátil sólido para jogos. O dc1303ng mantém os pontos fortes do seu antecessor, tendo consideravelmente mais potência sob o capô. O dispositivo também funciona de forma comparativamente silenciosa sob uso intenso, o que sempre gostamos de ver. É relativamente simples de atualizar ou reparar, sendo possível substituir a RAM, o armazenamento ou a placa Wi-Fi, entre outros componentes. No entanto, algumas pessoas podem achar a remoção da placa inferior um pouco complicada.
O HP Omen 15-dc1303ng tem uma boa relação qualidade/preço, com seu poderoso hardware fazendo bom uso de sua tela 1080p de 144 Hz. Uma fraca relação de contraste e duração fraca da bateria levam embora o brilho deste portátil para jogos.
O Omen 15 tem uma duração de bateria surpreendentemente baixa, especialmente considerando que a HP incluiu uma bateria de 70 Wh. Além disso, apesar de gostarmos de que o fabricante tenha incluído um painel de 144 Hz sem PWM, sua baixa relação de contraste e alto valor de preto são decepcionantes.
No geral, o HP Omen 15-dc1303ng é um portátil de jogos projetado para aqueles que somente planejam jogar com uma tomada de energia por perto ou com o dispositivo conectado a um monitor externo. O RTX 2070 Max-Q e hexa-core por 2.000 Euros (~US$ 2.279) ainda oferecem um bom valor pelo dinheiro.
HP Omen 15-dc1303ng
- 06/24/2019 v6 (old)
Mike Wobker
Price comparison
