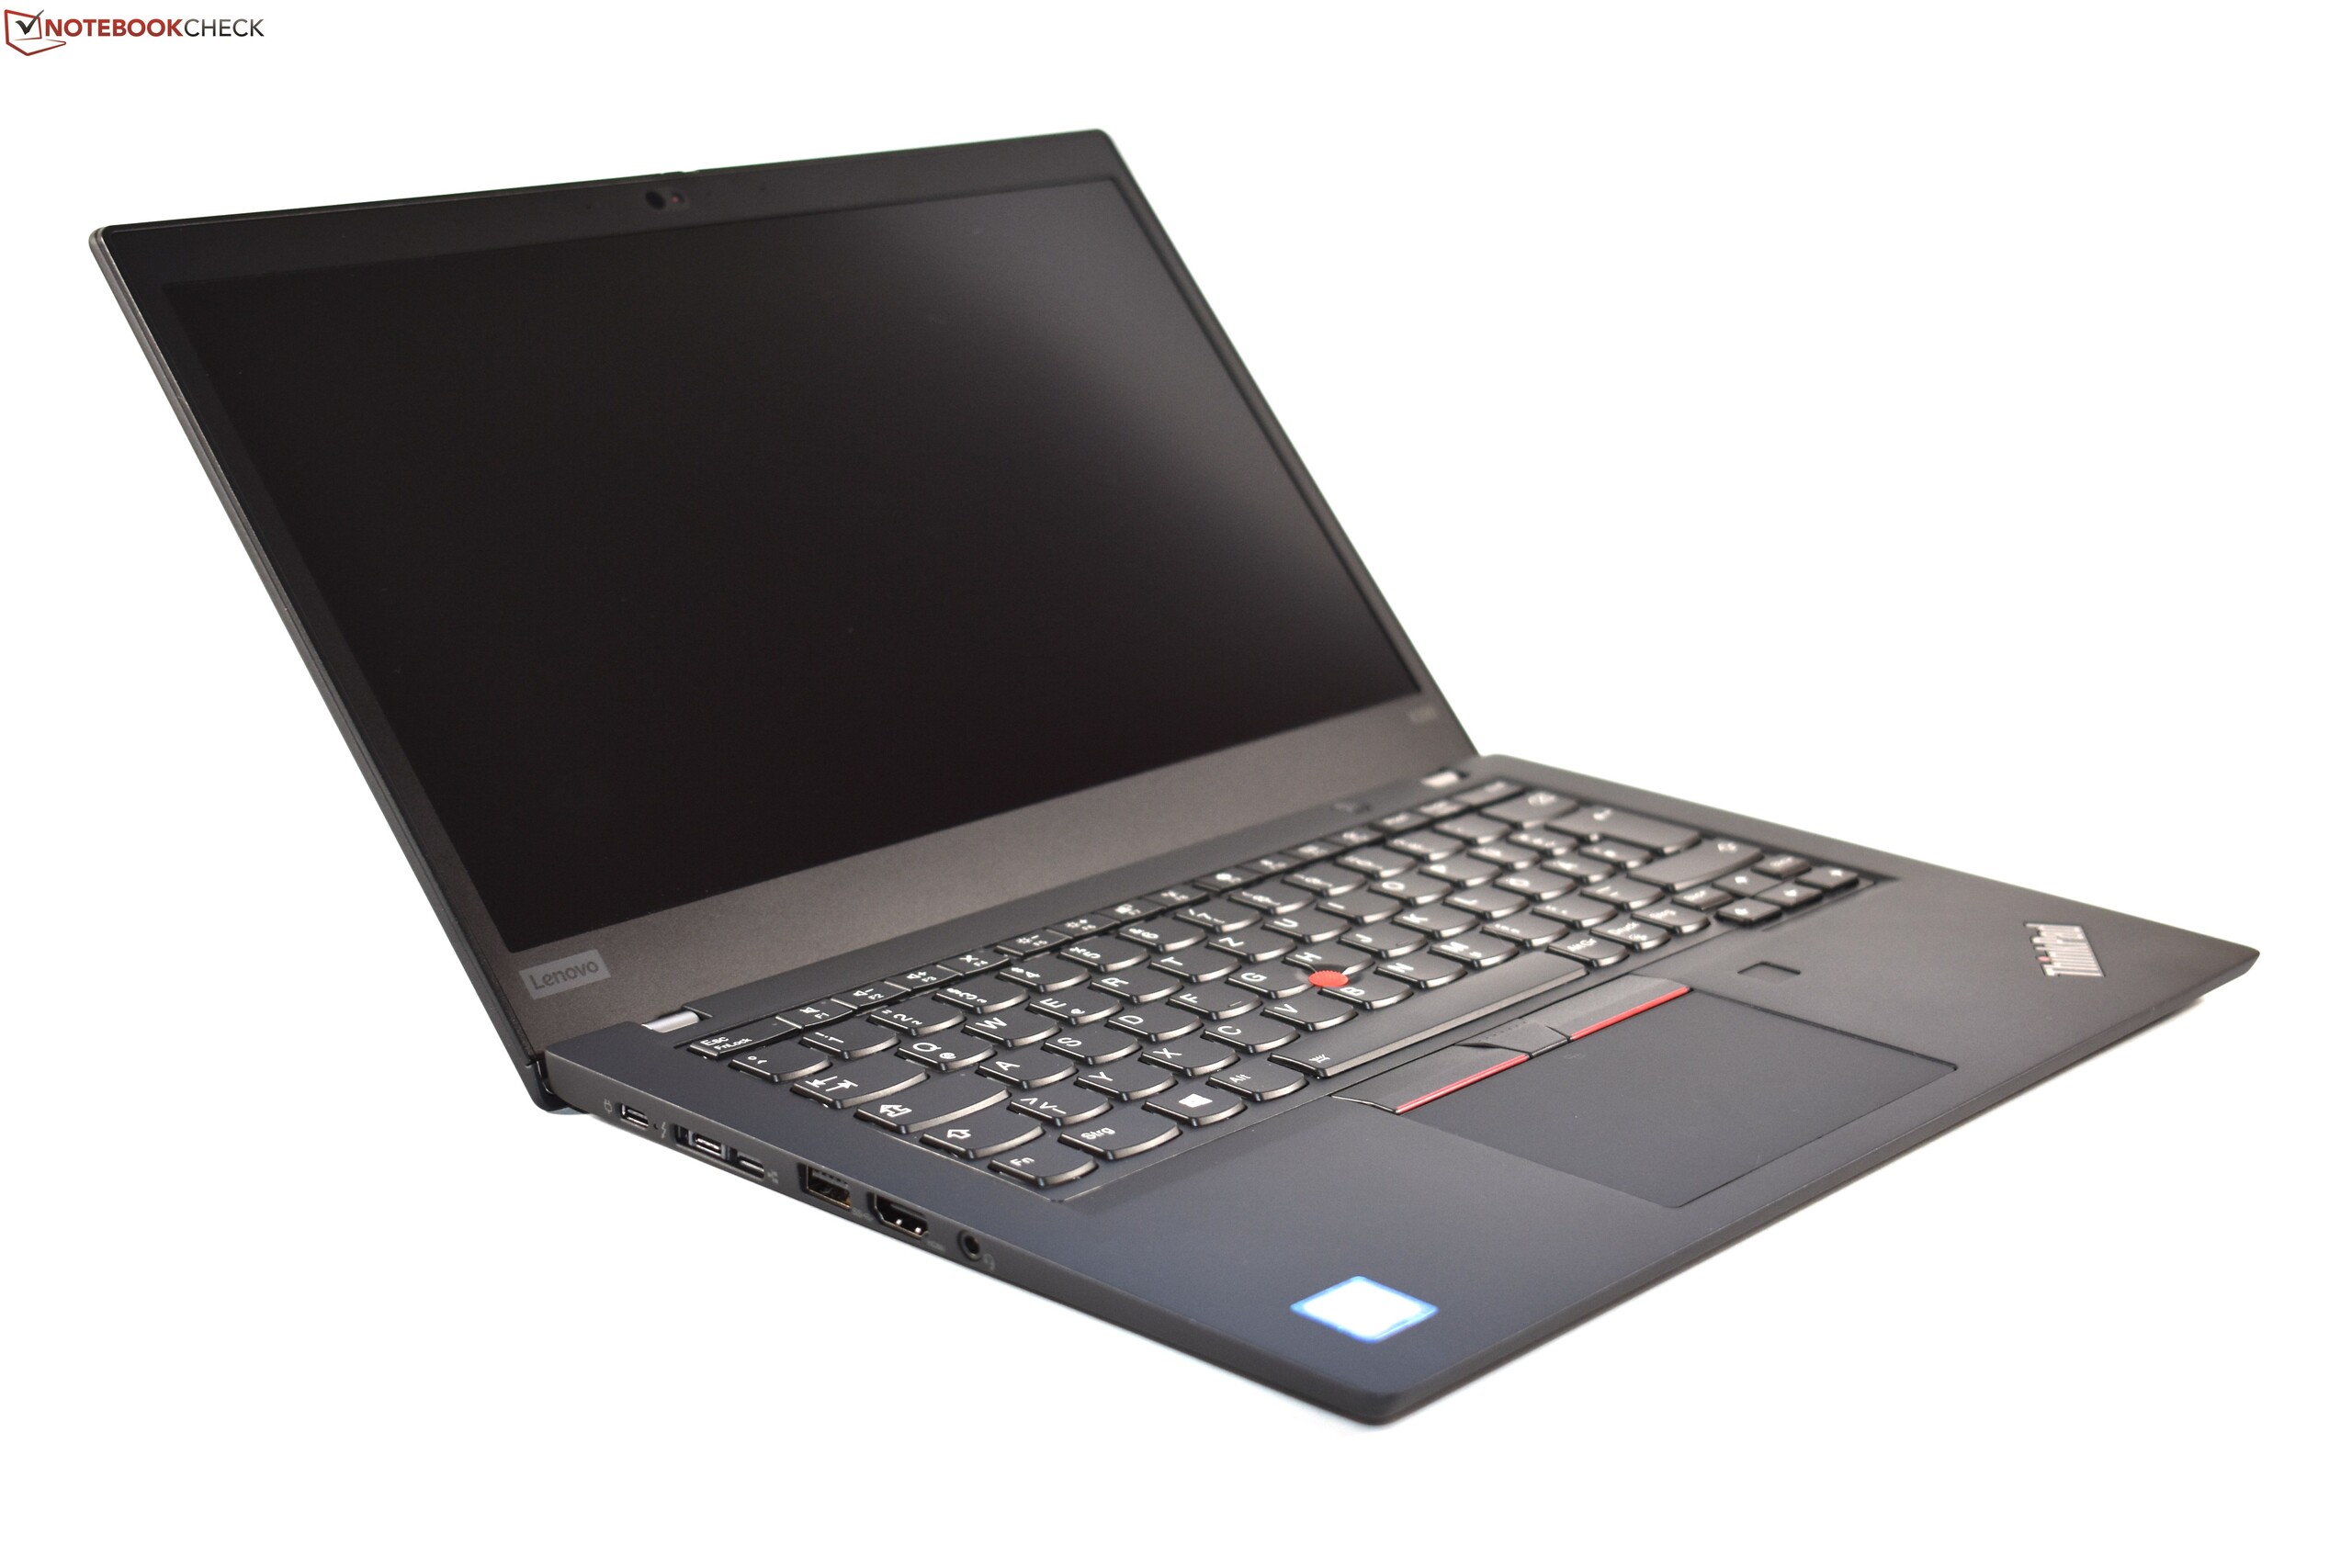
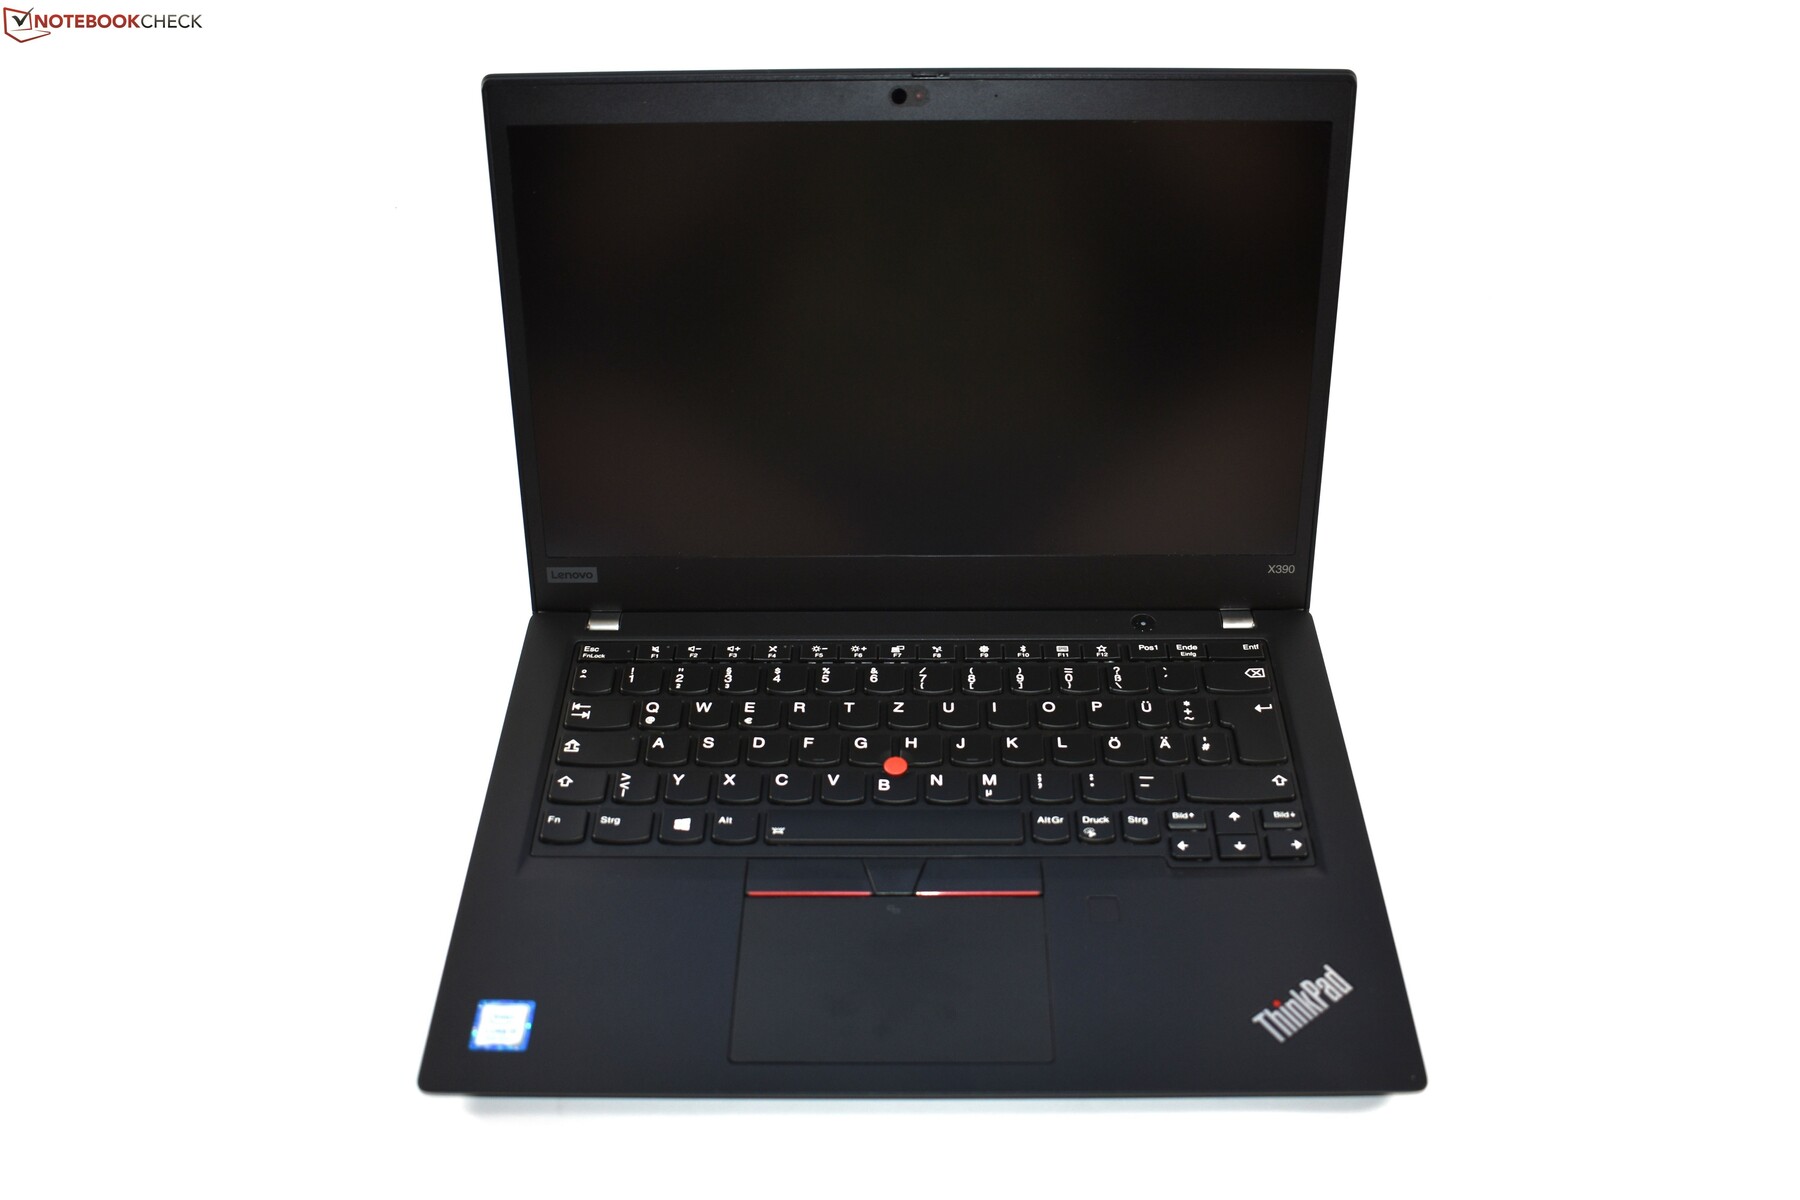
Breve Análise do Portátil Lenovo ThinkPad X390 (i5-8265U, FHD)
| SD Card Reader | |
| average JPG Copy Test (av. of 3 runs) | |
| Lenovo ThinkPad X1 Carbon 2018-20KGS03900 (Toshiba Exceria Pro M501) | |
| Dell Latitude 7390 (Toshiba Exceria Pro M501) | |
| Lenovo ThinkPad X390-20Q1S02M00 (Toshiba Exceria Pro M501) | |
| Lenovo ThinkPad X280-20KES01S00 (Toshiba Excerie Pro M501) | |
| Média da turma Subnotebook (23.7 - 188, n=9, últimos 2 anos) | |
| Lenovo ThinkPad T490s-20NYS02A00 (Toshiba Exceria Pro M501) | |
| maximum AS SSD Seq Read Test (1GB) | |
| Lenovo ThinkPad X1 Carbon 2018-20KGS03900 (Toshiba Exceria Pro M501) | |
| Dell Latitude 7390 (Toshiba Exceria Pro M501) | |
| Média da turma Subnotebook (24.9 - 195, n=8, últimos 2 anos) | |
| Lenovo ThinkPad T490s-20NYS02A00 (Toshiba Exceria Pro M501) | |
| Lenovo ThinkPad X390-20Q1S02M00 (Toshiba Exceria Pro M501) | |
| Lenovo ThinkPad X280-20KES01S00 (Toshiba Excerie Pro M501) | |
| |||||||||||||||||||||||||
iluminação: 88 %
iluminação com acumulador: 355 cd/m²
Contraste: 2225:1 (Preto: 0.16 cd/m²)
ΔE ColorChecker Calman: 3.6 | ∀{0.5-29.43 Ø4.72}
calibrated: 1.1
ΔE Greyscale Calman: 4.7 | ∀{0.09-98 Ø4.97}
95.7% sRGB (Argyll 1.6.3 3D)
61.3% AdobeRGB 1998 (Argyll 1.6.3 3D)
66.6% AdobeRGB 1998 (Argyll 3D)
95.9% sRGB (Argyll 3D)
65.3% Display P3 (Argyll 3D)
Gamma: 2.48
CCT: 6374 K
| Lenovo ThinkPad X390-20Q1S02M00 LP133WF7-SPB1, , 1920x1080, 13.3" | Lenovo ThinkPad X280-20KES01S00 B125HAN02.2, , 1920x1080, 12.5" | Lenovo ThinkPad T490s-20NYS02A00 B140HAN05.7, , 1920x1080, 14" | Lenovo ThinkPad X1 Carbon G6-20KG0025UK Lenovo LEN40A9 / AUO B140HAK02.3, , 1920x1080, 14" | HP EliteBook 830 G5-3JX74EA IVO M133NVF3-R0, , 1920x1080, 13.3" | Dell Latitude 7390 AU Optronics AUO462D / B133HAN [DELL P/N:F7VDJ], , 1920x1080, 13.3" | |
|---|---|---|---|---|---|---|
| Display | -33% | 3% | 3% | -4% | -2% | |
| Display P3 Coverage (%) | 65.3 | 44 -33% | 67.1 3% | 68.3 5% | 64.2 -2% | 65.1 0% |
| sRGB Coverage (%) | 95.9 | 64.5 -33% | 97.6 2% | 94.9 -1% | 89.2 -7% | 90.8 -5% |
| AdobeRGB 1998 Coverage (%) | 66.6 | 45.45 -32% | 68.5 3% | 69.3 4% | 65.2 -2% | 65.9 -1% |
| Response Times | 22% | -11% | 29% | 32% | 6% | |
| Response Time Grey 50% / Grey 80% * (ms) | 57.6 ? | 40 ? 31% | 61.6 ? -7% | 40 ? 31% | 36 ? 37% | 48.8 ? 15% |
| Response Time Black / White * (ms) | 34 ? | 29.6 ? 13% | 38.8 ? -14% | 25 ? 26% | 24.8 ? 27% | 35.2 ? -4% |
| PWM Frequency (Hz) | 1020 ? | |||||
| Screen | -41% | -0% | -2% | -36% | -25% | |
| Brightness middle (cd/m²) | 356 | 344 -3% | 391 10% | 298 -16% | 316 -11% | 329 -8% |
| Brightness (cd/m²) | 336 | 313 -7% | 389 16% | 287 -15% | 326 -3% | 316 -6% |
| Brightness Distribution (%) | 88 | 82 -7% | 87 -1% | 91 3% | 85 -3% | 92 5% |
| Black Level * (cd/m²) | 0.16 | 0.25 -56% | 0.23 -44% | 0.2 -25% | 0.19 -19% | 0.25 -56% |
| Contrast (:1) | 2225 | 1376 -38% | 1700 -24% | 1490 -33% | 1663 -25% | 1316 -41% |
| Colorchecker dE 2000 * | 3.6 | 4.7 -31% | 3.4 6% | 2.19 39% | 4.5 -25% | 4.3 -19% |
| Colorchecker dE 2000 max. * | 5.5 | 19.4 -253% | 4.7 15% | 4.39 20% | 12.1 -120% | 7.8 -42% |
| Colorchecker dE 2000 calibrated * | 1.1 | 1.1 -0% | 1.67 -52% | 2.9 -164% | 2.5 -127% | |
| Greyscale dE 2000 * | 4.7 | 2.2 53% | 4 15% | 1.97 58% | 5 -6% | 3.6 23% |
| Gamma | 2.48 89% | 2.16 102% | 2.49 88% | 2.43 91% | 2.22 99% | 2.43 91% |
| CCT | 6374 102% | 6252 104% | 6809 95% | 6571 99% | 6018 108% | 6928 94% |
| Color Space (Percent of AdobeRGB 1998) (%) | 61.3 | 41.2 -33% | 62.4 2% | 62 1% | 57.9 -6% | 59.1 -4% |
| Color Space (Percent of sRGB) (%) | 95.7 | 64.1 -33% | 97.4 2% | 95 -1% | 87.3 -9% | 90.6 -5% |
| Média Total (Programa/Configurações) | -17% /
-31% | -3% /
-1% | 10% /
3% | -3% /
-21% | -7% /
-17% |
* ... menor é melhor
Exibir tempos de resposta
| ↔ Tempo de resposta preto para branco | ||
|---|---|---|
| 34 ms ... ascensão ↗ e queda ↘ combinadas | ↗ 18.4 ms ascensão | 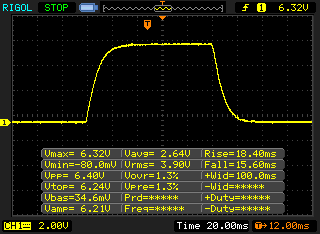 |
| ↘ 15.6 ms queda | ||
| A tela mostra taxas de resposta lentas em nossos testes e será insatisfatória para os jogadores. Em comparação, todos os dispositivos testados variam de 0.1 (mínimo) a 240 (máximo) ms. » 91 % de todos os dispositivos são melhores. Isso significa que o tempo de resposta medido é pior que a média de todos os dispositivos testados (19.8 ms). | ||
| ↔ Tempo de resposta 50% cinza a 80% cinza | ||
| 57.6 ms ... ascensão ↗ e queda ↘ combinadas | ↗ 28.4 ms ascensão | 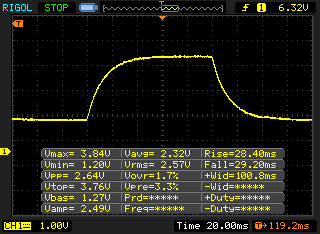 |
| ↘ 29.2 ms queda | ||
| A tela mostra taxas de resposta lentas em nossos testes e será insatisfatória para os jogadores. Em comparação, todos os dispositivos testados variam de 0.165 (mínimo) a 636 (máximo) ms. » 94 % de todos os dispositivos são melhores. Isso significa que o tempo de resposta medido é pior que a média de todos os dispositivos testados (31 ms). | ||
Cintilação da tela / PWM (modulação por largura de pulso)
| Tela tremeluzindo / PWM não detectado | 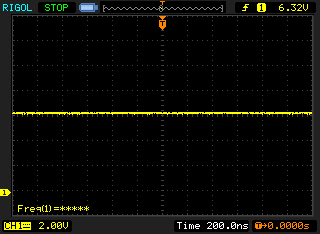 | ||
[pwm_comparison] Em comparação: 52 % de todos os dispositivos testados não usam PWM para escurecer a tela. Se PWM foi detectado, uma média de 7778 (mínimo: 5 - máximo: 343500) Hz foi medida. | |||
| PCMark 8 Home Score Accelerated v2 | 3629 pontos | |
| PCMark 8 Work Score Accelerated v2 | 4896 pontos | |
| PCMark 10 Score | 3832 pontos | |
Ajuda | ||
| Lenovo ThinkPad X390-20Q1S02M00 Intel SSD Pro 7600p SSDPEKKF512G8L | Lenovo ThinkPad X280-20KES01S00 Samsung SSD PM981 MZVLB512HAJQ | Lenovo ThinkPad X1 Carbon 2018-20KGS03900 Samsung SSD PM981 MZVLB512HAJQ | HP EliteBook 830 G5-3JX74EA Samsung SSD PM961 1TB M.2 PCIe 3.0 x4 NVMe (MZVLW1T0) | Dell Latitude 7390 Samsung PM961 MZVLW256HEHP | Média Intel SSD Pro 7600p SSDPEKKF512G8L | |
|---|---|---|---|---|---|---|
| CrystalDiskMark 5.2 / 6 | 11% | 9% | -1% | 13% | 6% | |
| Write 4K (MB/s) | 120.7 | 125.3 4% | 131.9 9% | 108.5 -10% | 139.4 15% | 133.9 ? 11% |
| Read 4K (MB/s) | 58.5 | 43.5 -26% | 44.6 -24% | 40.53 -31% | 43.18 -26% | 59.1 ? 1% |
| Write Seq (MB/s) | 1491 | 112 -92% | 1824 22% | 1026 -31% | 1075 -28% | 1378 ? -8% |
| Read Seq (MB/s) | 2760 | 2273 -18% | 2163 -22% | 2080 -25% | 1639 -41% | 2341 ? -15% |
| Write 4K Q32T1 (MB/s) | 237.5 | 641 170% | 338.1 42% | 451 90% | 662 179% | 355 ? 49% |
| Read 4K Q32T1 (MB/s) | 336.1 | 392 17% | 351.9 5% | 269.7 -20% | 413.9 23% | 429 ? 28% |
| Write Seq Q32T1 (MB/s) | 1512 | 1903 26% | 1972 30% | 1770 17% | 1195 -21% | 1514 ? 0% |
| Read Seq Q32T1 (MB/s) | 3154 | 3398 8% | 3387 7% | 3214 2% | 3116 -1% | 2677 ? -15% |

| 3DMark 11 Performance | 2062 pontos | |
| 3DMark Cloud Gate Standard Score | 8361 pontos | |
| 3DMark Fire Strike Score | 1115 pontos | |
Ajuda | ||
| baixo | média | alto | ultra | |
|---|---|---|---|---|
| BioShock Infinite (2013) | 79.3 | 37.4 | 31.3 | 10.3 |
| The Witcher 3 (2015) | 16.9 | |||
| Rise of the Tomb Raider (2016) | 25.7 | 14.9 | ||
| Civilization 6 (2016) | 54.4 | 20.3 | ||
| F1 2018 (2018) | 33 | 15 |
Barulho
| Ocioso |
| 29.2 / 29.2 / 29.2 dB |
| Carga |
| 34.8 / 34.8 dB |
 | ||
30 dB silencioso 40 dB(A) audível 50 dB(A) ruidosamente alto |
||
min: | ||
(±) A temperatura máxima no lado superior é 44.6 °C / 112 F, em comparação com a média de 35.9 °C / 97 F , variando de 21.4 a 59 °C para a classe Subnotebook.
(±) A parte inferior aquece até um máximo de 41.1 °C / 106 F, em comparação com a média de 39.2 °C / 103 F
(+) Em uso inativo, a temperatura média para o lado superior é 22.8 °C / 73 F, em comparação com a média do dispositivo de 30.8 °C / ### class_avg_f### F.
(+) Os apoios para as mãos e o touchpad estão atingindo a temperatura máxima da pele (32.8 °C / 91 F) e, portanto, não estão quentes.
(-) A temperatura média da área do apoio para as mãos de dispositivos semelhantes foi 28.2 °C / 82.8 F (-4.6 °C / -8.2 F).
Lenovo ThinkPad X390-20Q1S02M00 análise de áudio
(±) | o volume do alto-falante é médio, mas bom (###valor### dB)
Graves 100 - 315Hz
(-) | quase nenhum baixo - em média 20.8% menor que a mediana
(±) | a linearidade dos graves é média (13.6% delta para a frequência anterior)
Médios 400 - 2.000 Hz
(+) | médios equilibrados - apenas 2.3% longe da mediana
(+) | médios são lineares (5.5% delta para frequência anterior)
Altos 2 - 16 kHz
(+) | agudos equilibrados - apenas 2.4% longe da mediana
(+) | os máximos são lineares (6.1% delta da frequência anterior)
Geral 100 - 16.000 Hz
(±) | a linearidade do som geral é média (20.5% diferença em relação à mediana)
Comparado com a mesma classe
» 66% de todos os dispositivos testados nesta classe foram melhores, 7% semelhantes, 27% piores
» O melhor teve um delta de 5%, a média foi 18%, o pior foi 53%
Comparado com todos os dispositivos testados
» 54% de todos os dispositivos testados foram melhores, 8% semelhantes, 38% piores
» O melhor teve um delta de 4%, a média foi 24%, o pior foi 134%
HP EliteBook 830 G5-3JX74EA análise de áudio
(+) | os alto-falantes podem tocar relativamente alto (###valor### dB)
Graves 100 - 315Hz
(-) | quase nenhum baixo - em média 19.9% menor que a mediana
(±) | a linearidade dos graves é média (11.3% delta para a frequência anterior)
Médios 400 - 2.000 Hz
(+) | médios equilibrados - apenas 2.3% longe da mediana
(+) | médios são lineares (4.8% delta para frequência anterior)
Altos 2 - 16 kHz
(+) | agudos equilibrados - apenas 4% longe da mediana
(+) | os máximos são lineares (5.6% delta da frequência anterior)
Geral 100 - 16.000 Hz
(±) | a linearidade do som geral é média (17% diferença em relação à mediana)
Comparado com a mesma classe
» 43% de todos os dispositivos testados nesta classe foram melhores, 8% semelhantes, 49% piores
» O melhor teve um delta de 5%, a média foi 18%, o pior foi 53%
Comparado com todos os dispositivos testados
» 30% de todos os dispositivos testados foram melhores, 8% semelhantes, 62% piores
» O melhor teve um delta de 4%, a média foi 24%, o pior foi 134%
| desligado | |
| Ocioso | |
| Carga |
|
Key:
min: | |
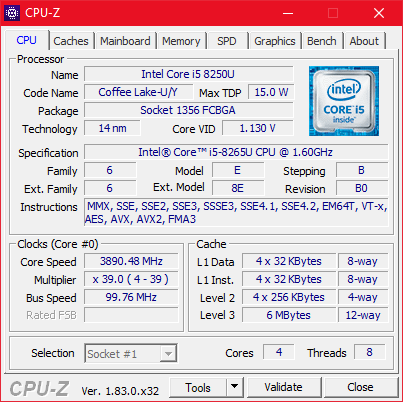
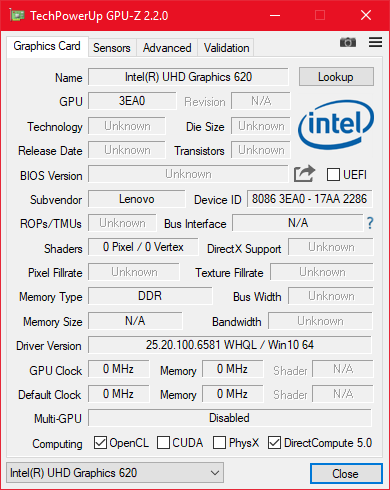
| Lenovo ThinkPad X390-20Q1S02M00 i5-8265U, UHD Graphics 620, Intel SSD Pro 7600p SSDPEKKF512G8L, IPS LED, 1920x1080, 13.3" | Lenovo ThinkPad X280-20KES01S00 i5-8250U, UHD Graphics 620, Samsung SSD PM981 MZVLB512HAJQ, IPS LED, 1920x1080, 12.5" | Lenovo ThinkPad X1 Carbon 2018-20KGS03900 i5-8550U, UHD Graphics 620, Samsung SSD PM981 MZVLB512HAJQ, IPS, 2560x1440, 14" | HP EliteBook 830 G5-3JX74EA i5-8550U, UHD Graphics 620, Samsung SSD PM961 1TB M.2 PCIe 3.0 x4 NVMe (MZVLW1T0), IPS LED, 1920x1080, 13.3" | Dell Latitude 7390 i5-8350U, UHD Graphics 620, SK hynix SC311 M.2, IPS, 1920x1080, 13.3" | Média Intel UHD Graphics 620 | Média da turma Subnotebook | |
|---|---|---|---|---|---|---|---|
| Power Consumption | 9% | -20% | -7% | 11% | 2% | -4% | |
| Idle Minimum * (Watt) | 3.4 | 3.11 9% | 3.8 -12% | 4.5 -32% | 2.34 31% | 3.81 ? -12% | 3.86 ? -14% |
| Idle Average * (Watt) | 5.6 | 5.01 11% | 8.9 -59% | 6.4 -14% | 5.6 -0% | 6.94 ? -24% | 6.61 ? -18% |
| Idle Maximum * (Watt) | 8.7 | 8.11 7% | 11.9 -37% | 9.2 -6% | 6.5 25% | 8.75 ? -1% | 8 ? 8% |
| Load Average * (Watt) | 43.6 | 44.6 -2% | 47.5 -9% | 35.7 18% | 43 1% | 35 ? 20% | 42.2 ? 3% |
| Load Maximum * (Watt) | 65 | 51.7 20% | 52.5 19% | 65.4 -1% | 67.4 -4% | 47.5 ? 27% | 64.5 ? 1% |
* ... menor é melhor
| Lenovo ThinkPad X390-20Q1S02M00 i5-8265U, UHD Graphics 620, 48 Wh | Lenovo ThinkPad X280-20KES01S00 i5-8250U, UHD Graphics 620, 50 Wh | Lenovo ThinkPad X1 Carbon 2018-20KGS03900 i5-8550U, UHD Graphics 620, 57 Wh | Lenovo ThinkPad T490s-20NYS02A00 i5-8265U, UHD Graphics 620, 57 Wh | HP EliteBook 830 G5-3JX74EA i5-8550U, UHD Graphics 620, 49 Wh | Dell Latitude 7390 i5-8350U, UHD Graphics 620, 60 Wh | Média da turma Subnotebook | |
|---|---|---|---|---|---|---|---|
| Duração da bateria | 2% | -3% | 12% | -2% | -4% | 38% | |
| H.264 (h) | 12.7 | 9.5 -25% | 9.4 -26% | 13.9 9% | 8 -37% | 12.5 -2% | 15.4 ? 21% |
| WiFi v1.3 (h) | 8.3 | 8.9 7% | 8.7 5% | 10.1 22% | 7.1 -14% | 14 ? 69% | |
| Load (h) | 1.6 | 2 25% | 1.8 13% | 1.7 6% | 2.3 44% | 1.5 -6% | 1.969 ? 23% |
| Reader / Idle (h) | 20.2 | 22.1 | 12.8 | 27.7 | 28.6 ? |
Pro
Contra
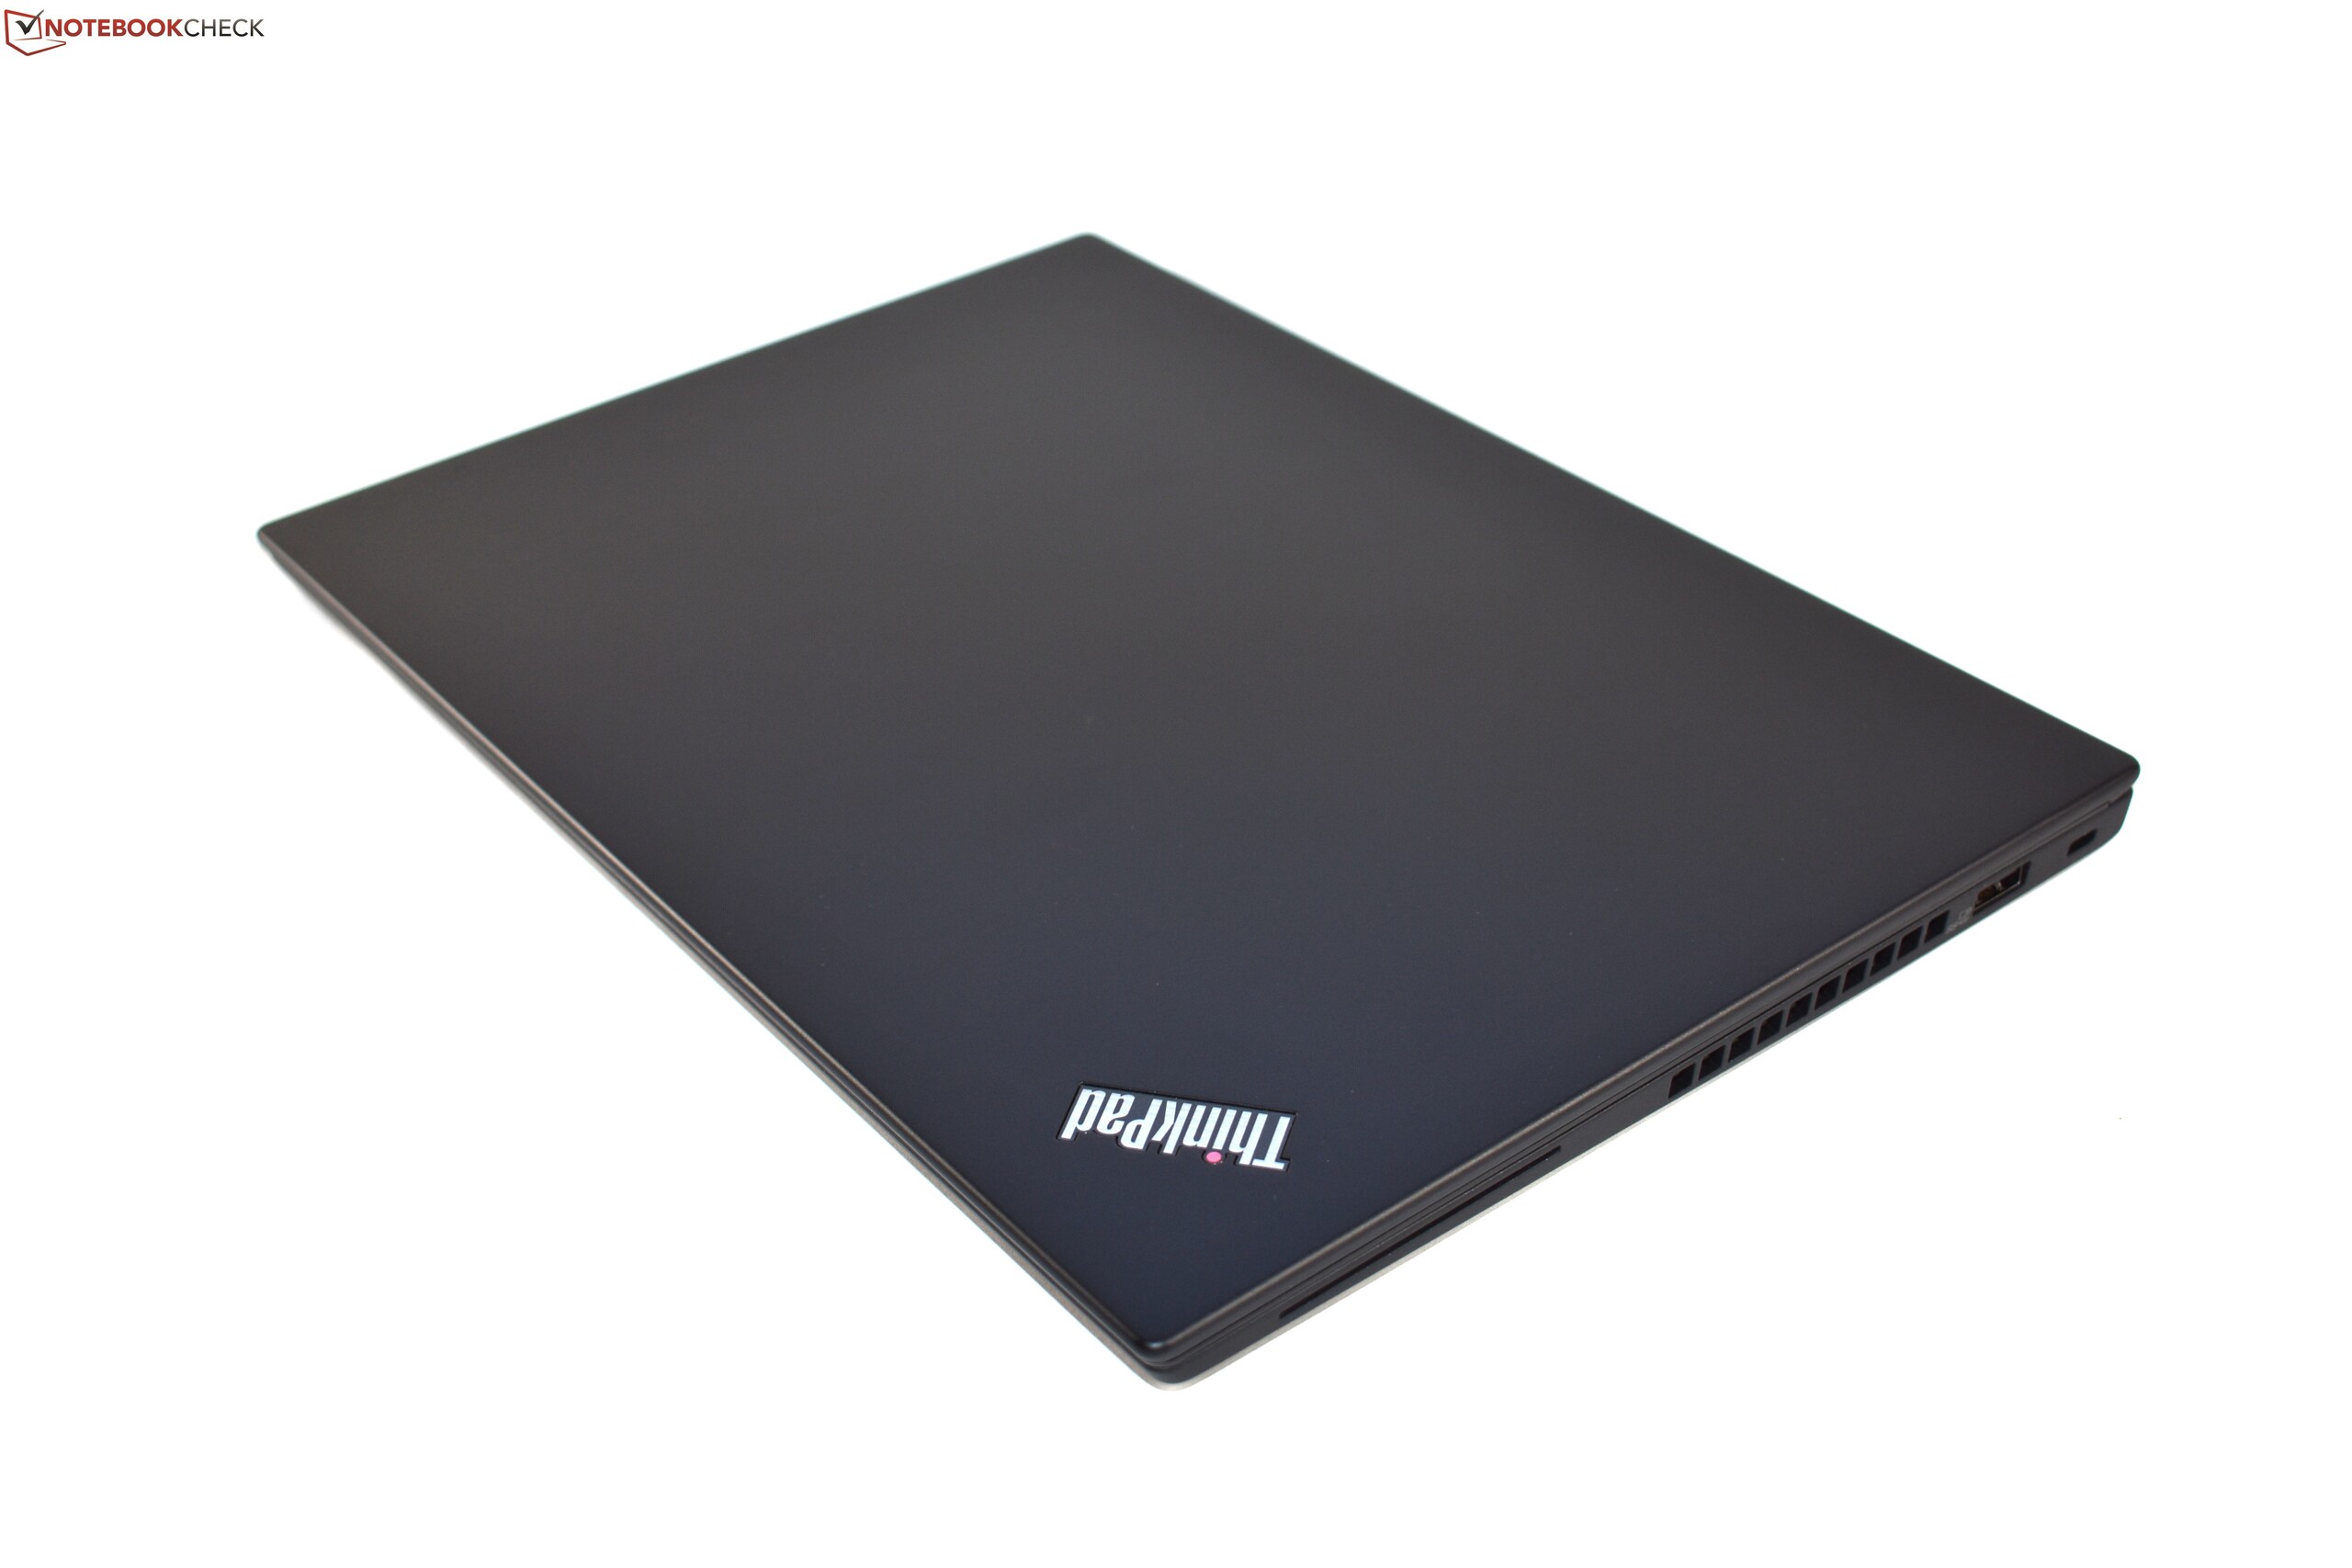
Quando o Lenovo ThinkPad X280 foi lançado no ano passado, perguntamos se um subportátil clássico de 12,5 polegadas estava obsoleto ou não. Esta questão é respondida agora com o lançamento do ThinkPad X390 - aparentemente, os compradores preferem telas maiores nos dias de hoje. Mas ainda existem algumas dúvidas sobre a viabilidade do ThinkPad X390.
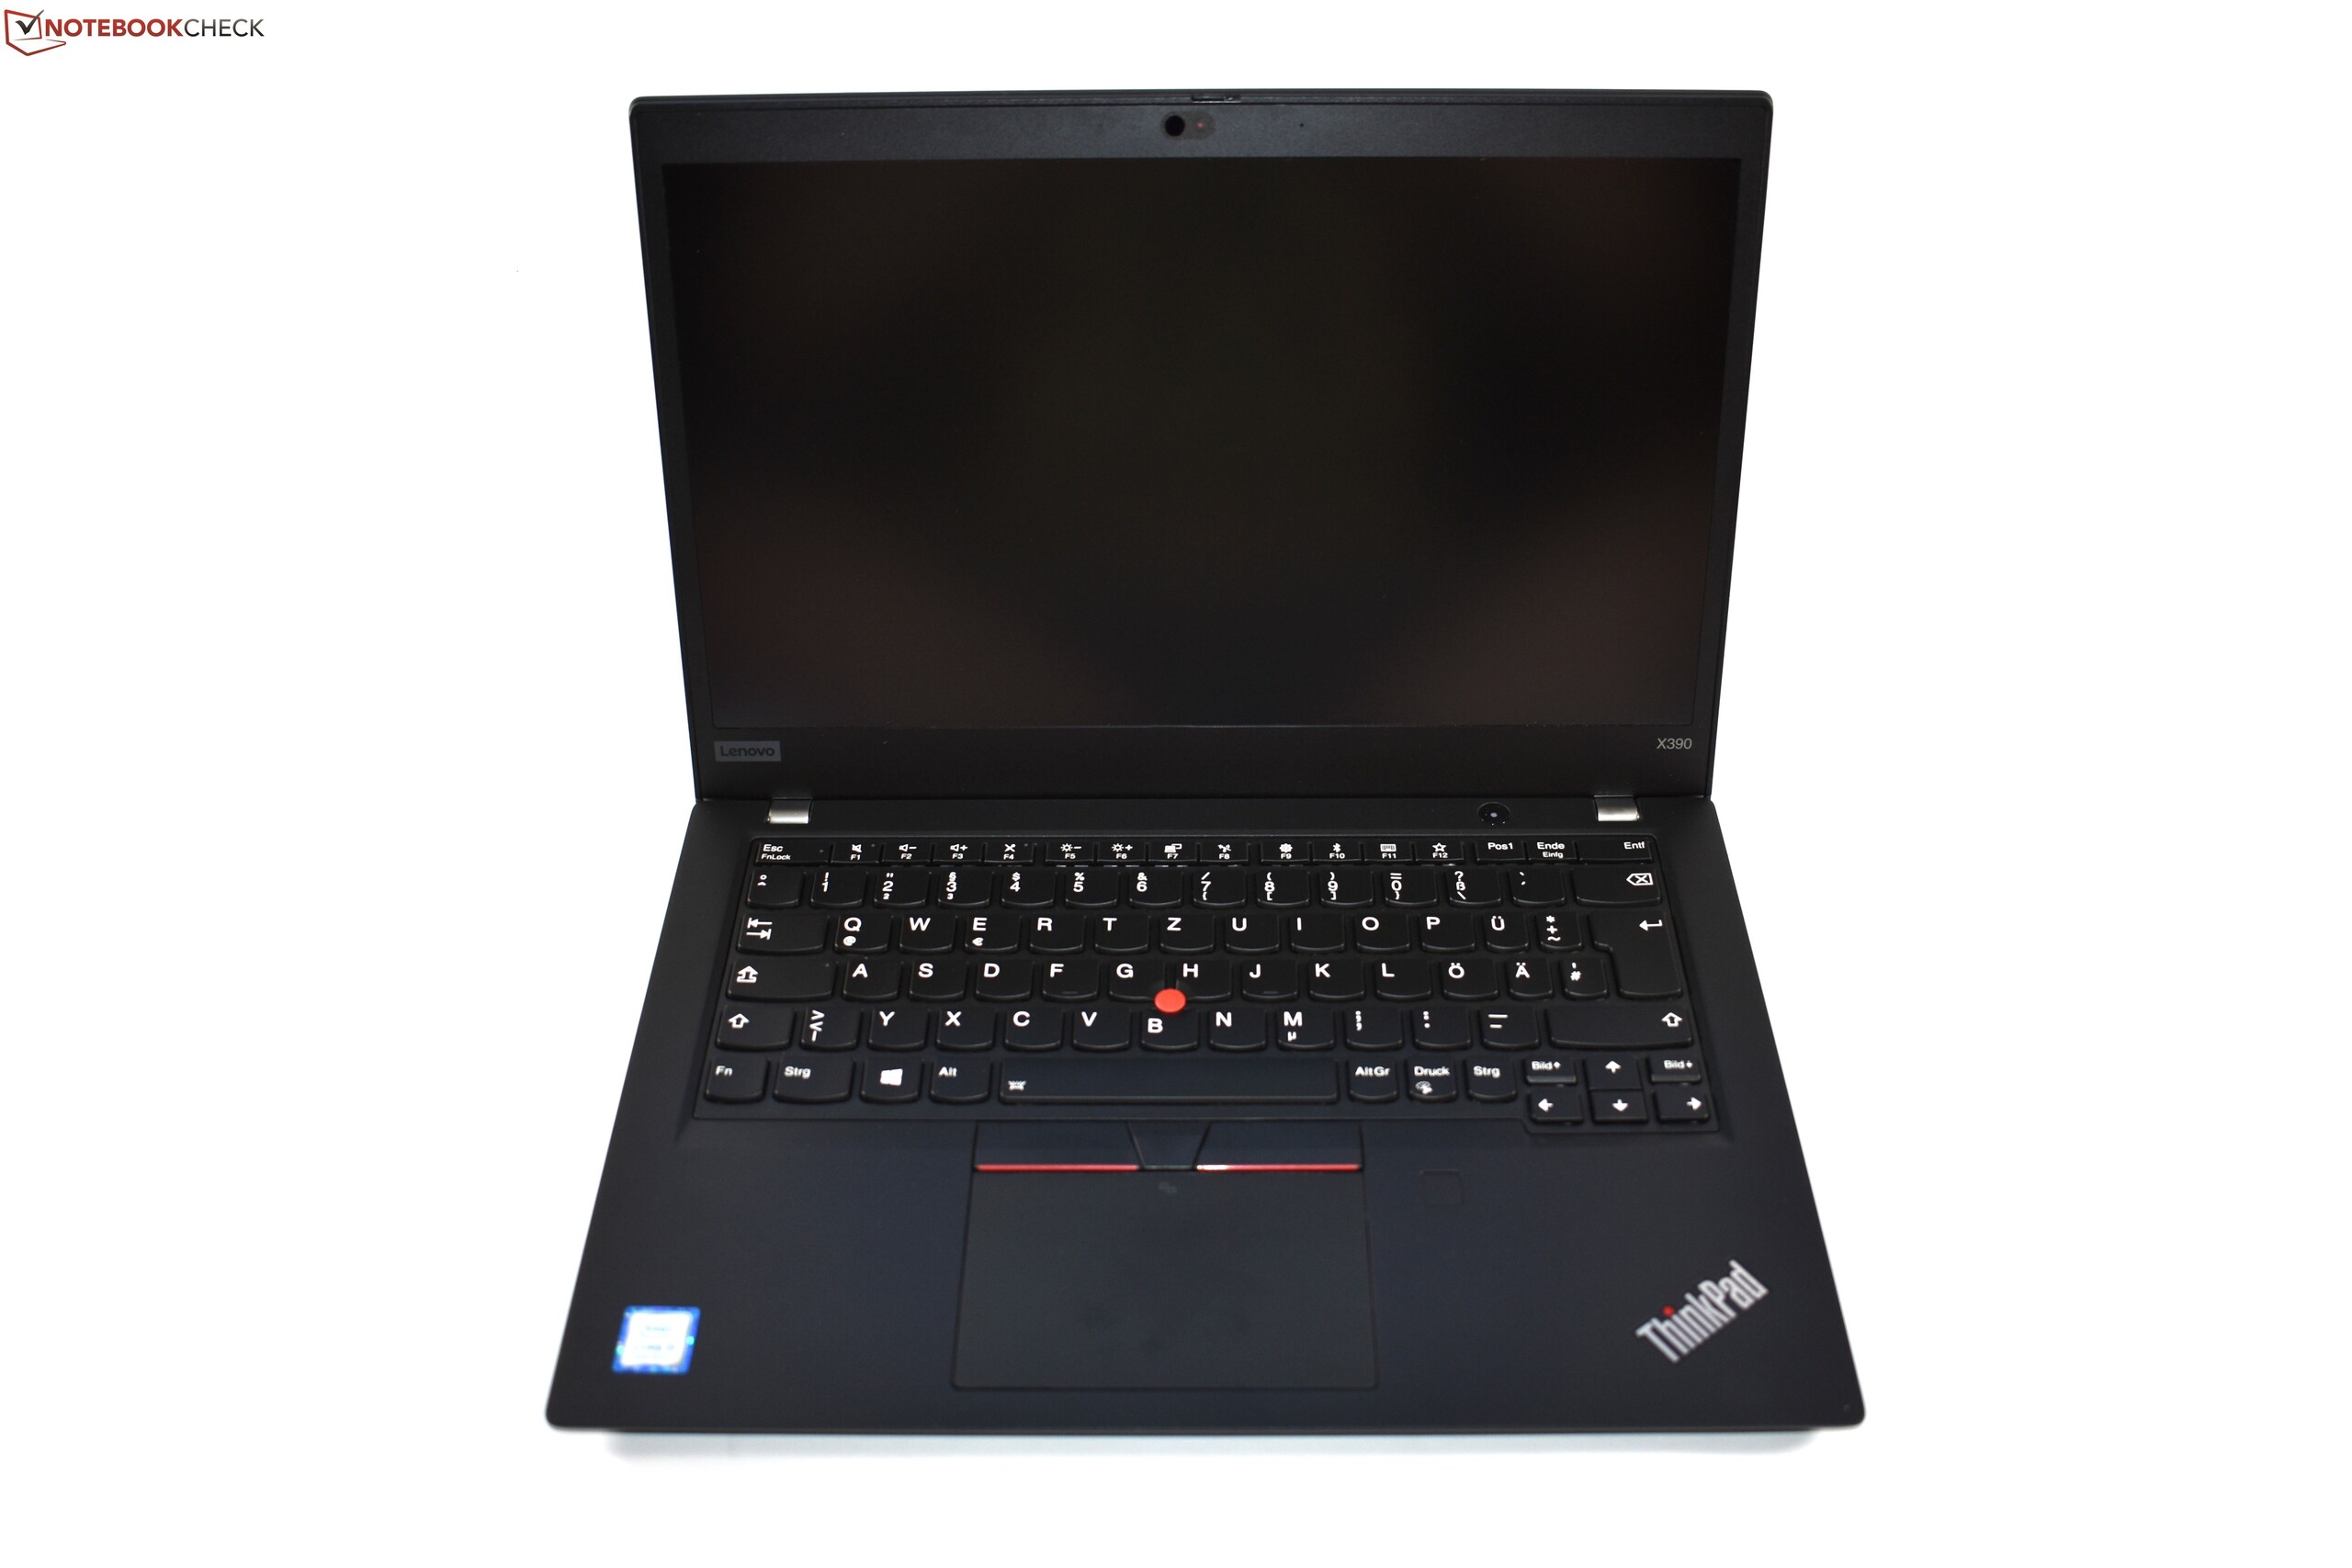
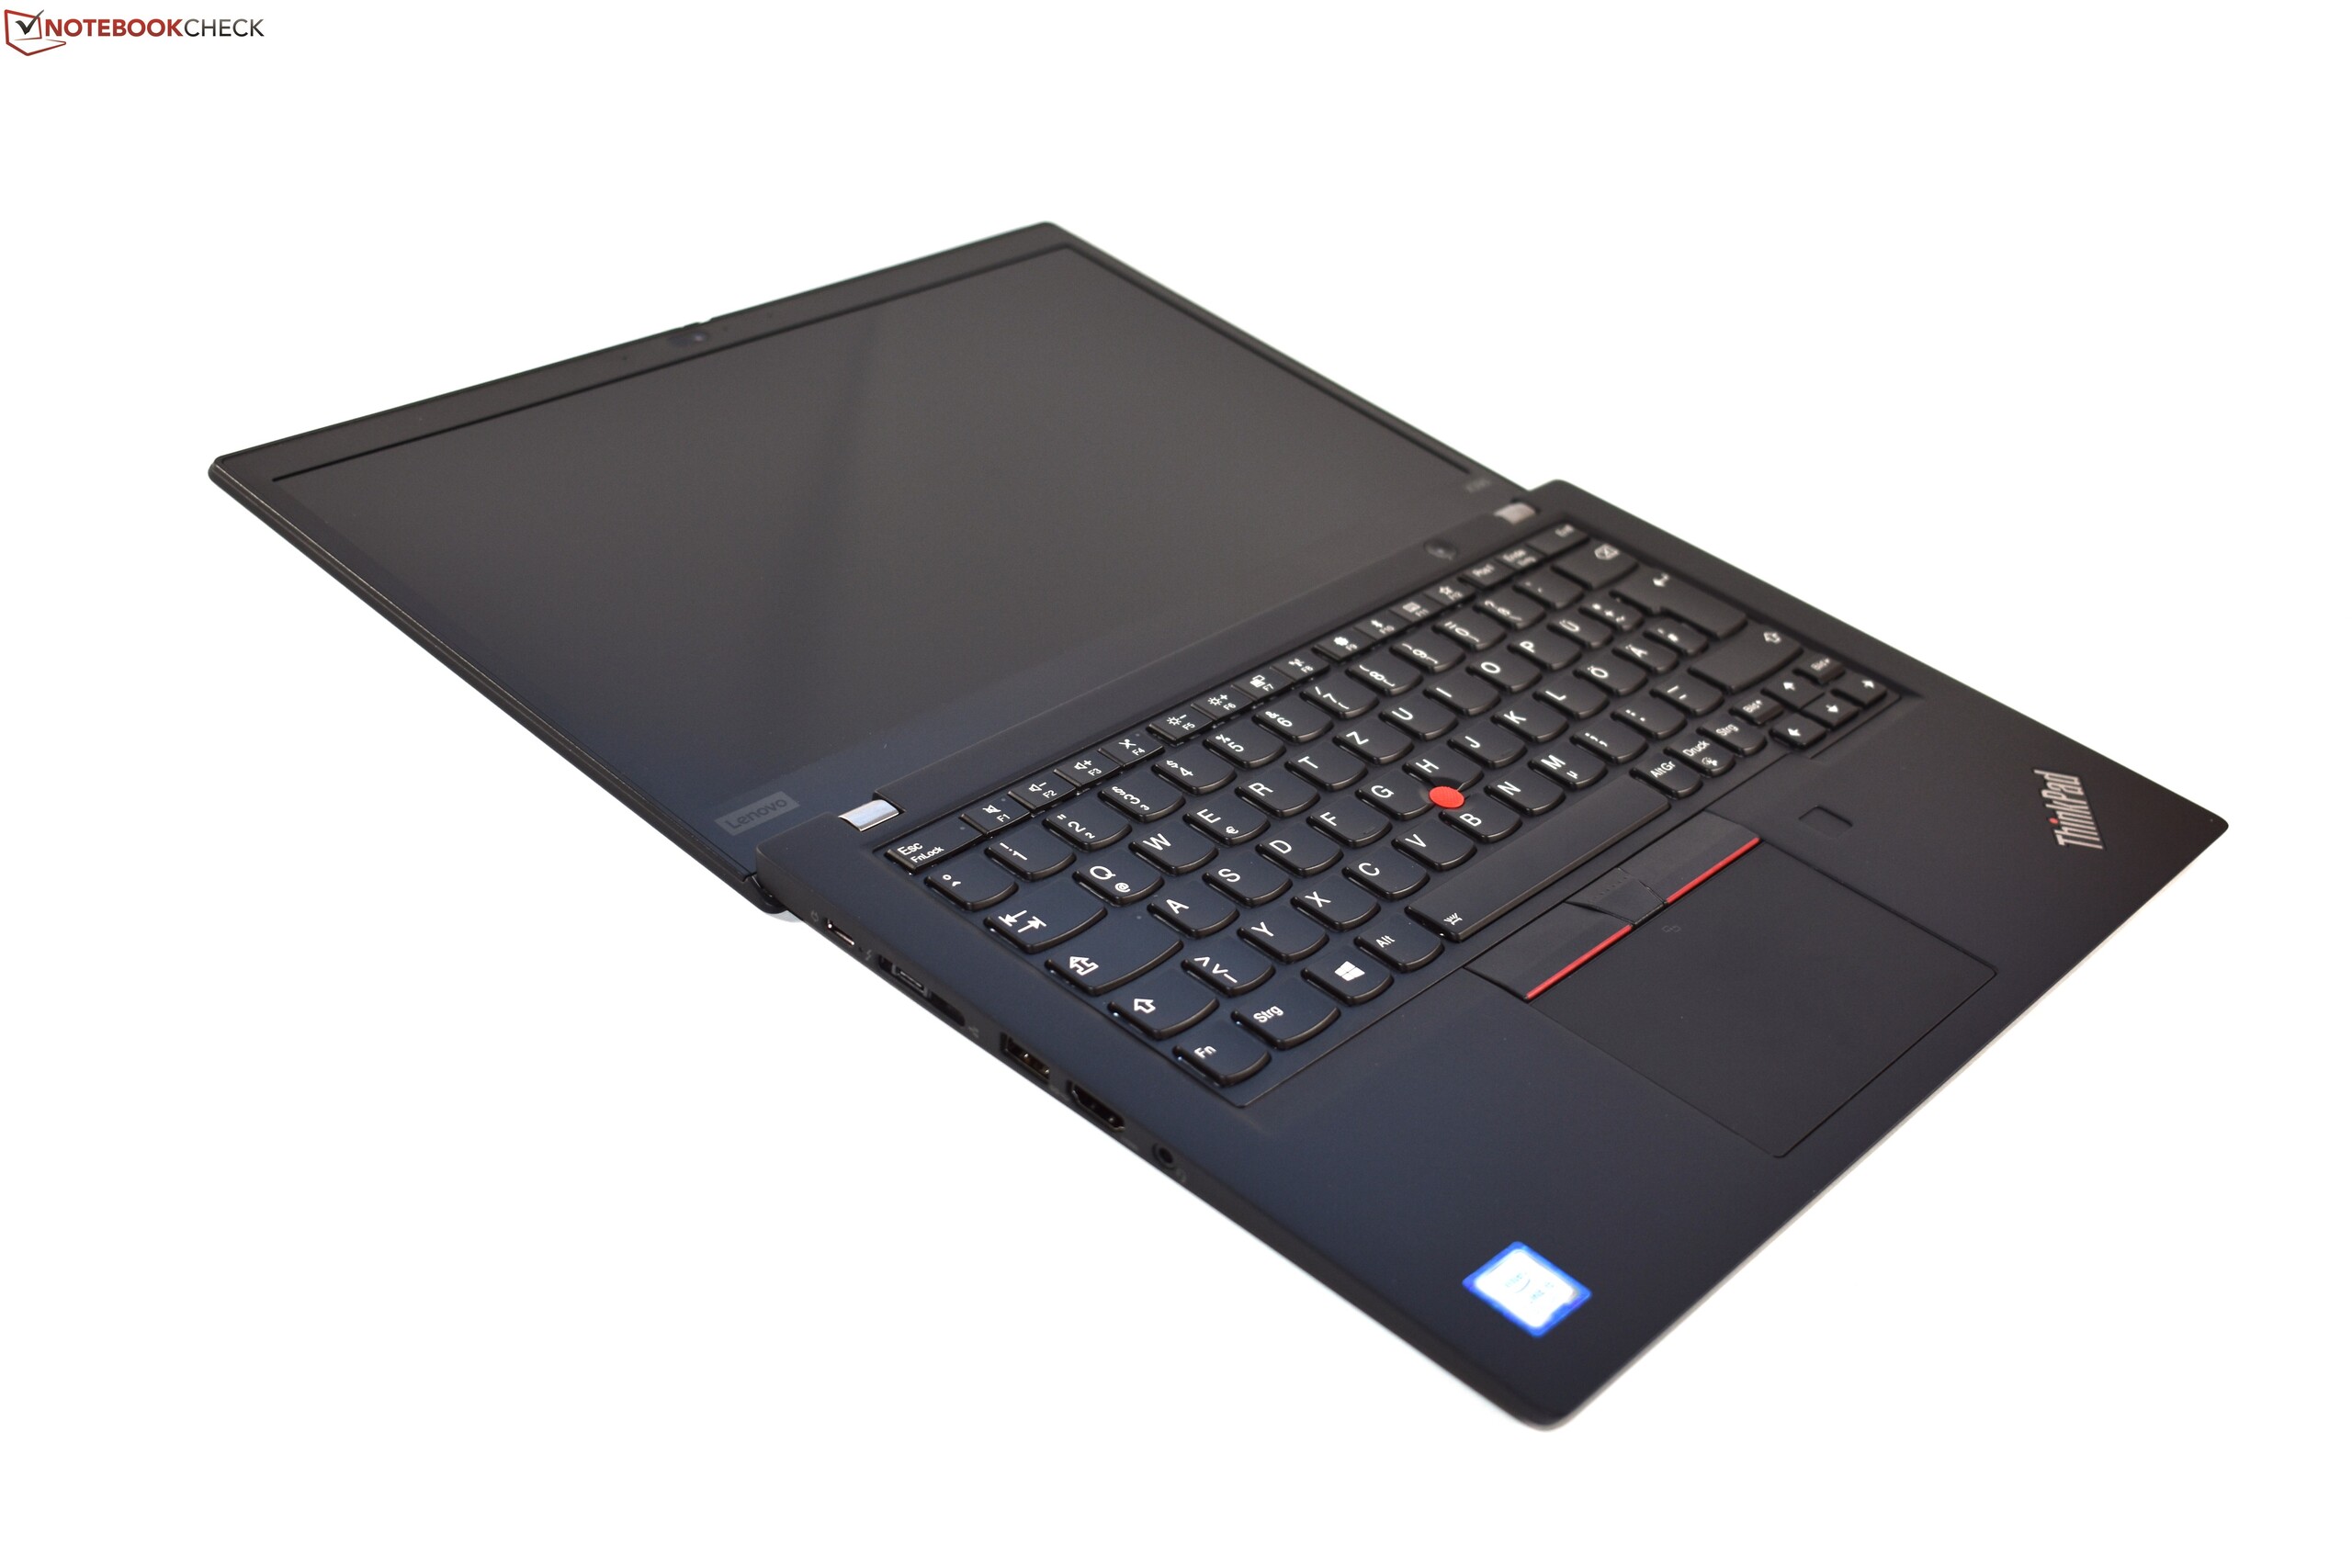
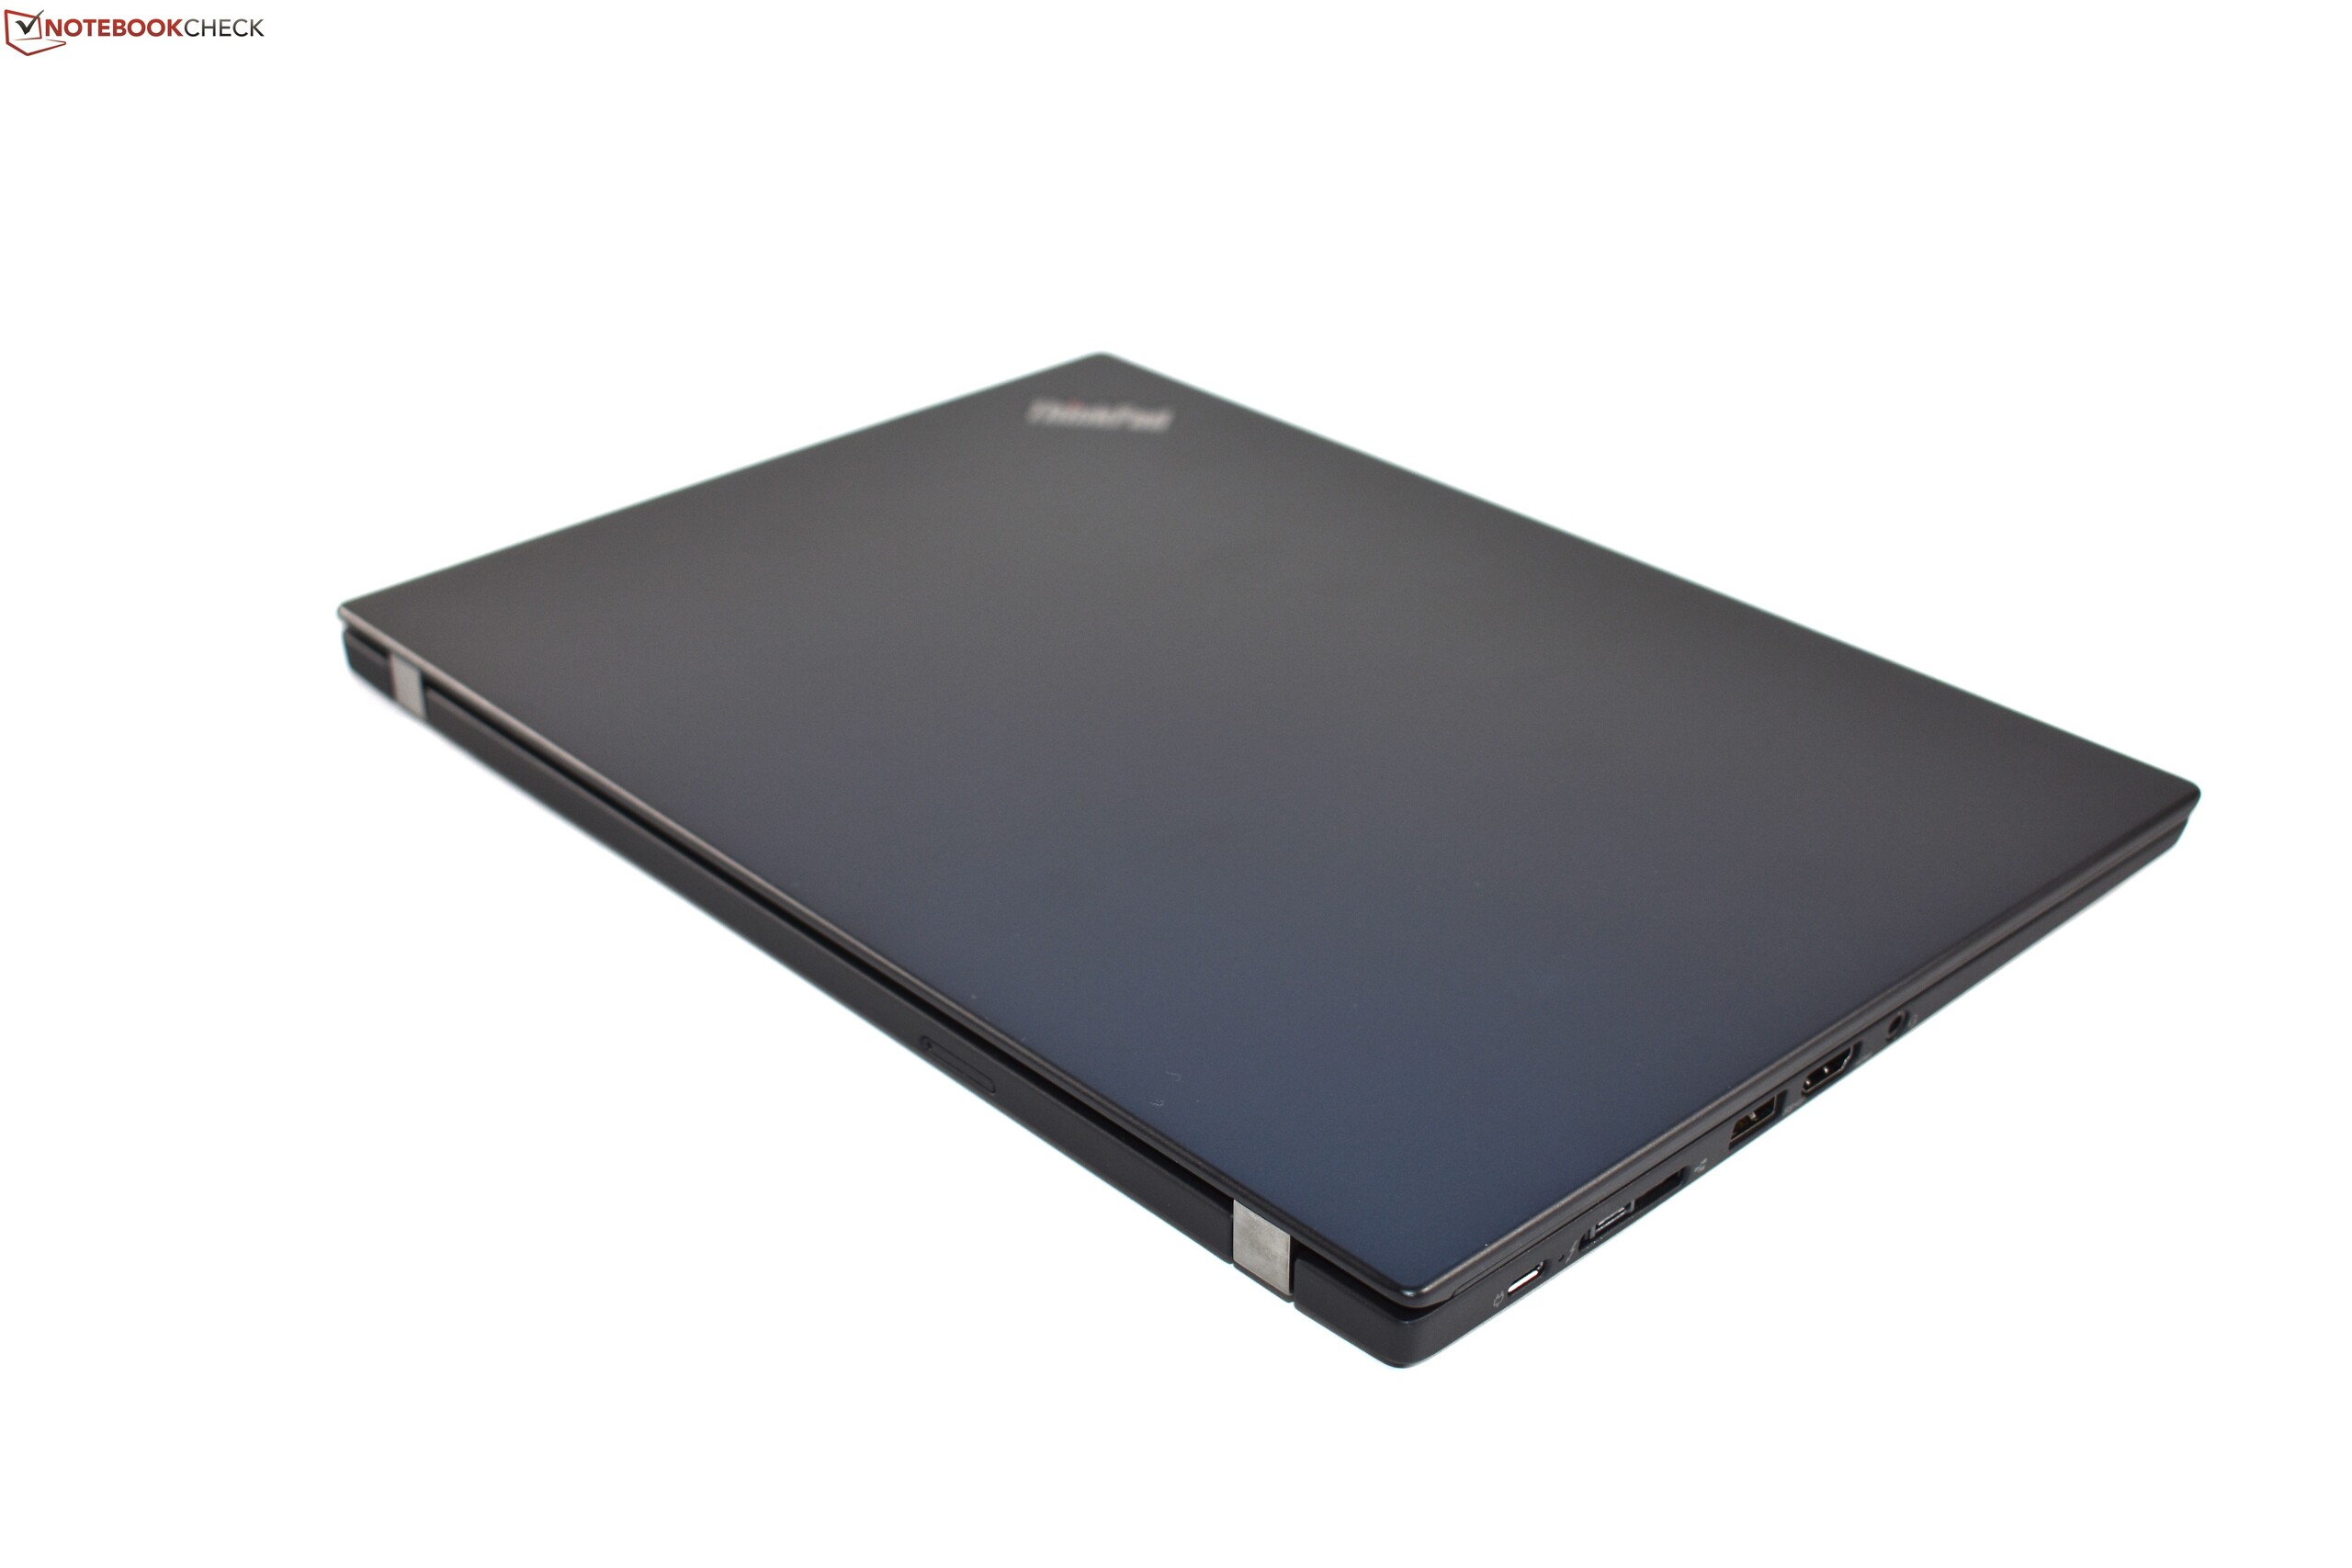
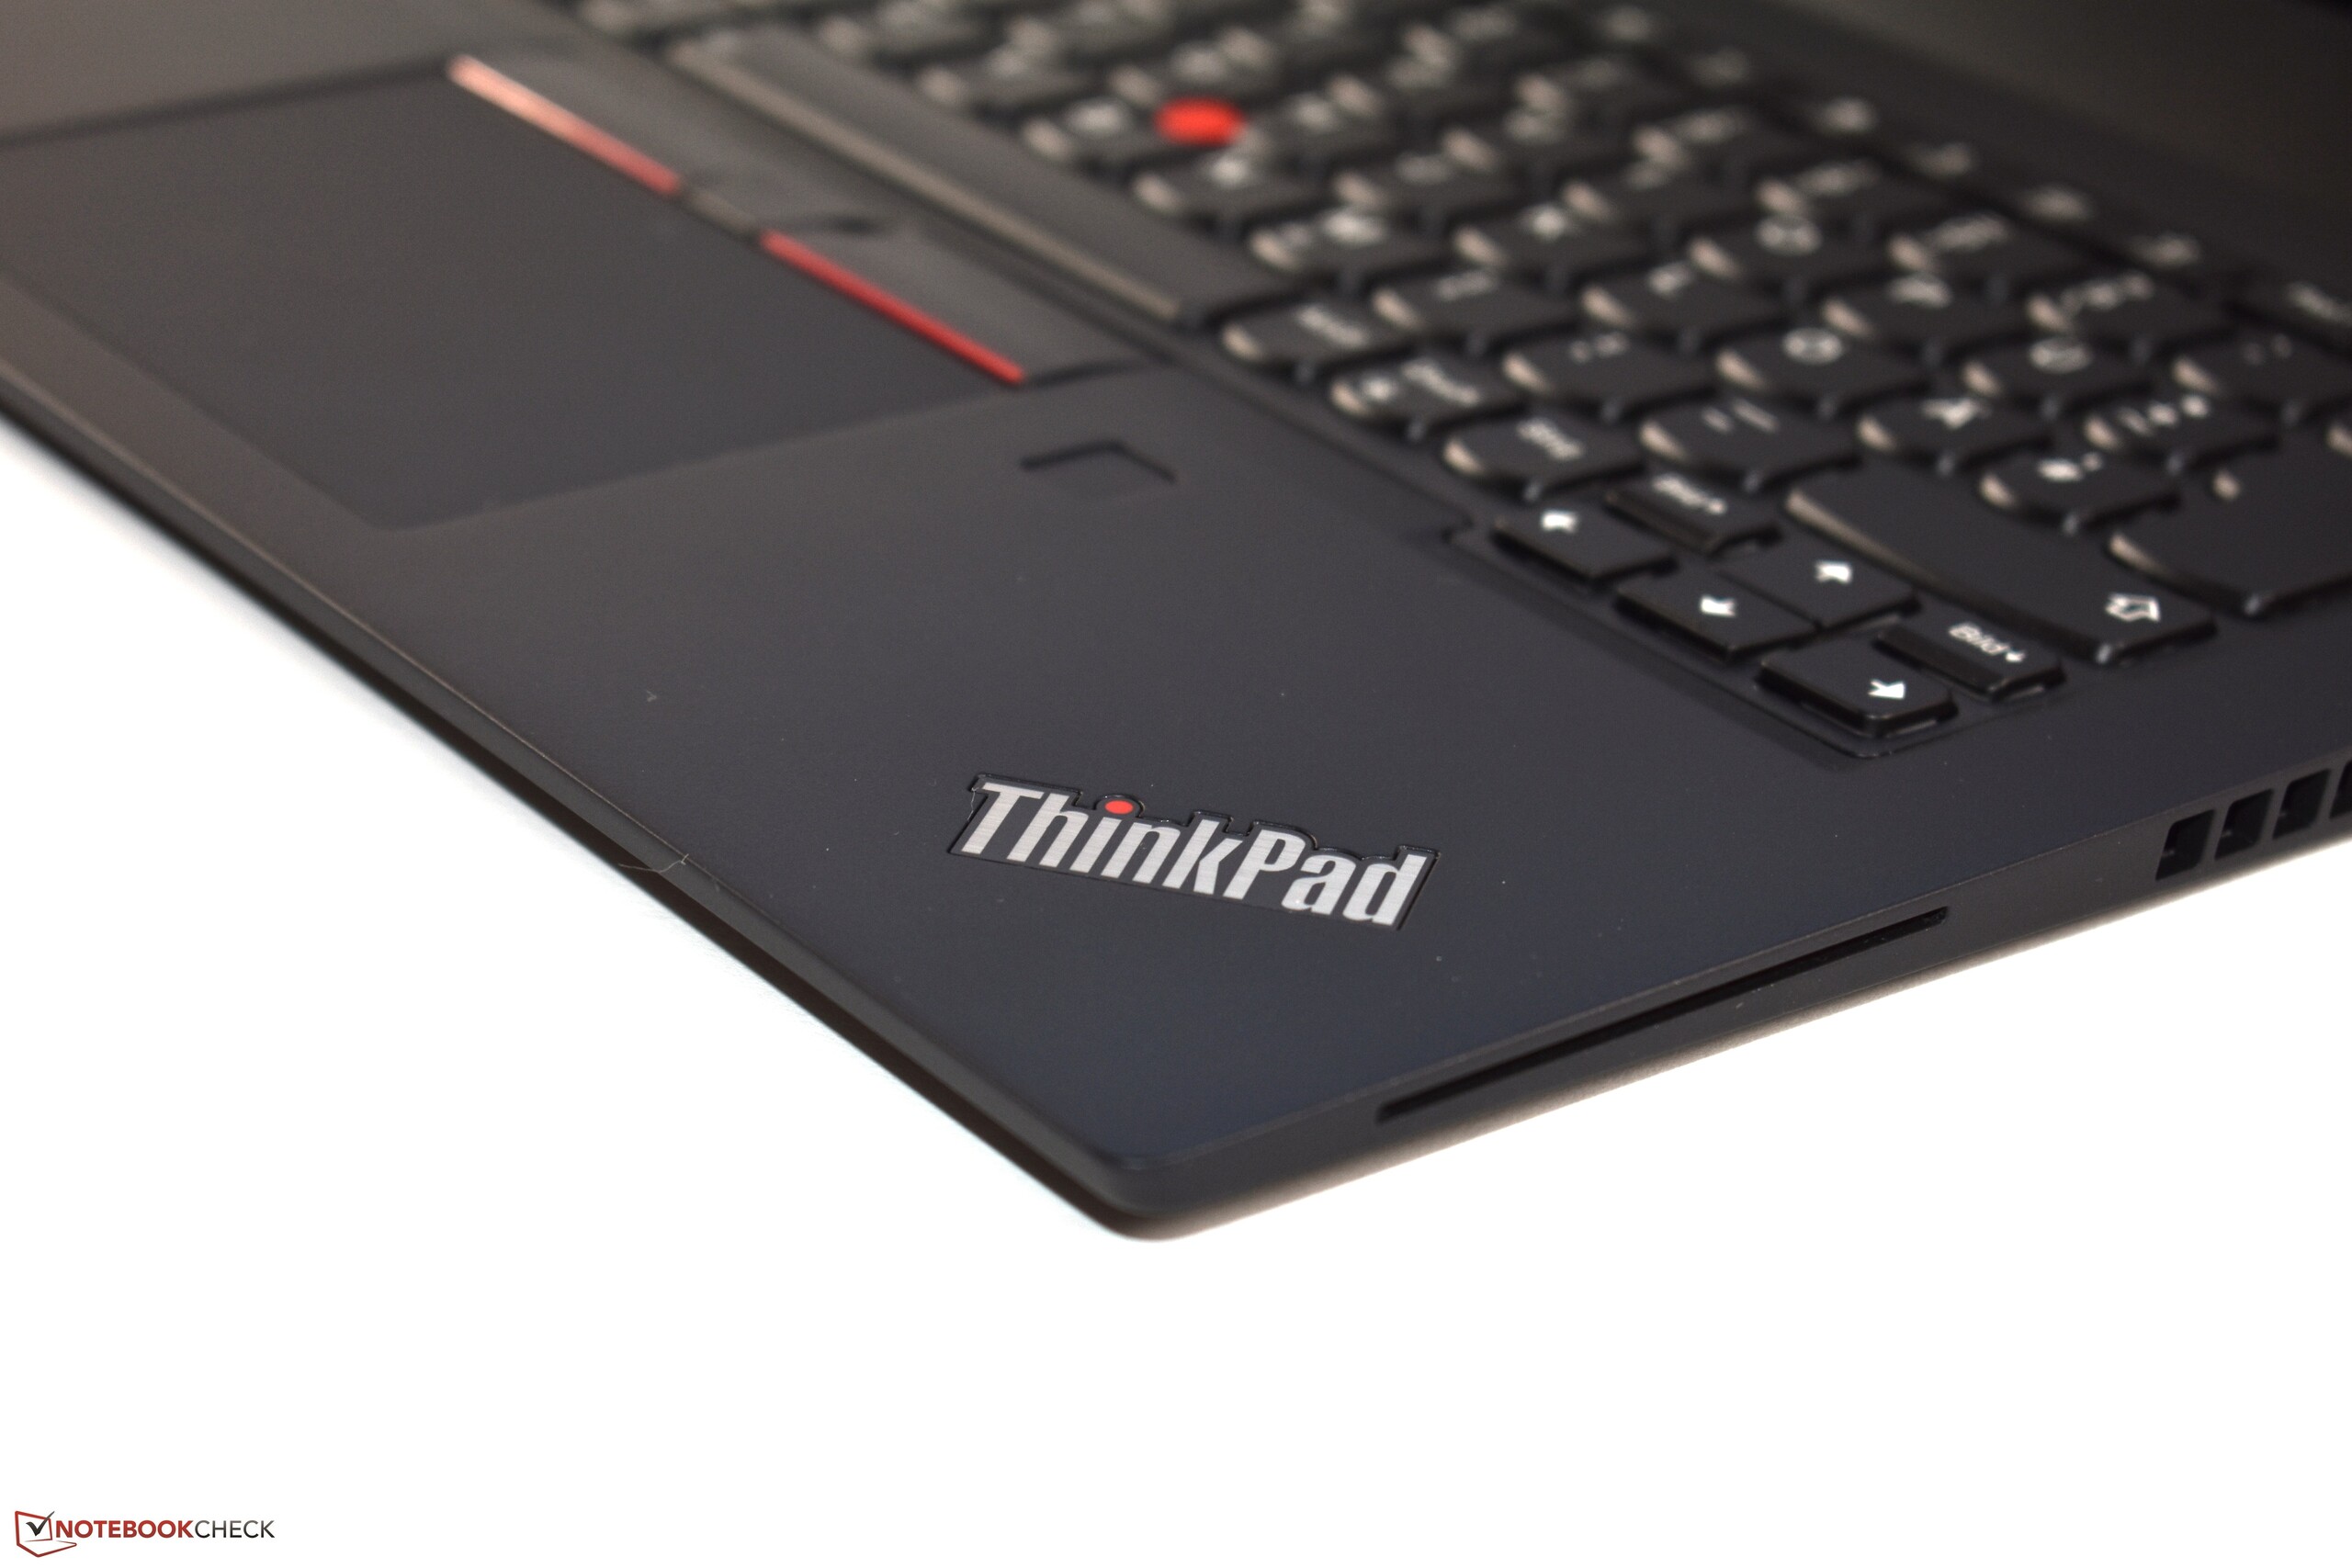
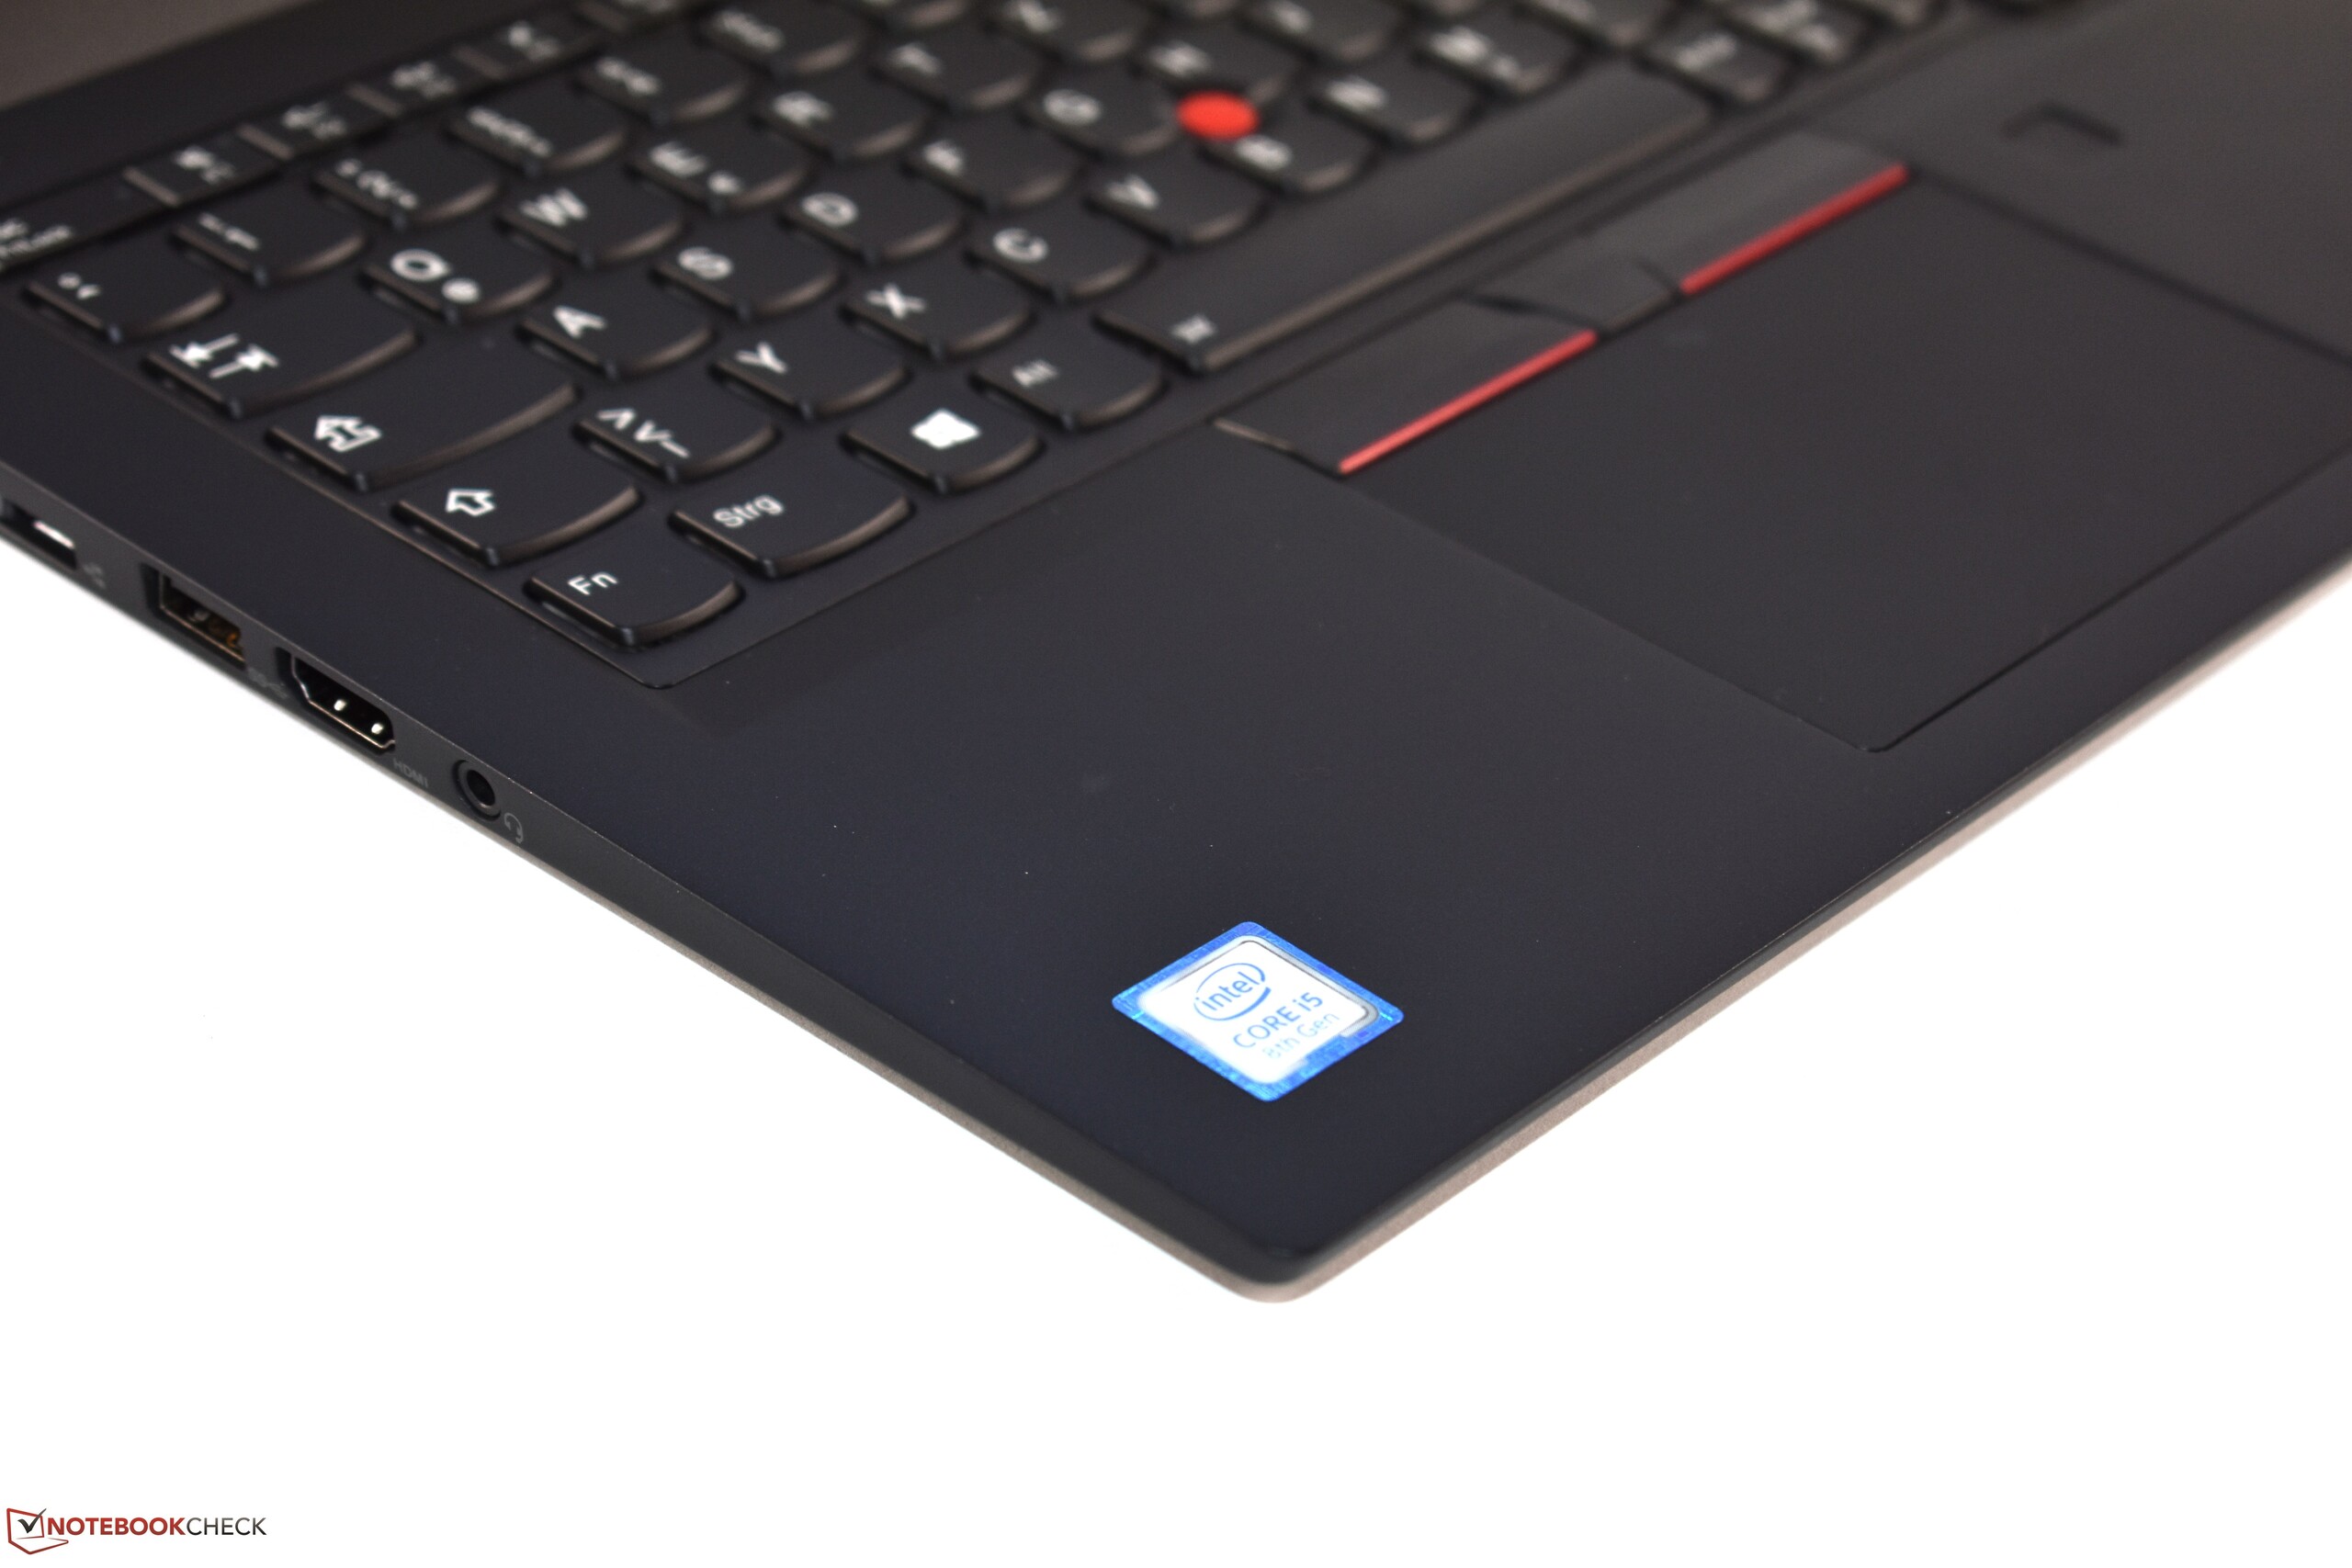
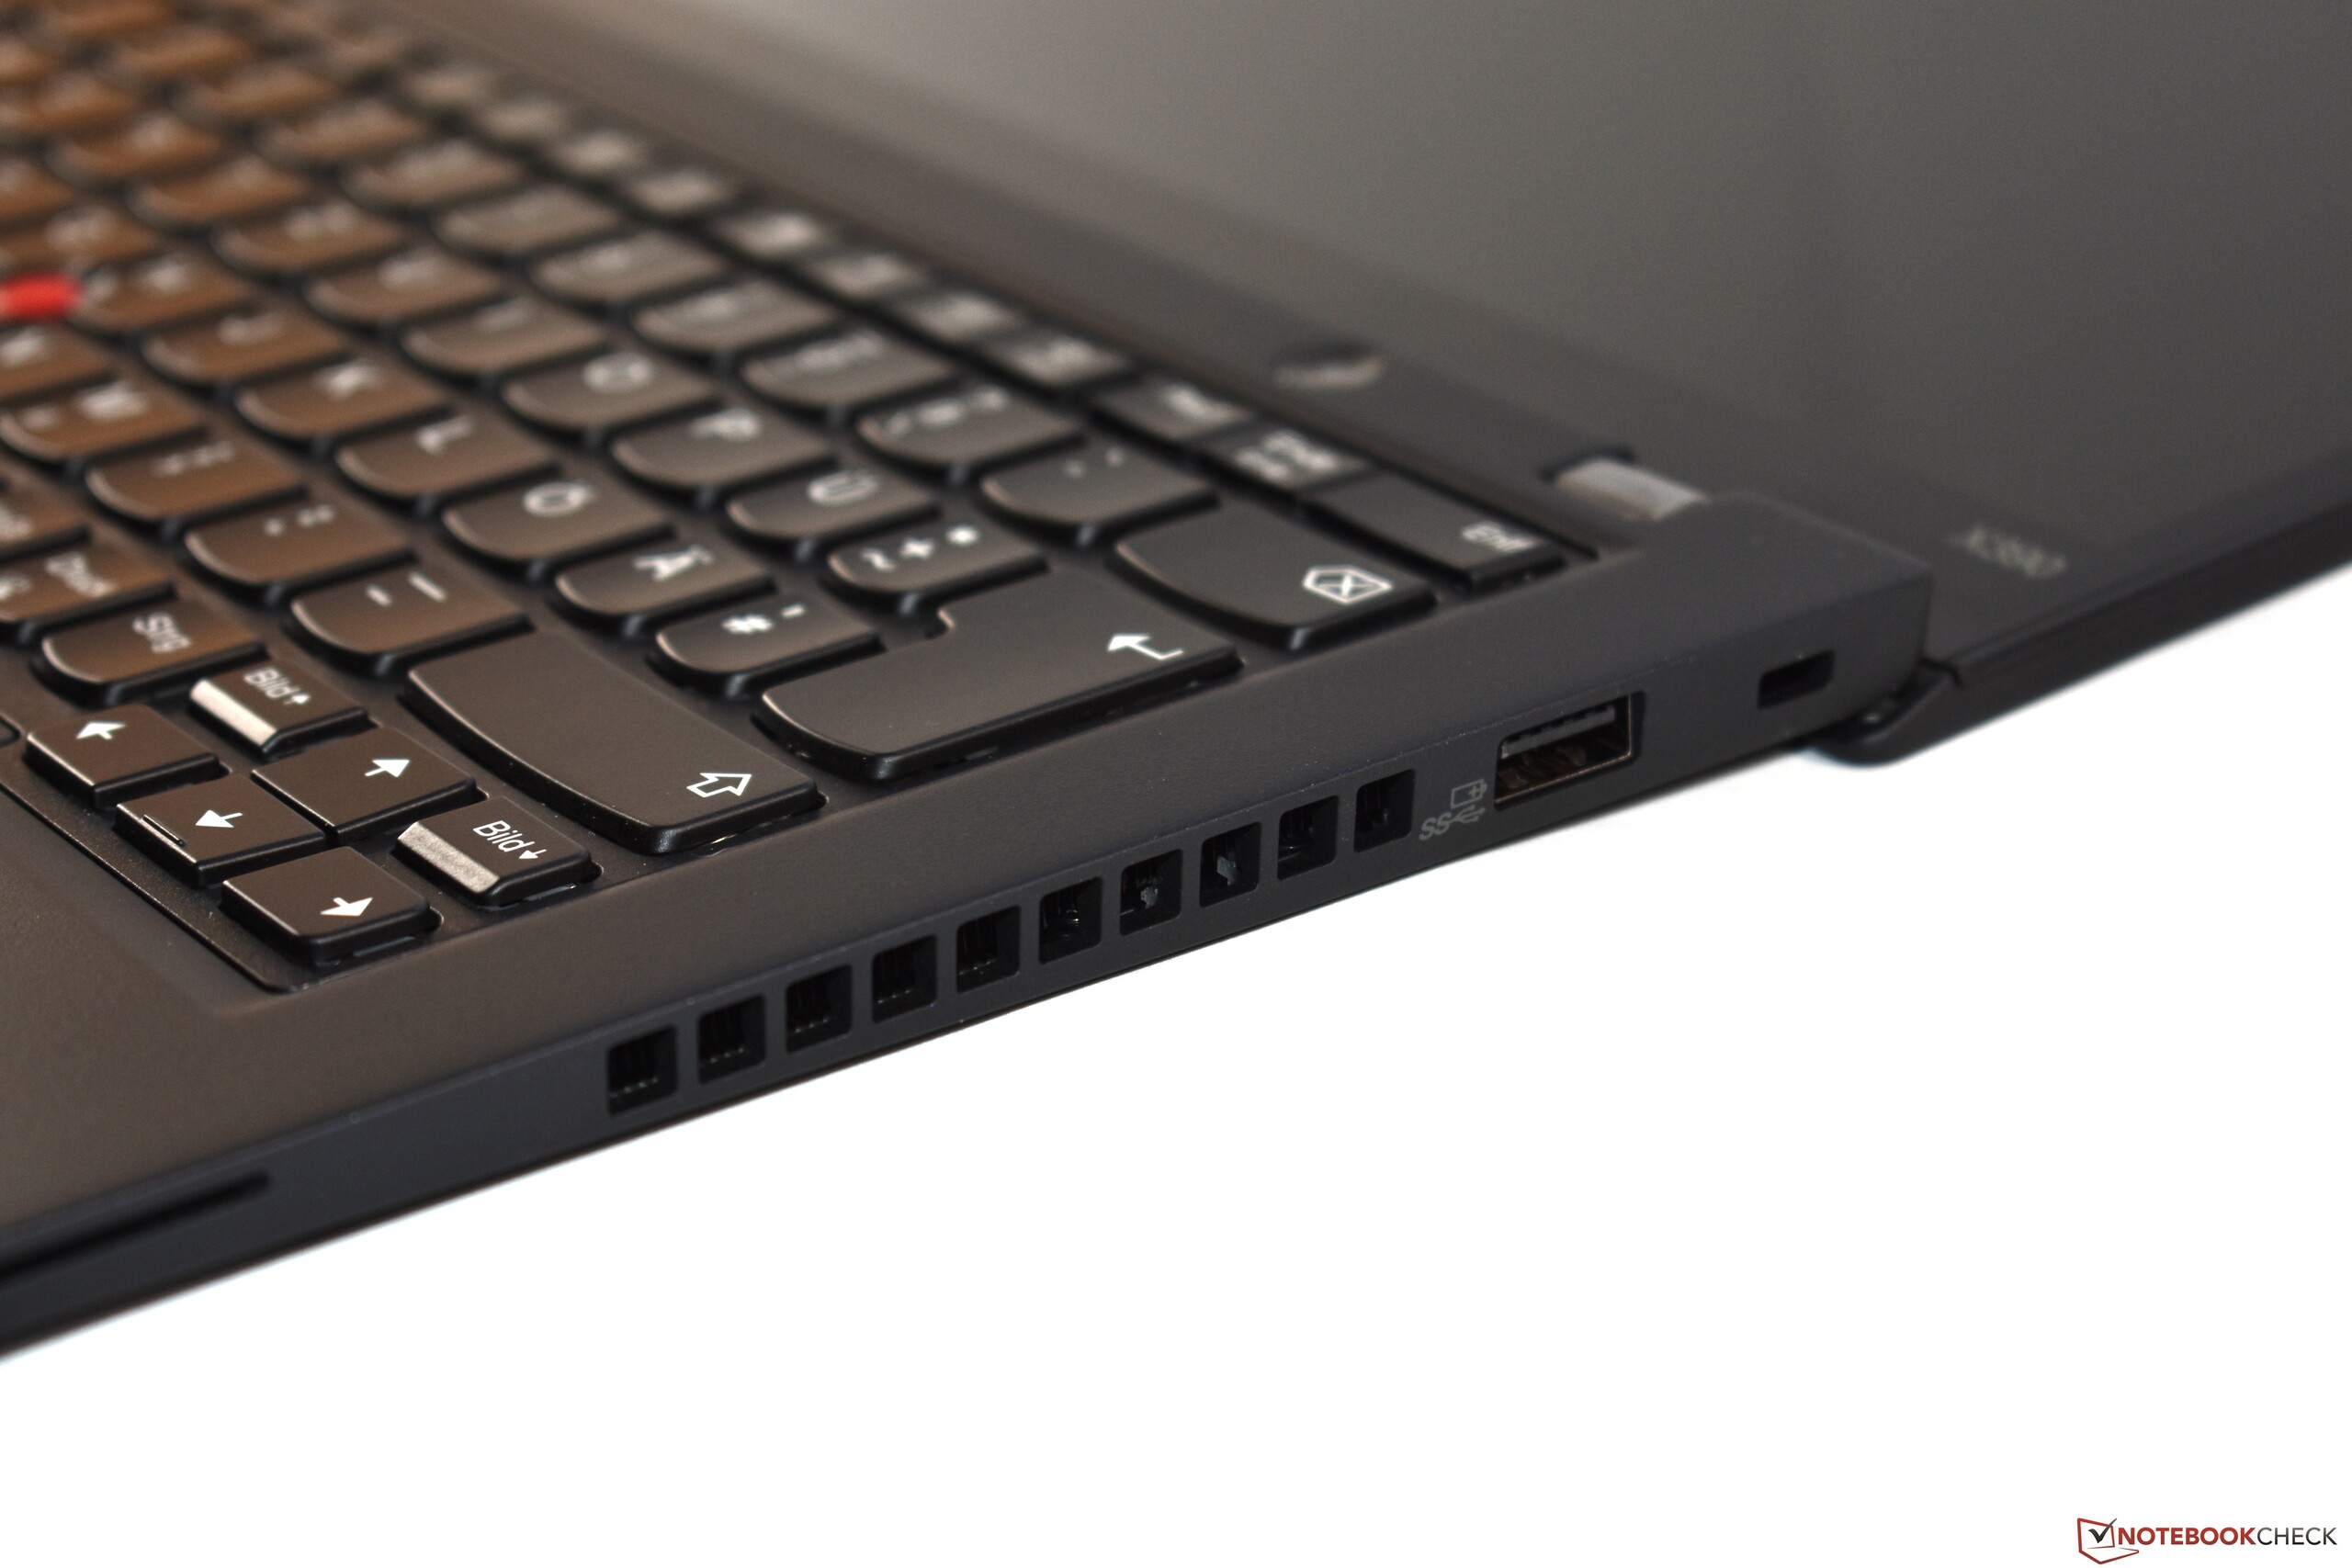
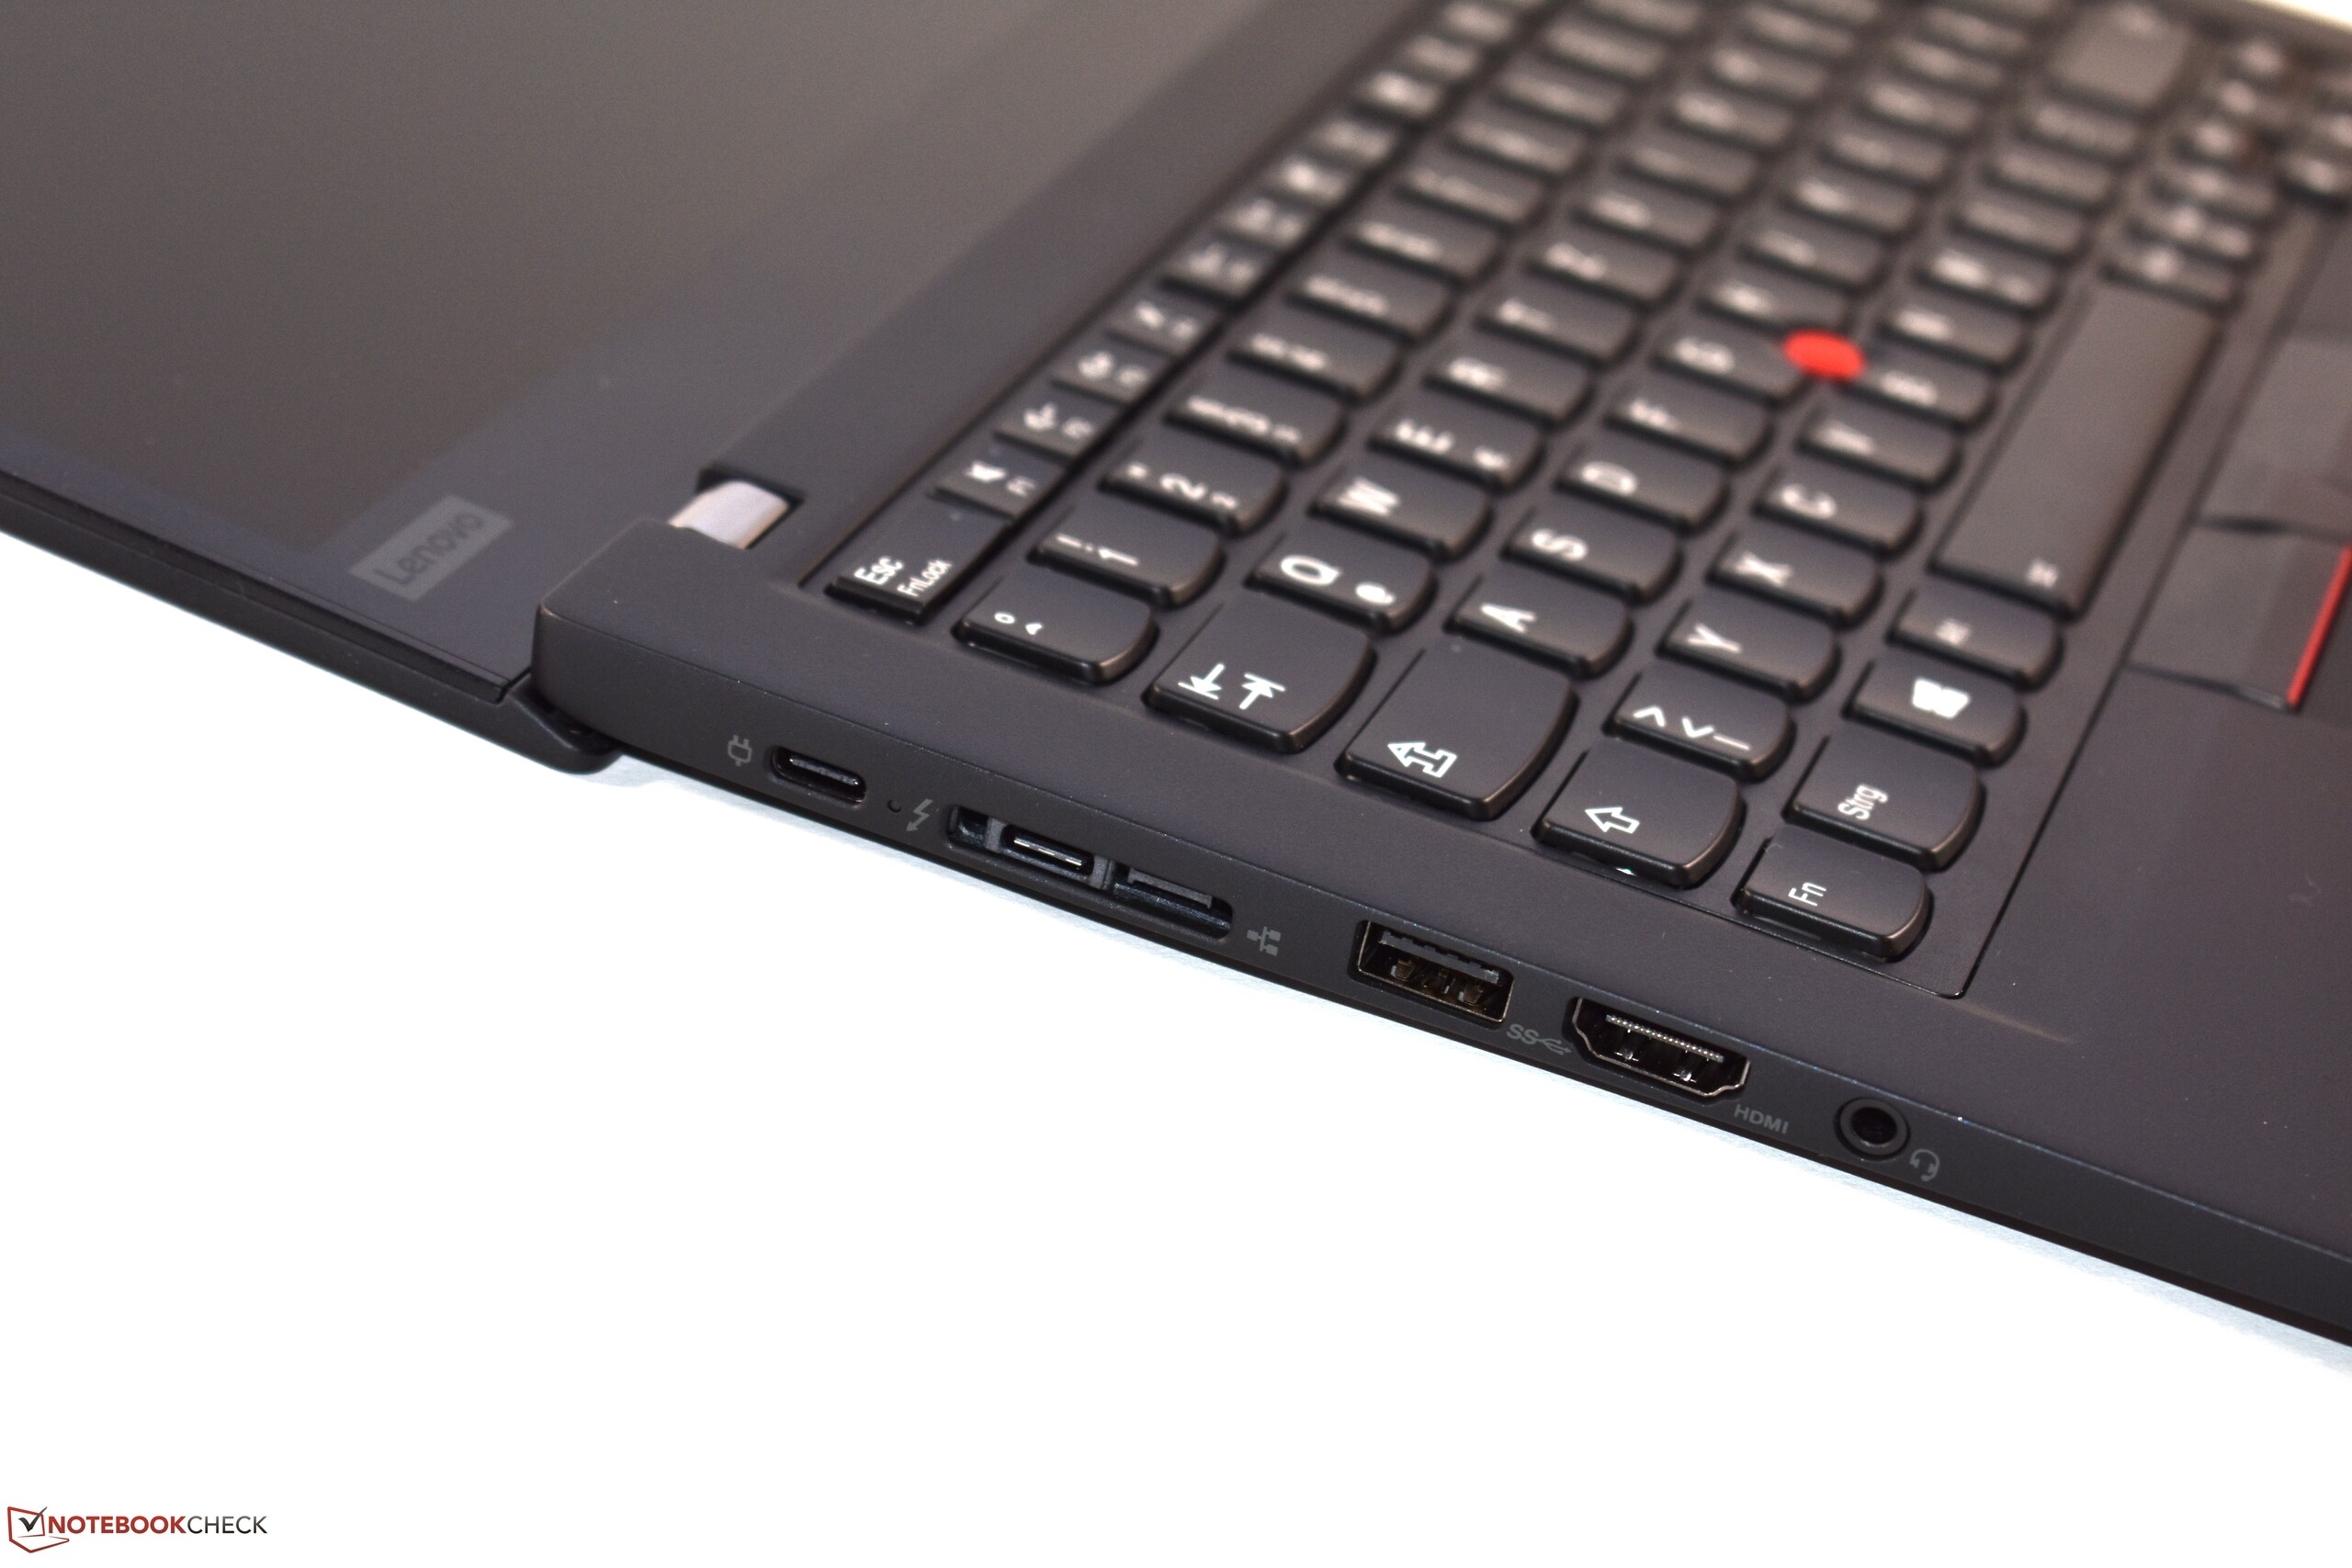
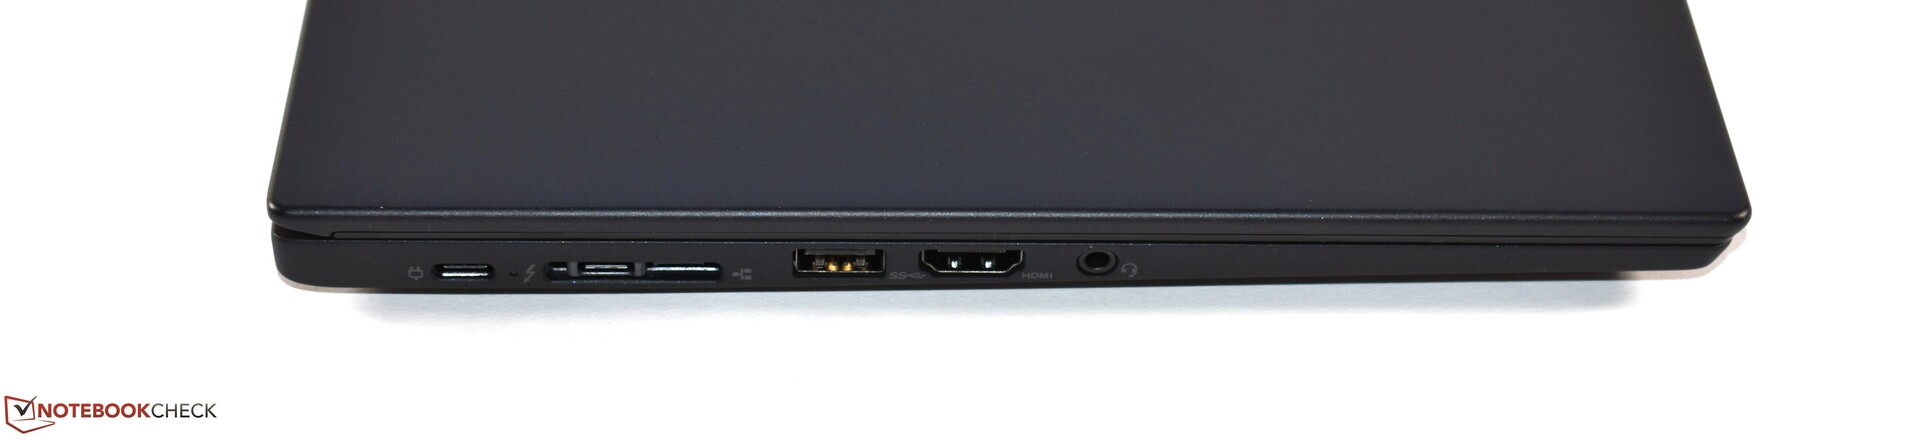
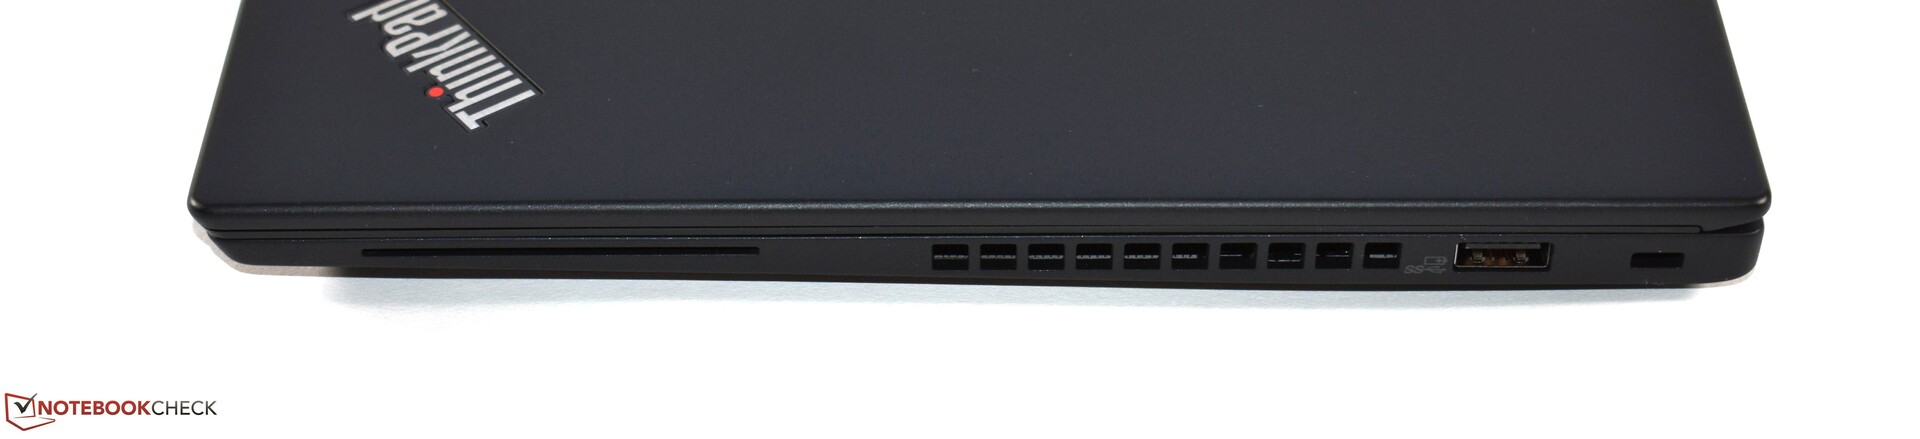
Primeiro o primeiro: O Lenovo ThinkPad X390 tem muitos pontos fortes, o que é um testemunho do bom trabalho da Lenovo. O ThinkPad X390 possui um chassi robusto, de alta qualidade e fino, que aloja excelentes dispositivos de entrada e uma boa quantidade de portas. Os recursos empresariais e de conectividade são abundantes e a garantia de três anos de suporte Premier é generosa. O ThinkPad X390 permite ao usuário trocar seu teclado com muita facilidade, o que é diferente de muitos outros portáteis compactos. A tela é mate, brilhante e tem uma boa gama de cores. Isso, por sua vez, resolve um dos grandes problemas que tivemos com o X280. O desempenho da CPU é bom, e o ThinkPad X390 não esquenta muito e permanece quase completamente silencioso.
Com essa longa lista de pontos positivos, será que há espaço para os negativos? Não muito, dado que a Lenovo não comete muitos erros com este portátil empresarial. Um detalhe feio é o leitor de cartões microSD, que é difícil de acessar. O desempenho da CPU é limitado quando o dispositivo funciona com bateria e o teclado é menos amplo do que outros ThinkPads. A capacidade de atualização do X390 poderia ser melhor, especialmente a RAM totalmente soldada nos incomoda - gostaríamos de ver pelo menos um único slot de RAM. A tela tem tempos de resposta ruins e a porta Thunderbolt é conectada apenas por duas faixas PCIe. Também é lamentável que a Lenovo não ofereça uma tela de alta resolução.
Um pacote completo: Com o ThinkPad X390, a Lenovo faz mais coisas certas do que erradas - mas há fortes concorrentes internamente.
Todas essas são reclamações válidas, mas são um pouco exaustivas - não há grandes problemas com esse ThinkPad. É por isso que o TravelMate recebe nossa recomendação. Apesar deste veredicto positivo, temos que nos perguntar se o ThinkPad T490s é a melhor escolha. Este portátil ThinkPad é um pouco maior, mais caro e não possui um teclado facilmente removível, mas possui uma bateria maior, uma tela maior, com uma resolução opcionalmente maior e um teclado mais amplo. Fora essas coisas, os dois ThinkPads são quase idênticos. No final, é uma questão de gosto escolher entre o ThinkPad maior ou menor. Talvez, a Lenovo deva considerar a fusão de ambas as linhas, já que a T490s e X390 são muito semelhantes em muitos aspectos.
Lenovo ThinkPad X390-20Q1S02M00
- 04/25/2019 v6 (old)
Benjamin Herzig
Price comparison
