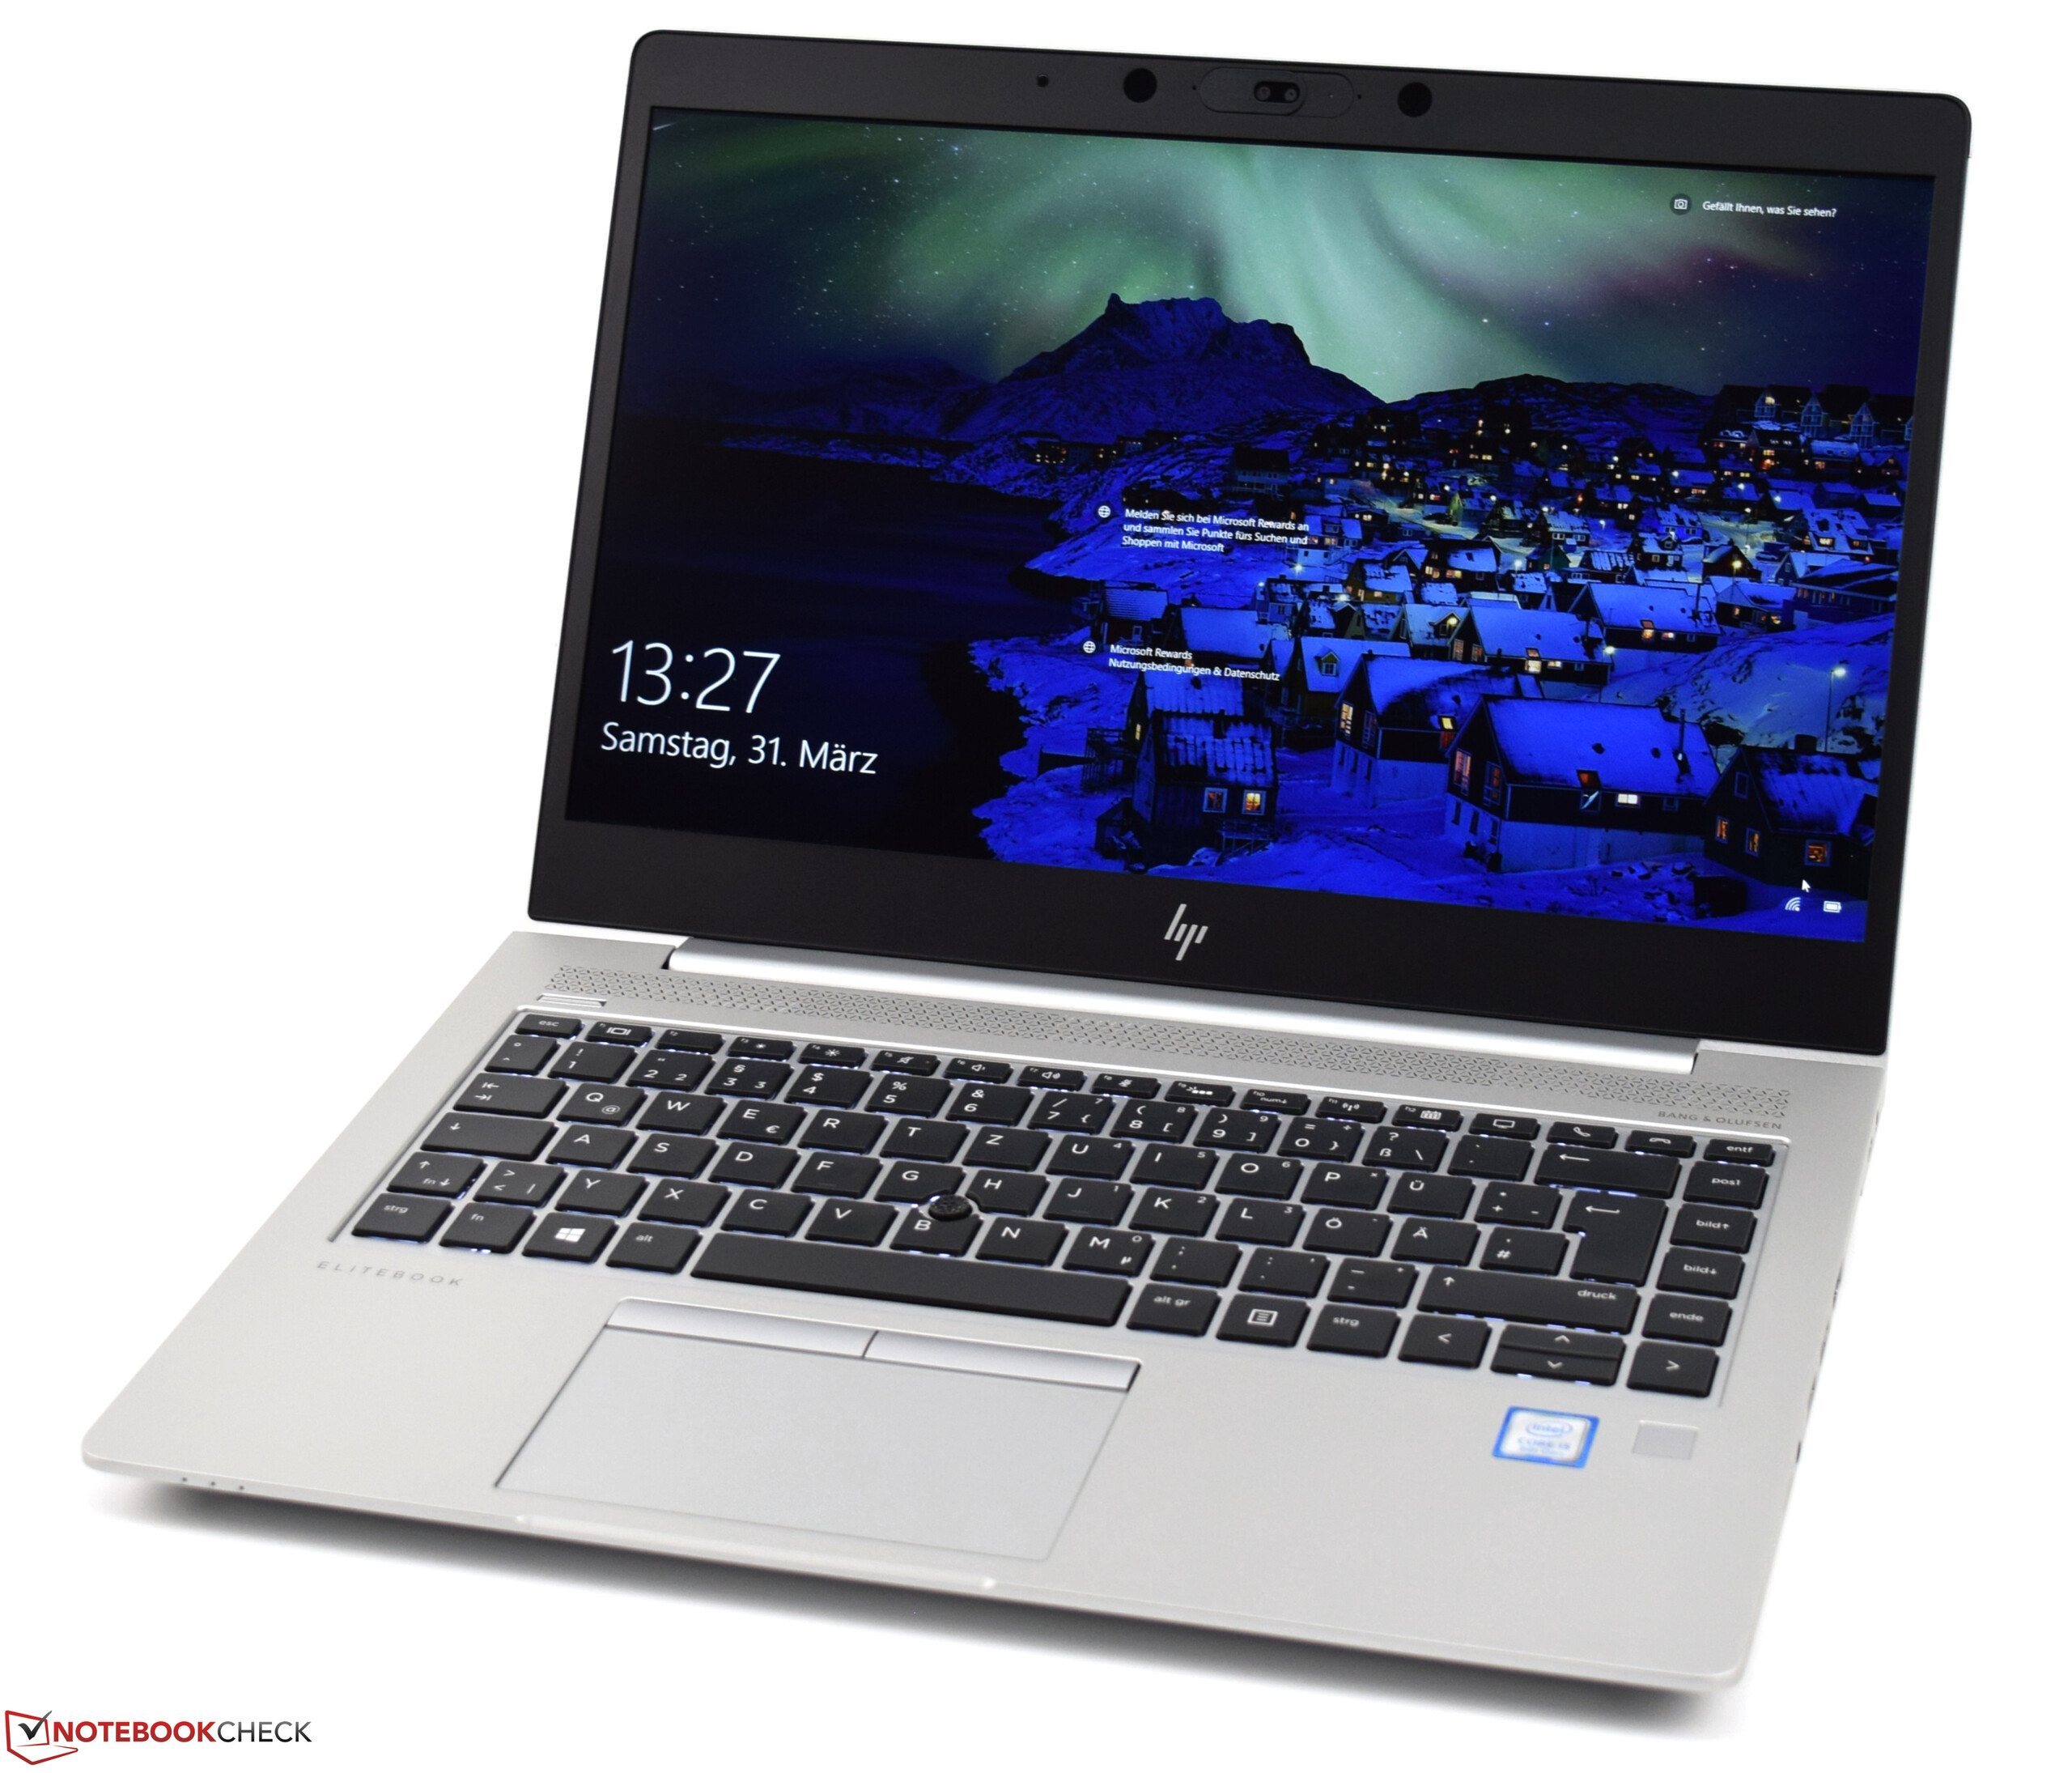
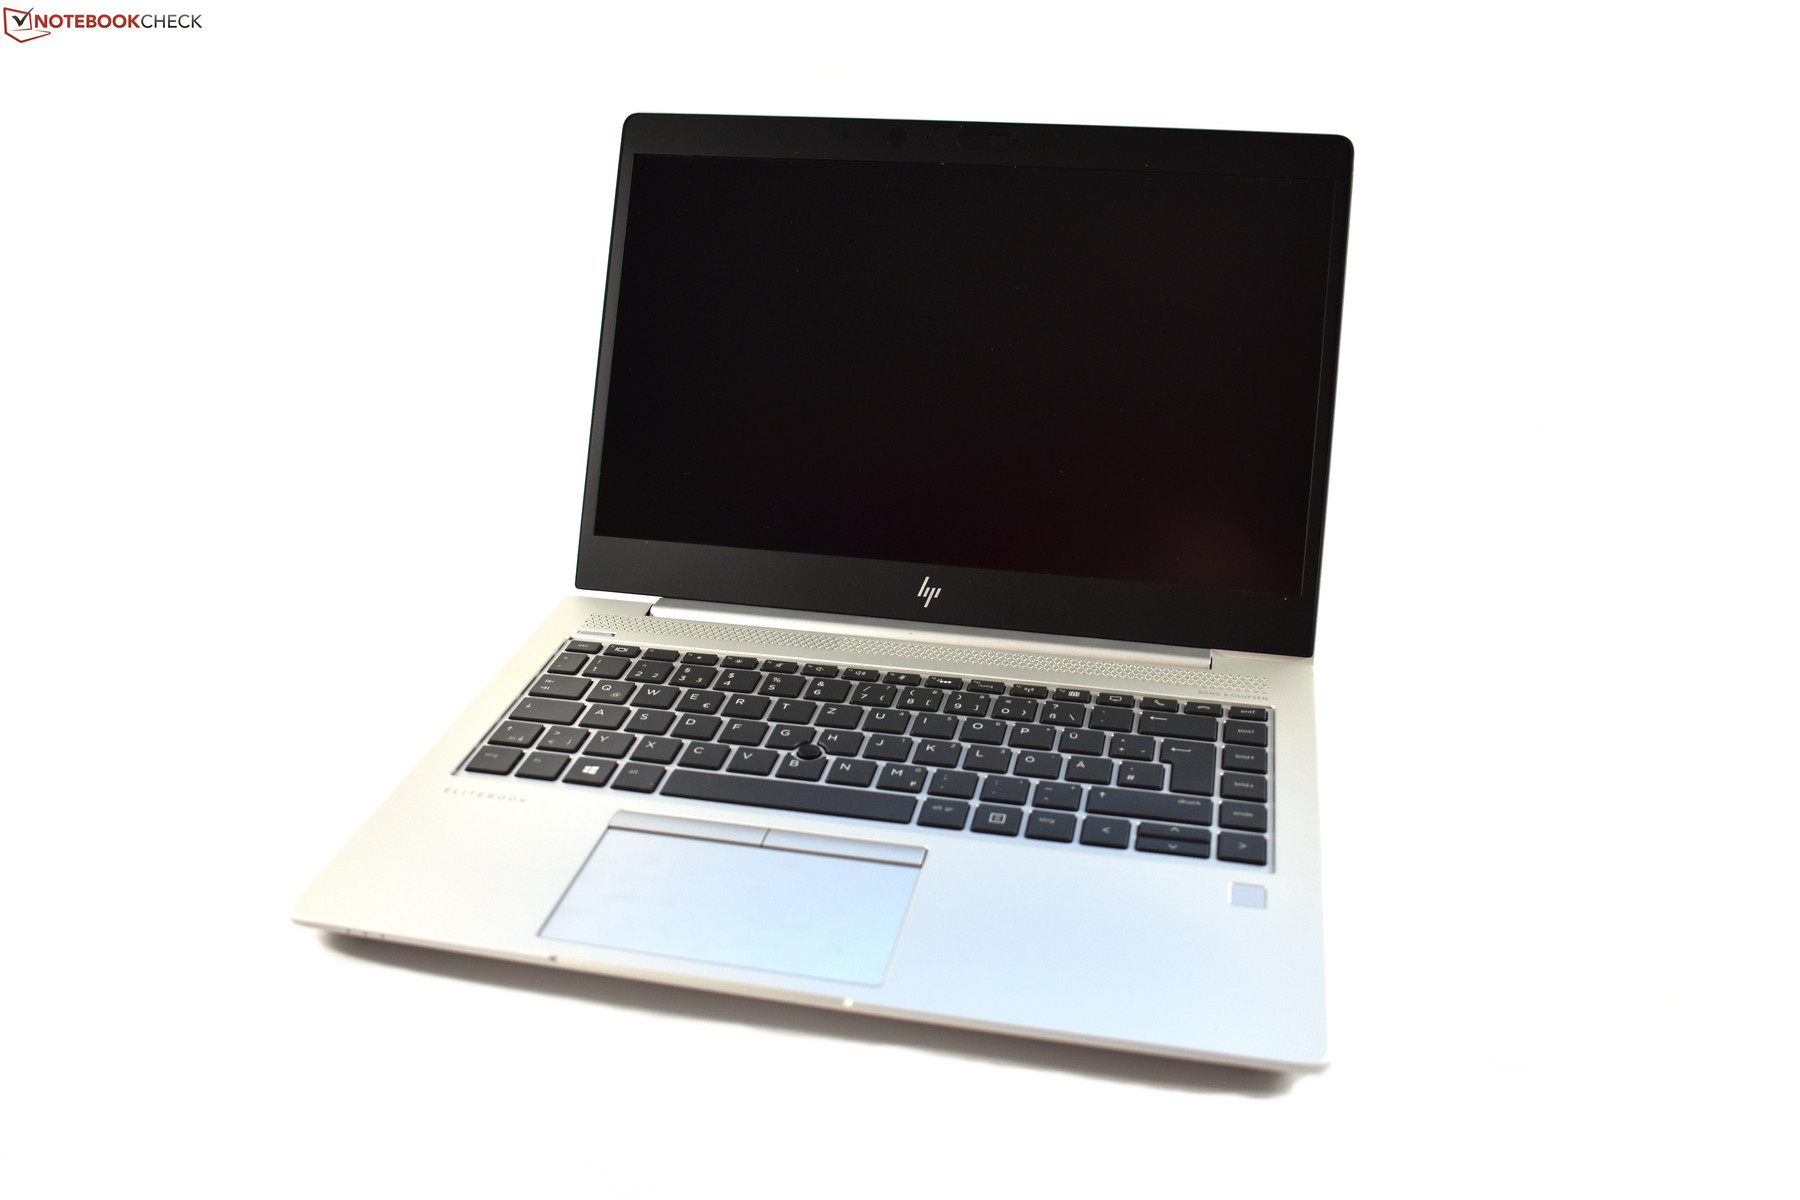
Breve Análise do Portátil HP EliteBook 745 G5 (Ryzen 7 2700U)

| |||||||||||||||||||||||||
iluminação: 86 %
iluminação com acumulador: 422 cd/m²
Contraste: 1559:1 (Preto: 0.27 cd/m²)
ΔE ColorChecker Calman: 4.08 | ∀{0.5-29.43 Ø4.71}
ΔE Greyscale Calman: 2.92 | ∀{0.09-98 Ø4.96}
87% sRGB (Argyll 1.6.3 3D)
57% AdobeRGB 1998 (Argyll 1.6.3 3D)
62.3% AdobeRGB 1998 (Argyll 3D)
87.6% sRGB (Argyll 3D)
61.3% Display P3 (Argyll 3D)
Gamma: 2.32
CCT: 7043 K
| HP EliteBook 745 G5 3UN74EA AUO383D, , 1920x1080, 14" | HP EliteBook 840 G5-3JX66EA AUO3B3D, , 1920x1080, 14" | Lenovo ThinkPad T480s-20L8S02D00 LP140QH2-SPB1, , 2560x1440, 14" | Lenovo ThinkPad T480-20L6S01V00 Lenovo LP140WF6-SPB7, , 1920x1080, 14" | Dell Latitude 5490-TD70X AU Optronics AUO263D, , 1920x1080, 14" | Dell Latitude 7490 AUO503D (D04YD_B140HAN), , 1920x1080, 14" | HP EliteBook 745 G3 2560x1440, 14" | |
|---|---|---|---|---|---|---|---|
| Display | -1% | 17% | -35% | -40% | 10% | 17% | |
| Display P3 Coverage (%) | 61.3 | 60.2 -2% | 72.8 19% | 39.24 -36% | 36.28 -41% | 66.6 9% | 75.7 23% |
| sRGB Coverage (%) | 87.6 | 88.2 1% | 97.9 12% | 58.8 -33% | 54.6 -38% | 96.8 11% | 95.8 9% |
| AdobeRGB 1998 Coverage (%) | 62.3 | 61.3 -2% | 74.1 19% | 40.56 -35% | 37.48 -40% | 67.9 9% | 74.5 20% |
| Response Times | -24% | -12% | -1% | -30% | -24% | -18% | |
| Response Time Grey 50% / Grey 80% * (ms) | 35 ? | 42.4 ? -21% | 38.4 ? -10% | 35.6 ? -2% | 46.9 ? -34% | 41.6 ? -19% | 46.8 ? -34% |
| Response Time Black / White * (ms) | 25 ? | 31.6 ? -26% | 28.4 ? -14% | 24.8 ? 1% | 31.2 ? -25% | 32 ? -28% | 25.2 ? -1% |
| PWM Frequency (Hz) | |||||||
| Screen | -18% | -17% | -38% | -38% | -27% | -28% | |
| Brightness middle (cd/m²) | 421 | 414 -2% | 352 -16% | 307 -27% | 227 -46% | 308.6 -27% | 319 -24% |
| Brightness (cd/m²) | 398 | 387 -3% | 343 -14% | 295 -26% | 211 -47% | 294 -26% | 301 -24% |
| Brightness Distribution (%) | 86 | 87 1% | 91 6% | 90 5% | 88 2% | 89 3% | 74 -14% |
| Black Level * (cd/m²) | 0.27 | 0.25 7% | 0.46 -70% | 0.25 7% | 0.19 30% | 0.23 15% | 0.29 -7% |
| Contrast (:1) | 1559 | 1656 6% | 765 -51% | 1228 -21% | 1195 -23% | 1342 -14% | 1100 -29% |
| Colorchecker dE 2000 * | 4.08 | 5.5 -35% | 3.3 19% | 5.7 -40% | 5.6 -37% | 6.07 -49% | 7.23 -77% |
| Colorchecker dE 2000 max. * | 7.48 | 9.9 -32% | 7.3 2% | 21.3 -185% | 22.4 -199% | 10.58 -41% | |
| Greyscale dE 2000 * | 2.92 | 6.4 -119% | 5.3 -82% | 3.7 -27% | 2.4 18% | 7.3 -150% | 6 -105% |
| Gamma | 2.32 95% | 2.31 95% | 2.22 99% | 2.11 104% | 2.44 90% | 2.061 107% | 2.14 103% |
| CCT | 7043 92% | 7811 83% | 6452 101% | 7353 88% | 6506 100% | 7269 89% | 6904 94% |
| Color Space (Percent of AdobeRGB 1998) (%) | 57 | 56.9 0% | 68.4 20% | 37.4 -34% | 34.5 -39% | 62 9% | 65.8 15% |
| Color Space (Percent of sRGB) (%) | 87 | 88.1 1% | 98 13% | 58.7 -33% | 54.4 -37% | 97 11% | 95.3 10% |
| Colorchecker dE 2000 calibrated * | 2.3 | 4.7 | 1.67 | ||||
| Média Total (Programa/Configurações) | -14% /
-15% | -4% /
-10% | -25% /
-32% | -36% /
-37% | -14% /
-19% | -10% /
-17% |
* ... menor é melhor
Exibir tempos de resposta
| ↔ Tempo de resposta preto para branco | ||
|---|---|---|
| 25 ms ... ascensão ↗ e queda ↘ combinadas | ↗ 15 ms ascensão | 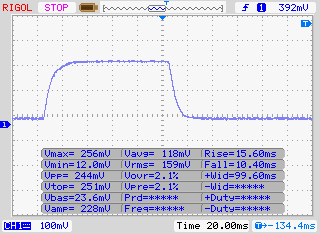 |
| ↘ 10 ms queda | ||
| A tela mostra taxas de resposta relativamente lentas em nossos testes e pode ser muito lenta para os jogadores. Em comparação, todos os dispositivos testados variam de 0.1 (mínimo) a 240 (máximo) ms. » 59 % de todos os dispositivos são melhores. Isso significa que o tempo de resposta medido é pior que a média de todos os dispositivos testados (19.8 ms). | ||
| ↔ Tempo de resposta 50% cinza a 80% cinza | ||
| 35 ms ... ascensão ↗ e queda ↘ combinadas | ↗ 17 ms ascensão | 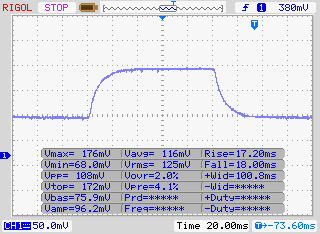 |
| ↘ 18 ms queda | ||
| A tela mostra taxas de resposta lentas em nossos testes e será insatisfatória para os jogadores. Em comparação, todos os dispositivos testados variam de 0.165 (mínimo) a 636 (máximo) ms. » 49 % de todos os dispositivos são melhores. Isso significa que o tempo de resposta medido é pior que a média de todos os dispositivos testados (31 ms). | ||
Cintilação da tela / PWM (modulação por largura de pulso)
| Tela tremeluzindo / PWM não detectado |  | ||
[pwm_comparison] Em comparação: 52 % de todos os dispositivos testados não usam PWM para escurecer a tela. Se PWM foi detectado, uma média de 7754 (mínimo: 5 - máximo: 343500) Hz foi medida. | |||
| PCMark 8 Home Score Accelerated v2 | 3155 pontos | |
| PCMark 8 Work Score Accelerated v2 | 4403 pontos | |
| PCMark 10 Score | 2712 pontos | |
Ajuda | ||
| HP EliteBook 745 G5 3UN74EA Toshiba XG5 KXG50ZNV256G | HP EliteBook 840 G5-3JX66EA Toshiba XG5 KXG50ZNV256G | Lenovo ThinkPad T480s-20L8S02D00 Samsung SSD PM981 MZVLB512HAJQ | Lenovo ThinkPad T480-20L6S01V00 Samsung SSD PM981 MZVLB512HAJQ | Dell Latitude 5490-TD70X Toshiba KSG60ZMV512G | HP EliteBook 745 G3 Samsung SSD PM851 256 GB MZNTE256HMHP | HP EliteBook 840 G5-3JX61EA Toshiba KXG50ZNV1T02 | Média Toshiba XG5 KXG50ZNV256G | |
|---|---|---|---|---|---|---|---|---|
| CrystalDiskMark 3.0 | 16% | 165% | 61% | 0% | -22% | 67% | 19% | |
| Read Seq (MB/s) | 1549 | 1929 25% | 1540 -1% | 922 -40% | 465.1 -70% | 446.1 -71% | 2087 35% | 1843 ? 19% |
| Write Seq (MB/s) | 269.7 | 340 26% | 1613 498% | 928 244% | 425 58% | 268.9 0% | 907 236% | 394 ? 46% |
| Read 512 (MB/s) | 823 | 908 10% | 835 1% | 561 -32% | 410.1 -50% | 361.6 -56% | 993 21% | 832 ? 1% |
| Write 512 (MB/s) | 298.1 | 286.1 -4% | 1716 476% | 567 90% | 360.7 21% | 268.8 -10% | 623 109% | 331 ? 11% |
| Read 4k (MB/s) | 24.9 | 30.94 24% | 66.9 169% | 64.4 159% | 27.34 10% | 27.12 9% | 32.84 32% | 28.1 ? 13% |
| Write 4k (MB/s) | 97.1 | 94.5 -3% | 160.6 65% | 108 11% | 89 -8% | 84.4 -13% | 110.1 13% | 105.8 ? 9% |
| Read 4k QD32 (MB/s) | 310.6 | 244.7 -21% | 444.9 43% | 383.4 23% | 295.6 -5% | 239.8 -23% | 312.1 0% | 309 ? -1% |
| Write 4k QD32 (MB/s) | 208.4 | 351.3 69% | 343 65% | 271.4 30% | 300.2 44% | 188.9 -9% | 391.5 88% | 320 ? 54% |

| 3DMark 11 Performance | 2919 pontos | |
| 3DMark Cloud Gate Standard Score | 8100 pontos | |
| 3DMark Fire Strike Score | 1556 pontos | |
Ajuda | ||
| BioShock Infinite - 1280x720 Very Low Preset | |
| Lenovo ThinkPad T480s-20L8S02E00 | |
| Média AMD Radeon RX Vega 10 (65.7 - 123.7, n=14) | |
| HP EliteBook 745 G5 3UN74EA | |
| HP EliteBook 840 G5-3JX66EA | |
| baixo | média | alto | ultra | |
|---|---|---|---|---|
| BioShock Infinite (2013) | 84.7 | 14.2 | ||
| Rise of the Tomb Raider (2016) | 33.5 | 10.9 | ||
| Civilization 6 (2016) | 56.5 | 13.7 |
Barulho
| Ocioso |
| 30.5 / 30.5 / 30.5 dB |
| Carga |
| 36 / 36 dB |
 | ||
30 dB silencioso 40 dB(A) audível 50 dB(A) ruidosamente alto |
||
min: | ||
(+) A temperatura máxima no lado superior é 38.4 °C / 101 F, em comparação com a média de 34.3 °C / 94 F , variando de 21.2 a 62.5 °C para a classe Office.
(+) A parte inferior aquece até um máximo de 35.8 °C / 96 F, em comparação com a média de 36.8 °C / 98 F
(+) Em uso inativo, a temperatura média para o lado superior é 28.8 °C / 84 F, em comparação com a média do dispositivo de 29.5 °C / ### class_avg_f### F.
(+) Os apoios para as mãos e o touchpad são mais frios que a temperatura da pele, com um máximo de 30.3 °C / 86.5 F e, portanto, são frios ao toque.
(-) A temperatura média da área do apoio para as mãos de dispositivos semelhantes foi 27.5 °C / 81.5 F (-2.8 °C / -5 F).
HP EliteBook 745 G5 3UN74EA análise de áudio
(-) | alto-falantes não muito altos (###valor### dB)
Graves 100 - 315Hz
(-) | quase nenhum baixo - em média 27.1% menor que a mediana
(±) | a linearidade dos graves é média (10.7% delta para a frequência anterior)
Médios 400 - 2.000 Hz
(+) | médios equilibrados - apenas 2.4% longe da mediana
(±) | a linearidade dos médios é média (8.6% delta para frequência anterior)
Altos 2 - 16 kHz
(+) | agudos equilibrados - apenas 2.7% longe da mediana
(+) | os máximos são lineares (5.6% delta da frequência anterior)
Geral 100 - 16.000 Hz
(±) | a linearidade do som geral é média (20.2% diferença em relação à mediana)
Comparado com a mesma classe
» 44% de todos os dispositivos testados nesta classe foram melhores, 10% semelhantes, 46% piores
» O melhor teve um delta de 7%, a média foi 21%, o pior foi 53%
Comparado com todos os dispositivos testados
» 53% de todos os dispositivos testados foram melhores, 8% semelhantes, 39% piores
» O melhor teve um delta de 4%, a média foi 23%, o pior foi 134%
HP EliteBook 840 G5-3JX66EA análise de áudio
(+) | os alto-falantes podem tocar relativamente alto (###valor### dB)
Graves 100 - 315Hz
(-) | quase nenhum baixo - em média 24.7% menor que a mediana
(±) | a linearidade dos graves é média (10.1% delta para a frequência anterior)
Médios 400 - 2.000 Hz
(+) | médios equilibrados - apenas 3.3% longe da mediana
(+) | médios são lineares (4.9% delta para frequência anterior)
Altos 2 - 16 kHz
(±) | máximos mais altos - em média 7.1% maior que a mediana
(+) | os máximos são lineares (4.3% delta da frequência anterior)
Geral 100 - 16.000 Hz
(±) | a linearidade do som geral é média (20.6% diferença em relação à mediana)
Comparado com a mesma classe
» 48% de todos os dispositivos testados nesta classe foram melhores, 9% semelhantes, 43% piores
» O melhor teve um delta de 7%, a média foi 21%, o pior foi 53%
Comparado com todos os dispositivos testados
» 55% de todos os dispositivos testados foram melhores, 8% semelhantes, 37% piores
» O melhor teve um delta de 4%, a média foi 23%, o pior foi 134%
| desligado | |
| Ocioso | |
| Carga |
|
Key:
min: | |
| HP EliteBook 745 G5 3UN74EA R7 2700U, Vega 10, Toshiba XG5 KXG50ZNV256G, IPS LED, 1920x1080, 14" | HP EliteBook 840 G5-3JX66EA i5-8250U, UHD Graphics 620, Toshiba XG5 KXG50ZNV256G, IPS, 1920x1080, 14" | Lenovo ThinkPad T480s-20L8S02D00 i5-8250U, UHD Graphics 620, Samsung SSD PM981 MZVLB512HAJQ, IPS, 2560x1440, 14" | Lenovo ThinkPad T480-20L6S01V00 i5-8550U, GeForce MX150, Samsung SSD PM981 MZVLB512HAJQ, IPS, 1920x1080, 14" | Dell Latitude 5490-TD70X i5-8350U, UHD Graphics 620, Toshiba KSG60ZMV512G, IPS, 1920x1080, 14" | Dell Latitude 7490 i5-8350U, UHD Graphics 620, Toshiba KSG60ZMV256G, IPS, 1920x1080, 14" | HP EliteBook 745 G3 Pro A12-8800B, Radeon R7 (Carrizo), Samsung SSD PM851 256 GB MZNTE256HMHP, IPS-Panel, 2560x1440, 14" | HP EliteBook 840 G5-3JX61EA i5-8550U, UHD Graphics 620, Toshiba KXG50ZNV1T02, IPS, 1920x1080, 14" | Lenovo ThinkPad T480s-20L8S02E00 i5-8550U, GeForce MX150, Samsung SSD PM981 MZVLB512HAJQ, IPS LED, 2560x1440, 14" | Média AMD Radeon RX Vega 10 | Média da turma Office | |
|---|---|---|---|---|---|---|---|---|---|---|---|
| Power Consumption | -1% | -10% | -22% | 2% | 27% | -26% | 4% | -20% | 2% | -9% | |
| Idle Minimum * (Watt) | 4.9 | 3.2 35% | 3.1 37% | 3.6 27% | 3.3 33% | 2 59% | 6.2 -27% | 3.8 22% | 3.4 31% | 4.73 ? 3% | 4.26 ? 13% |
| Idle Average * (Watt) | 8.1 | 6.6 19% | 6.8 16% | 7.1 12% | 5.54 32% | 4.7 42% | 9.4 -16% | 8.3 -2% | 7.5 7% | 7.61 ? 6% | 7.31 ? 10% |
| Idle Maximum * (Watt) | 10.6 | 9.5 10% | 10.1 5% | 9.5 10% | 6.59 38% | 5.7 46% | 14.8 -40% | 10.7 -1% | 10.8 -2% | 9.63 ? 9% | 8.55 ? 19% |
| Load Average * (Watt) | 32.2 | 36.2 -12% | 48.4 -50% | 63.9 -98% | 42.4 -32% | 38.4 -19% | 44.8 -39% | 35.5 -10% | 55.4 -72% | 33.3 ? -3% | 43.8 ? -36% |
| Load Maximum * (Watt) | 42.3 | 65.6 -55% | 67.1 -59% | 67.3 -59% | 67.6 -60% | 38.9 8% | 45.2 -7% | 37 13% | 70.3 -66% | 45.1 ? -7% | 64.5 ? -52% |
| Witcher 3 ultra * (Watt) | 53.9 | 34 |
* ... menor é melhor
| HP EliteBook 745 G5 3UN74EA R7 2700U, Vega 10, 50 Wh | HP EliteBook 840 G5-3JX66EA i5-8250U, UHD Graphics 620, 50 Wh | Lenovo ThinkPad T480s-20L8S02D00 i5-8250U, UHD Graphics 620, 57 Wh | Lenovo ThinkPad T480-20L6S01V00 i5-8550U, GeForce MX150, 72 Wh | Dell Latitude 5490-TD70X i5-8350U, UHD Graphics 620, 68 Wh | Dell Latitude 7490 i5-8350U, UHD Graphics 620, 60 Wh | HP EliteBook 745 G3 Pro A12-8800B, Radeon R7 (Carrizo), 46 Wh | HP EliteBook 840 G5-3JX61EA i5-8550U, UHD Graphics 620, 50 Wh | Lenovo ThinkPad T480s-20L8S02E00 i5-8550U, GeForce MX150, 57 Wh | Média da turma Office | |
|---|---|---|---|---|---|---|---|---|---|---|
| Duração da bateria | 37% | 45% | 95% | 89% | 38% | -39% | 12% | 39% | 90% | |
| Reader / Idle (h) | 10.7 | 19 78% | 27.9 161% | 25.9 142% | 7.4 -31% | 22.8 113% | 24.5 ? 129% | |||
| H.264 (h) | 7.1 | 6.7 -6% | 12 69% | 10.6 49% | 13.2 86% | 3.5 -51% | 9.2 30% | 15.5 ? 118% | ||
| WiFi v1.3 (h) | 6.6 | 7.5 14% | 9 36% | 13.2 100% | 15 127% | 9.1 38% | 3.1 -53% | 7.4 12% | 8.8 33% | 13.2 ? 100% |
| Load (h) | 1.6 | 2.6 63% | 2.1 31% | 2.7 69% | 1.6 0% | 1.3 -19% | 1.3 -19% | 1.808 ? 13% |
Pro
Contra
No momento de escrever o veredicto, o HP EliteBook 840 G1 era o melhor dispositivo em nossos rankings. Construído sobre esta base muito boa, um EliteBook 745 G5 com CPUs AMD parece ser bastante promissor!
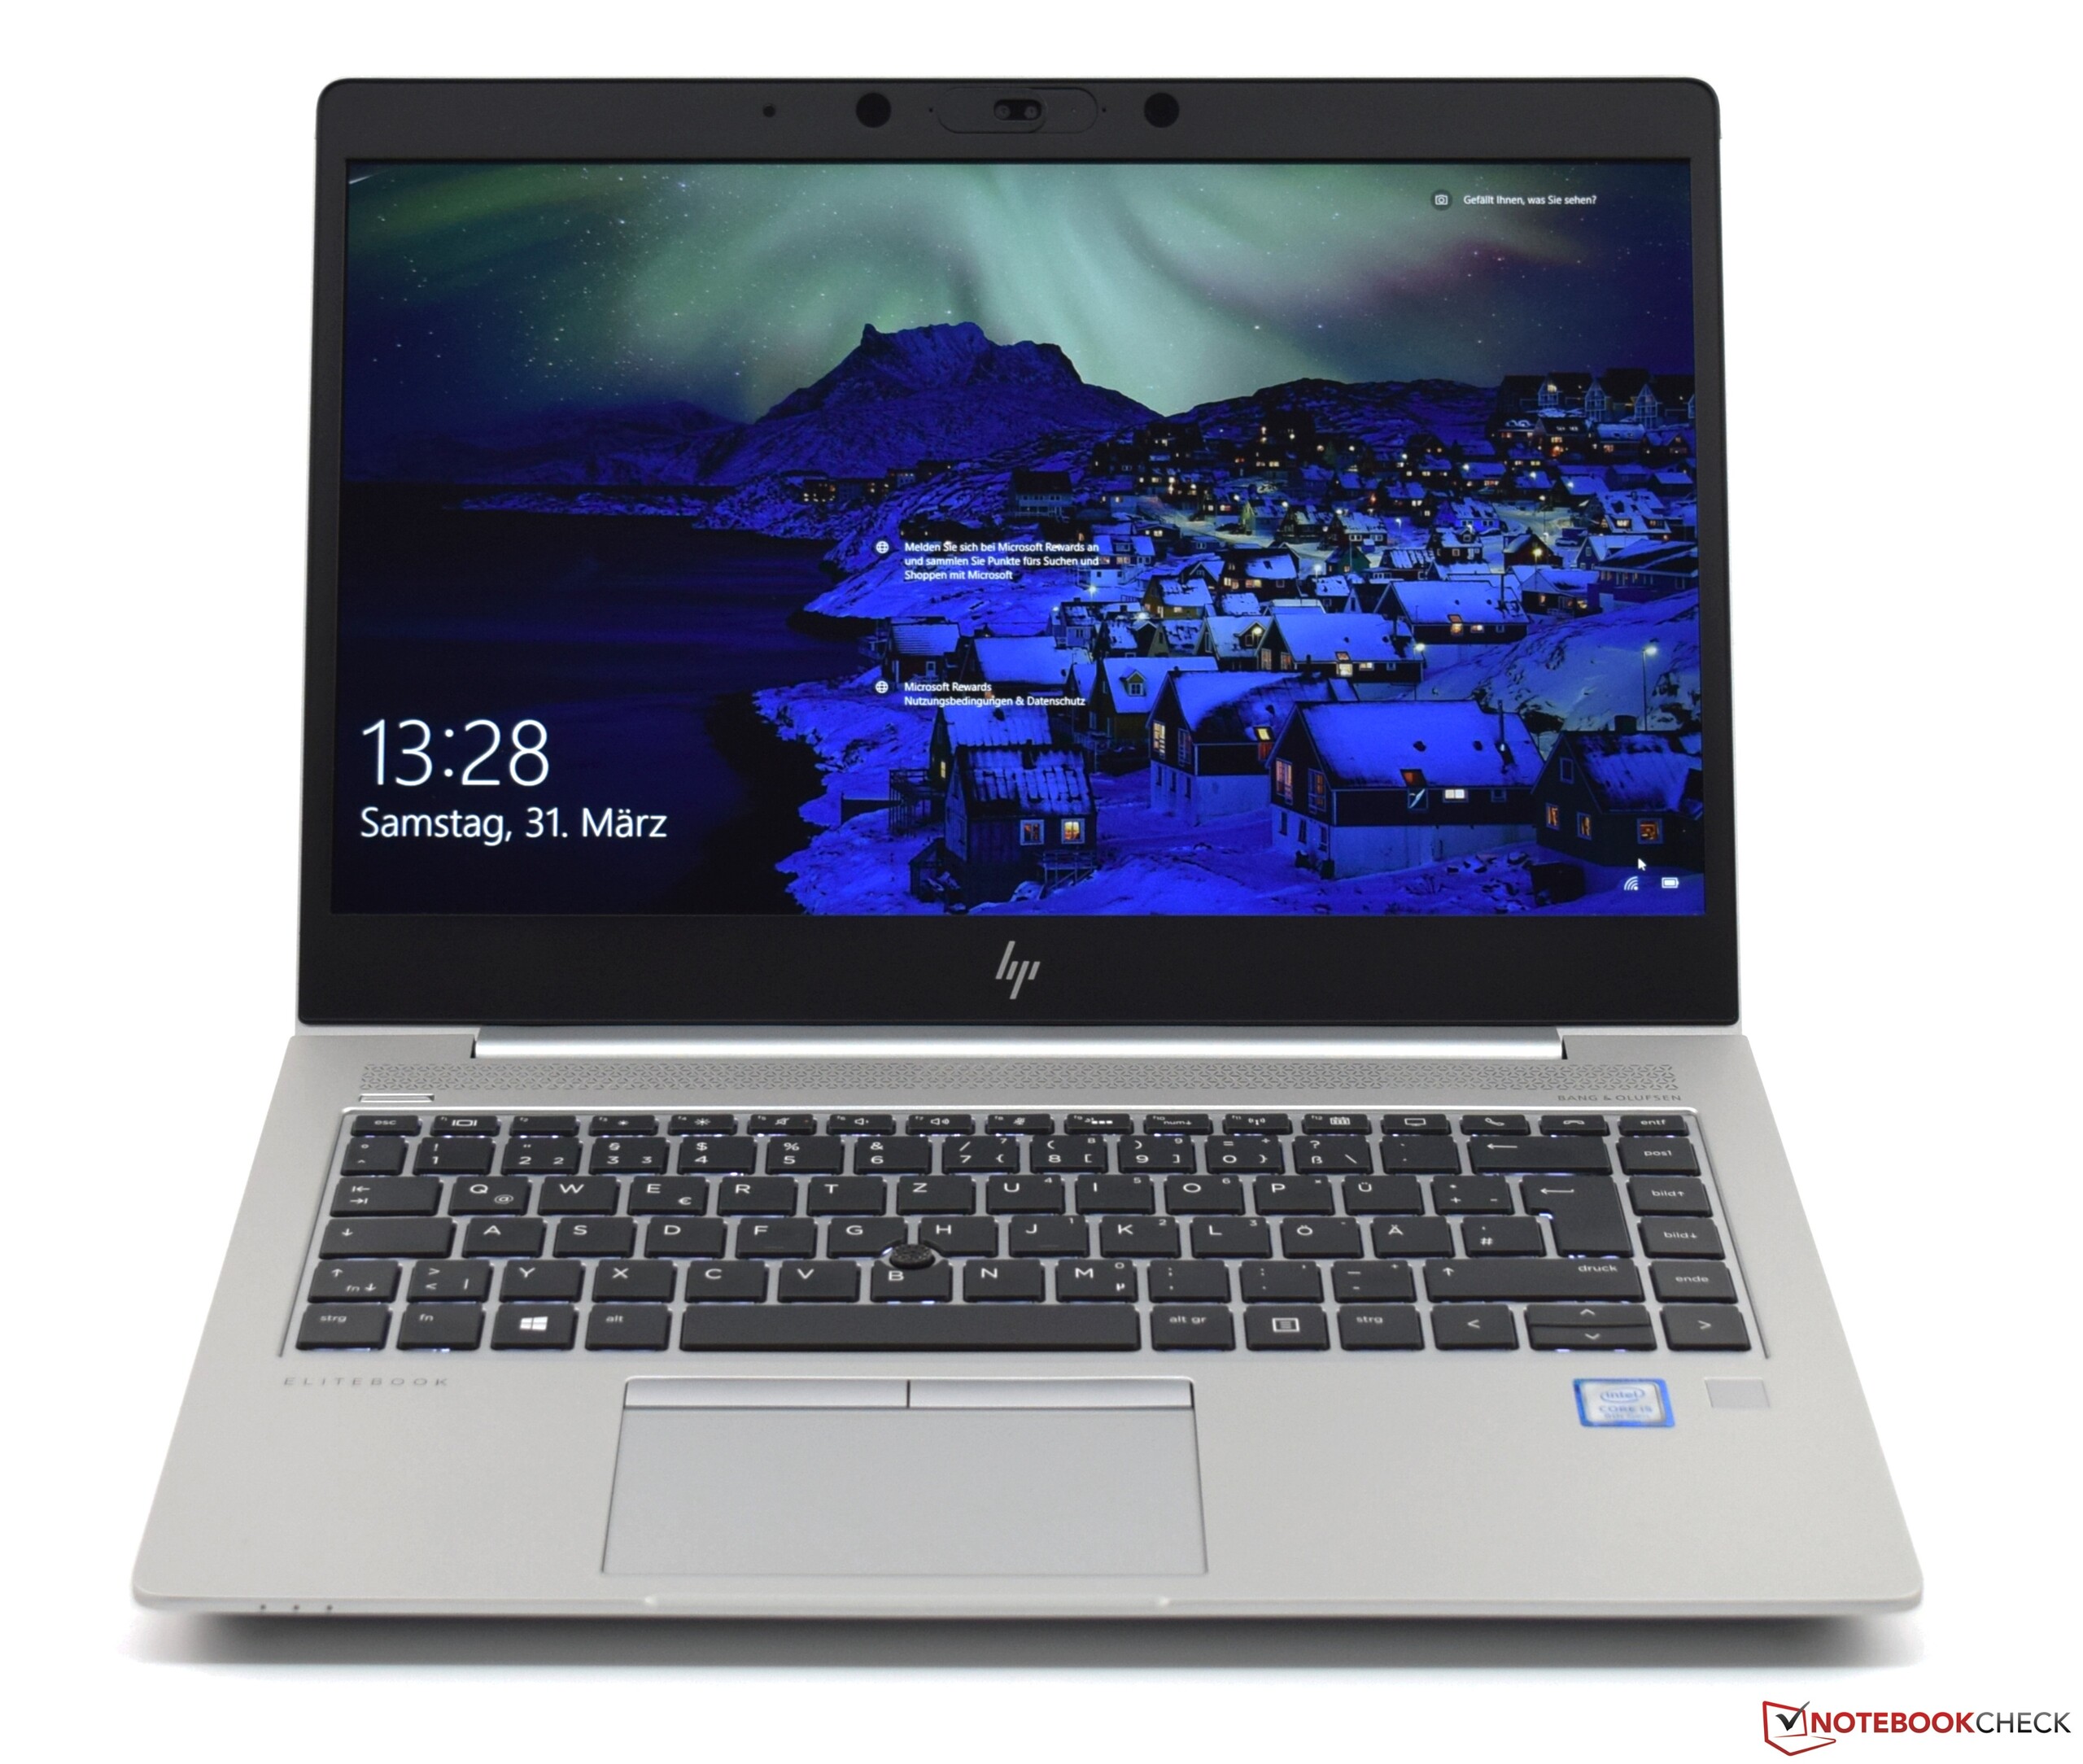
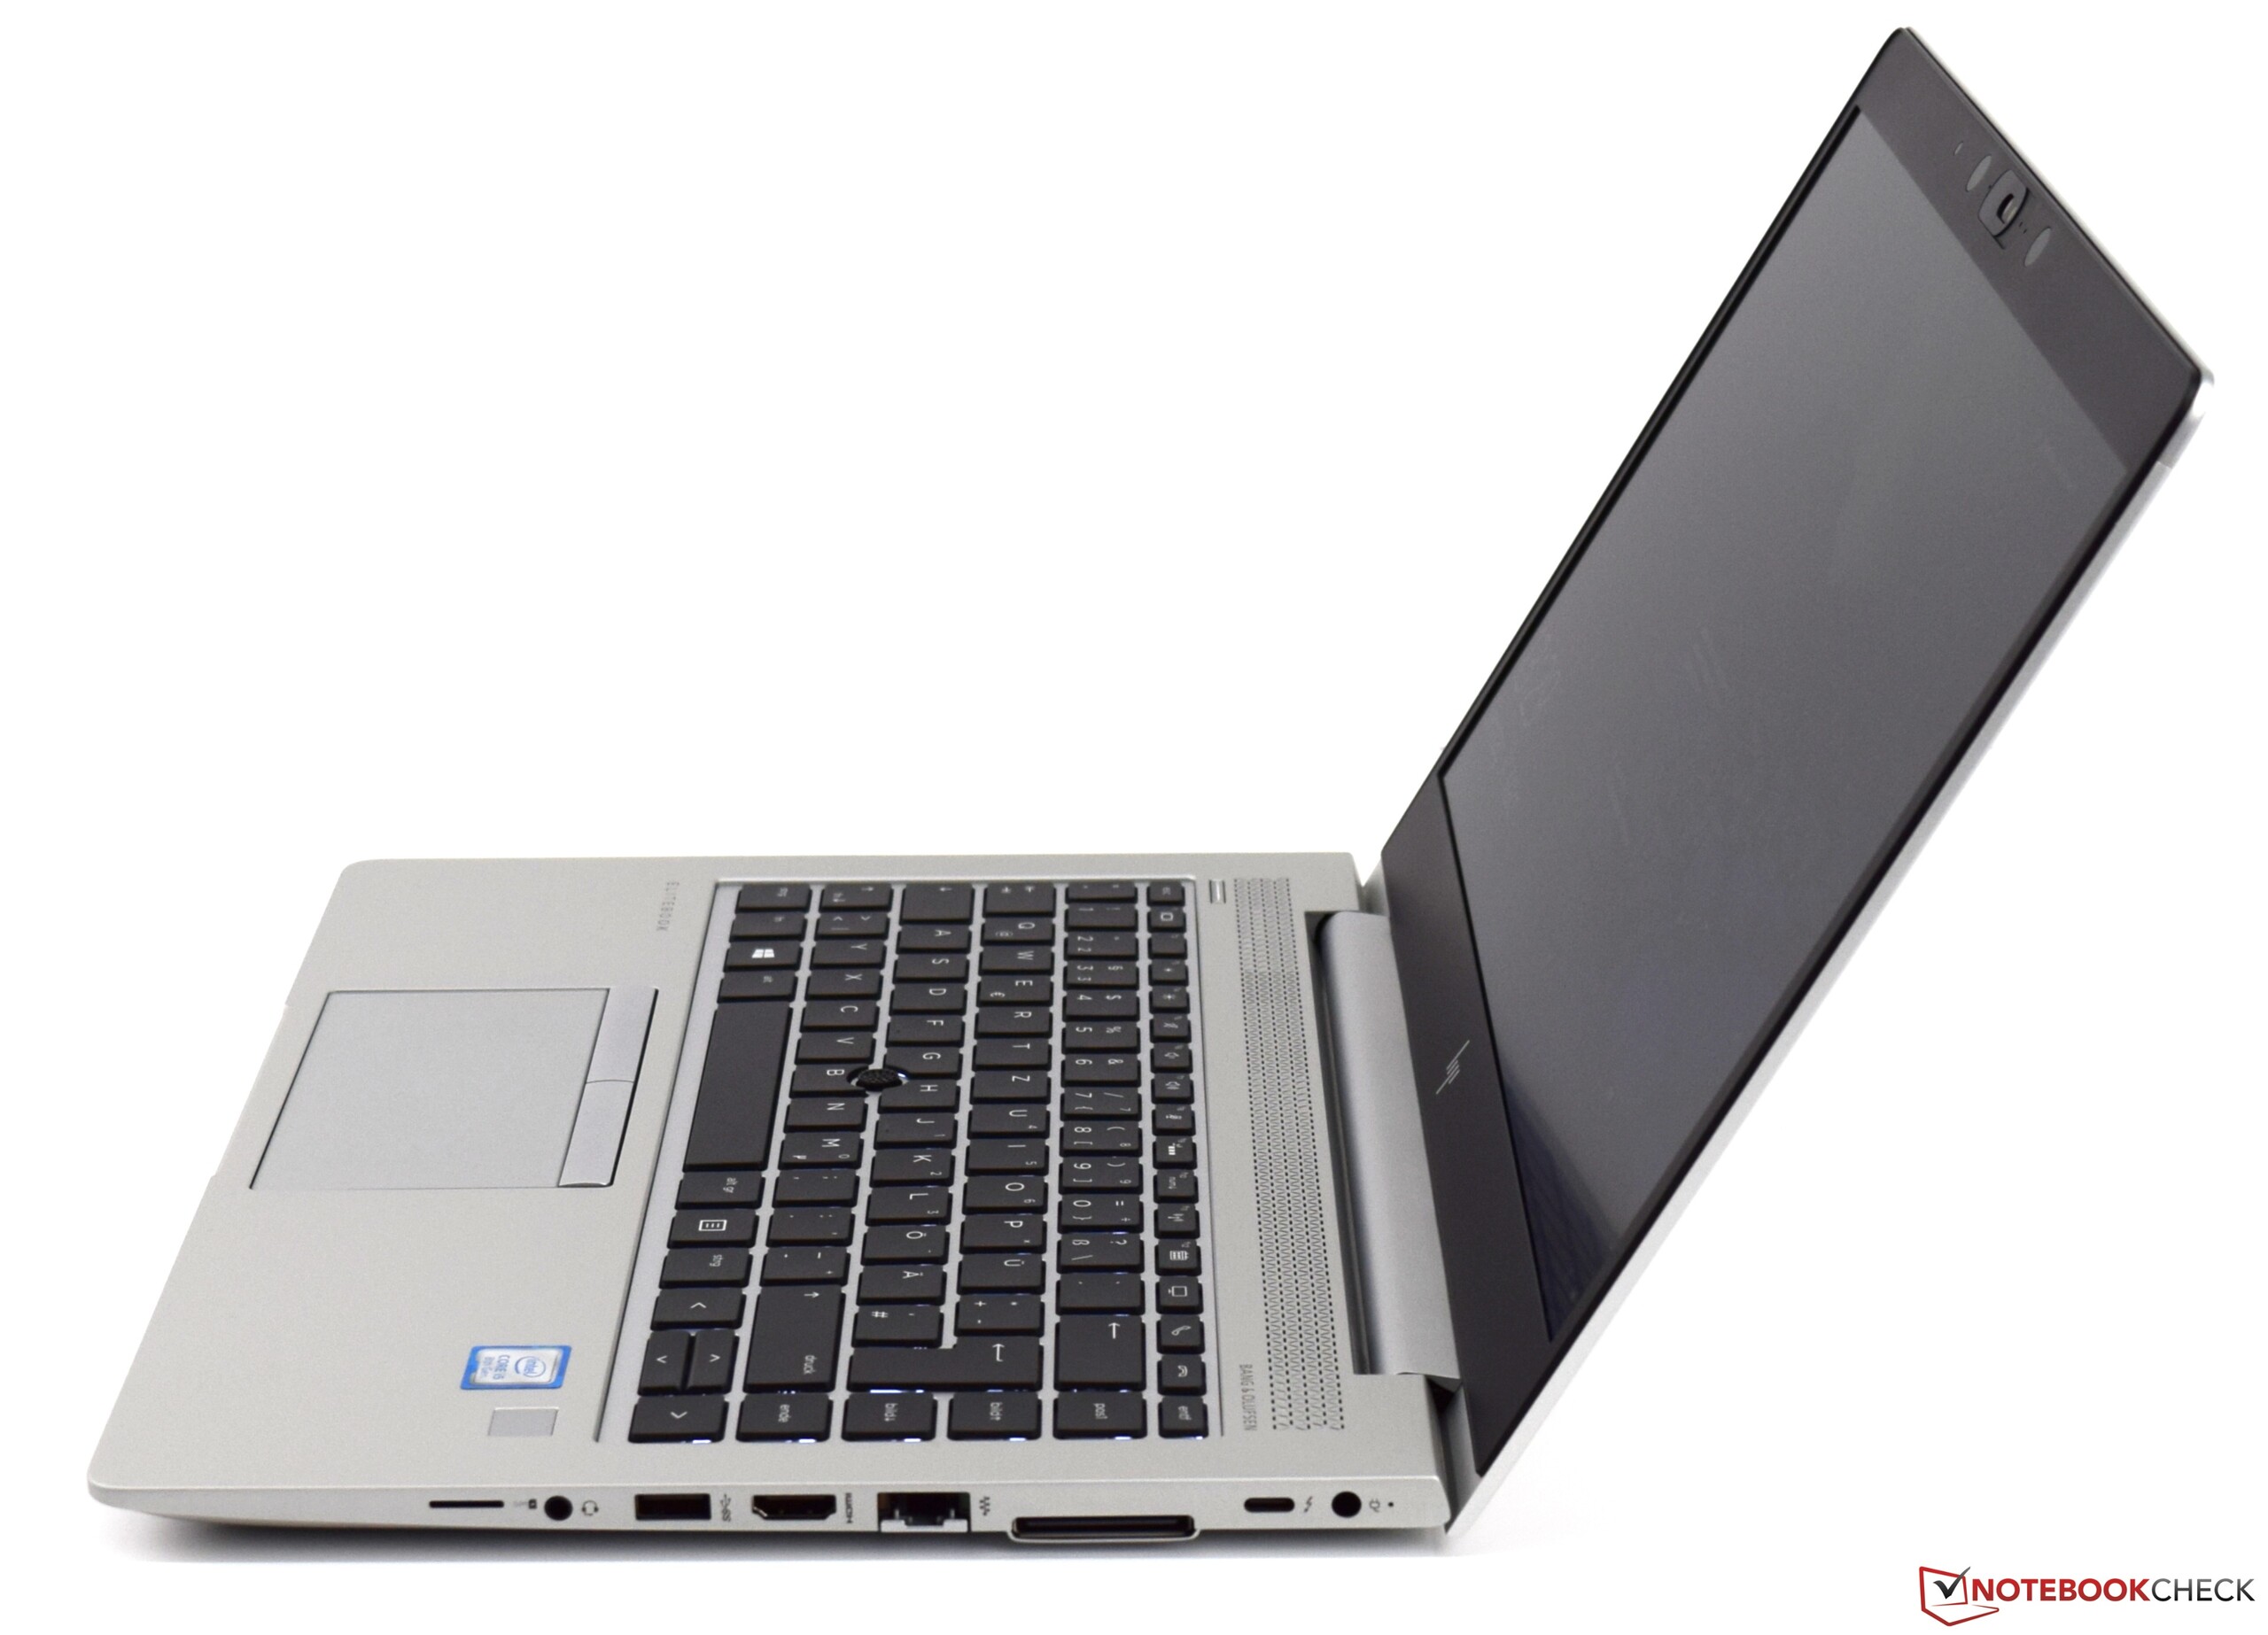
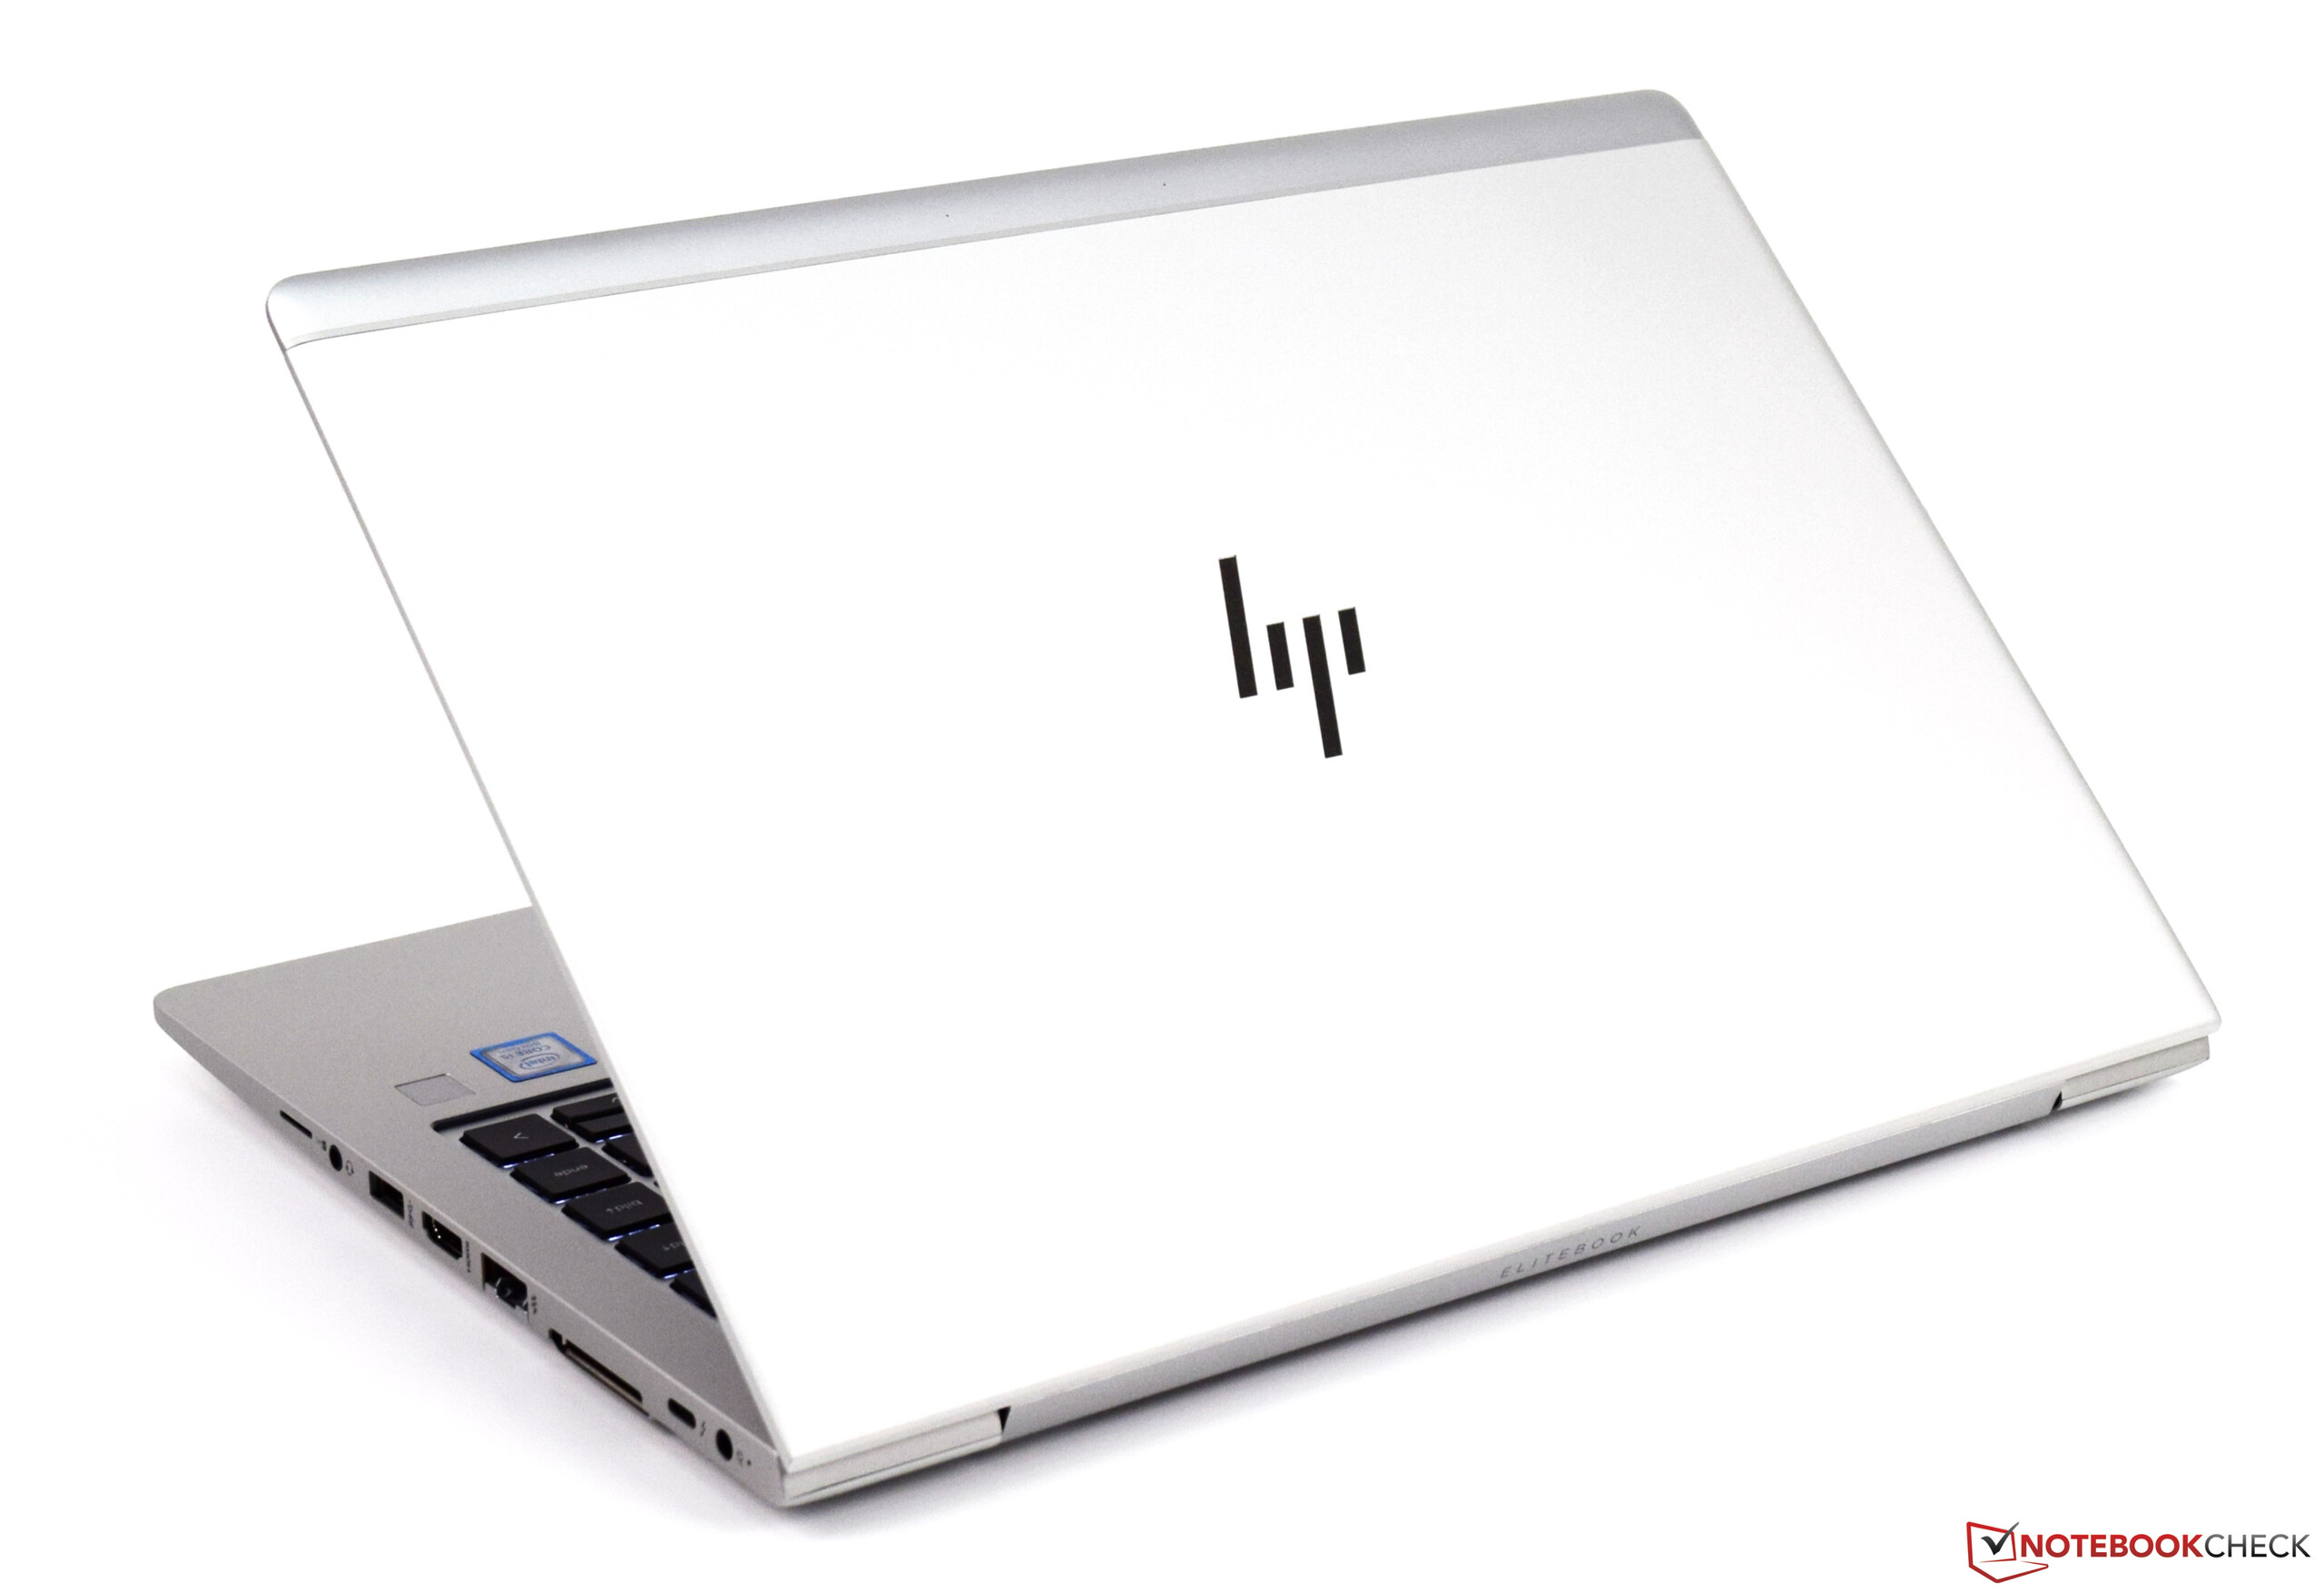
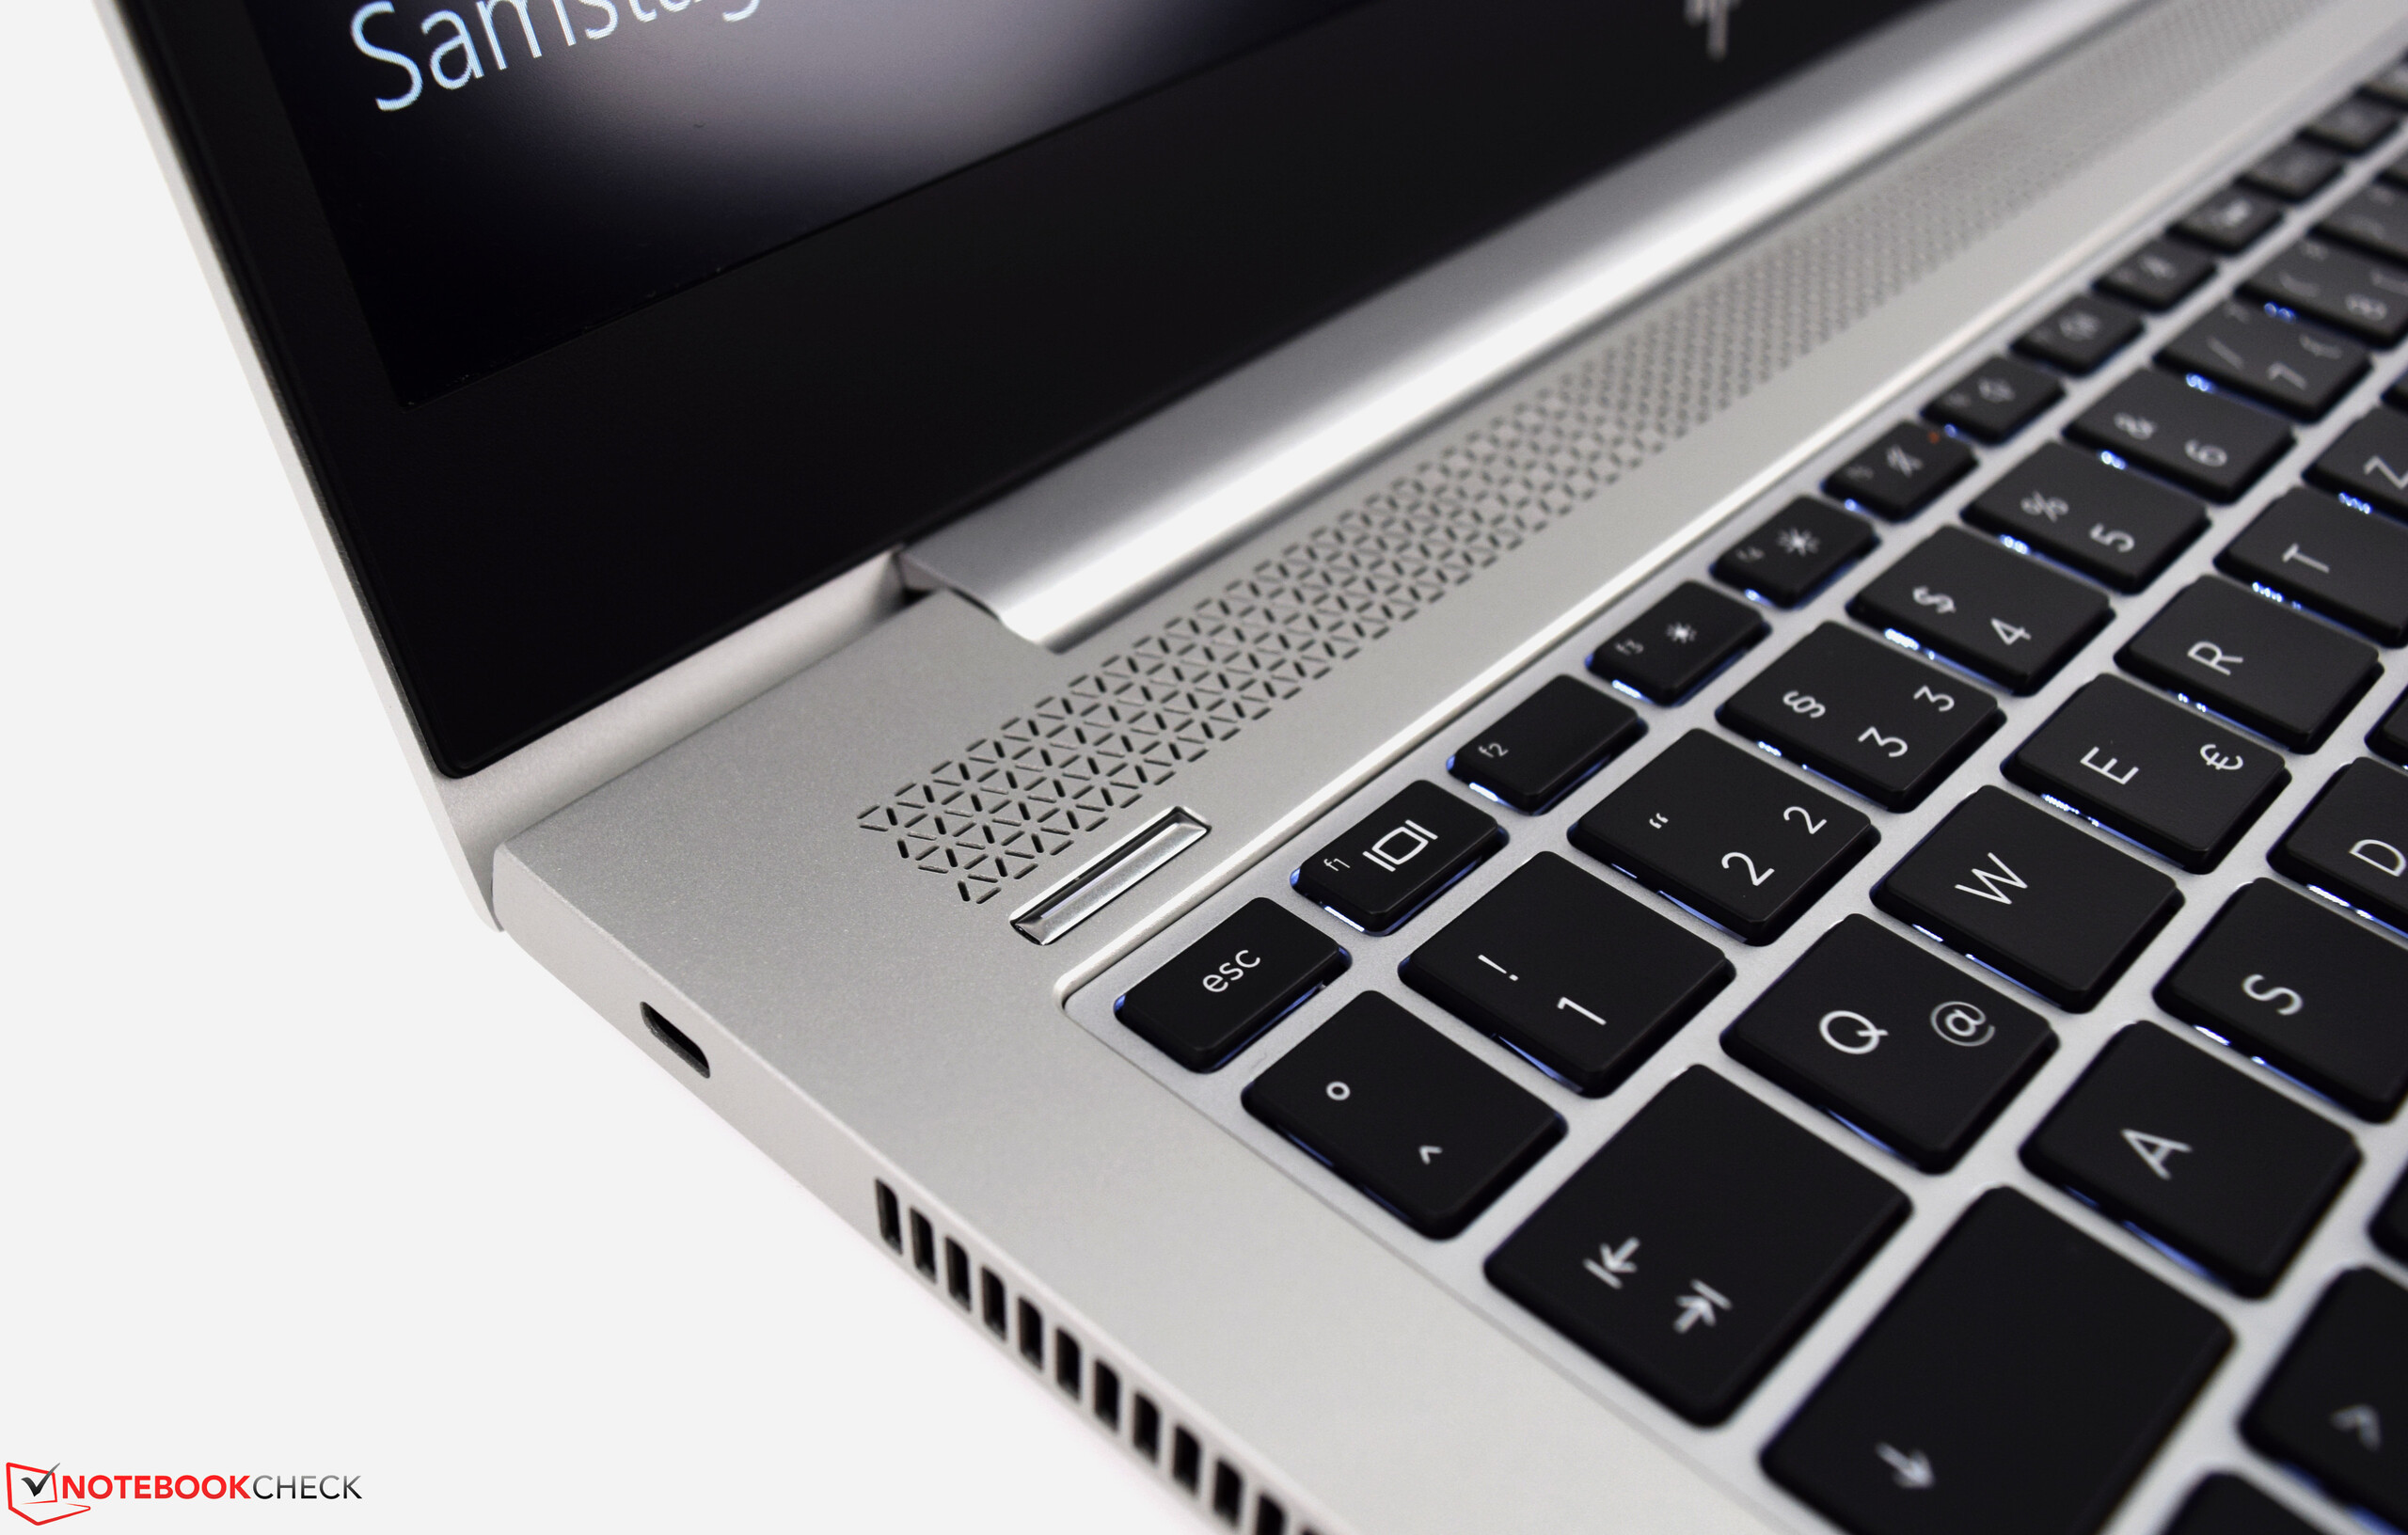
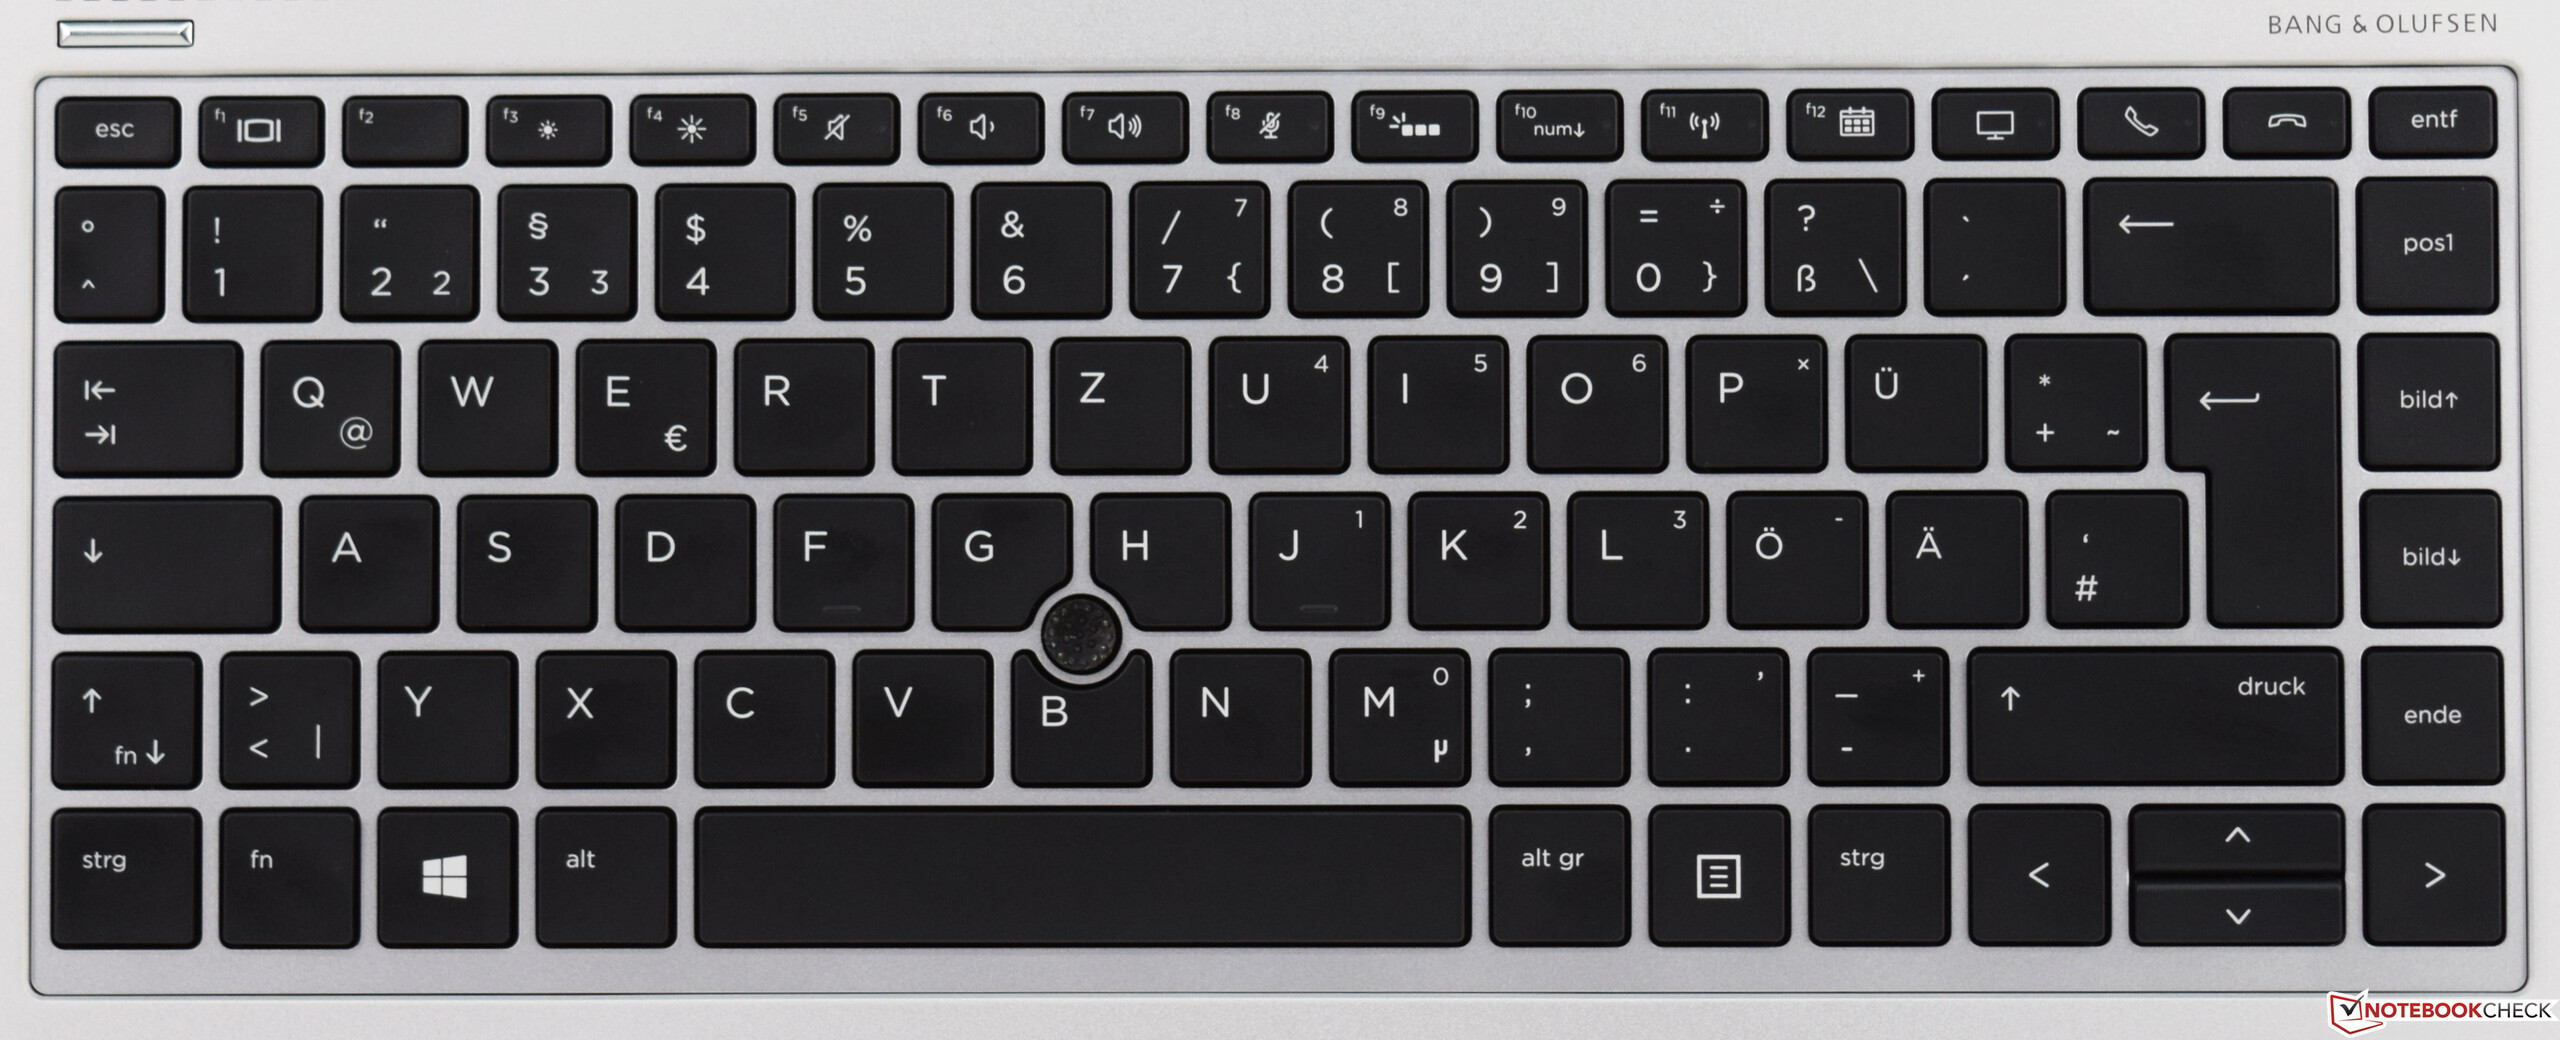
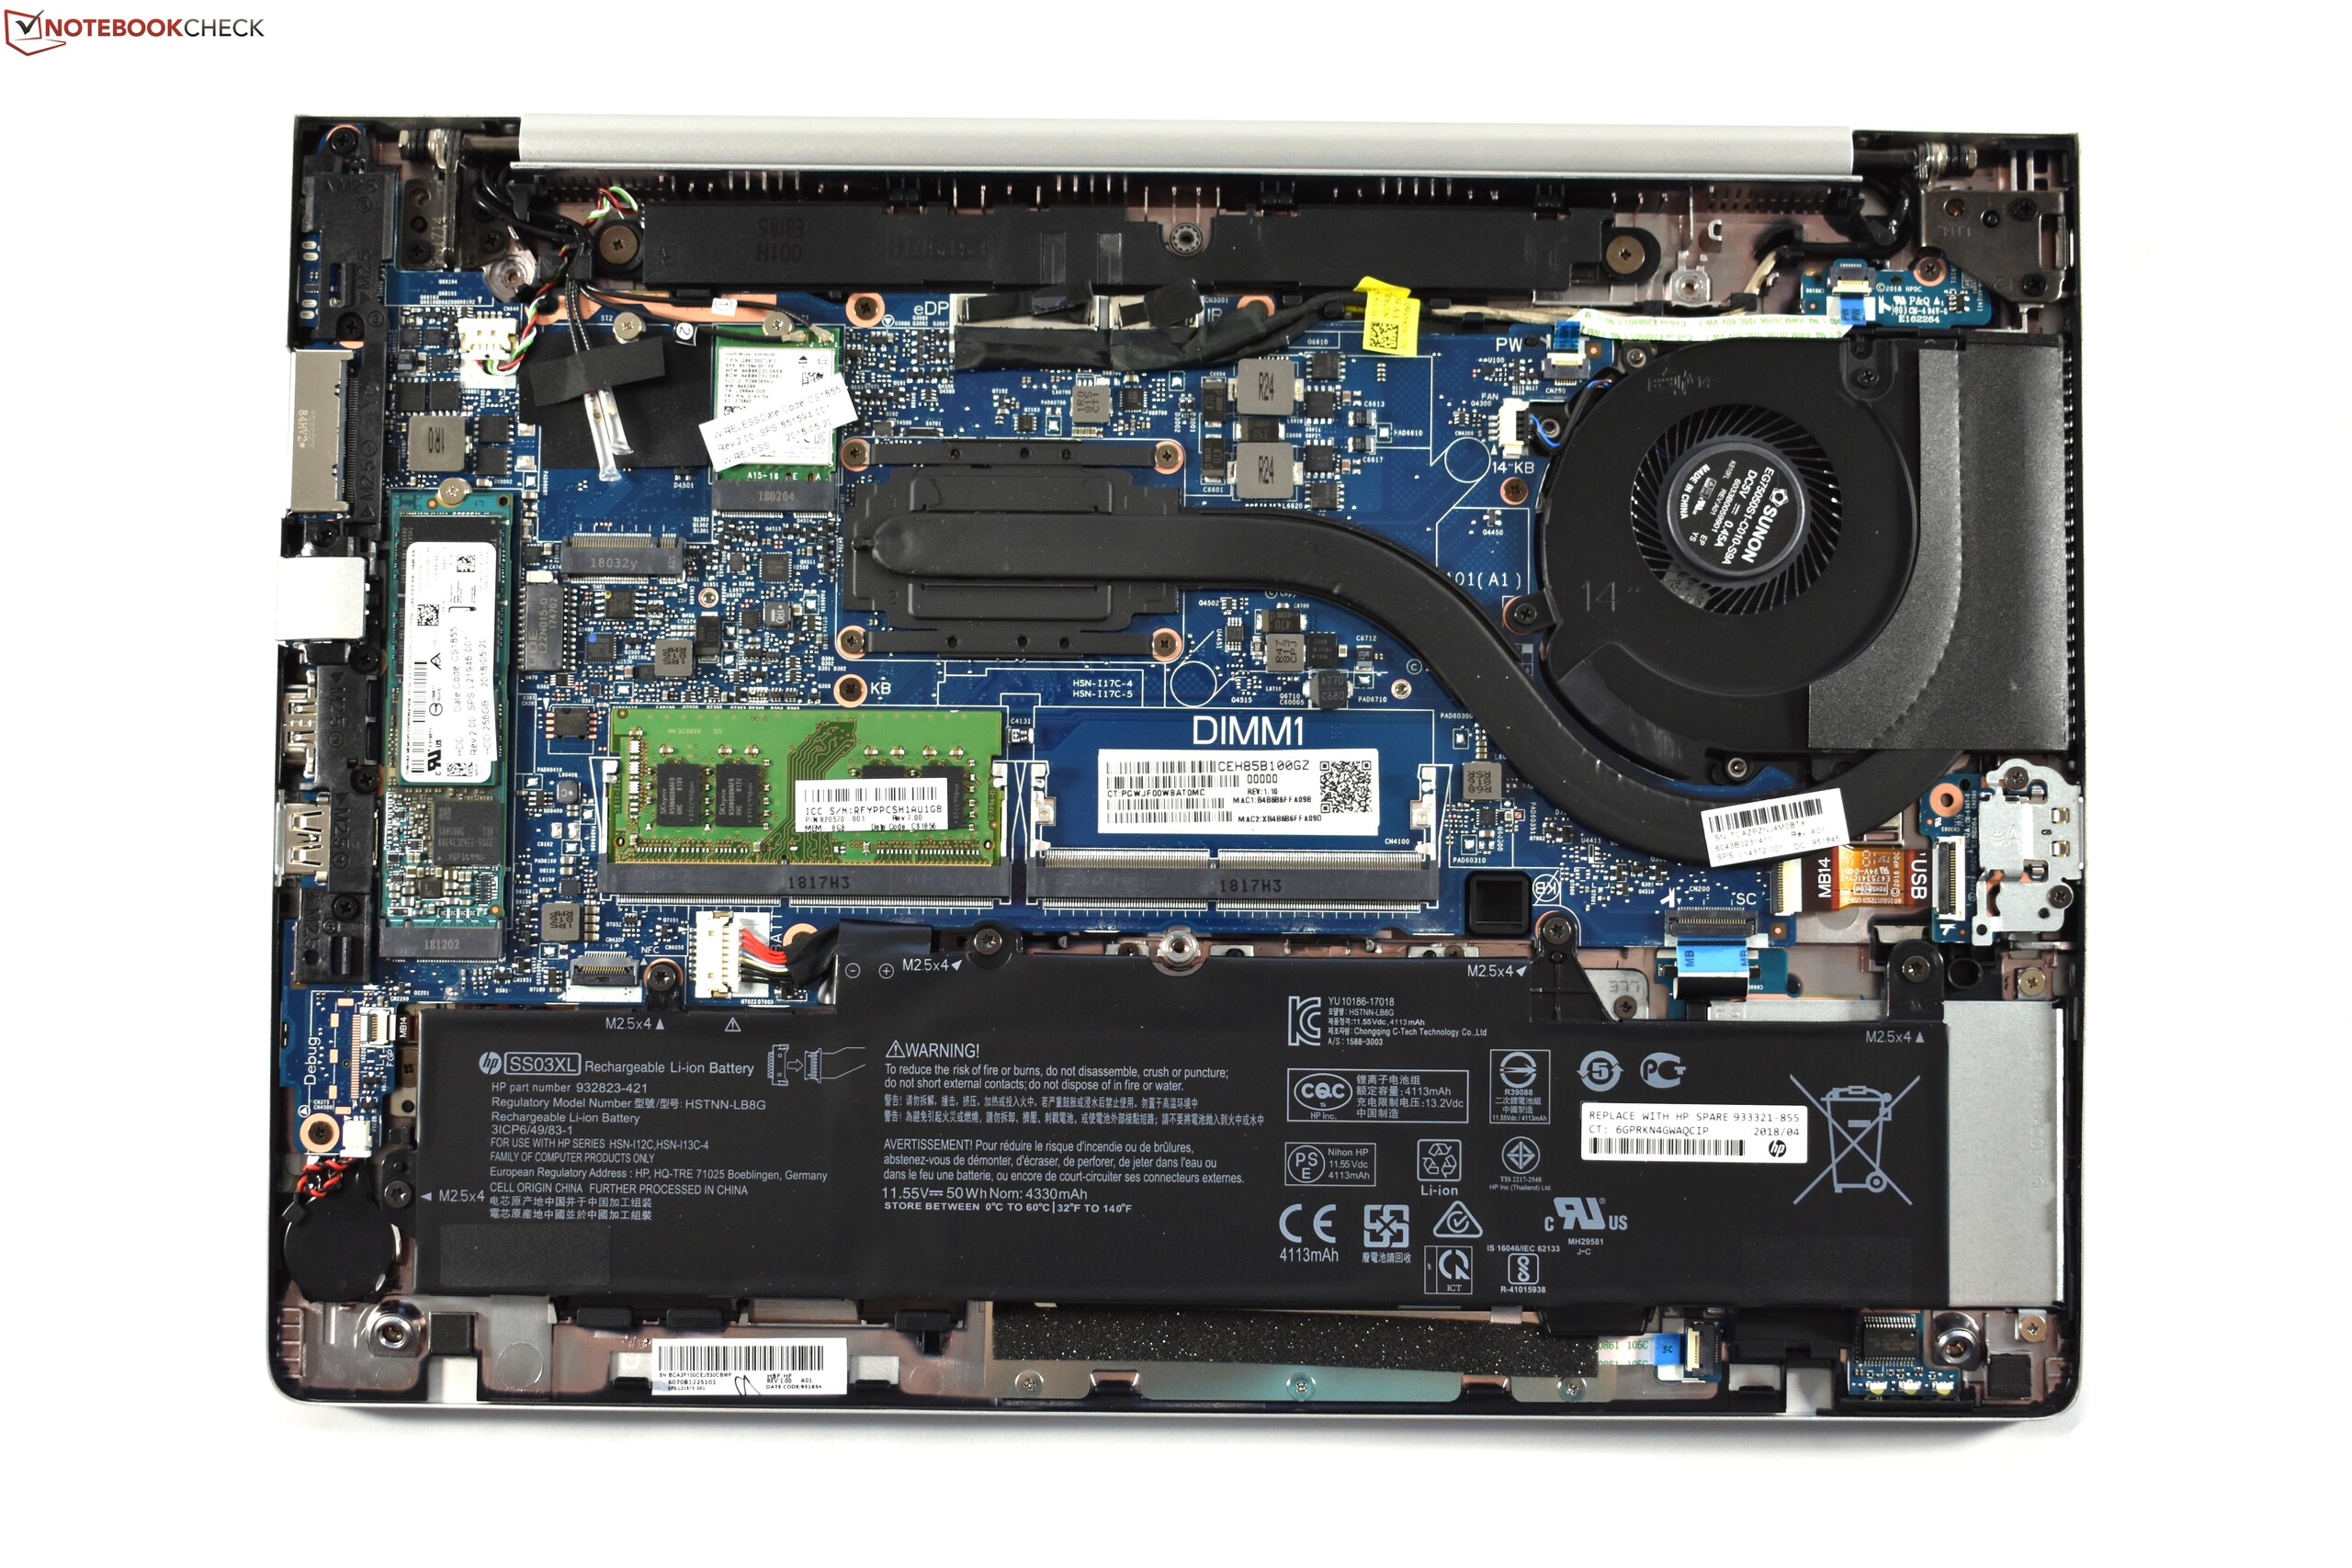
As vantagens do EliteBook 745 G5 são praticamente as mesmas que as da Intel: Ele tem uma carcaça de metal elegante e resistente, com dispositivos de entrada confortáveis e uma tela muito brilhante. Ele está equipado com algumas portas e recursos de segurança fundamentais. Como sua versão irmã, com processador Intel, o EliteBook 745 G5 permanece frio, mesmo sob uso intenso e é completamente silencioso no modo inativo. Além disso, ele vem com uma garantia de 36 meses. No entanto, também há desvantagens: o SSD não é muito rápido para um SSD PCIe-NVMe, e um leitor de cartões SD está totalmente ausente.
Apesar da boa base, o EliteBook 745 G5 não consegue alcançar as pontuações do HP EliteBook 840 G1. A CPU da AMD é uma maldição e bênção ao mesmo tempo. Ele oferece um desempenho significativamente mais alto, mas seu desempenho cai para o nível do portátil da Intel, após quatro minutos. O desempenho da GPU do iGPU é certamente maior do que o desempenho do Intel EliteBook, mas significativamente menor do que poderia ser - ele realmente não substitui as GPUs dedicadas. Isso se origina principalmente do gerenciamento restritivo de temperatura da HP: as capacidades térmicas não estão maximizadas, como você pode ver nas baixas temperaturas da superfície, e, no entanto, a HP está afogando a CPU e a GPU. O consumo de energia quando inativo (e com carga mínima) ainda é maior do que o do portátil da Intel, o que resulta em uma duração de bateria ainda menor. Além disso, a HP restringe desnecessariamente as possibilidades de configuração. O EliteBook 745 G5 não possui uma opção de tela 4K (3.820 x 2.160). À diferença do HP EliteBook 840 G1, ele não conta com uma porta Thunderbolt 3 e a CPU está sendo afogada o tempo todo durante a operação com bateria. O fato de a tela não atinja a cobertura prometida de 100% sRGB também é uma chatice.
Às vezes muito bom não é suficiente: O portátil HP EliteBook 840 G1 da Intel oferece um pacote muito mais completo do que seu equivalente da AMD.
O EliteBook 745 G5 ainda recebe uma recomendação, bem como a avaliação "Muito bom". No entanto, o recomendamos apenas se você estiver evitando computadores Intel categoricamente. Fora isso, você deve considerar o HP EliteBook 840 G5, o Lenovo ThinkPad T480s ou o Dell Latitude 7490, dependendo de seu fabricante, design, e preferências de recursos. A duração da bateria é maior e, se você precisa de mais desempenho gráfico, vale mais a pena ter um portátil com uma GPU dedicada do que o EliteBook 745 G5.
HP EliteBook 745 G5 3UN74EA
- 10/22/2019 v7 (old)
Benjamin Herzig