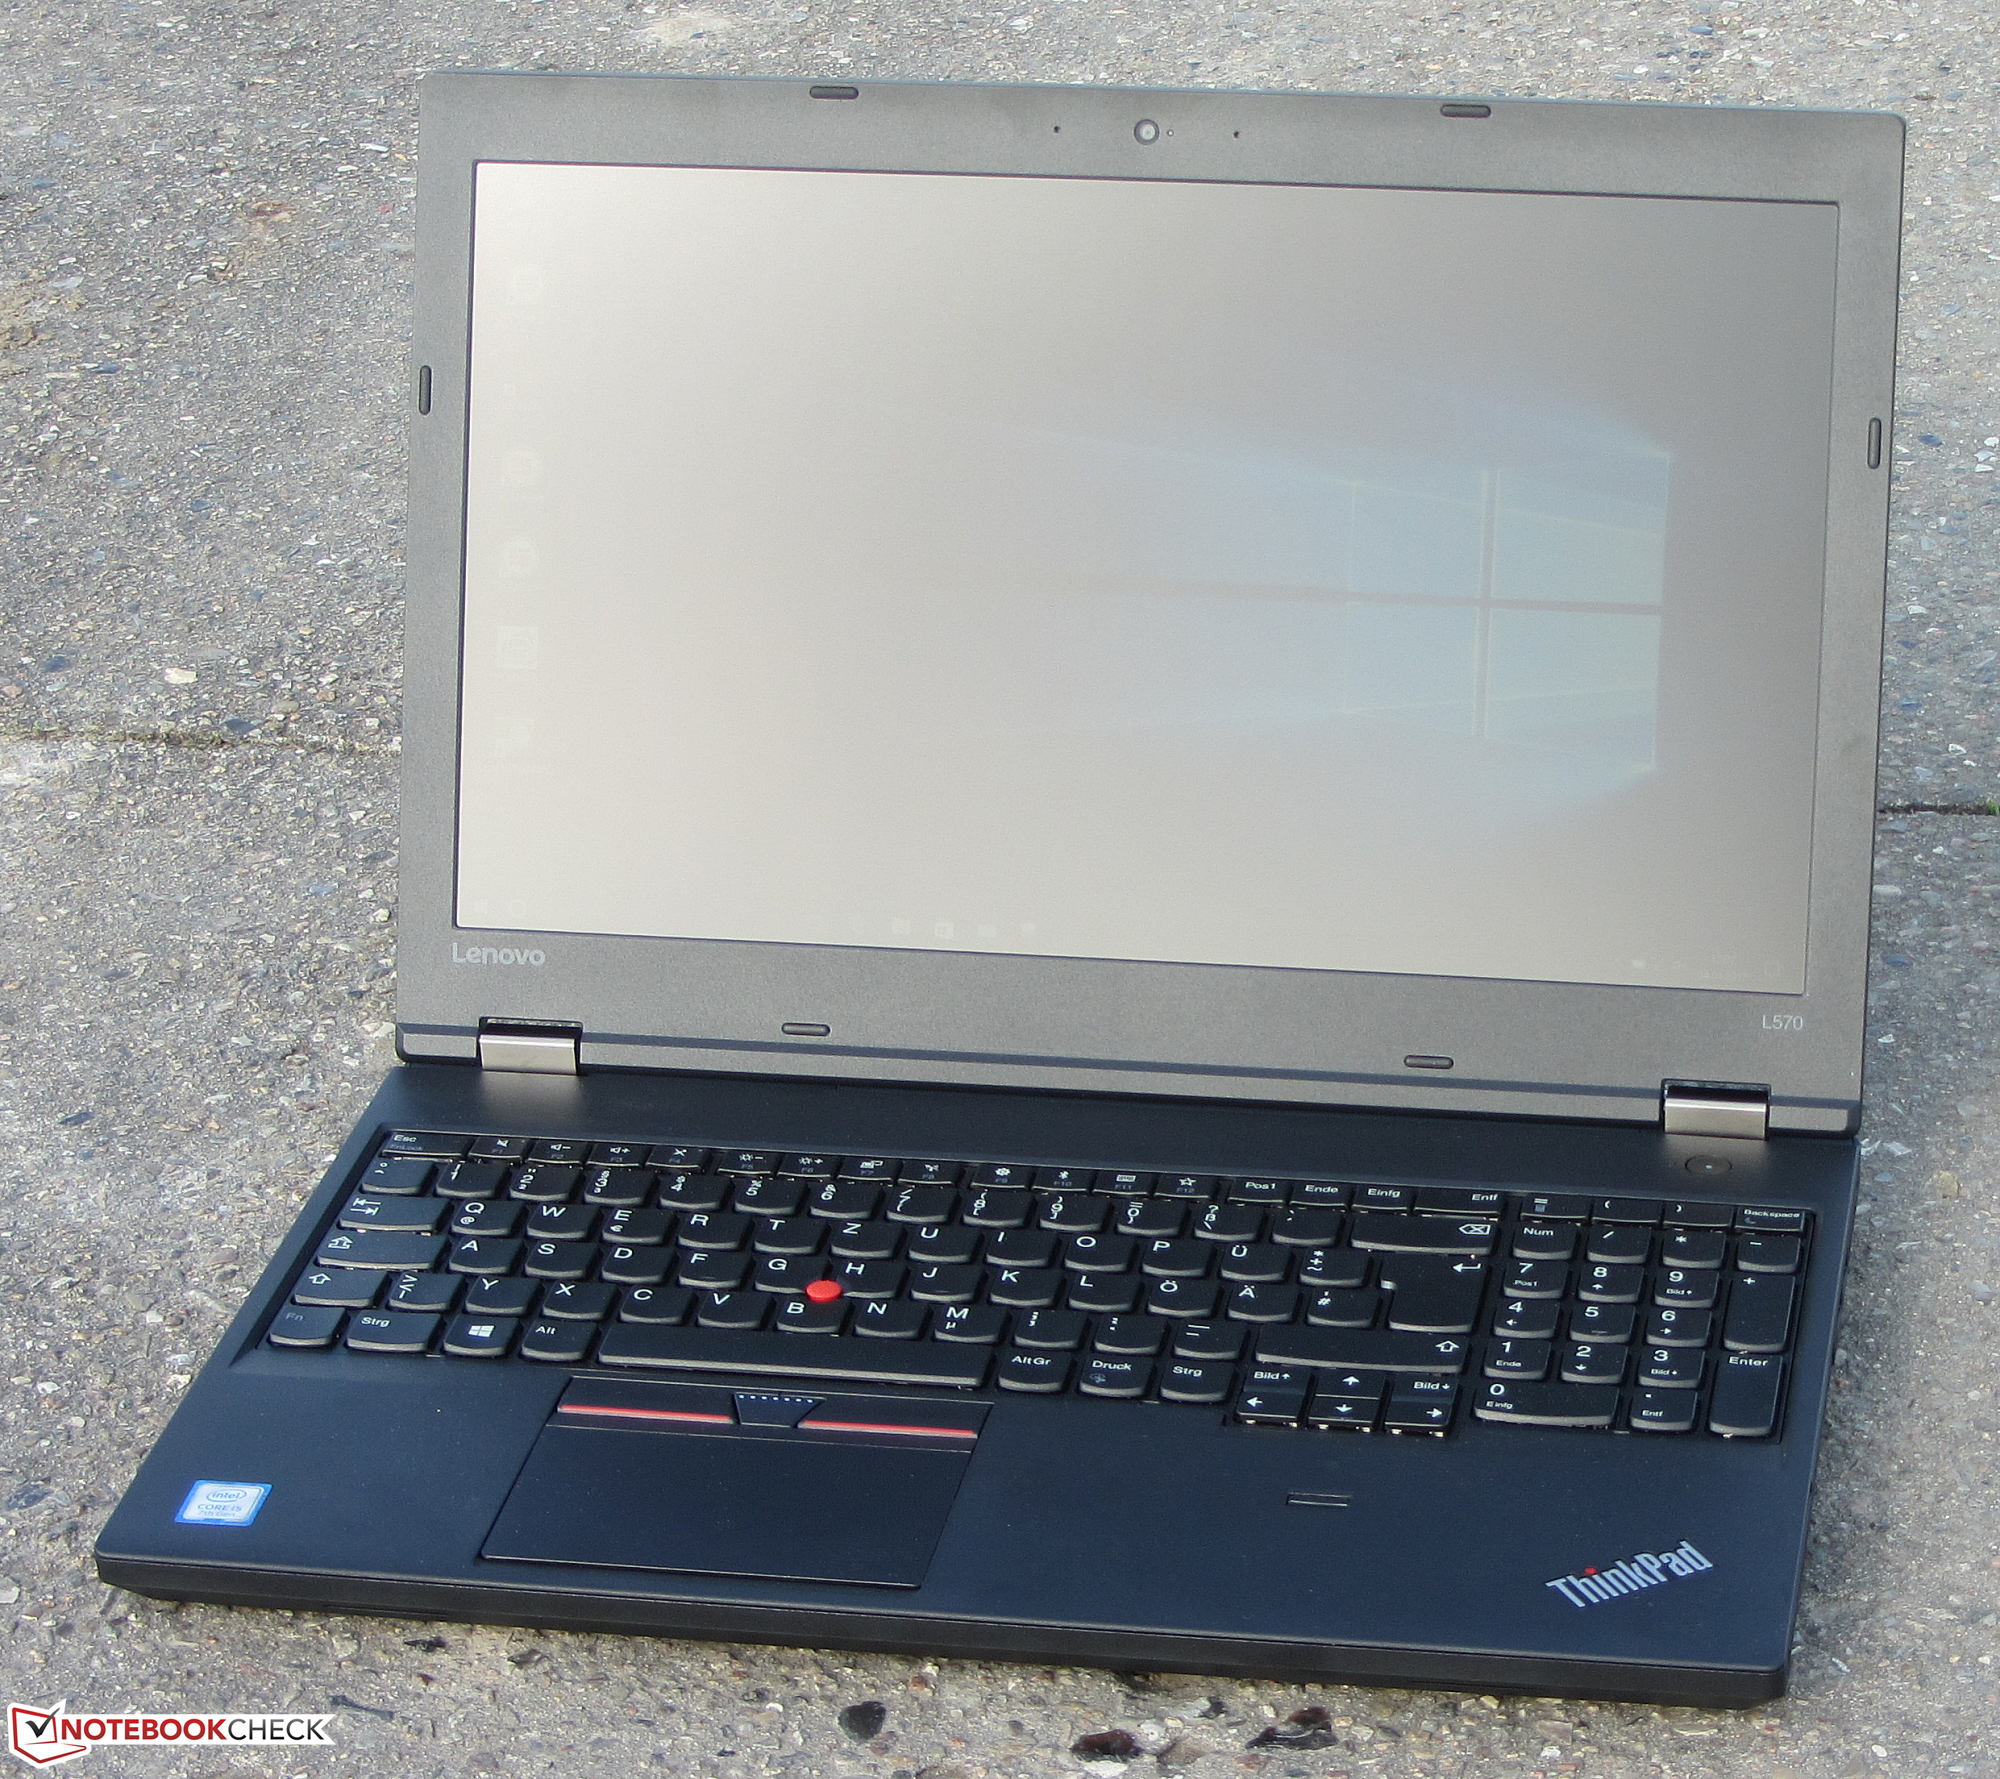
Breve Análise do Portátil Lenovo ThinkPad L570 (7200U, Full HD)
| SD Card Reader | |
| average JPG Copy Test (av. of 3 runs) | |
| Dell Latitude 15 E5570 | |
| Lenovo ThinkPad L560-20F10026GE | |
| HP ProBook 450 G4 Y8B60EA | |
| Lenovo Thinkpad L570 20J9S01600 | |
| HP Probook 650 G3 Z2W44ET | |
| Lenovo ThinkPad E570-20H6S00000 | |
| Dell Vostro 15-5568 | |
| maximum AS SSD Seq Read Test (1GB) | |
| HP ProBook 450 G4 Y8B60EA | |
| HP Probook 650 G3 Z2W44ET | |
| Lenovo ThinkPad E570-20H6S00000 | |
| Lenovo ThinkPad L560-20F10026GE | |
| Dell Vostro 15-5568 | |
| Networking | |
| iperf3 transmit AX12 | |
| Lenovo Thinkpad L570 20J9S01600 | |
| HP Probook 650 G3 Z2W44ET (jseb) | |
| Lenovo ThinkPad E570-20H6S00000 | |
| Dell Vostro 15-5568 | |
| iperf3 receive AX12 | |
| HP Probook 650 G3 Z2W44ET (jseb) | |
| Lenovo ThinkPad E570-20H6S00000 | |
| Lenovo Thinkpad L570 20J9S01600 | |
| Dell Vostro 15-5568 | |
| |||||||||||||||||||||||||
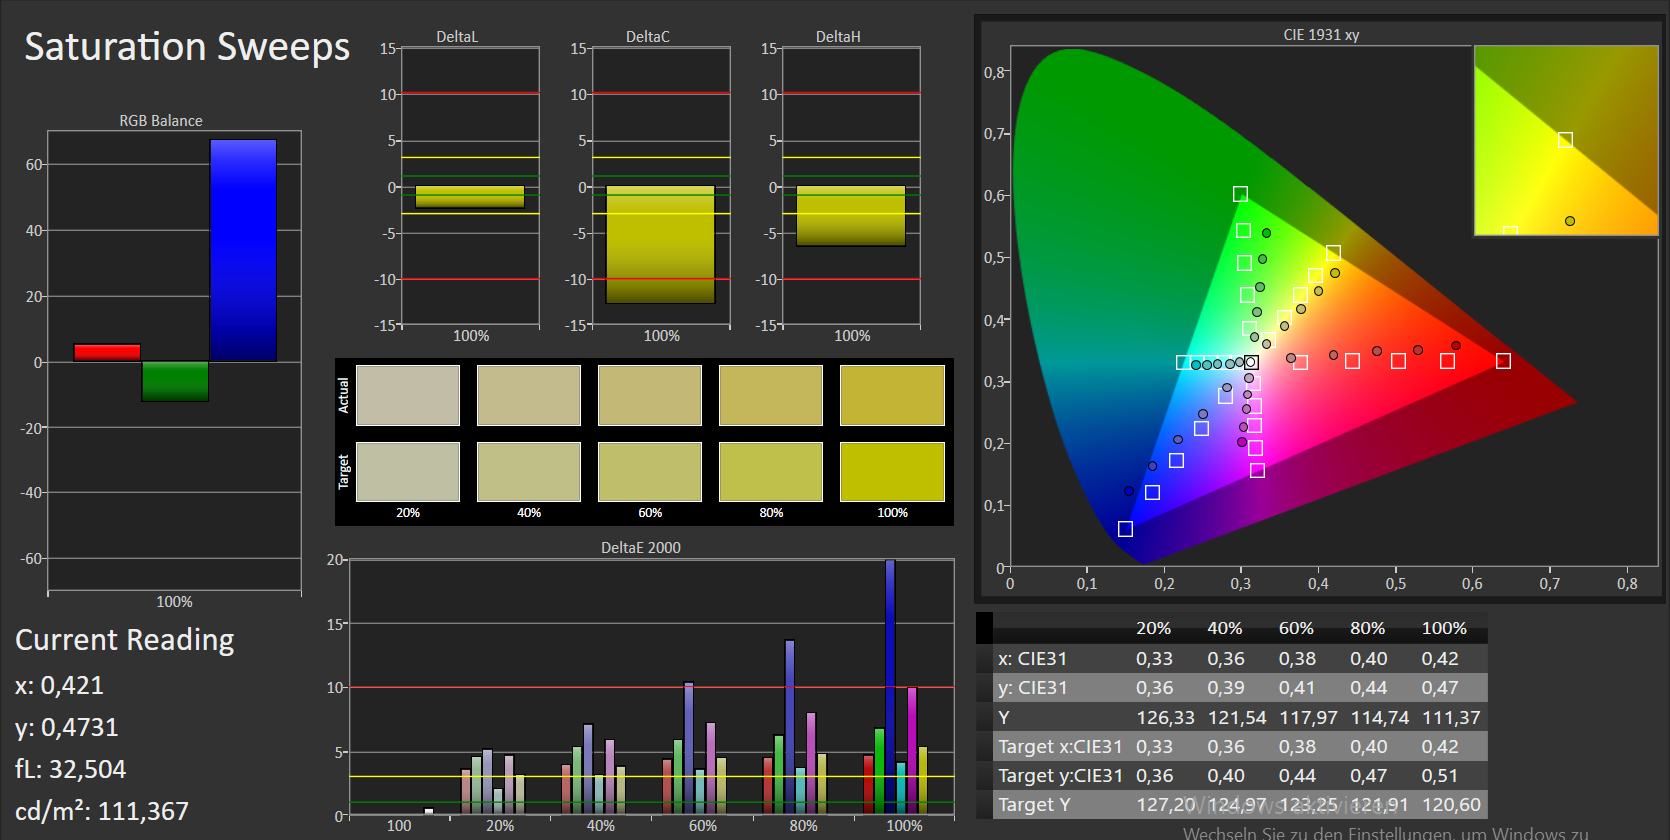
iluminação: 85 %
iluminação com acumulador: 272 cd/m²
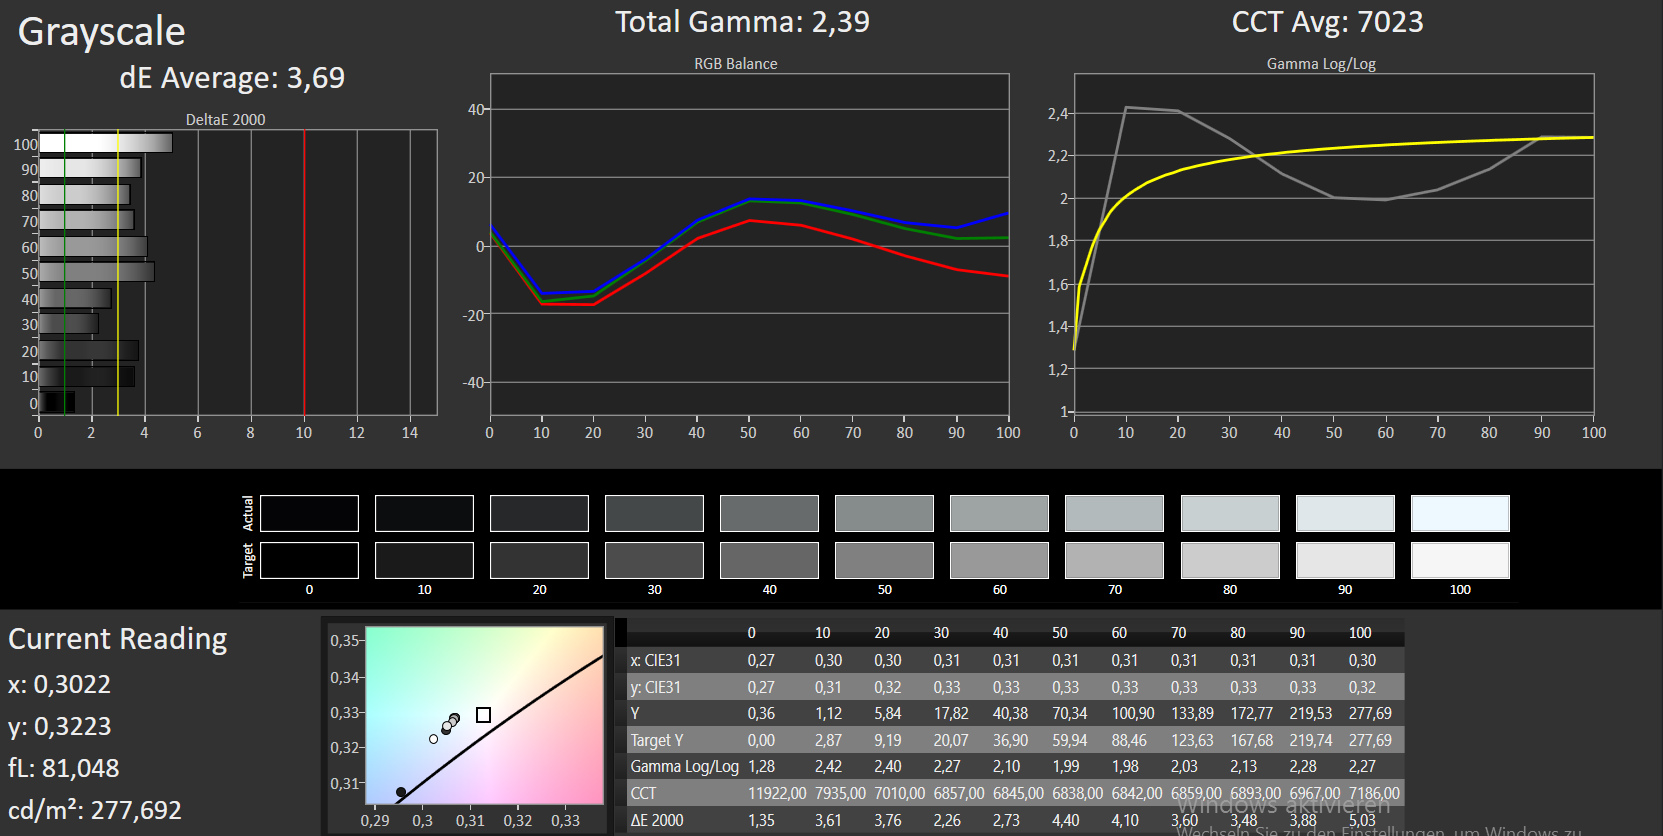
Contraste: 613:1 (Preto: 0.45 cd/m²)
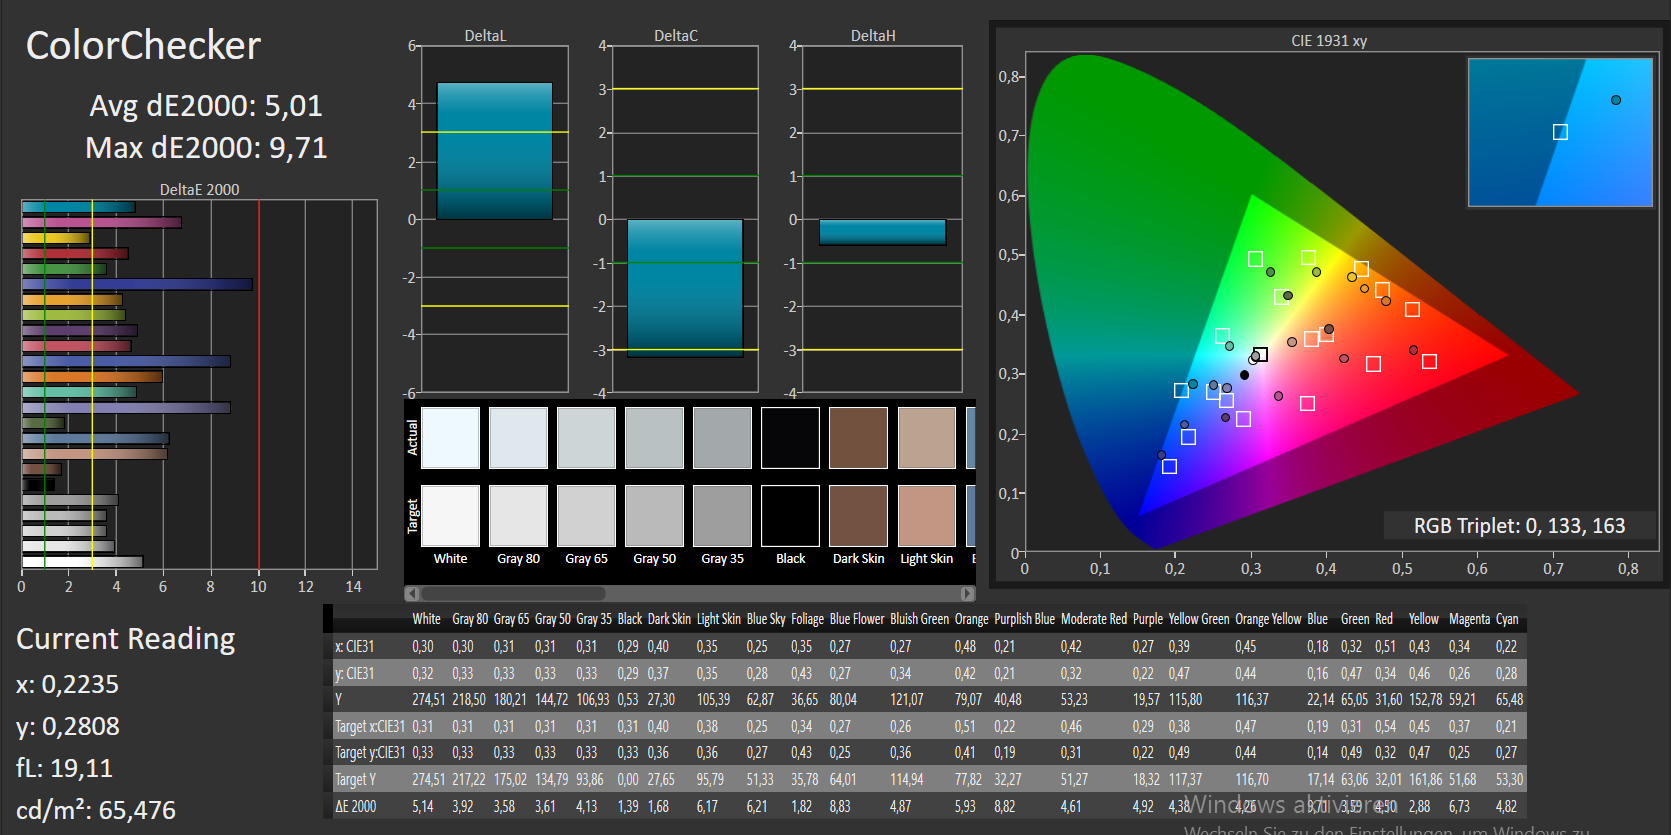
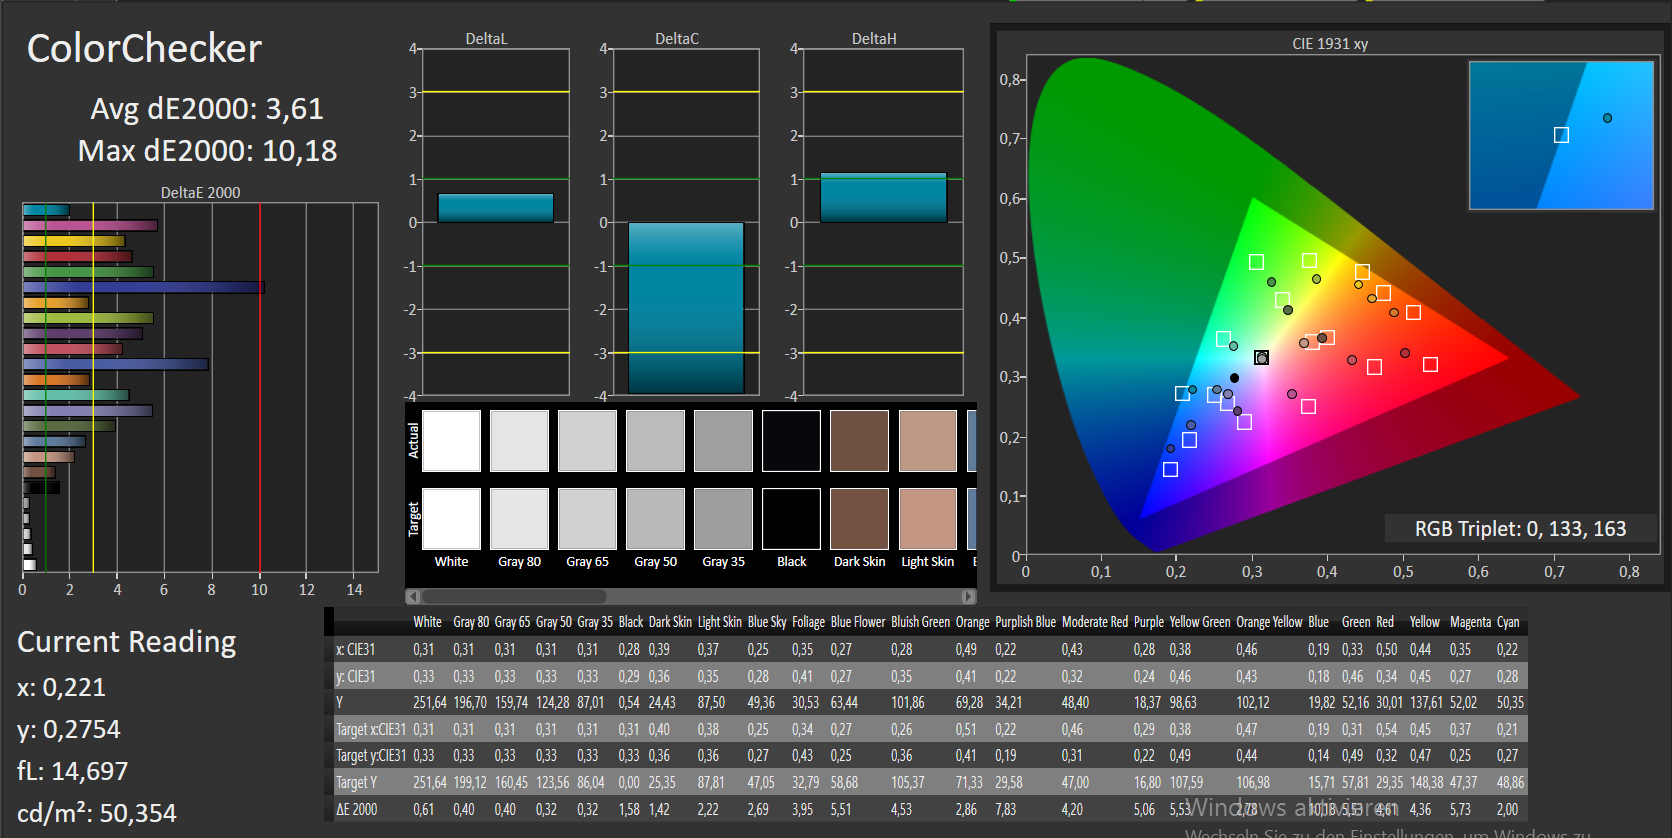
ΔE ColorChecker Calman: 5.01 | ∀{0.5-29.43 Ø4.71}
ΔE Greyscale Calman: 3.69 | ∀{0.09-98 Ø4.96}
56.3% sRGB (Argyll 1.6.3 3D)
36% AdobeRGB 1998 (Argyll 1.6.3 3D)
38.97% AdobeRGB 1998 (Argyll 3D)
56.4% sRGB (Argyll 3D)
37.68% Display P3 (Argyll 3D)
Gamma: 2.39
CCT: 7023 K
| Lenovo Thinkpad L570 20J9S01600 IPS, 1920x1080, 15.6" | Lenovo ThinkPad L560-20F10026GE AH-IPS, 1920x1080, 15.6" | HP Probook 650 G3 Z2W44ET TN LED, 1920x1080, 15.6" | Dell Latitude 15 E5570 TN LED, 1366x768, 15.6" | Lenovo ThinkPad E570-20H6S00000 IPS LED, 1920x1080, 15.6" | HP ProBook 450 G4 Y8B60EA TN LED, 1920x1080, 15.6" | Dell Vostro 15-5568 TN LED, 1920x1080, 15.6" | |
|---|---|---|---|---|---|---|---|
| Display | 3% | 45% | 7% | 3% | 6% | ||
| Display P3 Coverage (%) | 37.68 | 39 4% | 55.2 46% | 40.48 7% | 38.65 3% | 39.89 6% | |
| sRGB Coverage (%) | 56.4 | 58.3 3% | 81.1 44% | 60.9 8% | 58 3% | 59.5 5% | |
| AdobeRGB 1998 Coverage (%) | 38.97 | 40.33 3% | 57 46% | 41.82 7% | 39.94 2% | 41.24 6% | |
| Response Times | -73% | -67% | -77% | -69% | -96% | -79% | |
| Response Time Grey 50% / Grey 80% * (ms) | 43 ? | 39.2 ? 9% | 38 ? 12% | 47 ? -9% | 44.8 ? -4% | 51 ? -19% | 47.6 ? -11% |
| Response Time Black / White * (ms) | 11 ? | 28 ? -155% | 27 ? -145% | 27 ? -145% | 25.6 ? -133% | 30 ? -173% | 27.2 ? -147% |
| PWM Frequency (Hz) | 200 ? | 50 ? | |||||
| Screen | -18% | -35% | -41% | 10% | -46% | -44% | |
| Brightness middle (cd/m²) | 276 | 262 -5% | 351 27% | 228 -17% | 242 -12% | 214 -22% | 229 -17% |
| Brightness (cd/m²) | 252 | 250 -1% | 345 37% | 236 -6% | 243 -4% | 201 -20% | 222 -12% |
| Brightness Distribution (%) | 85 | 92 8% | 95 12% | 90 6% | 75 -12% | 77 -9% | 82 -4% |
| Black Level * (cd/m²) | 0.45 | 0.29 36% | 0.65 -44% | 0.56 -24% | 0.24 47% | 0.43 4% | 0.56 -24% |
| Contrast (:1) | 613 | 903 47% | 540 -12% | 407 -34% | 1008 64% | 498 -19% | 409 -33% |
| Colorchecker dE 2000 * | 5.01 | 8.49 -69% | 11.02 -120% | 10.02 -100% | 4.65 7% | 10.68 -113% | 10.36 -107% |
| Colorchecker dE 2000 max. * | 9.71 | 17.99 -85% | 17.68 -82% | 15.93 -64% | 9.64 1% | 18.07 -86% | 14.95 -54% |
| Greyscale dE 2000 * | 3.69 | 8.11 -120% | 13.14 -256% | 10.66 -189% | 3.39 8% | 11.32 -207% | 10.9 -195% |
| Gamma | 2.39 92% | 2.37 93% | 2.7 81% | 2.48 89% | 2.7 81% | 2.26 97% | 2.21 100% |
| CCT | 7023 93% | 6300 103% | 16626 39% | 11800 55% | 6246 104% | 12204 53% | 10084 64% |
| Color Space (Percent of AdobeRGB 1998) (%) | 36 | 37.07 3% | 52 44% | 39 8% | 36.69 2% | 38 6% | 37.69 5% |
| Color Space (Percent of sRGB) (%) | 56.3 | 57.94 3% | 81 44% | 61 8% | 57.66 2% | 59 5% | 57.92 3% |
| Média Total (Programa/Configurações) | -29% /
-21% | -19% /
-23% | -37% /
-36% | -19% /
-2% | -45% /
-42% | -62% /
-50% |
* ... menor é melhor
Cintilação da tela / PWM (modulação por largura de pulso)
| Tela tremeluzindo / PWM não detectado | ≤ 90 % configuração de brilho | |
[pwm_comparison] Em comparação: 52 % de todos os dispositivos testados não usam PWM para escurecer a tela. Se PWM foi detectado, uma média de 7744 (mínimo: 5 - máximo: 343500) Hz foi medida. | ||
Exibir tempos de resposta
| ↔ Tempo de resposta preto para branco | ||
|---|---|---|
| 11 ms ... ascensão ↗ e queda ↘ combinadas | ↗ 7 ms ascensão | 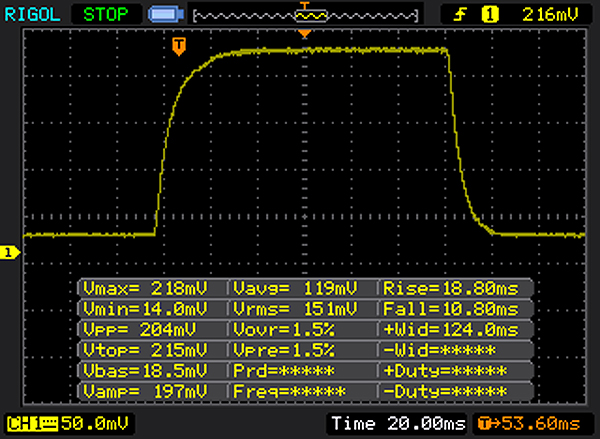 |
| ↘ 4 ms queda | ||
| A tela mostra boas taxas de resposta em nossos testes, mas pode ser muito lenta para jogadores competitivos. Em comparação, todos os dispositivos testados variam de 0.1 (mínimo) a 240 (máximo) ms. » 30 % de todos os dispositivos são melhores. Isso significa que o tempo de resposta medido é melhor que a média de todos os dispositivos testados (19.8 ms). | ||
| ↔ Tempo de resposta 50% cinza a 80% cinza | ||
| 43 ms ... ascensão ↗ e queda ↘ combinadas | ↗ 24 ms ascensão | 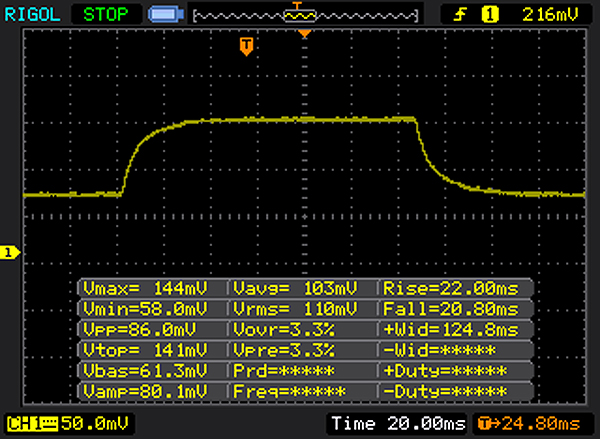 |
| ↘ 19 ms queda | ||
| A tela mostra taxas de resposta lentas em nossos testes e será insatisfatória para os jogadores. Em comparação, todos os dispositivos testados variam de 0.165 (mínimo) a 636 (máximo) ms. » 71 % de todos os dispositivos são melhores. Isso significa que o tempo de resposta medido é pior que a média de todos os dispositivos testados (30.9 ms). | ||


| Cinebench R10 | |
| Rendering Multiple CPUs 32Bit | |
| Lenovo Thinkpad L570 20J9S01600 | |
| HP Probook 650 G3 Z2W44ET | |
| Dell Latitude 15 E5570 | |
| Lenovo ThinkPad L560-20F10026GE | |
| Rendering Single 32Bit | |
| Lenovo Thinkpad L570 20J9S01600 | |
| HP Probook 650 G3 Z2W44ET | |
| Dell Latitude 15 E5570 | |
| Lenovo ThinkPad L560-20F10026GE | |
| Geekbench 3 | |
| 32 Bit Multi-Core Score | |
| Lenovo Thinkpad L570 20J9S01600 | |
| HP Probook 650 G3 Z2W44ET | |
| Dell Latitude 15 E5570 | |
| 32 Bit Single-Core Score | |
| Lenovo Thinkpad L570 20J9S01600 | |
| Dell Latitude 15 E5570 | |
| HP Probook 650 G3 Z2W44ET | |
| Geekbench 4.0 | |
| 64 Bit Multi-Core Score | |
| Lenovo Thinkpad L570 20J9S01600 | |
| HP Probook 650 G3 Z2W44ET | |
| 64 Bit Single-Core Score | |
| Lenovo Thinkpad L570 20J9S01600 | |
| HP Probook 650 G3 Z2W44ET | |
| Geekbench 4.4 | |
| 64 Bit Multi-Core Score | |
| Lenovo Thinkpad L570 20J9S01600 | |
| 64 Bit Single-Core Score | |
| Lenovo Thinkpad L570 20J9S01600 | |
| PCMark 7 Score | 5464 pontos | |
| PCMark 8 Home Score Accelerated v2 | 3520 pontos | |
| PCMark 8 Creative Score Accelerated v2 | 3293 pontos | |
| PCMark 8 Work Score Accelerated v2 | 4600 pontos | |
Ajuda | ||

| Lenovo Thinkpad L570 20J9S01600 Samsung PM961 NVMe MZVLW512HMJP | Lenovo ThinkPad L560-20F10026GE WDC Slim WD10SPCX-21KHST0 | HP Probook 650 G3 Z2W44ET Hitachi Travelstar Z7K500 HTS725050A7E630 | Dell Latitude 15 E5570 Samsung SSD PM871 MZ7LN128HCHP | Lenovo ThinkPad E570-20H6S00000 Toshiba THNSF5256GPUK | HP Spectre x360 13-ac033dx Samsung PM961 NVMe MZVLW512HMJP | Lenovo ThinkPad X1 Carbon 2017-20HQS03P00 Samsung PM961 NVMe MZVLW512HMJP | HP Spectre 13-v131ng Samsung PM961 NVMe MZVLW512HMJP | Lenovo ThinkPad T470-20HD002HGE Samsung PM961 NVMe MZVLW512HMJP | HP ProBook 450 G4 Y8B60EA SanDisk SD8SNAT256G1002 | Dell Vostro 15-5568 SanDisk X400 256GB, SATA (SD8SB8U-256G) | |
|---|---|---|---|---|---|---|---|---|---|---|---|
| CrystalDiskMark 3.0 | -96% | -97% | -59% | -28% | 8% | 16% | -6% | -6% | -55% | ||
| Read Seq (MB/s) | 1412 | 113.6 -92% | 109.4 -92% | 474.7 -66% | 1140 -19% | 2065 46% | 1827 29% | 1090 -23% | 1155 -18% | 497.8 -65% | |
| Write Seq (MB/s) | 1110 | 111.7 -90% | 99.9 -91% | 155 -86% | 468.1 -58% | 1550 40% | 1383 25% | 1088 -2% | 1076 -3% | 466.8 -58% | |
| Read 512 (MB/s) | 833 | 39.65 -95% | 16.34 -98% | 393.6 -53% | 759 -9% | 865 4% | 814 -2% | 753 -10% | 811 -3% | 363.4 -56% | |
| Write 512 (MB/s) | 920 | 55.3 -94% | 43.45 -95% | 119.7 -87% | 414 -55% | 1229 34% | 1098 19% | 911 -1% | 862 -6% | 368.5 -60% | |
| Read 4k (MB/s) | 56.8 | 0.488 -99% | 0.337 -99% | 34 -40% | 34.3 -40% | 54.7 -4% | 61 7% | 57.5 1% | 55.5 -2% | 29.02 -49% | |
| Write 4k (MB/s) | 138.9 | 1.022 -99% | 0.866 -99% | 96.6 -30% | 123.4 -11% | 139.4 0% | 172.2 24% | 140.2 1% | 134.6 -3% | 56 -60% | |
| Read 4k QD32 (MB/s) | 539 | 1.367 -100% | 0.826 -100% | 383.3 -29% | 530 -2% | 518 -4% | 601 12% | 497.1 -8% | 496.2 -8% | 296 -45% | |
| Write 4k QD32 (MB/s) | 444.8 | 1.036 -100% | 0.859 -100% | 100.2 -77% | 319.2 -28% | 225.6 -49% | 495.6 11% | 416 -6% | 425.4 -4% | 229.4 -48% |
| 3DMark 06 Standard Score | 7810 pontos | |
| 3DMark 11 Performance | 1550 pontos | |
| 3DMark Ice Storm Standard Score | 52860 pontos | |
| 3DMark Cloud Gate Standard Score | 5745 pontos | |
| 3DMark Fire Strike Score | 764 pontos | |
| 3DMark Fire Strike Extreme Score | 343 pontos | |
Ajuda | ||
| baixo | média | alto | ultra | |
|---|---|---|---|---|
| Tomb Raider (2013) | 62.7 | 31.4 | 18.4 | 9.7 |
| BioShock Infinite (2013) | 40.3 | 23.9 | 19.8 | 6.9 |
| Battlefield 4 (2013) | 31 | 23 | 15.6 | 6.2 |
Barulho
| Ocioso |
| 30.3 / 30.3 / 30.3 dB |
| DVD |
| 38.2 / dB |
| Carga |
| 33.2 / 33.1 dB |
 | ||
30 dB silencioso 40 dB(A) audível 50 dB(A) ruidosamente alto |
||
min: | ||
| Lenovo Thinkpad L570 20J9S01600 i5-7200U, HD Graphics 620 | Lenovo ThinkPad L560-20F10026GE 6200U, HD Graphics 520 | HP Probook 650 G3 Z2W44ET i5-7200U, HD Graphics 620 | Dell Latitude 15 E5570 6300U, HD Graphics 520 | Lenovo ThinkPad E570-20H6S00000 i5-7200U, GeForce GTX 950M | HP ProBook 450 G4 Y8B60EA i7-7500U, GeForce 930MX | Dell Vostro 15-5568 i5-7200U, HD Graphics 620 | |
|---|---|---|---|---|---|---|---|
| Noise | 0% | -3% | -7% | -1% | -11% | 0% | |
| desligado / ambiente * (dB) | 30.3 | 29.4 3% | 30.7 -1% | 31.2 -3% | 29 4% | 31.6 -4% | 29 4% |
| Idle Minimum * (dB) | 30.3 | 30.1 1% | 31.5 -4% | 31.2 -3% | 29 4% | 32.6 -8% | 29 4% |
| Idle Average * (dB) | 30.3 | 30.1 1% | 31.5 -4% | 33.2 -10% | 29 4% | 32.6 -8% | 29 4% |
| Idle Maximum * (dB) | 30.3 | 30.1 1% | 31.5 -4% | 34.3 -13% | 29 4% | 33 -9% | 29 4% |
| Load Average * (dB) | 33.2 | 33.4 -1% | 34.6 -4% | 36.6 -10% | 34.3 -3% | 38.9 -17% | 33.9 -2% |
| Load Maximum * (dB) | 33.1 | 34.7 -5% | 33.3 -1% | 34.7 -5% | 40.1 -21% | 38.9 -18% | 37 -12% |
* ... menor é melhor
(+) A temperatura máxima no lado superior é 36.1 °C / 97 F, em comparação com a média de 34.3 °C / 94 F , variando de 21.2 a 62.5 °C para a classe Office.
(+) A parte inferior aquece até um máximo de 33.1 °C / 92 F, em comparação com a média de 36.8 °C / 98 F
(+) Em uso inativo, a temperatura média para o lado superior é 22.6 °C / 73 F, em comparação com a média do dispositivo de 29.5 °C / ### class_avg_f### F.
(+) Os apoios para as mãos e o touchpad são mais frios que a temperatura da pele, com um máximo de 28 °C / 82.4 F e, portanto, são frios ao toque.
(±) A temperatura média da área do apoio para as mãos de dispositivos semelhantes foi 27.6 °C / 81.7 F (-0.4 °C / -0.7 F).
| Lenovo Thinkpad L570 20J9S01600 i5-7200U, HD Graphics 620 | Lenovo ThinkPad L560-20F10026GE 6200U, HD Graphics 520 | HP Probook 650 G3 Z2W44ET i5-7200U, HD Graphics 620 | Dell Latitude 15 E5570 6300U, HD Graphics 520 | Lenovo ThinkPad E570-20H6S00000 i5-7200U, GeForce GTX 950M | HP ProBook 450 G4 Y8B60EA i7-7500U, GeForce 930MX | Dell Vostro 15-5568 i5-7200U, HD Graphics 620 | |
|---|---|---|---|---|---|---|---|
| Heat | -20% | 3% | -33% | -21% | -24% | -18% | |
| Maximum Upper Side * (°C) | 36.1 | 37.2 -3% | 31.9 12% | 37.3 -3% | 46.6 -29% | 44.3 -23% | 38 -5% |
| Maximum Bottom * (°C) | 33.1 | 36 -9% | 32.1 3% | 41.5 -25% | 49.1 -48% | 46.3 -40% | 39 -18% |
| Idle Upper Side * (°C) | 23.7 | 30.7 -30% | 23.5 1% | 34.2 -44% | 24.6 -4% | 27.8 -17% | 25.7 -8% |
| Idle Bottom * (°C) | 24.1 | 32.8 -36% | 25.3 -5% | 38.8 -61% | 25.1 -4% | 27.7 -15% | 33.8 -40% |
* ... menor é melhor
Lenovo Thinkpad L570 20J9S01600 análise de áudio
(-) | alto-falantes não muito altos (###valor### dB)
Graves 100 - 315Hz
(±) | graves reduzidos - em média 13.2% menor que a mediana
(+) | o baixo é linear (4.8% delta para a frequência anterior)
Médios 400 - 2.000 Hz
(+) | médios equilibrados - apenas 4.1% longe da mediana
(+) | médios são lineares (4.1% delta para frequência anterior)
Altos 2 - 16 kHz
(+) | agudos equilibrados - apenas 1.4% longe da mediana
(+) | os máximos são lineares (2.5% delta da frequência anterior)
Geral 100 - 16.000 Hz
(±) | a linearidade do som geral é média (15.2% diferença em relação à mediana)
Comparado com a mesma classe
» 15% de todos os dispositivos testados nesta classe foram melhores, 4% semelhantes, 81% piores
» O melhor teve um delta de 7%, a média foi 21%, o pior foi 53%
Comparado com todos os dispositivos testados
» 22% de todos os dispositivos testados foram melhores, 4% semelhantes, 74% piores
» O melhor teve um delta de 4%, a média foi 23%, o pior foi 134%
Apple MacBook 12 (Early 2016) 1.1 GHz análise de áudio
(+) | os alto-falantes podem tocar relativamente alto (###valor### dB)
Graves 100 - 315Hz
(±) | graves reduzidos - em média 11.3% menor que a mediana
(±) | a linearidade dos graves é média (14.2% delta para a frequência anterior)
Médios 400 - 2.000 Hz
(+) | médios equilibrados - apenas 2.4% longe da mediana
(+) | médios são lineares (5.5% delta para frequência anterior)
Altos 2 - 16 kHz
(+) | agudos equilibrados - apenas 2% longe da mediana
(+) | os máximos são lineares (4.5% delta da frequência anterior)
Geral 100 - 16.000 Hz
(+) | o som geral é linear (10.2% diferença em relação à mediana)
Comparado com a mesma classe
» 7% de todos os dispositivos testados nesta classe foram melhores, 2% semelhantes, 90% piores
» O melhor teve um delta de 5%, a média foi 18%, o pior foi 53%
Comparado com todos os dispositivos testados
» 5% de todos os dispositivos testados foram melhores, 1% semelhantes, 94% piores
» O melhor teve um delta de 4%, a média foi 23%, o pior foi 134%
| desligado | |
| Ocioso | |
| Carga |
|
Key:
min: | |
| Lenovo Thinkpad L570 20J9S01600 i5-7200U, HD Graphics 620 | Lenovo ThinkPad L560-20F10026GE 6200U, HD Graphics 520 | HP Probook 650 G3 Z2W44ET i5-7200U, HD Graphics 620 | Dell Latitude 15 E5570 6300U, HD Graphics 520 | Lenovo ThinkPad E570-20H6S00000 i5-7200U, GeForce GTX 950M | HP ProBook 450 G4 Y8B60EA i7-7500U, GeForce 930MX | Dell Vostro 15-5568 i5-7200U, HD Graphics 620 | |
|---|---|---|---|---|---|---|---|
| Power Consumption | -11% | 2% | -5% | -32% | -23% | -4% | |
| Idle Minimum * (Watt) | 4 | 5 -25% | 4 -0% | 4.5 -13% | 2.8 30% | 3.8 5% | 3.3 17% |
| Idle Average * (Watt) | 7.4 | 7.9 -7% | 6.9 7% | 7.6 -3% | 6.3 15% | 6.6 11% | 6.8 8% |
| Idle Maximum * (Watt) | 7.7 | 8.6 -12% | 7.6 1% | 8.7 -13% | 6.9 10% | 11.3 -47% | 7.7 -0% |
| Load Average * (Watt) | 30.6 | 27.5 10% | 29 5% | 28.5 7% | 51.6 -69% | 38 -24% | 30.9 -1% |
| Load Maximum * (Watt) | 28.2 | 33.7 -20% | 28.7 -2% | 29.2 -4% | 69.7 -147% | 45 -60% | 40.3 -43% |
* ... menor é melhor
| Lenovo Thinkpad L570 20J9S01600 i5-7200U, HD Graphics 620, 48 Wh | Lenovo ThinkPad L560-20F10026GE 6200U, HD Graphics 520, 48 Wh | HP Probook 650 G3 Z2W44ET i5-7200U, HD Graphics 620, 48 Wh | Dell Latitude 15 E5570 6300U, HD Graphics 520, 62 Wh | Lenovo ThinkPad E570-20H6S00000 i5-7200U, GeForce GTX 950M, 41 Wh | HP ProBook 450 G4 Y8B60EA i7-7500U, GeForce 930MX, 45 Wh | Dell Vostro 15-5568 i5-7200U, HD Graphics 620, 42 Wh | |
|---|---|---|---|---|---|---|---|
| Duração da bateria | -31% | -5% | 15% | -11% | -13% | -14% | |
| Reader / Idle (h) | 19.4 | 11.6 -40% | 12.8 -34% | 20.5 6% | 14.7 -24% | 12.4 -36% | 16.9 -13% |
| H.264 (h) | 8.2 | 4.6 -44% | 6.7 -18% | 9.5 16% | 8.5 4% | ||
| WiFi v1.3 (h) | 8.9 | 6.8 -24% | 7.8 -12% | 10.5 18% | 7.7 -13% | 8.6 -3% | 6 -33% |
| Load (h) | 2.1 | 1.8 -14% | 3 43% | 2.5 19% | 2.2 5% | 2.1 0% | 1.8 -14% |
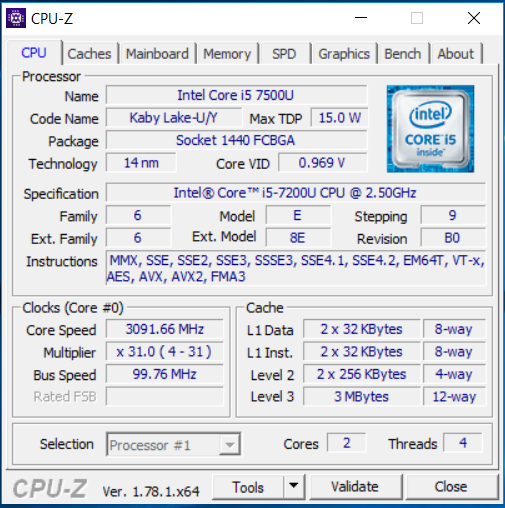
Comparado com o seu predecessor o ThinkPad L570 é antes de tudo uma atualização Kaby Lake. O processador Kaby Lake oferece apenas um leve aumento do desempenho em comparação com o seu predecessor Skylake, mas não traz vantagens em outras áreas: A duração da bateria é significantemente mais longa e pode durar todo um dia na universidade.
Kaby Lake oferece uma duração de bateria incrementada.
Assim como deve ocorrer com as ferramentas de trabalho, o aparelho quase não esquenta e funciona de forma silenciosa. A ventoinha de resfriamento não se ativa repentinamente sem motivo, motivo pelo qual muitos usuários criticaram o ThinkPad L560.
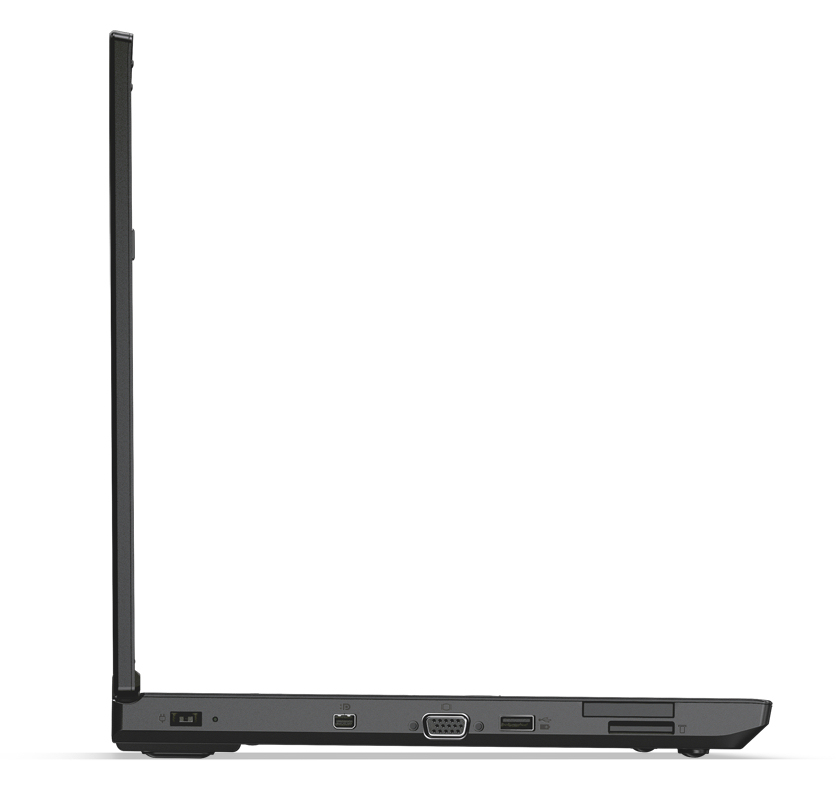
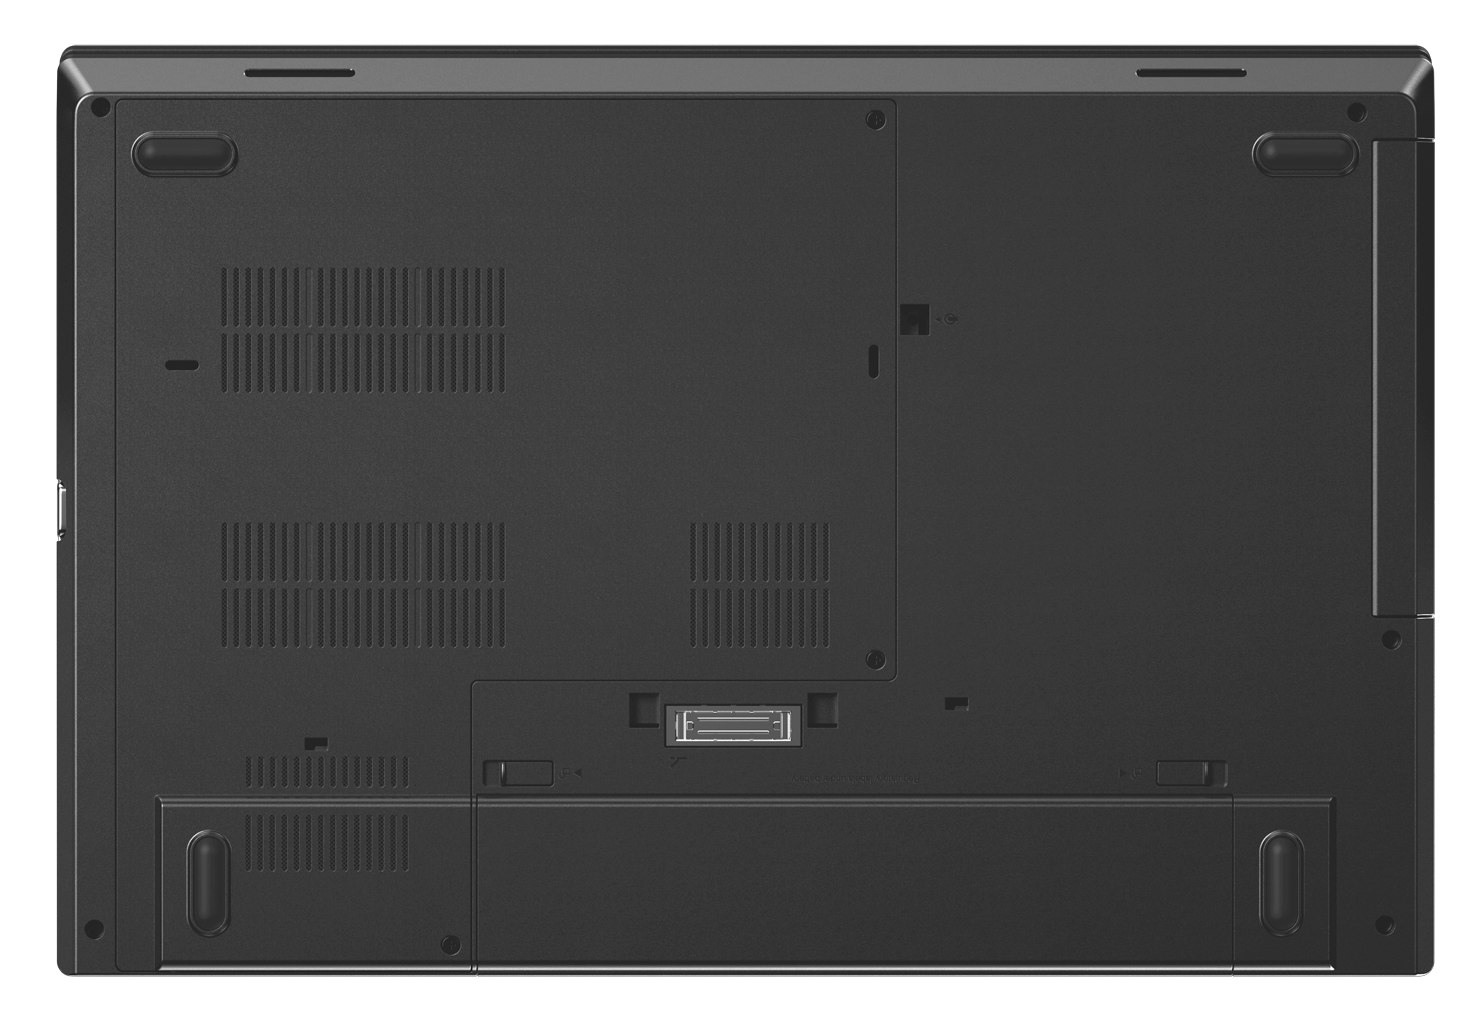
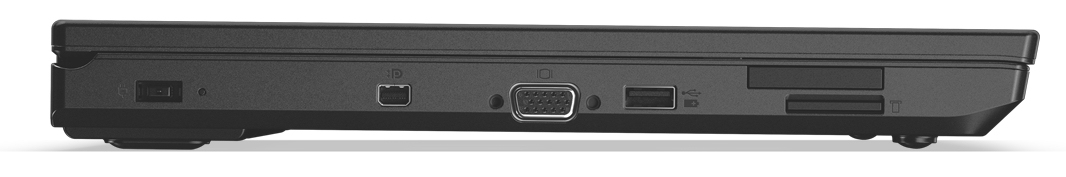
Um SSD NVMe garante um sistema veloz e ágil. Graça à escotilha de manutenção, não deve ser problema substituir o SSD. O ThinkPad oferece outras opções de expansão: um slot M.2 2242 adicional pode ser montado com um modem LTE (antenas já instaladas) ou um segundo SSD.
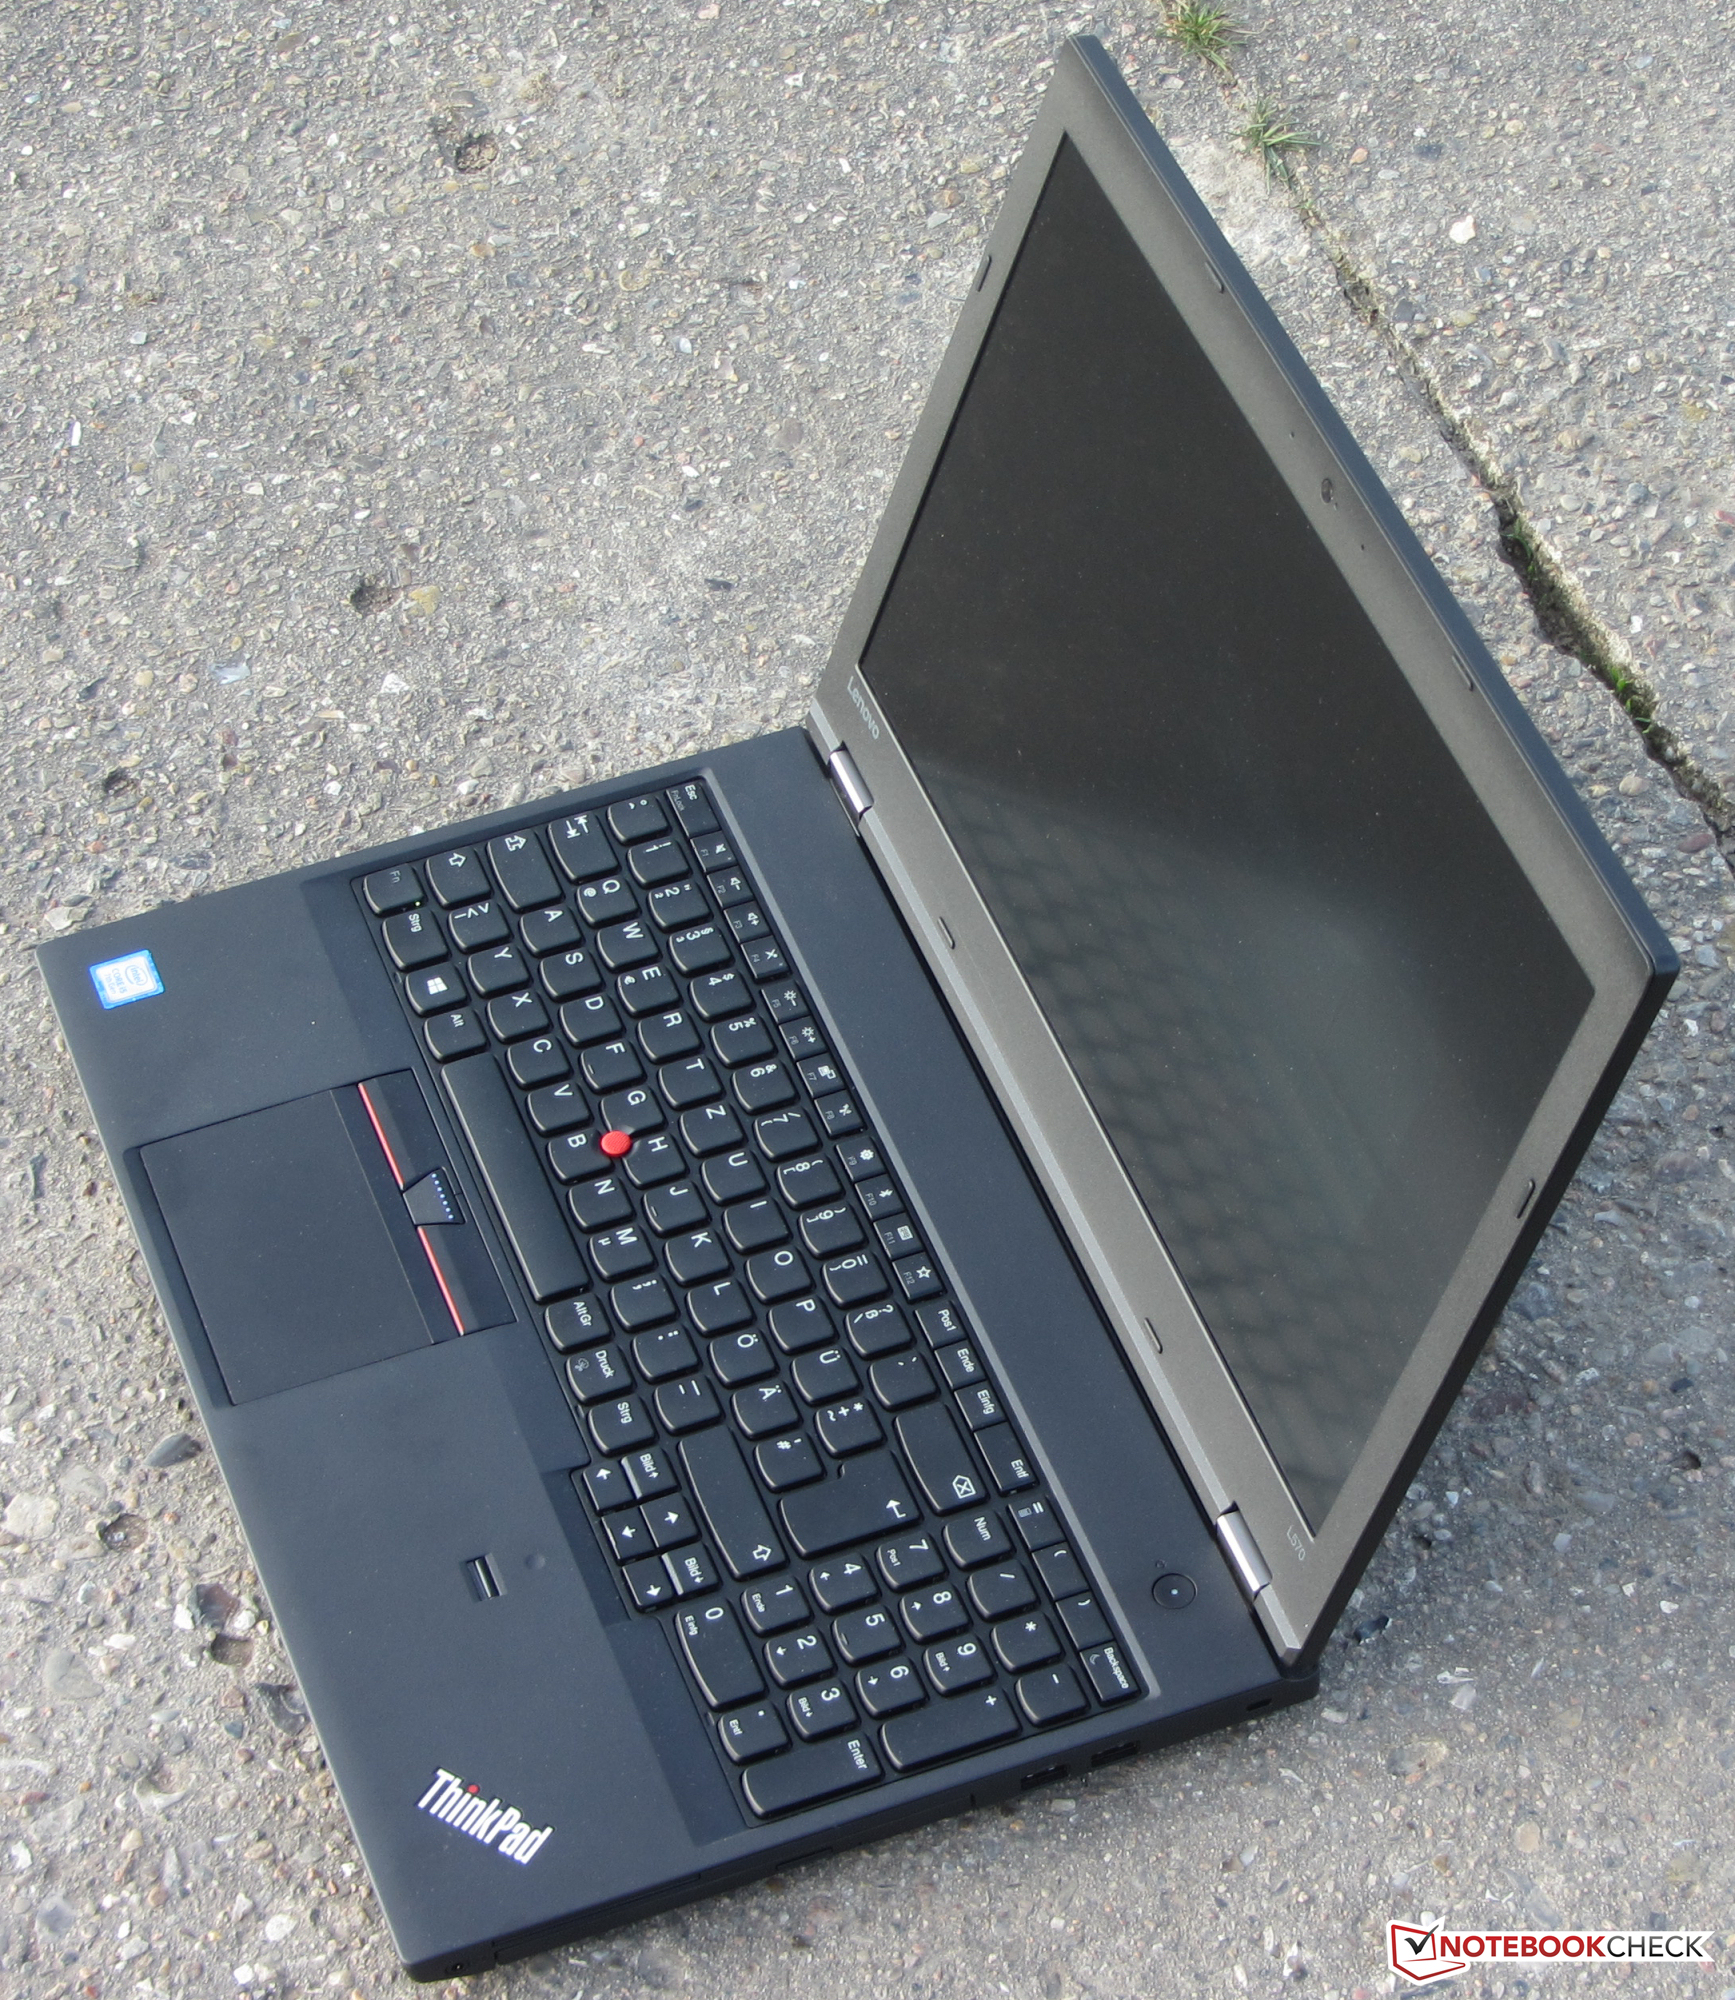
Não foram feitas modificações na carcaça; ele utiliza a mesma carcaça que o ThinkPad L560. A Lenovo poderia ter feito um pouco mais aqui. A carcaça não é a mais estável do seu tipo. Como ferramenta de trabalho, o ThinkPad deve oferecer mais neste aspecto. Depois de tudo, pode se assumir que o aparelho será utilizado em movimento. O teclado, ClickPad e TrackPoint são os habituais dispositivos de entrada de alta qualidade da Lenovo. Embora sintamos falta da iluminação de fundo do teclado, que já faltava no predecessor.
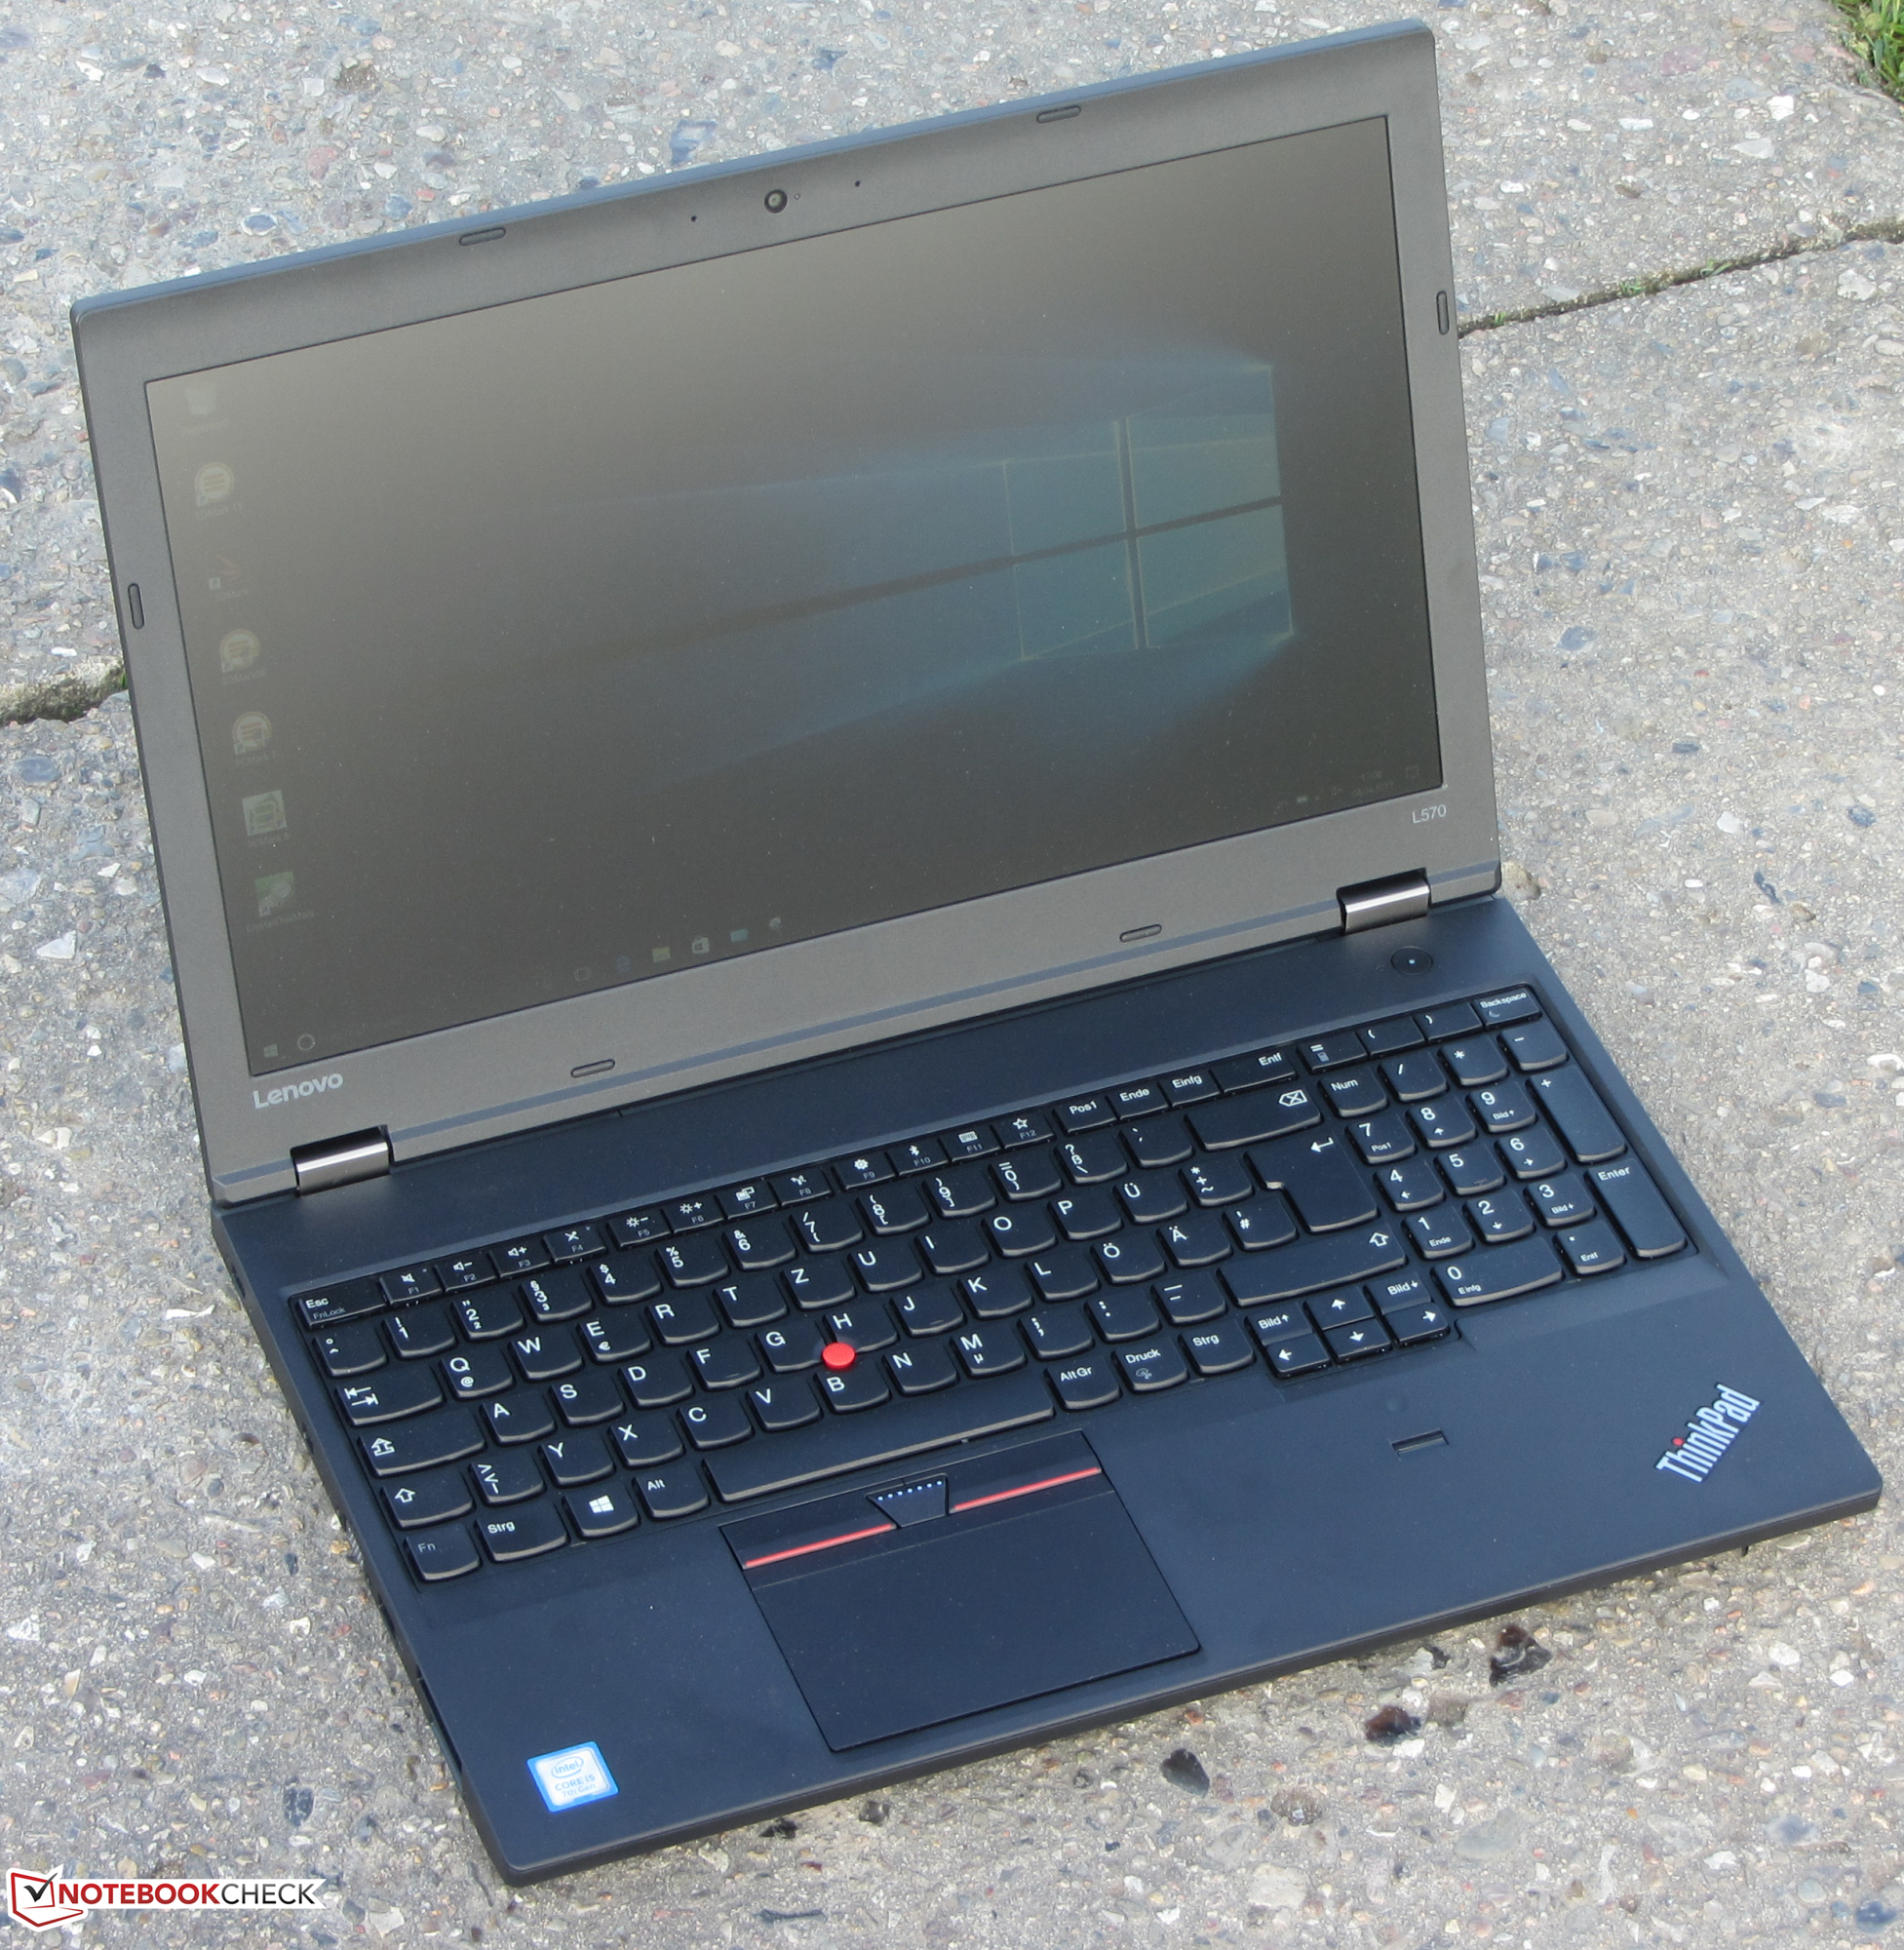
O ThinkPad tem uma tela full HD com ângulos de visão estáveis e uma superfície mate. O brilho e o contraste são médios, mas muitos baixos para um portátil deste preço.
Pro
Contra
Compared with its predecessor, the ThinkPad L570 is first and foremost a Kaby Lake upgrade. The Kaby Lake processor offers only a slight performance increase compared with its Skylake predecessor, but it does bring advantages in other areas: The battery runtime is significantly longer and can last an entire day at university.
Kaby Lake offers increased battery life.
Just as it should be for work tools, the device hardly heats up and runs quietly. The cooling fan does not suddenly turn up for no reason, which many users criticized the ThinkPad L560 for.
An NVMe SSD ensures a quick and nimble system. Thanks to the maintenance hatch, it should be no problem to change the SSD. The ThinkPad offers further options for expansion: an additional M.2 2242 slot can be mounted either with an LTE modem (antennas are already installed) or a second SSD.
No changes have been made to the case; it has the same case as the ThinkPad L560. Lenovo could have done a little bit more here. The case is not the most stable of its kind. As a work tool, the ThinkPad should offer more in this regard. After all, it can be assumed that the device will be used on the go. Keyboard, ClickPad and TrackPoint are Lenovo’s usual high quality input devices. Although we do miss backlighting for the keyboard, which was already missing from the predecessor.
The ThinkPad features a full HD screen with stable viewing points and a matte surface. Brightness and contrast are average, but too low for a notebook of this price.
Lenovo Thinkpad L570 20J9S01600
- 04/14/2017 v6 (old)
Sascha Mölck