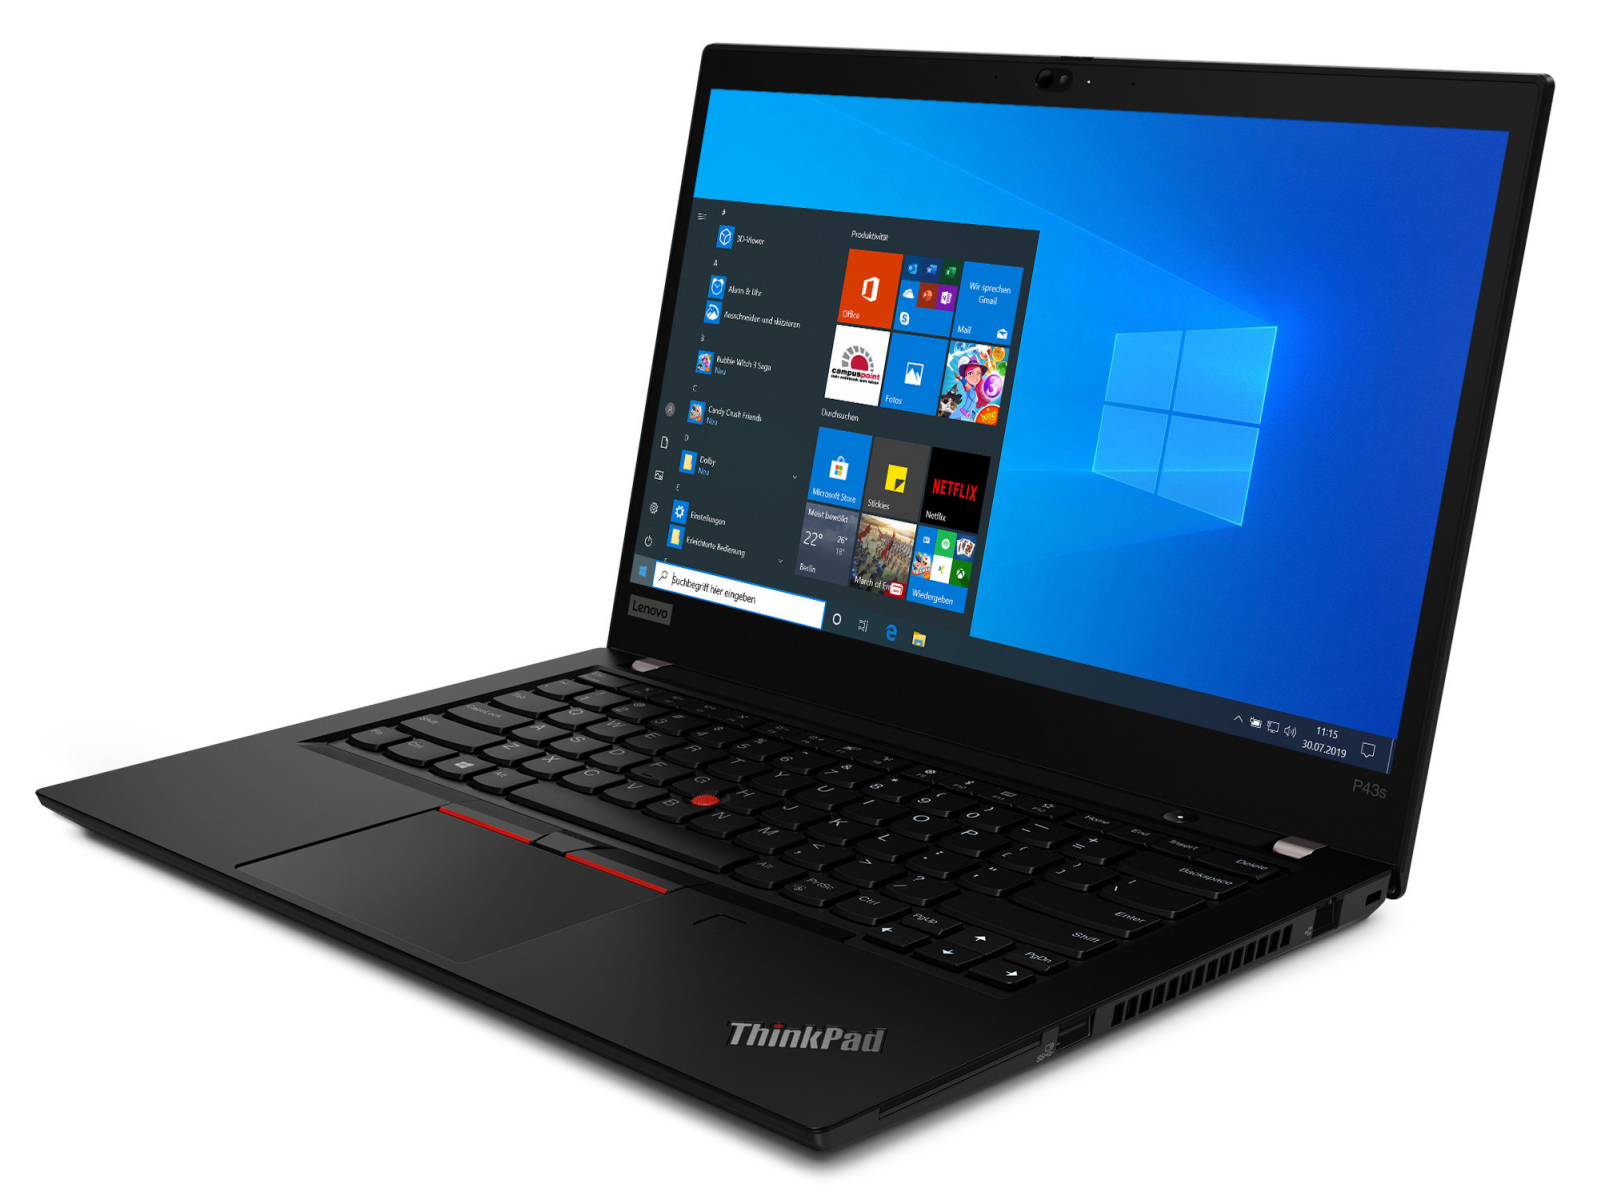
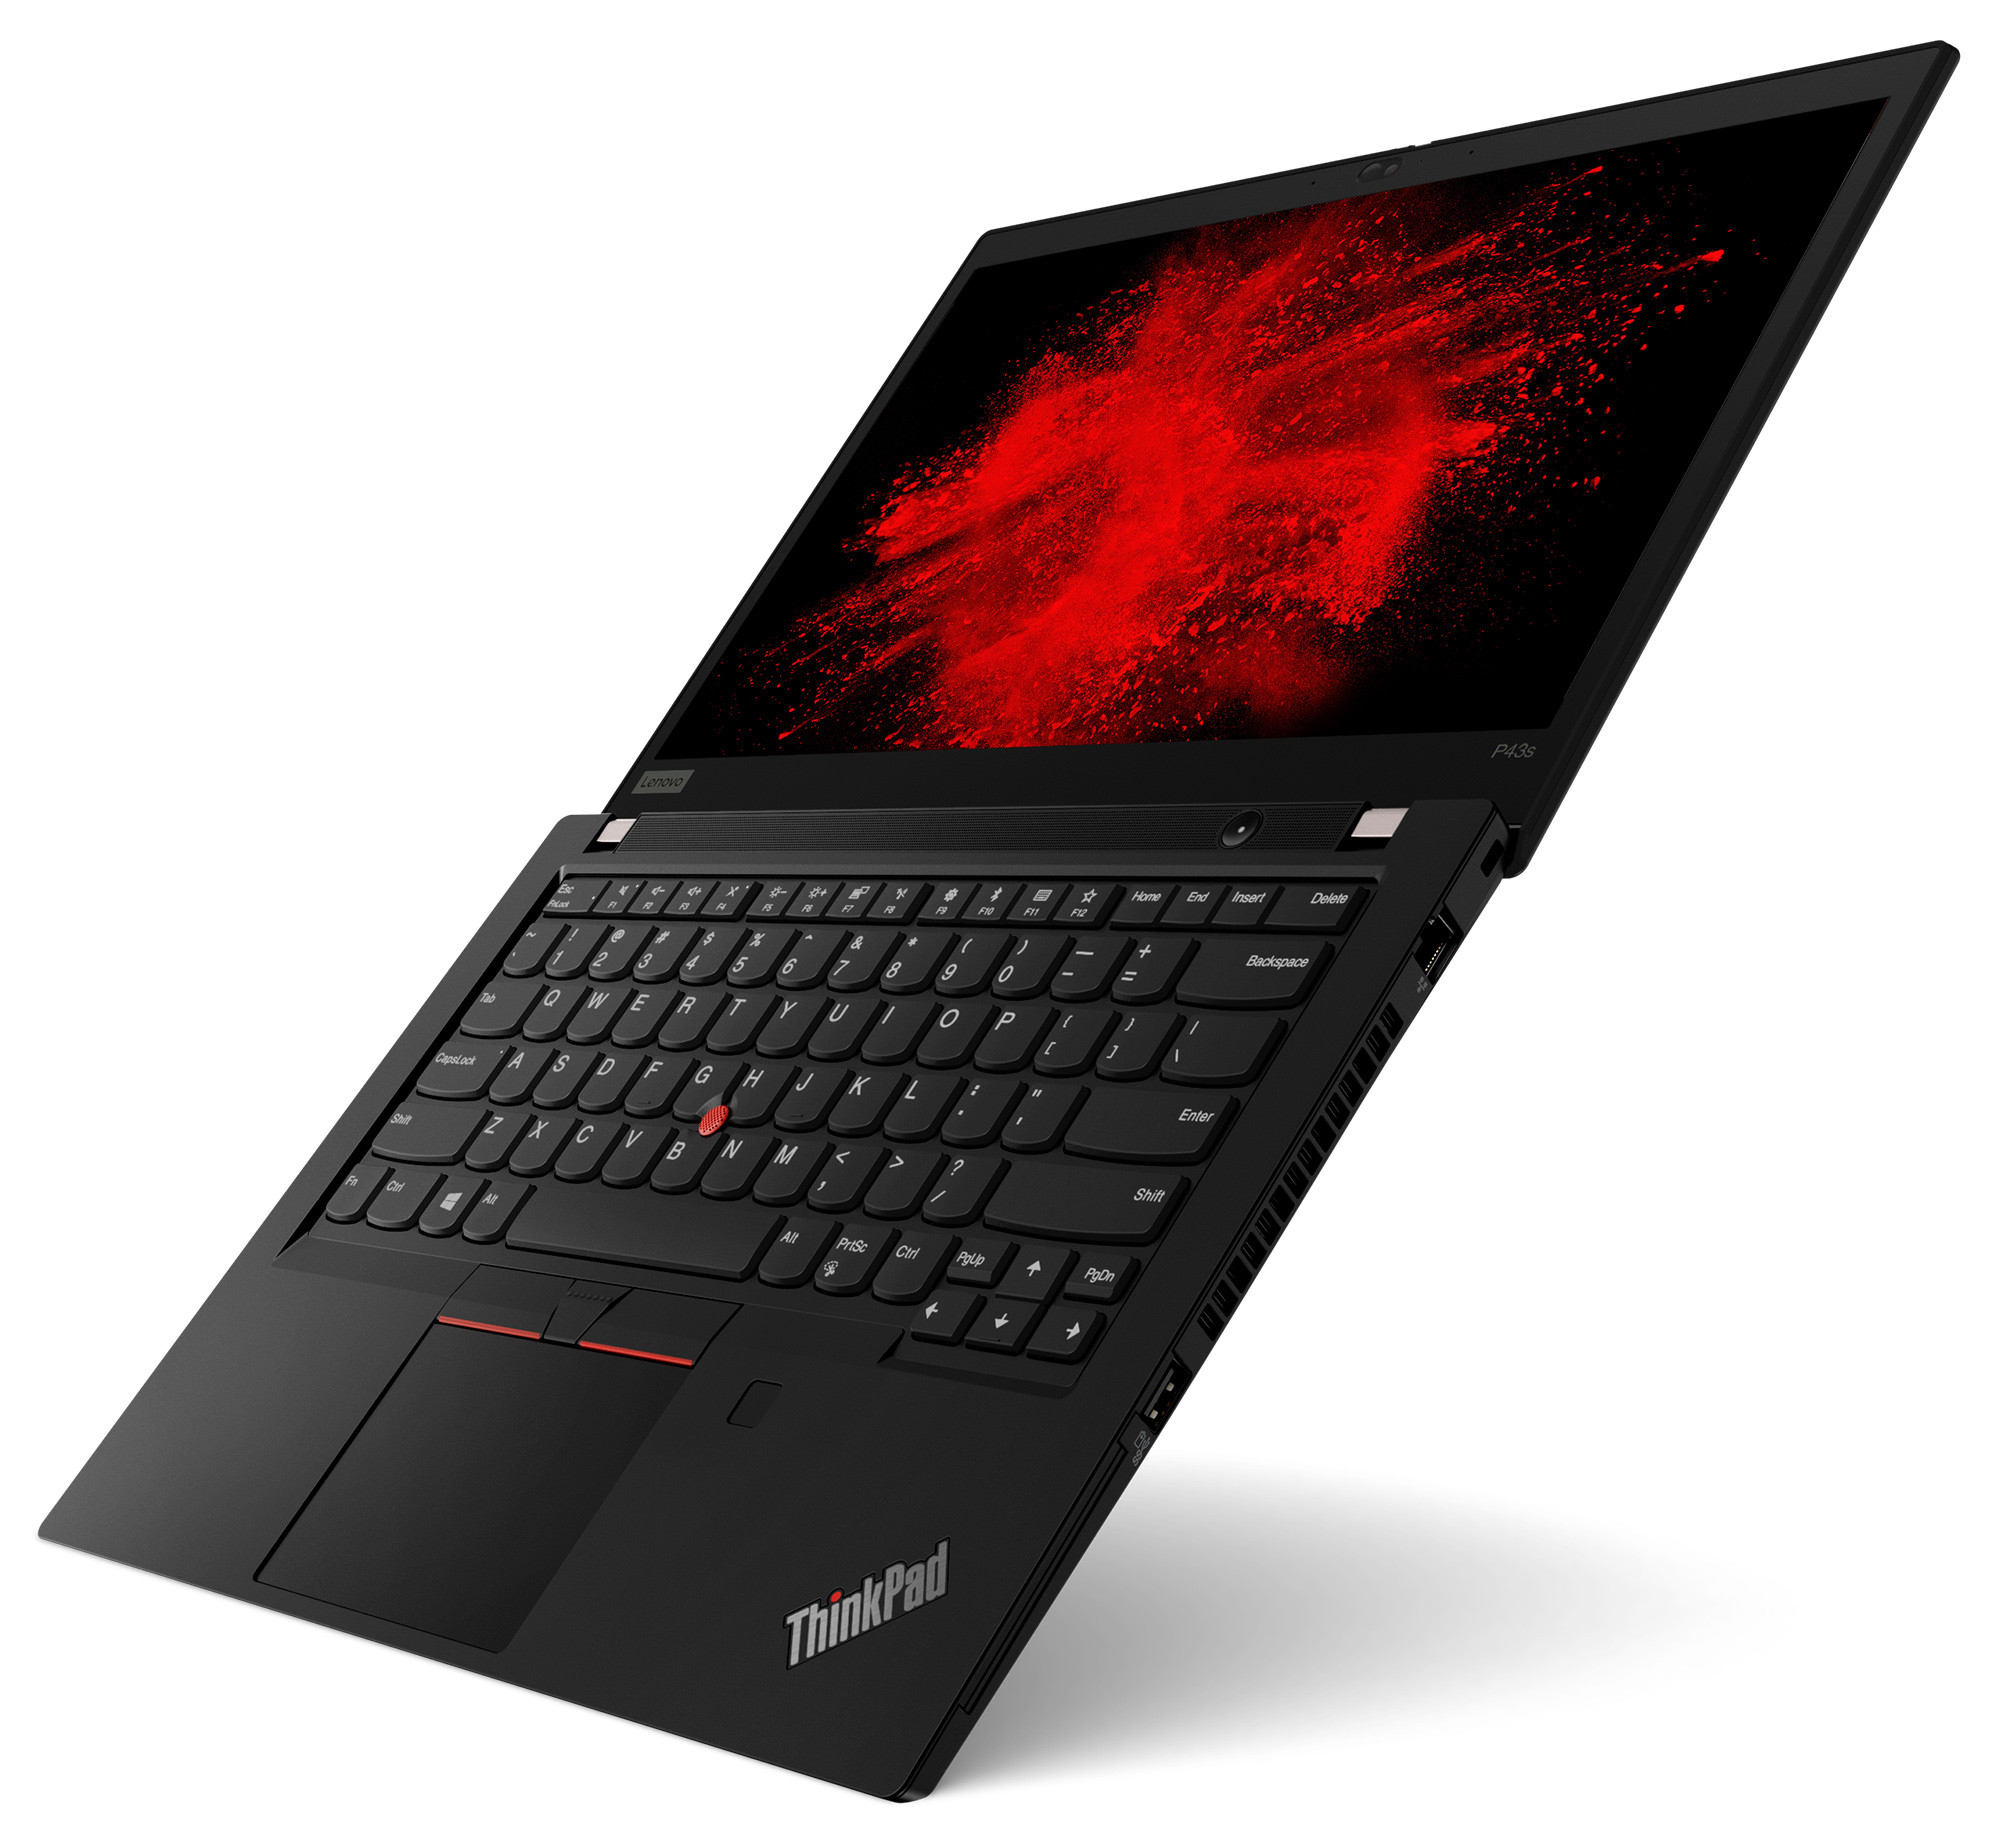
Breve Análise do Portátil Lenovo ThinkPad P43s: A tela e o desempenho do workstation móvel decepcionam
Avaliação | Data | Modelo | Peso | Altura | Size | Resolução | Preço |
|---|---|---|---|---|---|---|---|
| 80.1 % v7 (old) | 10/2019 | Lenovo ThinkPad P43s-20RH001FGE i7-8565U, Quadro P520 | 1.5 kg | 18.9 mm | 14.00" | 1920x1080 | |
| 81 % v7 (old) | 10/2019 | HP ZBook 14u G6 6TP71EA i7-8565U, Radeon Pro WX 3200 | 1.5 kg | 17.9 mm | 14.00" | 1920x1080 |

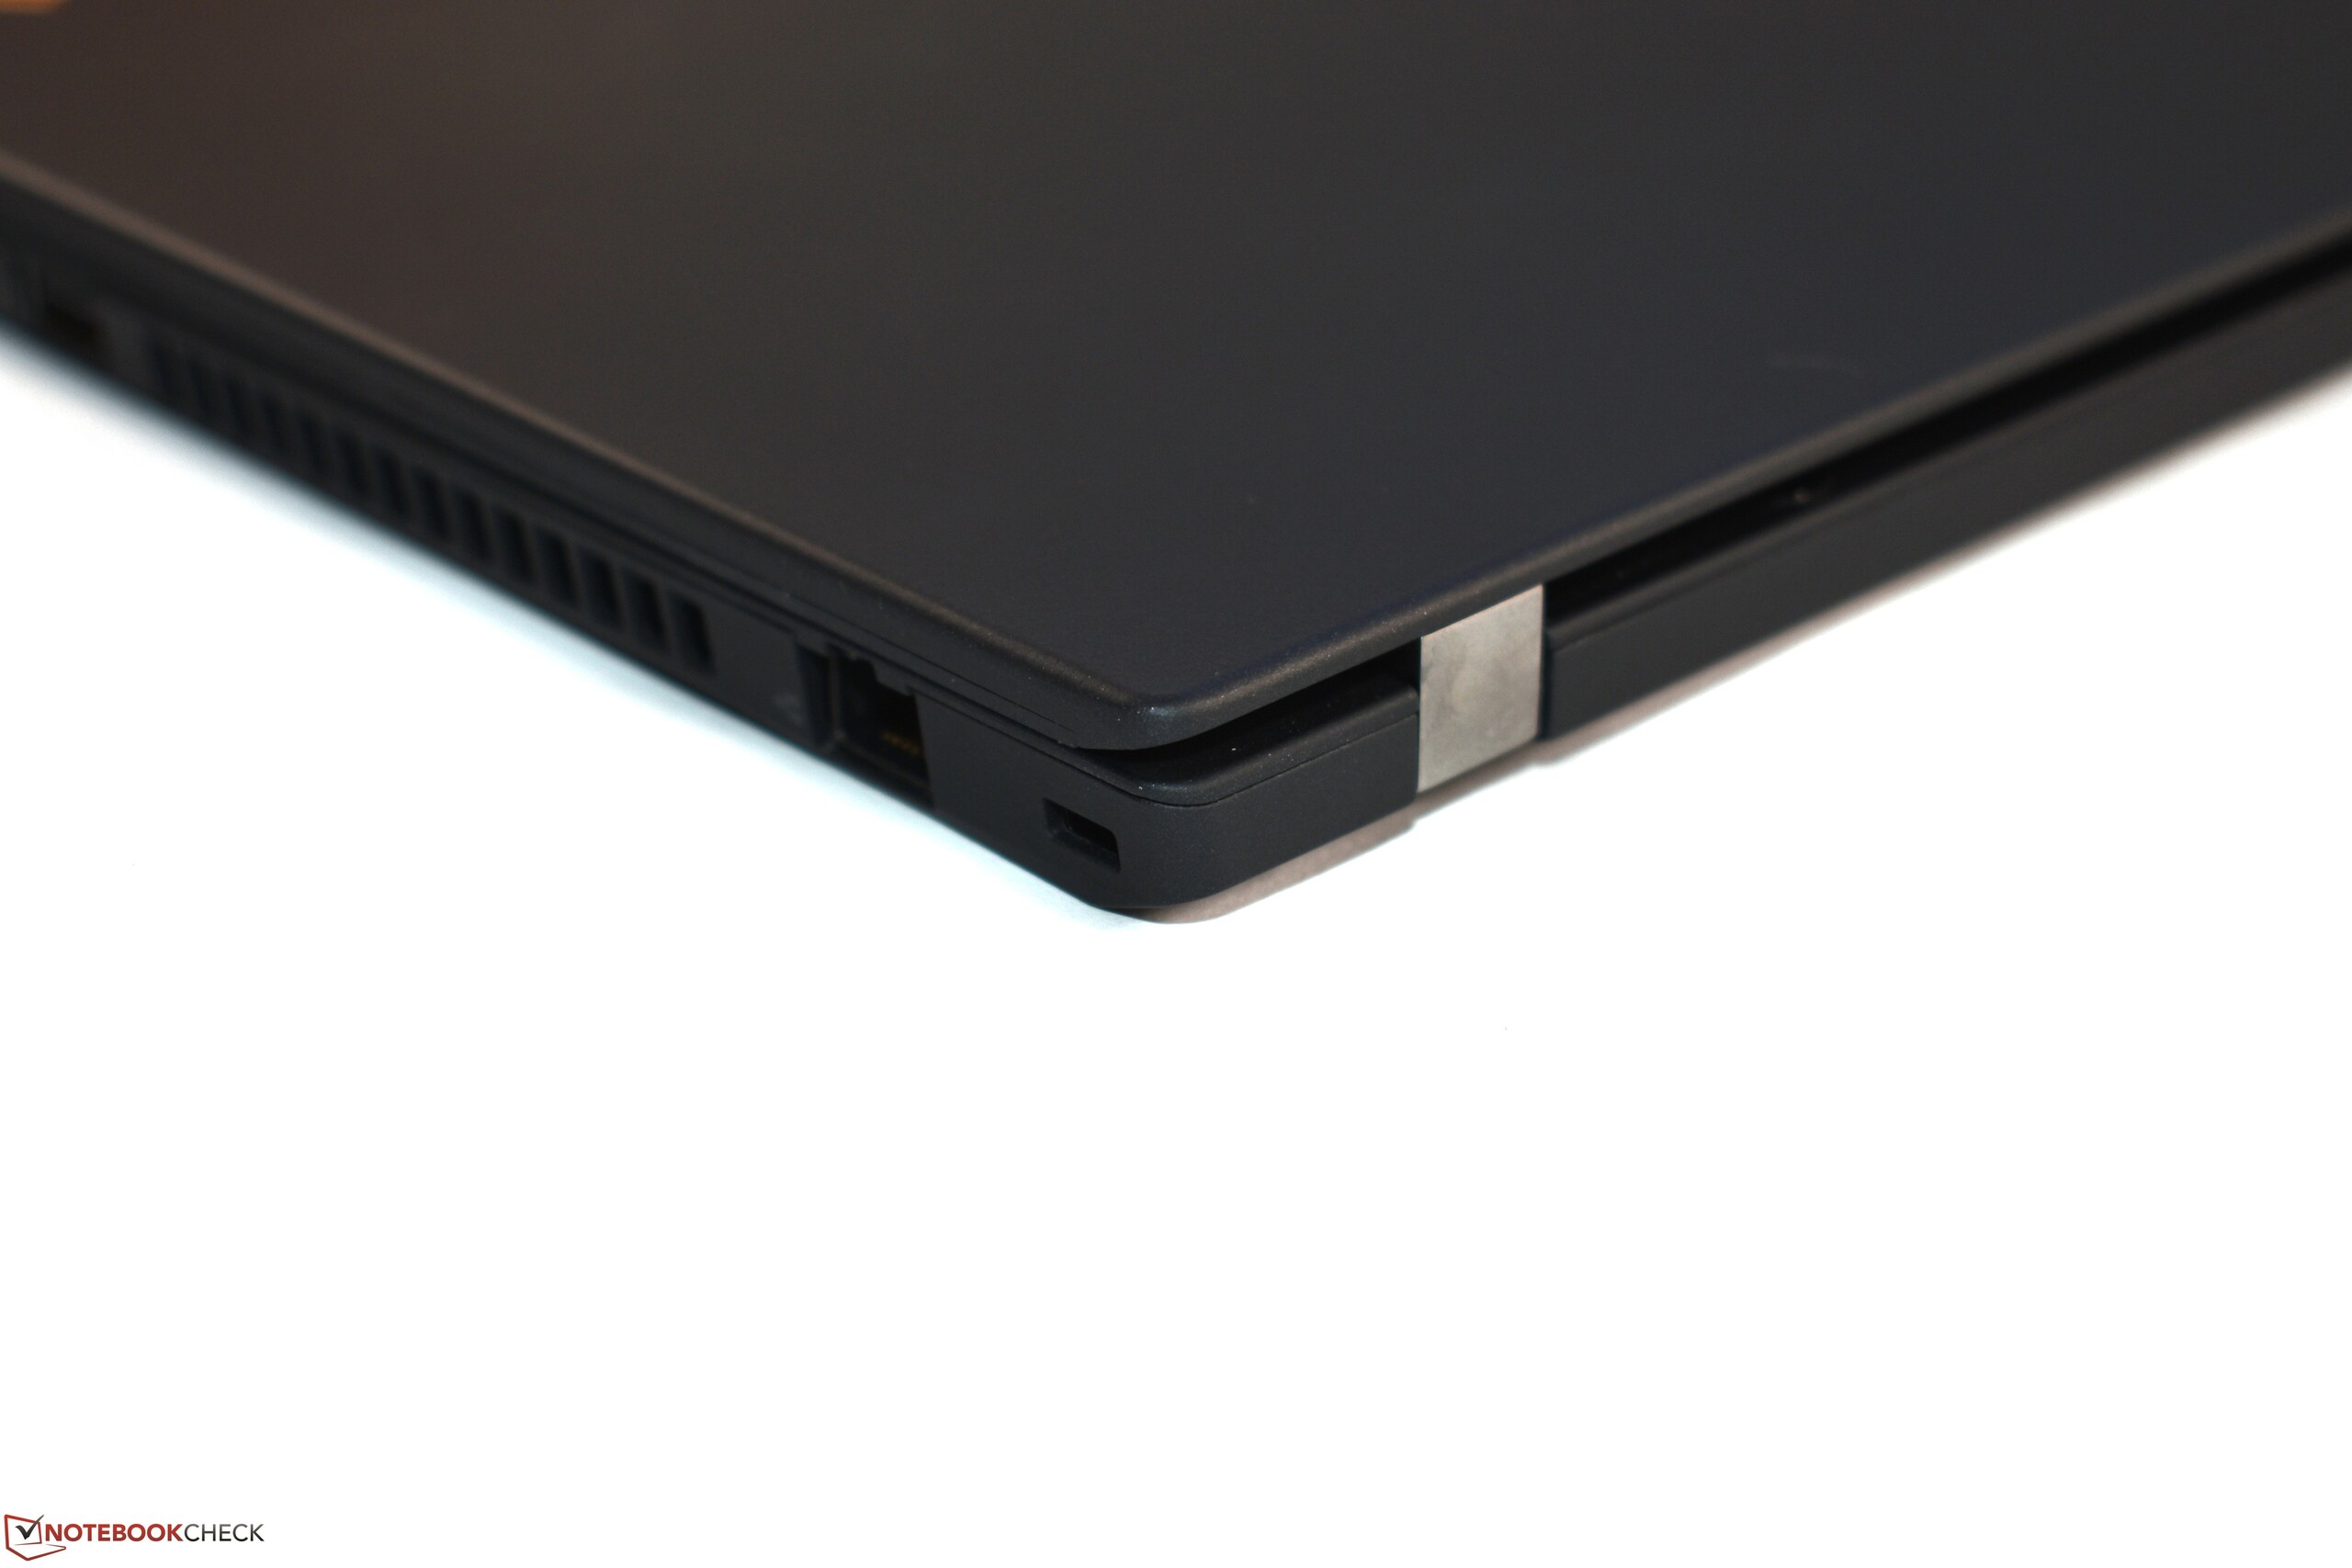
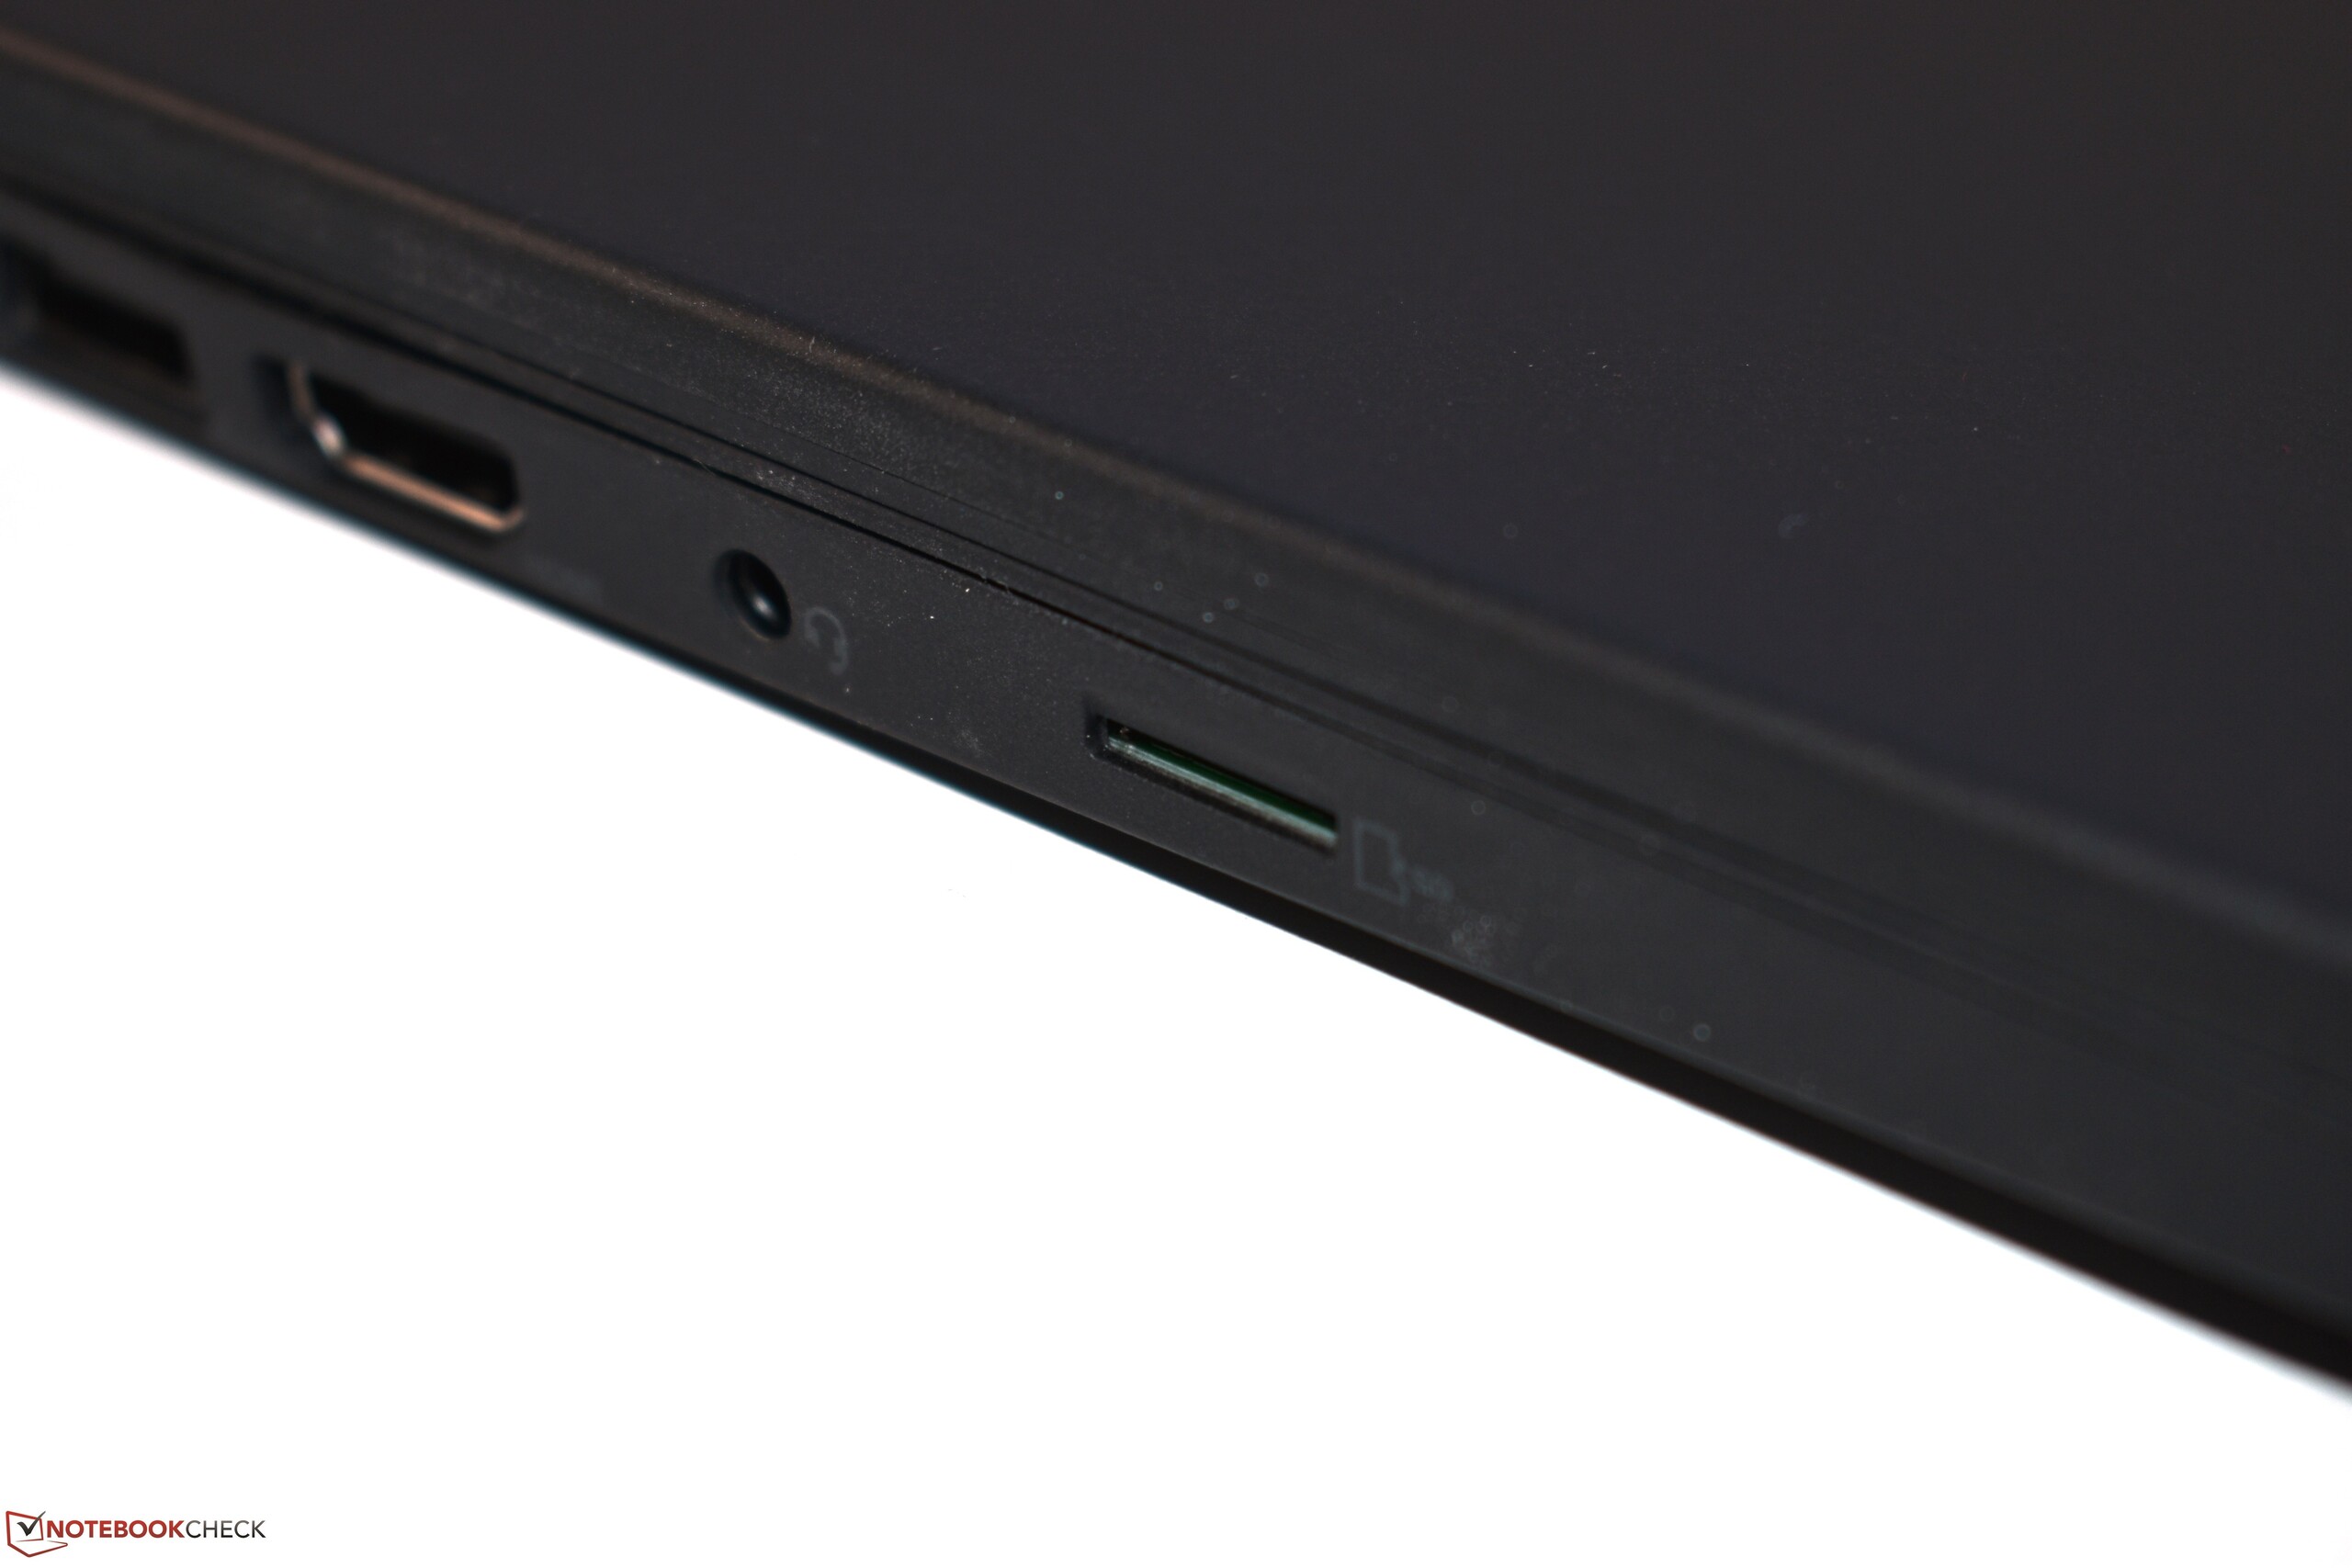
| SD Card Reader | |
| average JPG Copy Test (av. of 3 runs) | |
| Média da turma Workstation (49.6 - 681, n=14, últimos 2 anos) | |
| Dell Precision 5530 2-in-1 (Toshiba Exceria Pro M501 UHS-II) | |
| Lenovo ThinkPad P43s-20RH001FGE (Toshiba Exceria Pro M501 64 GB UHS-II) | |
| Lenovo ThinkPad T490-20N3S02L00 (Toshiba Exceria Pro M501) | |
| maximum AS SSD Seq Read Test (1GB) | |
| Média da turma Workstation (87.6 - 1455, n=14, últimos 2 anos) | |
| Dell Precision 5530 2-in-1 (Toshiba Exceria Pro M501 UHS-II) | |
| Lenovo ThinkPad T490-20N3S02L00 (Toshiba Exceria Pro M501) | |
| Lenovo ThinkPad P43s-20RH001FGE (Toshiba Exceria Pro M501 64 GB UHS-II) | |
| |||||||||||||||||||||||||
iluminação: 89 %
iluminação com acumulador: 232 cd/m²
Contraste: 1365:1 (Preto: 0.17 cd/m²)
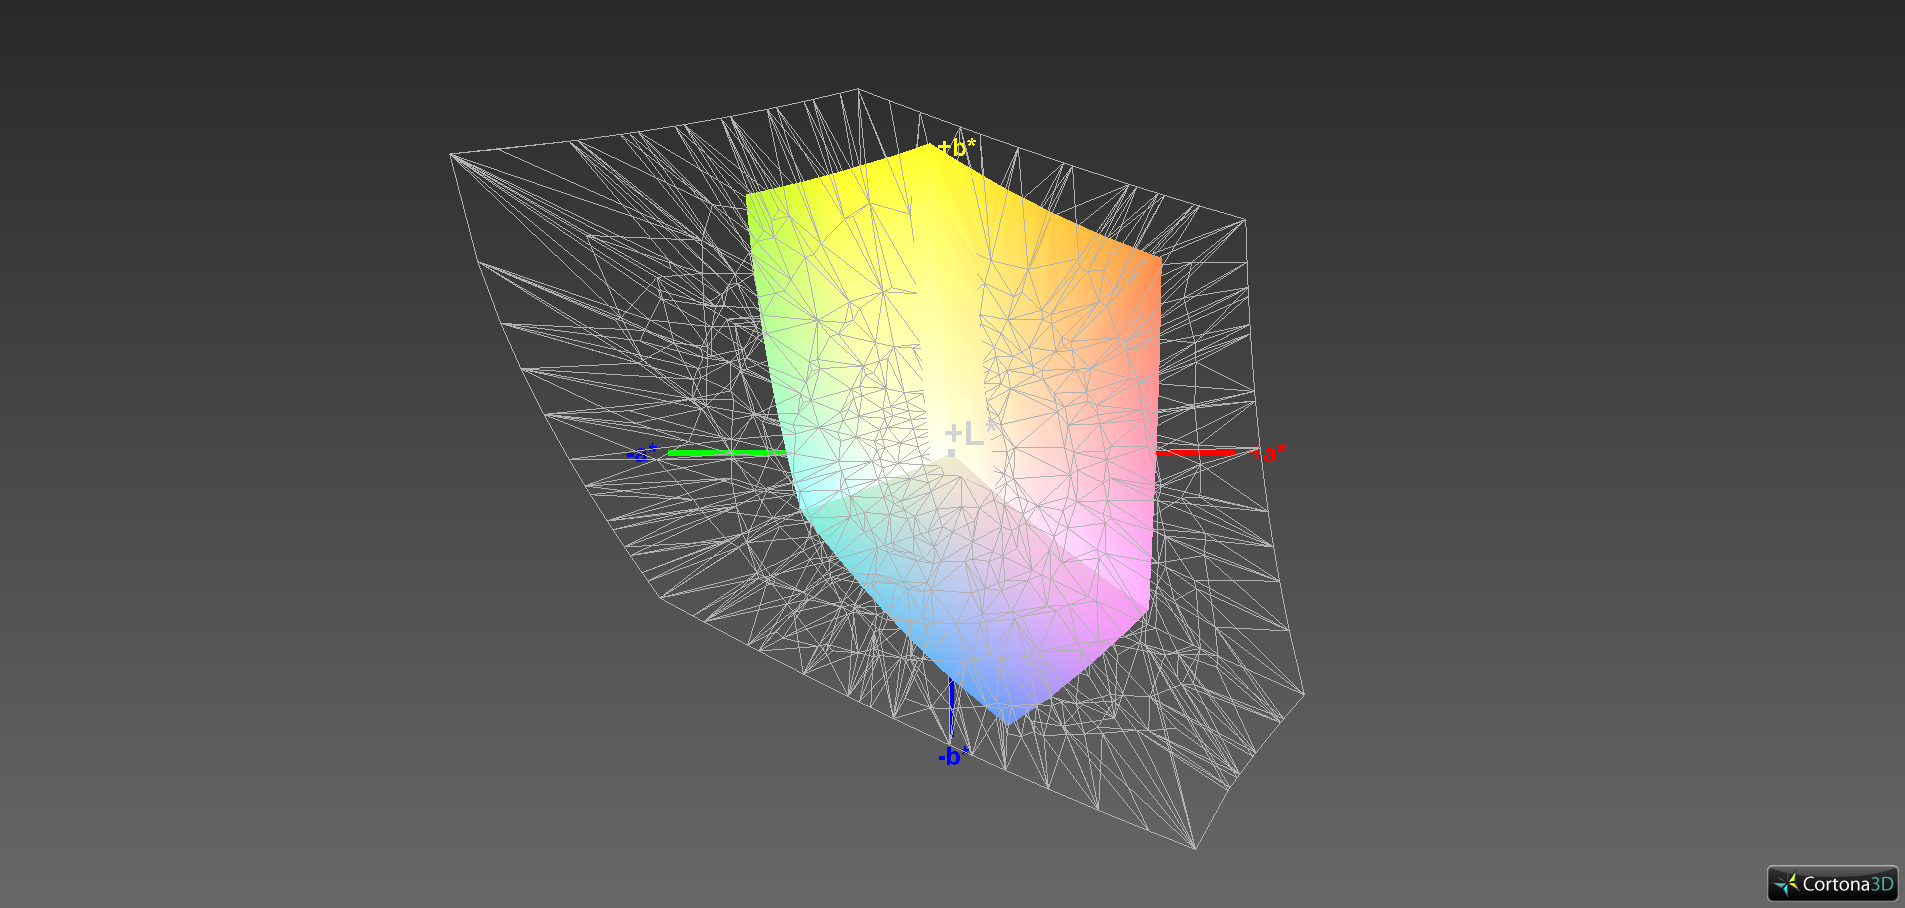
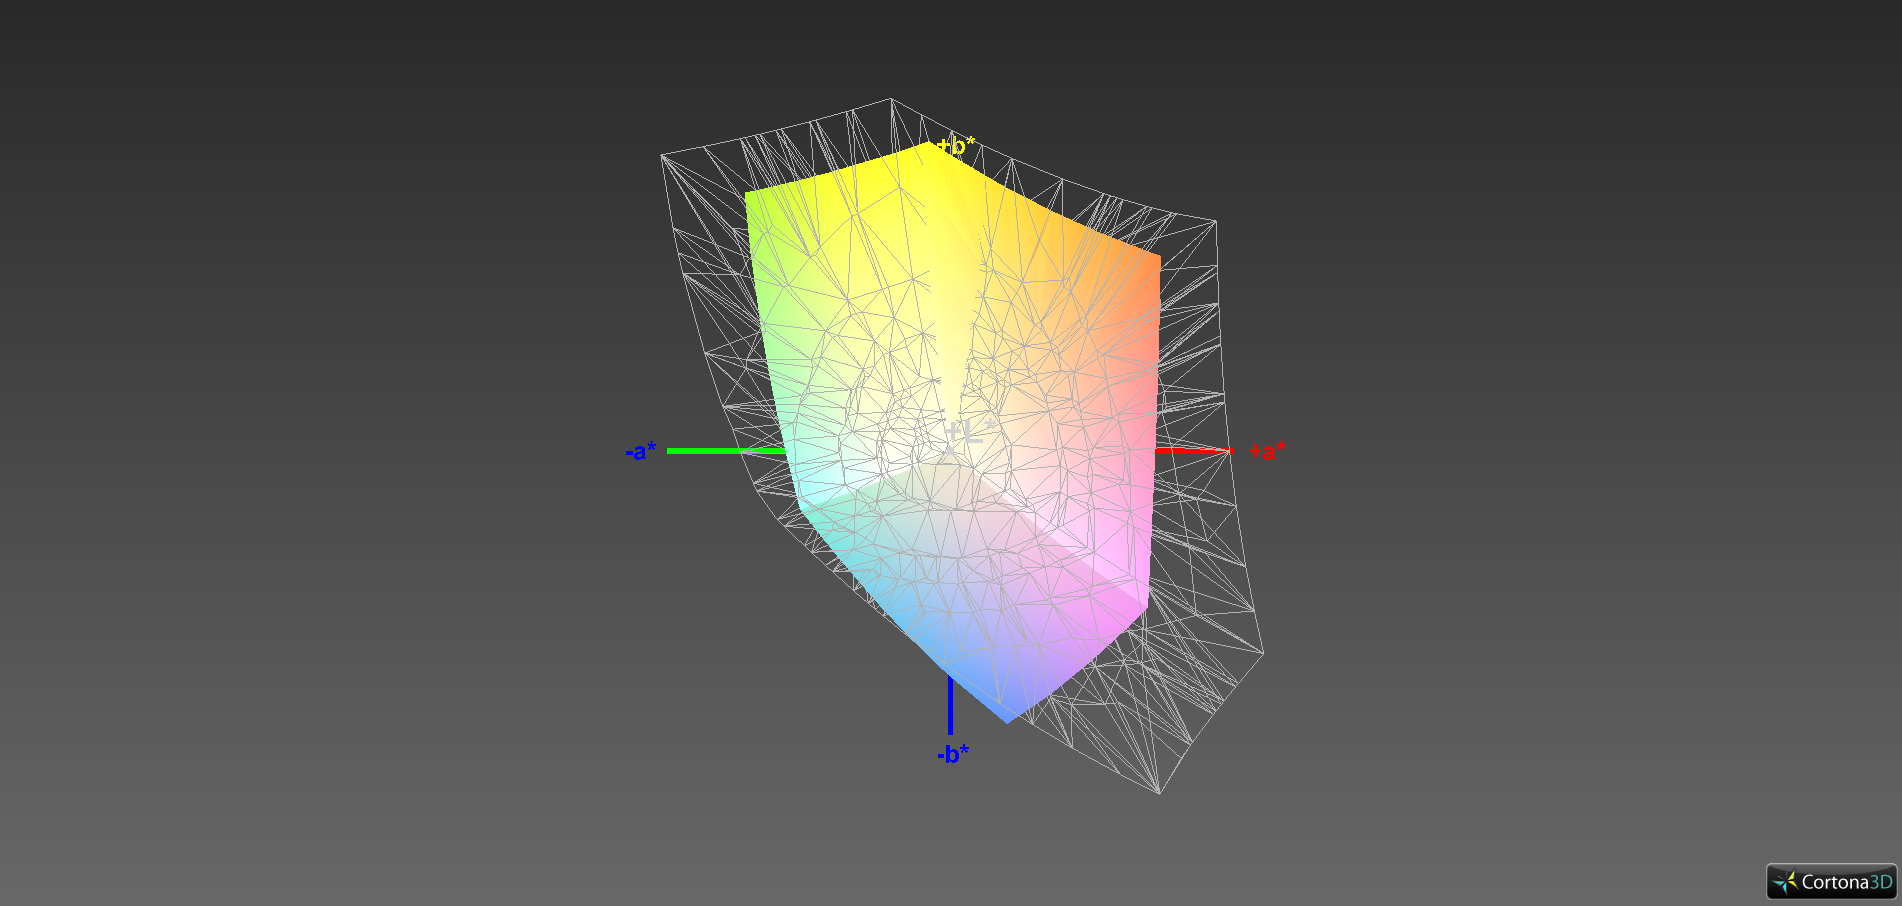
ΔE ColorChecker Calman: 5.9 | ∀{0.5-29.43 Ø4.73}
calibrated: 4.4
ΔE Greyscale Calman: 4.8 | ∀{0.09-98 Ø4.97}
62.8% sRGB (Argyll 1.6.3 3D)
40.2% AdobeRGB 1998 (Argyll 1.6.3 3D)
43.68% AdobeRGB 1998 (Argyll 3D)
63.1% sRGB (Argyll 3D)
42.23% Display P3 (Argyll 3D)
Gamma: 1.98
CCT: 6226 K
| Lenovo ThinkPad P43s-20RH001FGE IPS, 1920x1080, 14" | HP ZBook 14u G6 6TP71EA IPS, 1920x1080, 14" | Lenovo ThinkPad T490-20N3S02L00 IGZO IPS LED, 1920x1080, 14" | Dell Precision 5530 2-in-1 IPS, 3840x2160, 15.6" | |
|---|---|---|---|---|
| Display | 63% | 55% | 101% | |
| Display P3 Coverage (%) | 42.23 | 69.7 65% | 69.3 64% | 91.2 116% |
| sRGB Coverage (%) | 63.1 | 99.6 58% | 92.2 46% | 99.9 58% |
| AdobeRGB 1998 Coverage (%) | 43.68 | 71.9 65% | 67.4 54% | 99.4 128% |
| Response Times | 20% | -64% | -22% | |
| Response Time Grey 50% / Grey 80% * (ms) | 42.6 ? | 40.4 ? 5% | 74 ? -74% | 49.6 ? -16% |
| Response Time Black / White * (ms) | 29.6 ? | 19.2 ? 35% | 45.6 ? -54% | 37.6 ? -27% |
| PWM Frequency (Hz) | 24750 ? | 2451 ? | 990 ? | |
| Screen | 40% | 32% | 36% | |
| Brightness middle (cd/m²) | 232 | 437 88% | 418 80% | 430.9 86% |
| Brightness (cd/m²) | 214 | 420 96% | 400 87% | 398 86% |
| Brightness Distribution (%) | 89 | 92 3% | 88 -1% | 79 -11% |
| Black Level * (cd/m²) | 0.17 | 0.31 -82% | 0.24 -41% | 0.35 -106% |
| Contrast (:1) | 1365 | 1410 3% | 1742 28% | 1231 -10% |
| Colorchecker dE 2000 * | 5.9 | 2.6 56% | 4.7 20% | 3.29 44% |
| Colorchecker dE 2000 max. * | 20.3 | 6.5 68% | 8.7 57% | 7.46 63% |
| Colorchecker dE 2000 calibrated * | 4.4 | 0.8 82% | 2.1 52% | 3.58 19% |
| Greyscale dE 2000 * | 4.8 | 4.5 6% | 5.9 -23% | 2.6 46% |
| Gamma | 1.98 111% | 2.2 100% | 2.06 107% | 2.19 100% |
| CCT | 6226 104% | 6809 95% | 7350 88% | 6870 95% |
| Color Space (Percent of AdobeRGB 1998) (%) | 40.2 | 65.4 63% | 59.9 49% | 87.2 117% |
| Color Space (Percent of sRGB) (%) | 62.8 | 99.6 59% | 92.1 47% | 100 59% |
| Média Total (Programa/Configurações) | 41% /
42% | 8% /
24% | 38% /
41% |
* ... menor é melhor
Exibir tempos de resposta
| ↔ Tempo de resposta preto para branco | ||
|---|---|---|
| 29.6 ms ... ascensão ↗ e queda ↘ combinadas | ↗ 17.2 ms ascensão | 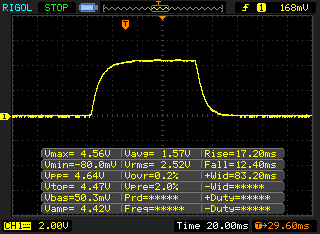 |
| ↘ 12.4 ms queda | ||
| A tela mostra taxas de resposta relativamente lentas em nossos testes e pode ser muito lenta para os jogadores. Em comparação, todos os dispositivos testados variam de 0.1 (mínimo) a 240 (máximo) ms. » 79 % de todos os dispositivos são melhores. Isso significa que o tempo de resposta medido é pior que a média de todos os dispositivos testados (19.9 ms). | ||
| ↔ Tempo de resposta 50% cinza a 80% cinza | ||
| 42.6 ms ... ascensão ↗ e queda ↘ combinadas | ↗ 22 ms ascensão | 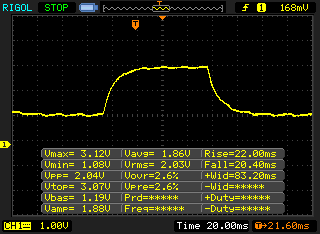 |
| ↘ 20.4 ms queda | ||
| A tela mostra taxas de resposta lentas em nossos testes e será insatisfatória para os jogadores. Em comparação, todos os dispositivos testados variam de 0.165 (mínimo) a 636 (máximo) ms. » 70 % de todos os dispositivos são melhores. Isso significa que o tempo de resposta medido é pior que a média de todos os dispositivos testados (31.1 ms). | ||
Cintilação da tela / PWM (modulação por largura de pulso)
| Tela tremeluzindo/PWM detectado | 24750 Hz | ≤ 40 % configuração de brilho | 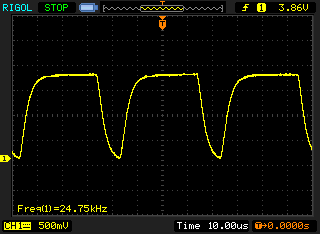 |
A luz de fundo da tela pisca em 24750 Hz (pior caso, por exemplo, utilizando PWM) Cintilação detectada em uma configuração de brilho de 40 % e abaixo. Não deve haver cintilação ou PWM acima desta configuração de brilho. A frequência de 24750 Hz é bastante alta, então a maioria dos usuários sensíveis ao PWM não deve notar nenhuma oscilação. [pwm_comparison] Em comparação: 52 % de todos os dispositivos testados não usam PWM para escurecer a tela. Se PWM foi detectado, uma média de 7801 (mínimo: 5 - máximo: 343500) Hz foi medida. | |||

| Geekbench 3 | |
| 32 Bit Multi-Core Score | |
| HP ZBook 14u G6 6TP71EA | |
| Média Intel Core i7-8565U (10521 - 13703, n=12) | |
| Lenovo ThinkPad P43s-20RH001FGE | |
| 32 Bit Single-Core Score | |
| Média Intel Core i7-8565U (3340 - 4820, n=12) | |
| HP ZBook 14u G6 6TP71EA | |
| Lenovo ThinkPad P43s-20RH001FGE | |
| Mozilla Kraken 1.1 - Total | |
| Lenovo ThinkPad P43s-20RH001FGE (Edge 44) | |
| HP ZBook 14u G6 6TP71EA (Edge 44) | |
| Dell Precision 5530 2-in-1 (Edge 42.17134.1.0) | |
| Média Intel Core i7-8565U (730 - 2622, n=43) | |
| Lenovo ThinkPad T490-20N3S02L00 (Edge) | |
| Média da turma Workstation (411 - 538, n=25, últimos 2 anos) | |
| Octane V2 - Total Score | |
| Média da turma Workstation (92715 - 129420, n=4, últimos 2 anos) | |
| Lenovo ThinkPad T490-20N3S02L00 (Edge) | |
| Média Intel Core i7-8565U (13935 - 49795, n=42) | |
| HP ZBook 14u G6 6TP71EA (Edge 44) | |
| Lenovo ThinkPad P43s-20RH001FGE (Edge 44) | |
| Dell Precision 5530 2-in-1 (Edge 42.17134.1.0) | |
| JetStream 1.1 - 1.1 Total | |
| Dell Precision 5530 2-in-1 (Edge 42.17134.1.0) | |
| HP ZBook 14u G6 6TP71EA (Edge 44) | |
| Média Intel Core i7-8565U (107.6 - 277, n=37) | |
| Lenovo ThinkPad P43s-20RH001FGE (Edge 44) | |
* ... menor é melhor
| PCMark 8 Home Score Accelerated v2 | 3313 pontos | |
| PCMark 8 Creative Score Accelerated v2 | 3501 pontos | |
| PCMark 8 Work Score Accelerated v2 | 4918 pontos | |
| PCMark 10 Score | 3092 pontos | |
Ajuda | ||

| Lenovo ThinkPad P43s-20RH001FGE WDC PC SN720 SDAQNTW-256G | HP ZBook 14u G6 6TP71EA Samsung SSD PM981 MZVLB512HAJQ | Lenovo ThinkPad T490-20N3S02L00 Toshiba XG5 KXG50ZNV512G | Dell Precision 5530 2-in-1 SK Hynix PC401 512GB M.2 (HFS512GD9TNG) | Média WDC PC SN720 SDAQNTW-256G | |
|---|---|---|---|---|---|
| CrystalDiskMark 5.2 / 6 | 16% | 4% | -12% | 0% | |
| Write 4K (MB/s) | 135.3 | 173.7 28% | 126.6 -6% | 128.9 -5% | 135.3 ? 0% |
| Read 4K (MB/s) | 45.09 | 50.6 12% | 43.61 -3% | 45.7 1% | 45.1 ? 0% |
| Write Seq (MB/s) | 1576 | 1100 -30% | 1342 -15% | 635 -60% | 1576 ? 0% |
| Read Seq (MB/s) | 1457 | 1072 -26% | 1251 -14% | 2065 42% | 1457 ? 0% |
| Write 4K Q32T1 (MB/s) | 356.3 | 555 56% | 297.7 -16% | 336.6 -6% | 356 ? 0% |
| Read 4K Q32T1 (MB/s) | 385.4 | 625 62% | 376.4 -2% | 393.6 2% | 385 ? 0% |
| Write Seq Q32T1 (MB/s) | 1613 | 1892 17% | 2969 84% | 662 -59% | 1613 ? 0% |
| Read Seq Q32T1 (MB/s) | 3017 | 3233 7% | 3228 7% | 2664 -12% | 3017 ? 0% |
| 3DMark 06 Standard Score | 15127 pontos | |
| 3DMark 11 Performance | 3622 pontos | |
| 3DMark Ice Storm Standard Score | 43462 pontos | |
| 3DMark Cloud Gate Standard Score | 7839 pontos | |
| 3DMark Fire Strike Score | 2666 pontos | |
| 3DMark Time Spy Score | 964 pontos | |
Ajuda | ||
| The Witcher 3 - 1024x768 Low Graphics & Postprocessing | |
| Média da turma Workstation (134.6 - 393, n=3, últimos 2 anos) | |
| Dell Precision 5530 2-in-1 | |
| Lenovo ThinkPad T490-20N3S02L00 | |
| HP ZBook 14u G6 6TP71EA | |
| Média NVIDIA Quadro P520 (42.7 - 61.9, n=6) | |
| Lenovo ThinkPad P43s-20RH001FGE | |
| Lenovo ThinkPad P52s-20LB000HGE | |
| baixo | média | alto | ultra | |
|---|---|---|---|---|
| Tomb Raider (2013) | 154.2 | 112.8 | 76.8 | 35.3 |
| BioShock Infinite (2013) | 115.7 | 88.1 | 78.4 | 31.2 |
| The Witcher 3 (2015) | 47.2 | 32 | 18.9 | 8.4 |
| Dota 2 Reborn (2015) | 114 | 102 | 53.2 | 47.6 |
| X-Plane 11.11 (2018) | 66 | 40.7 | 34.9 | |
| Darksiders III (2018) | 46.1 | 23 | 19.1 | 15.5 |
| Metro Exodus (2019) | 26.4 | 7.3 | 6.3 | 5.3 |
| Total War: Three Kingdoms (2019) | 50.4 | 16.9 | 7.2 | 3.6 |
| F1 2019 (2019) | 30 | 16 | 14 | 9 |
| Control (2019) | 38.2 | 11.9 | 5.5 | |
| Borderlands 3 (2019) | 24.2 | 10.1 | 4.9 |
Barulho
| Ocioso |
| 29.2 / 29.2 / 29.2 dB |
| Carga |
| 33.3 / 33.3 dB |
 | ||
30 dB silencioso 40 dB(A) audível 50 dB(A) ruidosamente alto |
||
min: | ||
| Lenovo ThinkPad P43s-20RH001FGE i7-8565U, Quadro P520 | HP ZBook 14u G6 6TP71EA i7-8565U, Radeon Pro WX 3200 | Lenovo ThinkPad T490-20N3S02L00 i7-8565U, GeForce MX250 | Dell Precision 5530 2-in-1 i7-8706G, WX Vega M GL | Média NVIDIA Quadro P520 | Média da turma Workstation | |
|---|---|---|---|---|---|---|
| Noise | -3% | -3% | -9% | -2% | -3% | |
| desligado / ambiente * (dB) | 29.2 | 29.7 -2% | 29.4 -1% | 28.6 2% | 29.4 ? -1% | 24.1 ? 17% |
| Idle Minimum * (dB) | 29.2 | 29.7 -2% | 29.4 -1% | 28.6 2% | 29.4 ? -1% | 24.8 ? 15% |
| Idle Average * (dB) | 29.2 | 29.7 -2% | 29.4 -1% | 28.6 2% | 29.4 ? -1% | 25.4 ? 13% |
| Idle Maximum * (dB) | 29.2 | 30.4 -4% | 29.4 -1% | 29.1 -0% | 30 ? -3% | 26.7 ? 9% |
| Load Average * (dB) | 33.3 | 32.7 2% | 34.7 -4% | 39.8 -20% | 33.4 ? -0% | 39.2 ? -18% |
| Load Maximum * (dB) | 33.3 | 35.9 -8% | 37.2 -12% | 47 -41% | 34.7 ? -4% | 50.4 ? -51% |
| Witcher 3 ultra * (dB) | 35.3 | 34.7 | 47 |
* ... menor é melhor
(-) A temperatura máxima no lado superior é 48.9 °C / 120 F, em comparação com a média de 38.2 °C / 101 F , variando de 22.2 a 69.8 °C para a classe Workstation.
(-) A parte inferior aquece até um máximo de 58.9 °C / 138 F, em comparação com a média de 41.1 °C / 106 F
(+) Em uso inativo, a temperatura média para o lado superior é 23.5 °C / 74 F, em comparação com a média do dispositivo de 32 °C / ### class_avg_f### F.
(+) Os apoios para as mãos e o touchpad estão atingindo a temperatura máxima da pele (35.3 °C / 95.5 F) e, portanto, não estão quentes.
(-) A temperatura média da área do apoio para as mãos de dispositivos semelhantes foi 27.8 °C / 82 F (-7.5 °C / -13.5 F).
| Lenovo ThinkPad P43s-20RH001FGE i7-8565U, Quadro P520 | HP ZBook 14u G6 6TP71EA i7-8565U, Radeon Pro WX 3200 | Lenovo ThinkPad T490-20N3S02L00 i7-8565U, GeForce MX250 | Dell Precision 5530 2-in-1 i7-8706G, WX Vega M GL | Média NVIDIA Quadro P520 | Média da turma Workstation | |
|---|---|---|---|---|---|---|
| Heat | 12% | 8% | -9% | -2% | -5% | |
| Maximum Upper Side * (°C) | 48.9 | 40.8 17% | 45.2 8% | 48.6 1% | 50.5 ? -3% | 43.8 ? 10% |
| Maximum Bottom * (°C) | 58.9 | 43 27% | 56.6 4% | 42.2 28% | 61.5 ? -4% | 45 ? 24% |
| Idle Upper Side * (°C) | 23.7 | 24.1 -2% | 22.1 7% | 31.6 -33% | 23.9 ? -1% | 30.6 ? -29% |
| Idle Bottom * (°C) | 25.6 | 24.4 5% | 22.1 14% | 33.2 -30% | 25 ? 2% | 31.6 ? -23% |
* ... menor é melhor
Lenovo ThinkPad P43s-20RH001FGE análise de áudio
(±) | o volume do alto-falante é médio, mas bom (###valor### dB)
Graves 100 - 315Hz
(±) | graves reduzidos - em média 14.9% menor que a mediana
(±) | a linearidade dos graves é média (11.3% delta para a frequência anterior)
Médios 400 - 2.000 Hz
(±) | médios mais altos - em média 6.4% maior que a mediana
(±) | a linearidade dos médios é média (9% delta para frequência anterior)
Altos 2 - 16 kHz
(+) | agudos equilibrados - apenas 4.2% longe da mediana
(+) | os máximos são lineares (5% delta da frequência anterior)
Geral 100 - 16.000 Hz
(±) | a linearidade do som geral é média (26.1% diferença em relação à mediana)
Comparado com a mesma classe
» 88% de todos os dispositivos testados nesta classe foram melhores, 6% semelhantes, 6% piores
» O melhor teve um delta de 7%, a média foi 17%, o pior foi 35%
Comparado com todos os dispositivos testados
» 80% de todos os dispositivos testados foram melhores, 4% semelhantes, 16% piores
» O melhor teve um delta de 4%, a média foi 24%, o pior foi 134%
| desligado | |
| Ocioso | |
| Carga |
|
Key:
min: | |
| Lenovo ThinkPad P43s-20RH001FGE i7-8565U, Quadro P520 | HP ZBook 14u G6 6TP71EA i7-8565U, Radeon Pro WX 3200 | Lenovo ThinkPad T490-20N3S02L00 i7-8565U, GeForce MX250 | Dell Precision 5530 2-in-1 i7-8706G, WX Vega M GL | Média NVIDIA Quadro P520 | Média da turma Workstation | |
|---|---|---|---|---|---|---|
| Power Consumption | -29% | 2% | -89% | -18% | -144% | |
| Idle Minimum * (Watt) | 2.9 | 4.2 -45% | 2.16 26% | 7.4 -155% | 3.14 ? -8% | 8.94 ? -208% |
| Idle Average * (Watt) | 4.94 | 7.93 -61% | 5.04 -2% | 12.4 -151% | 7.3 ? -48% | 13.8 ? -179% |
| Idle Maximum * (Watt) | 7.92 | 10.9 -38% | 8.64 -9% | 13.3 -68% | 10.4 ? -31% | 17.5 ? -121% |
| Load Average * (Watt) | 60.8 | 59.1 3% | 63.2 -4% | 79.2 -30% | 60.7 ? -0% | 95 ? -56% |
| Load Maximum * (Watt) | 68.2 | 70.5 -3% | 67.5 1% | 96.5 -41% | 68.9 ? -1% | 175.2 ? -157% |
| Witcher 3 ultra * (Watt) | 50.4 | 50 | 82.2 |
* ... menor é melhor
| Lenovo ThinkPad P43s-20RH001FGE i7-8565U, Quadro P520, 51 Wh | HP ZBook 14u G6 6TP71EA i7-8565U, Radeon Pro WX 3200, 50 Wh | Lenovo ThinkPad T490-20N3S02L00 i7-8565U, GeForce MX250, 50 Wh | Dell Precision 5530 2-in-1 i7-8706G, WX Vega M GL, 75 Wh | Média da turma Workstation | |
|---|---|---|---|---|---|
| Duração da bateria | -16% | -22% | -30% | -20% | |
| H.264 (h) | 12.7 | 11 -13% | 8.7 -31% | 9.51 ? -25% | |
| WiFi v1.3 (h) | 8.5 | 8.5 0% | 9.1 7% | 7.3 -14% | 8.53 ? 0% |
| Load (h) | 2.2 | 1.4 -36% | 1.3 -41% | 1.2 -45% | 1.429 ? -35% |
| Reader / Idle (h) | 17.7 | 12.3 | 26.1 ? |
Pro
Contra

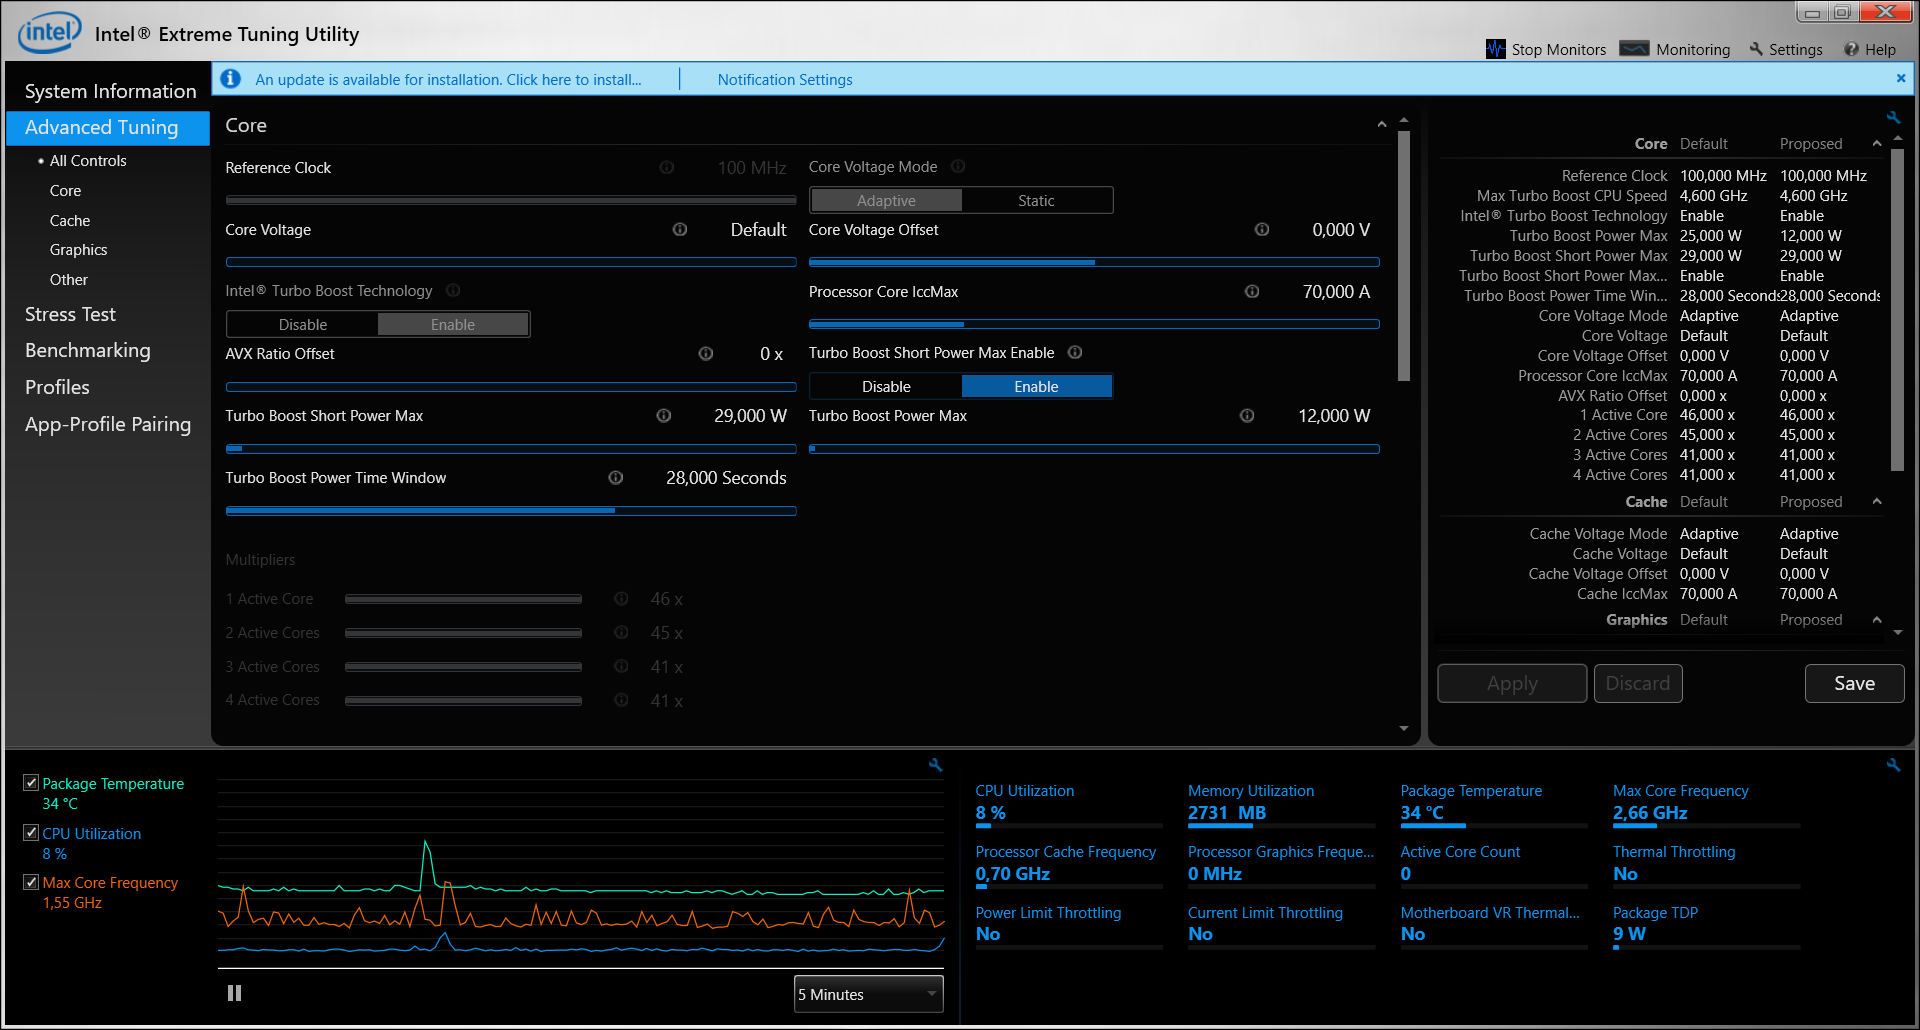
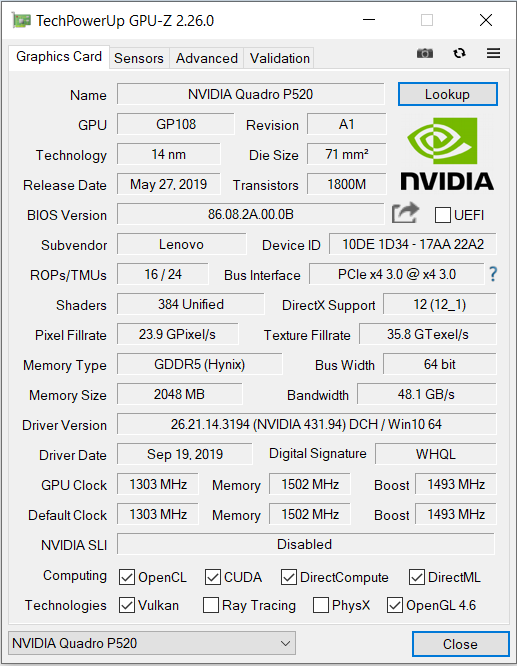
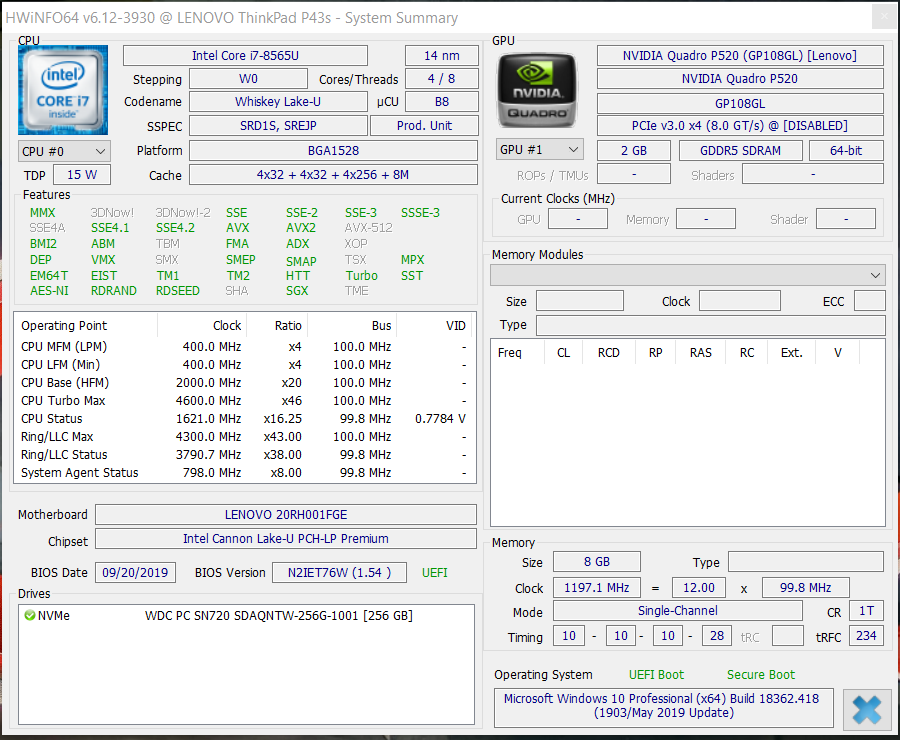
Com o ThinkPad P43s, a Lenovo possui um workstation móvel compacto de 14 polegadas em sua gama. O dispositivo é impulsionado por um processador Core i7-8550U e um núcleo gráfico Quadro P520. No entanto, ambos os componentes não podem atingir seu potencial de desempenho completo.
O ThinkPad P43s só pode desenvolver seu potencial de desempenho em uma extensão limitada.
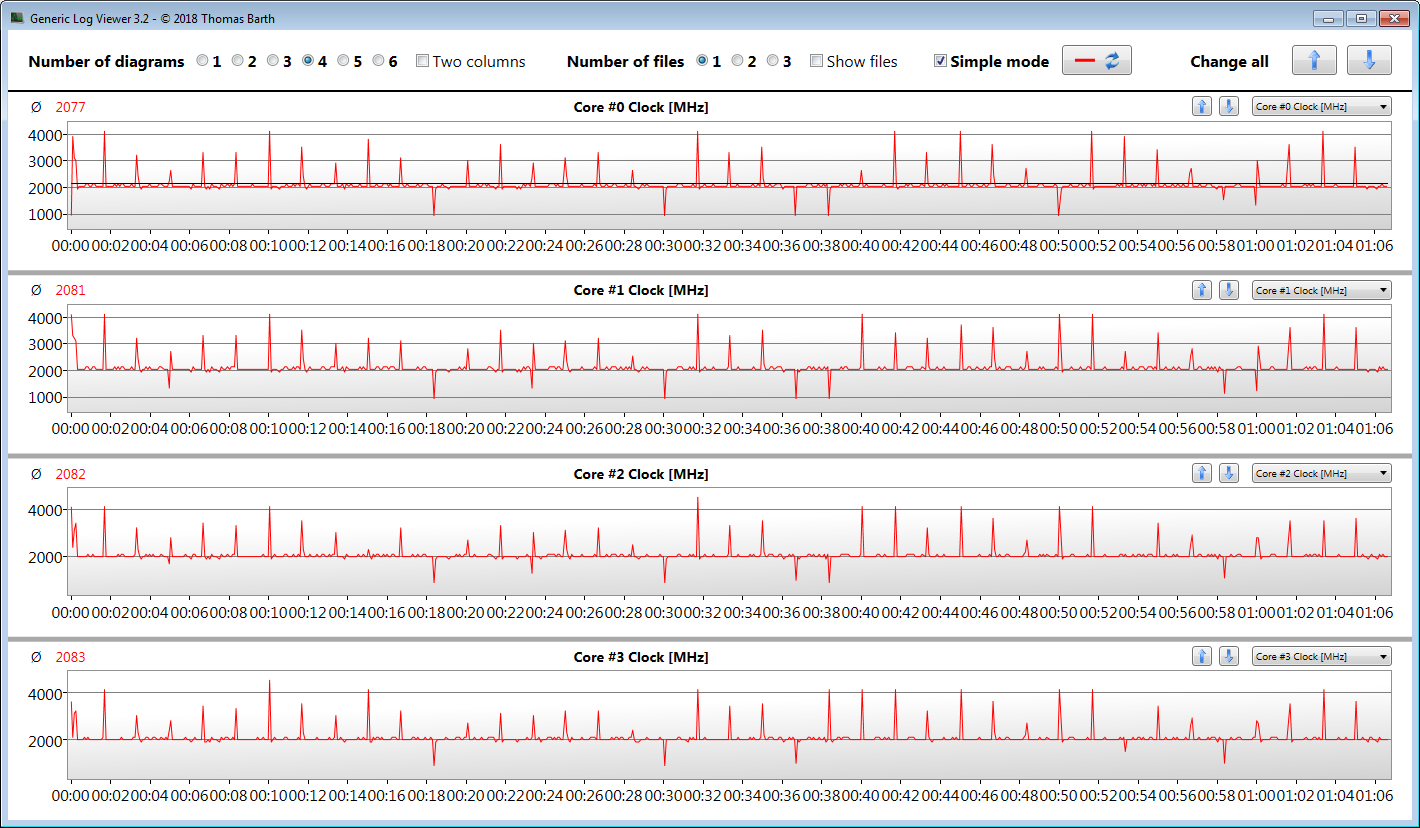
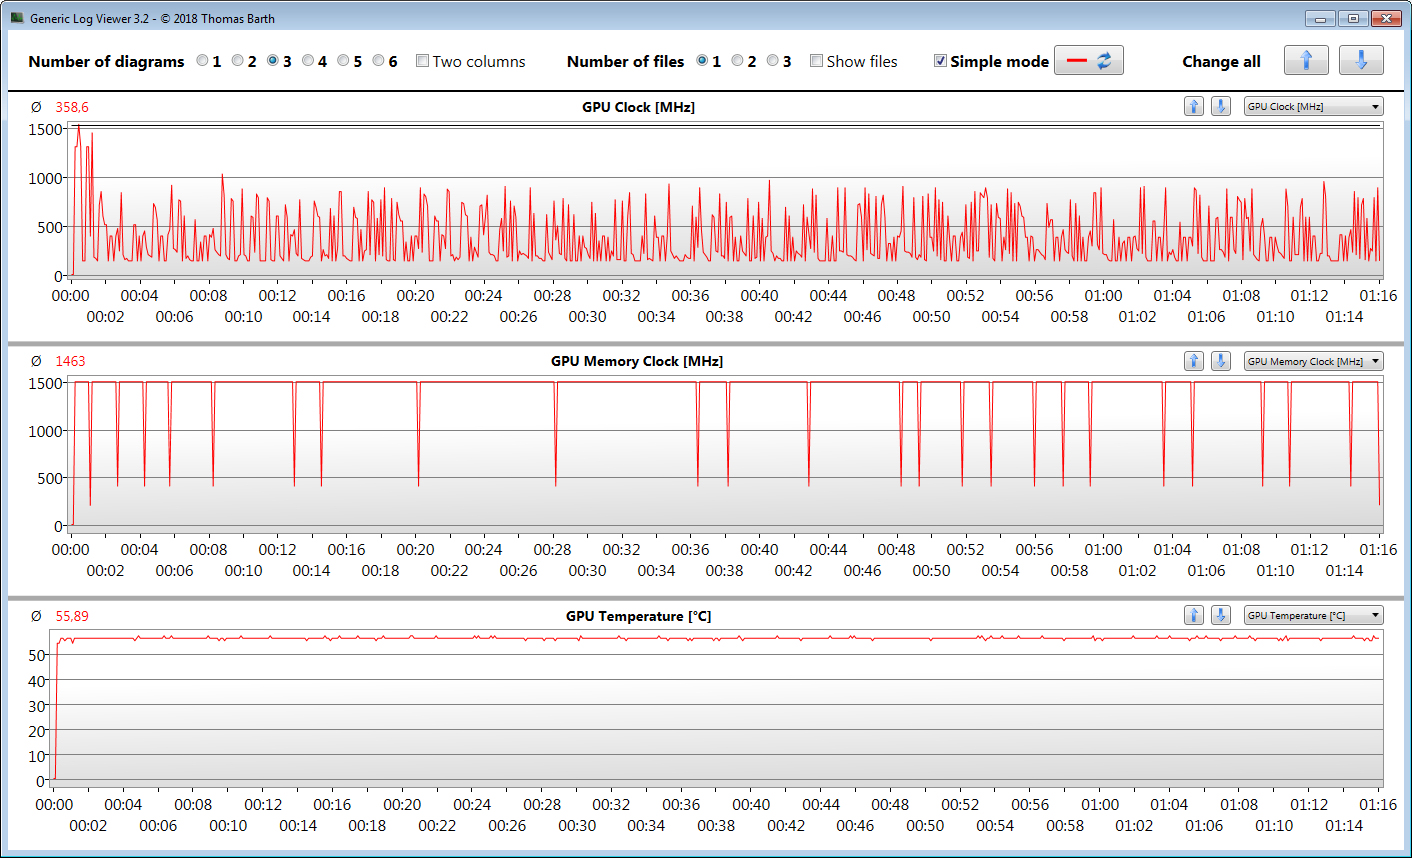
O processador atinge altas velocidades de trabalho estáveis apenas em operações single-thread; na operação multithread, o Turbo quase não é usado ou nem sequer é usado. O núcleo gráfico é afogado após um curto período de tempo porque o limite responsável por isso (temperatura da GPU> 56 °C (~ 133 °F)) foi definido extraordinariamente baixo. Portanto, o portátil é adequado principalmente para aplicativos que sobrecarregam brevemente o núcleo gráfico.
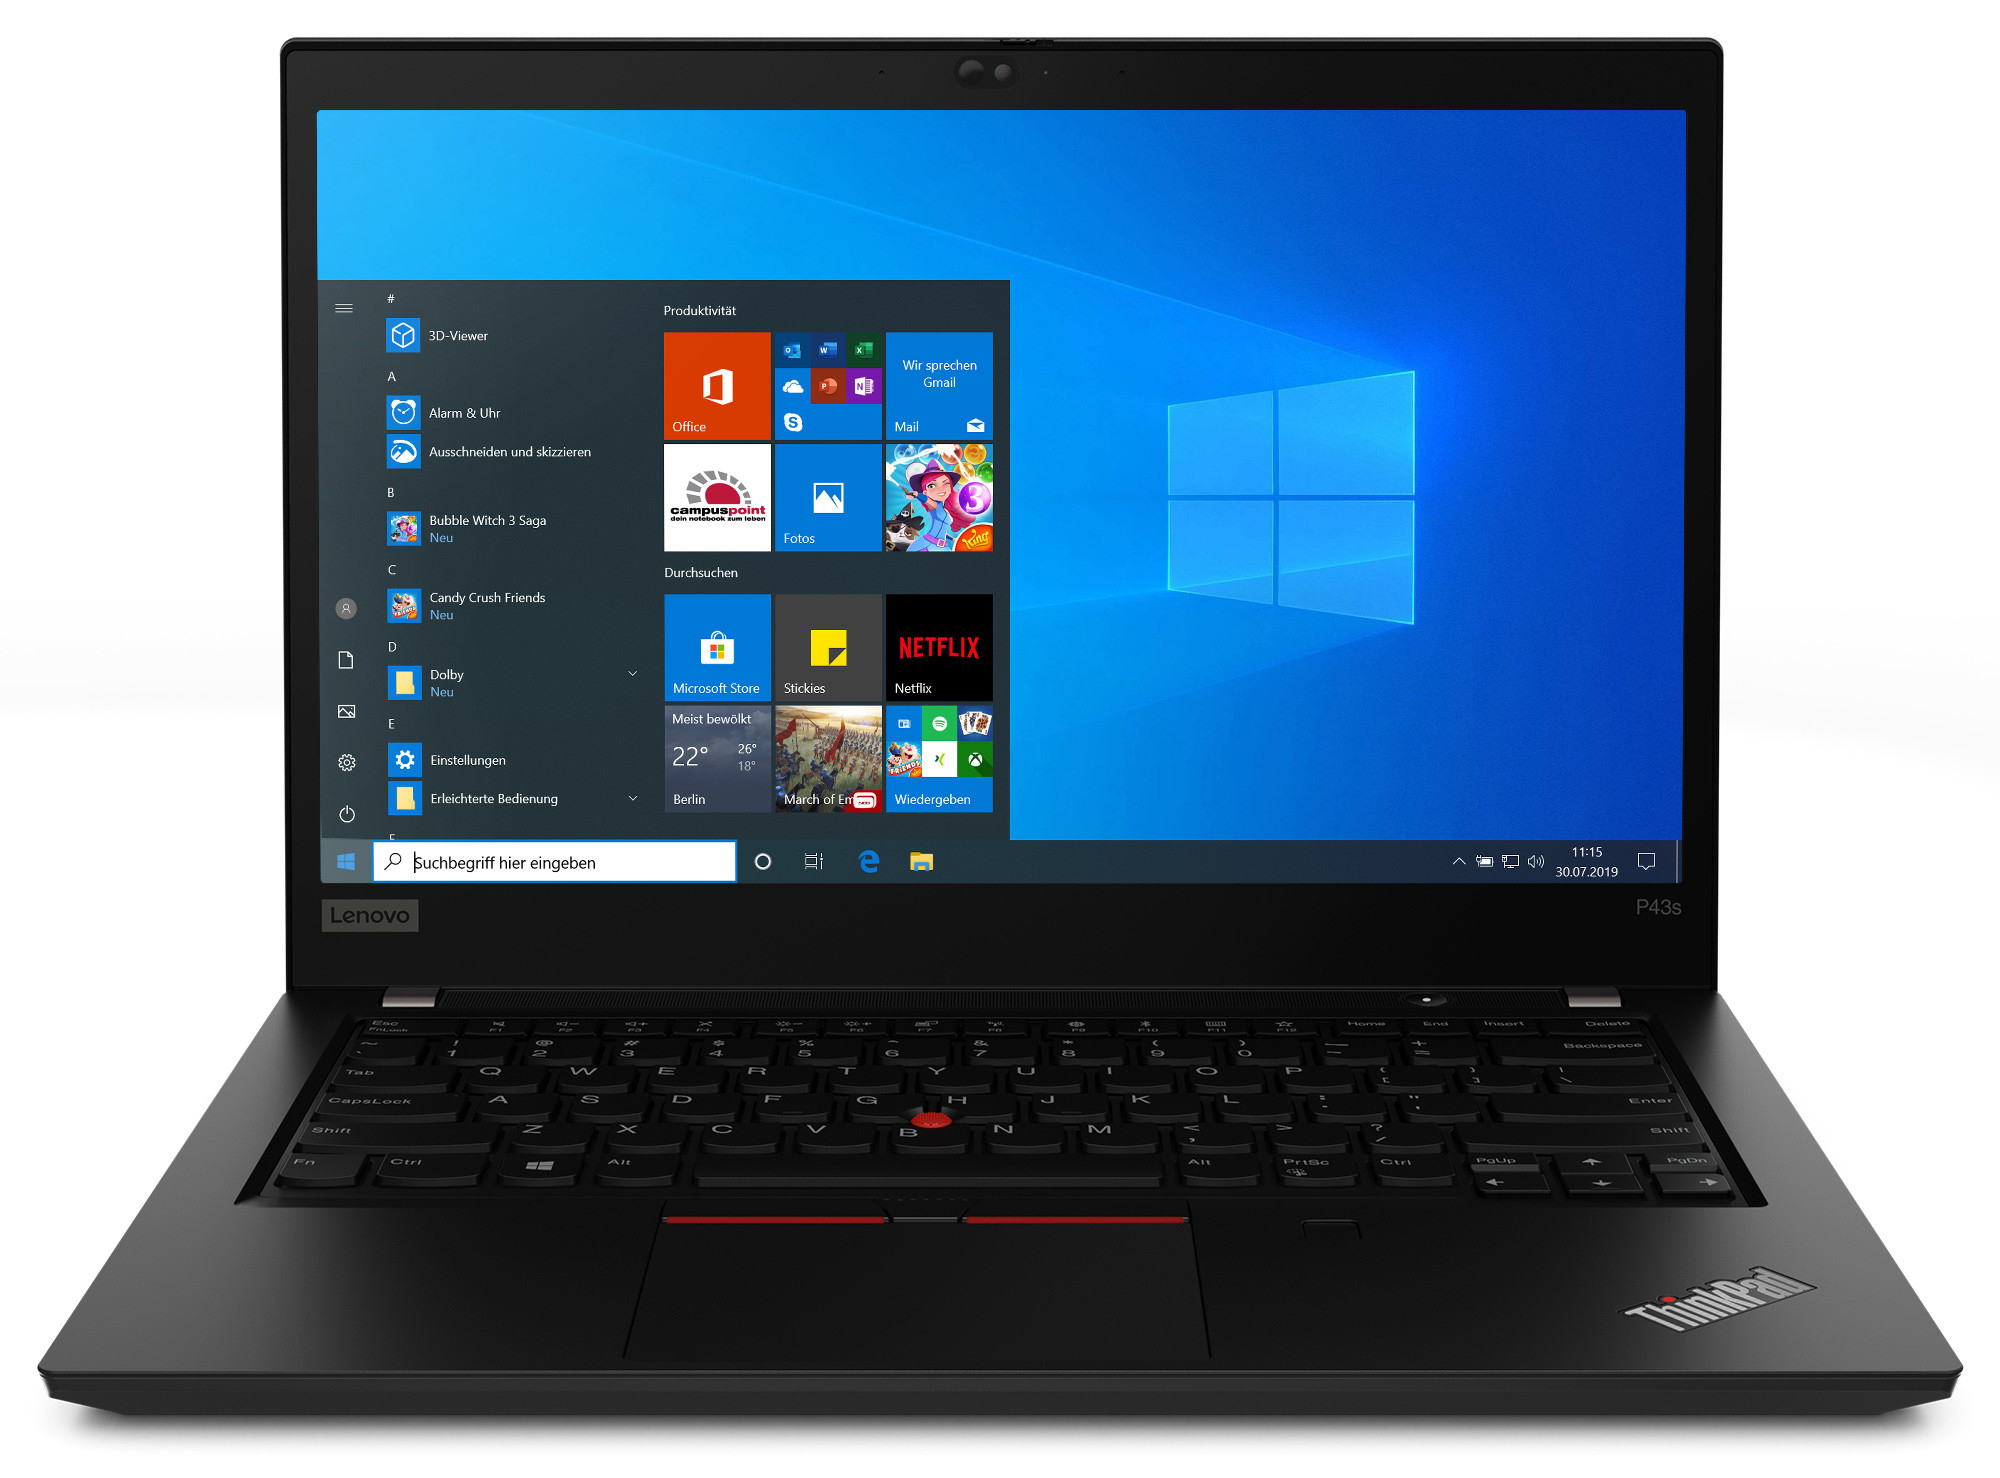
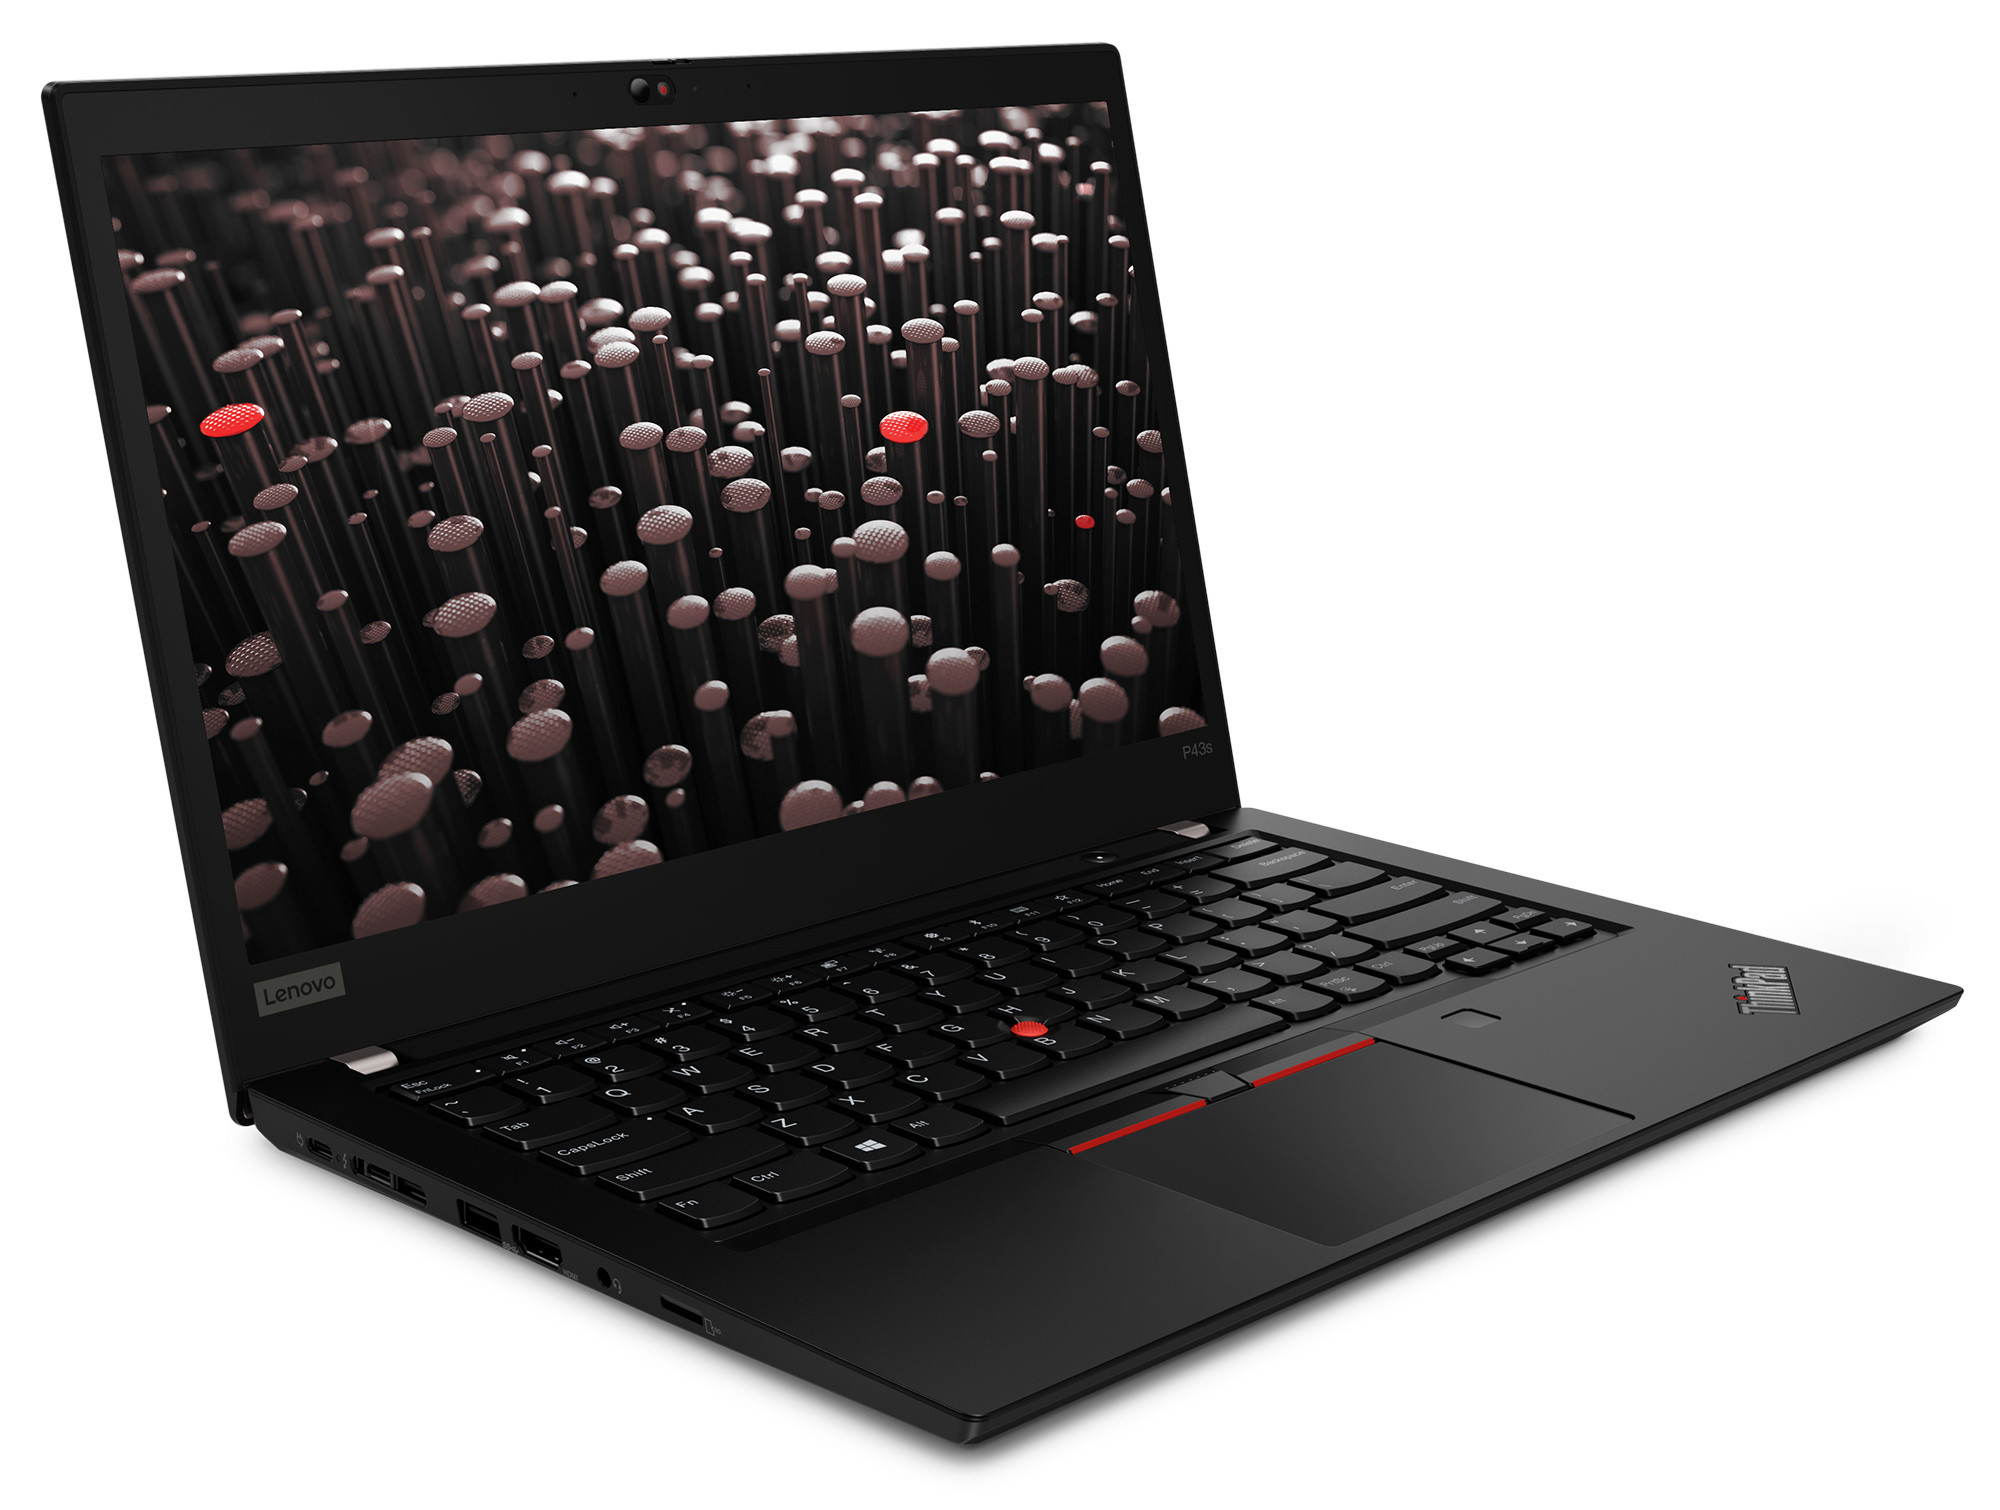
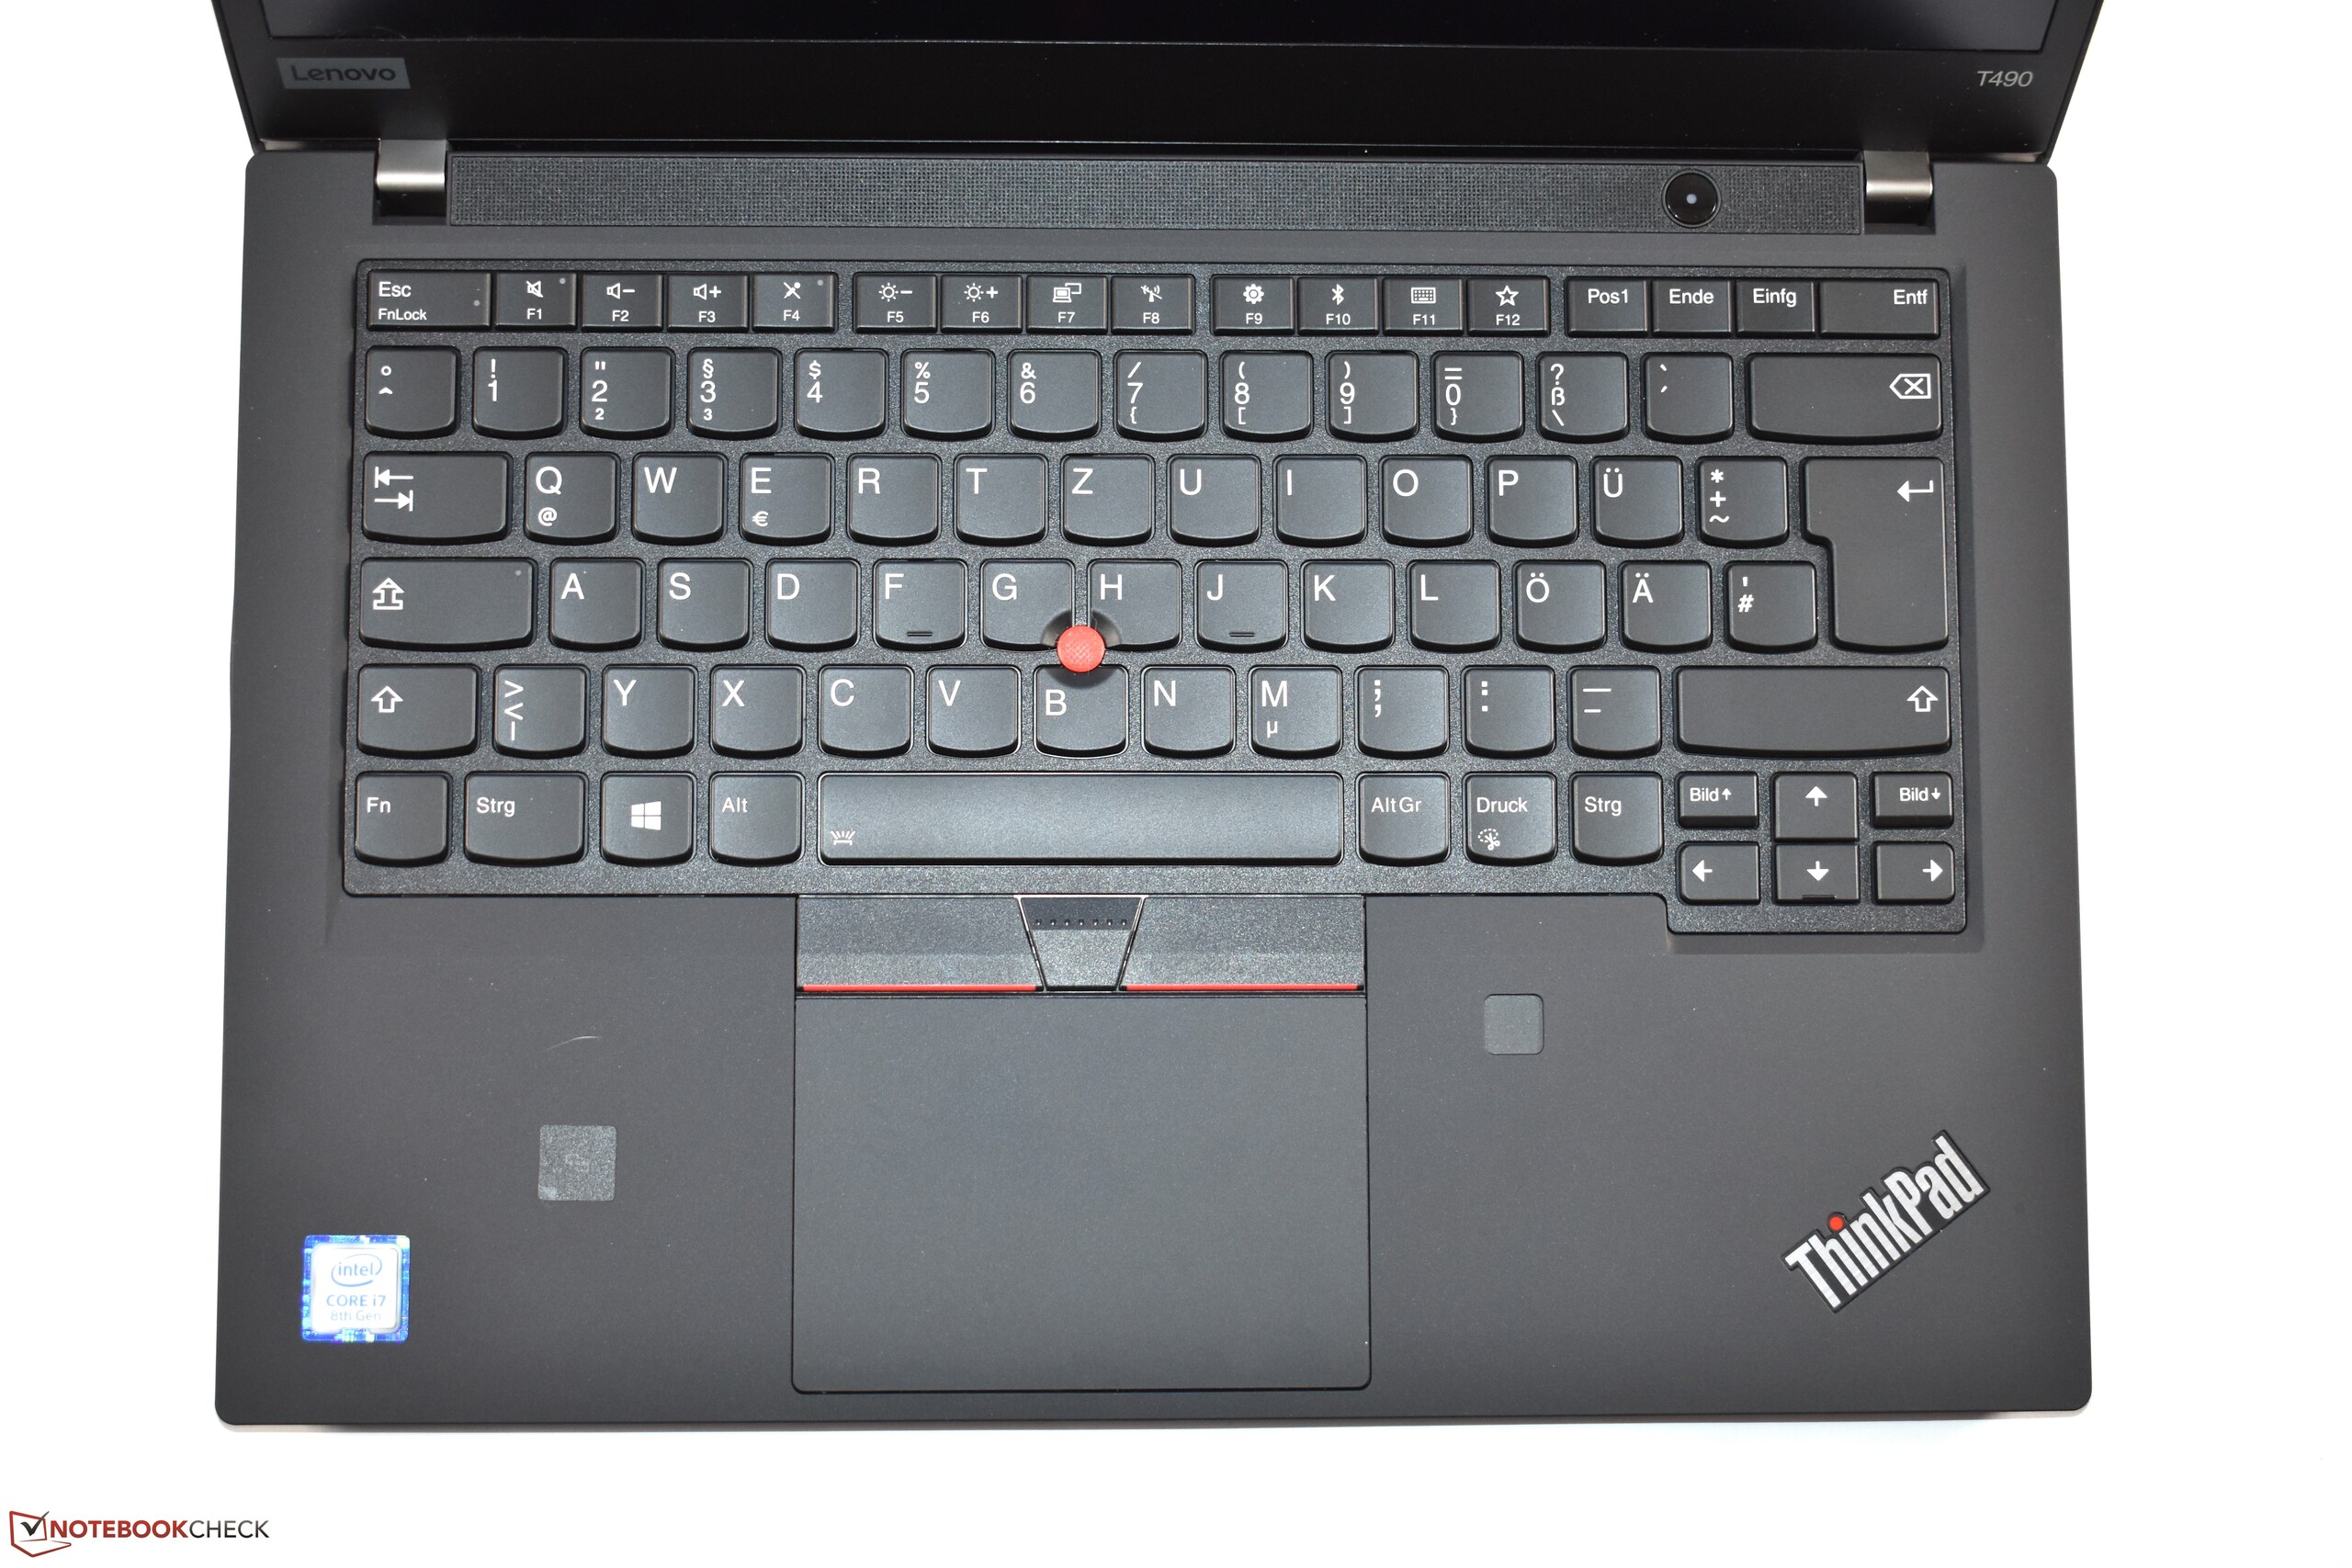
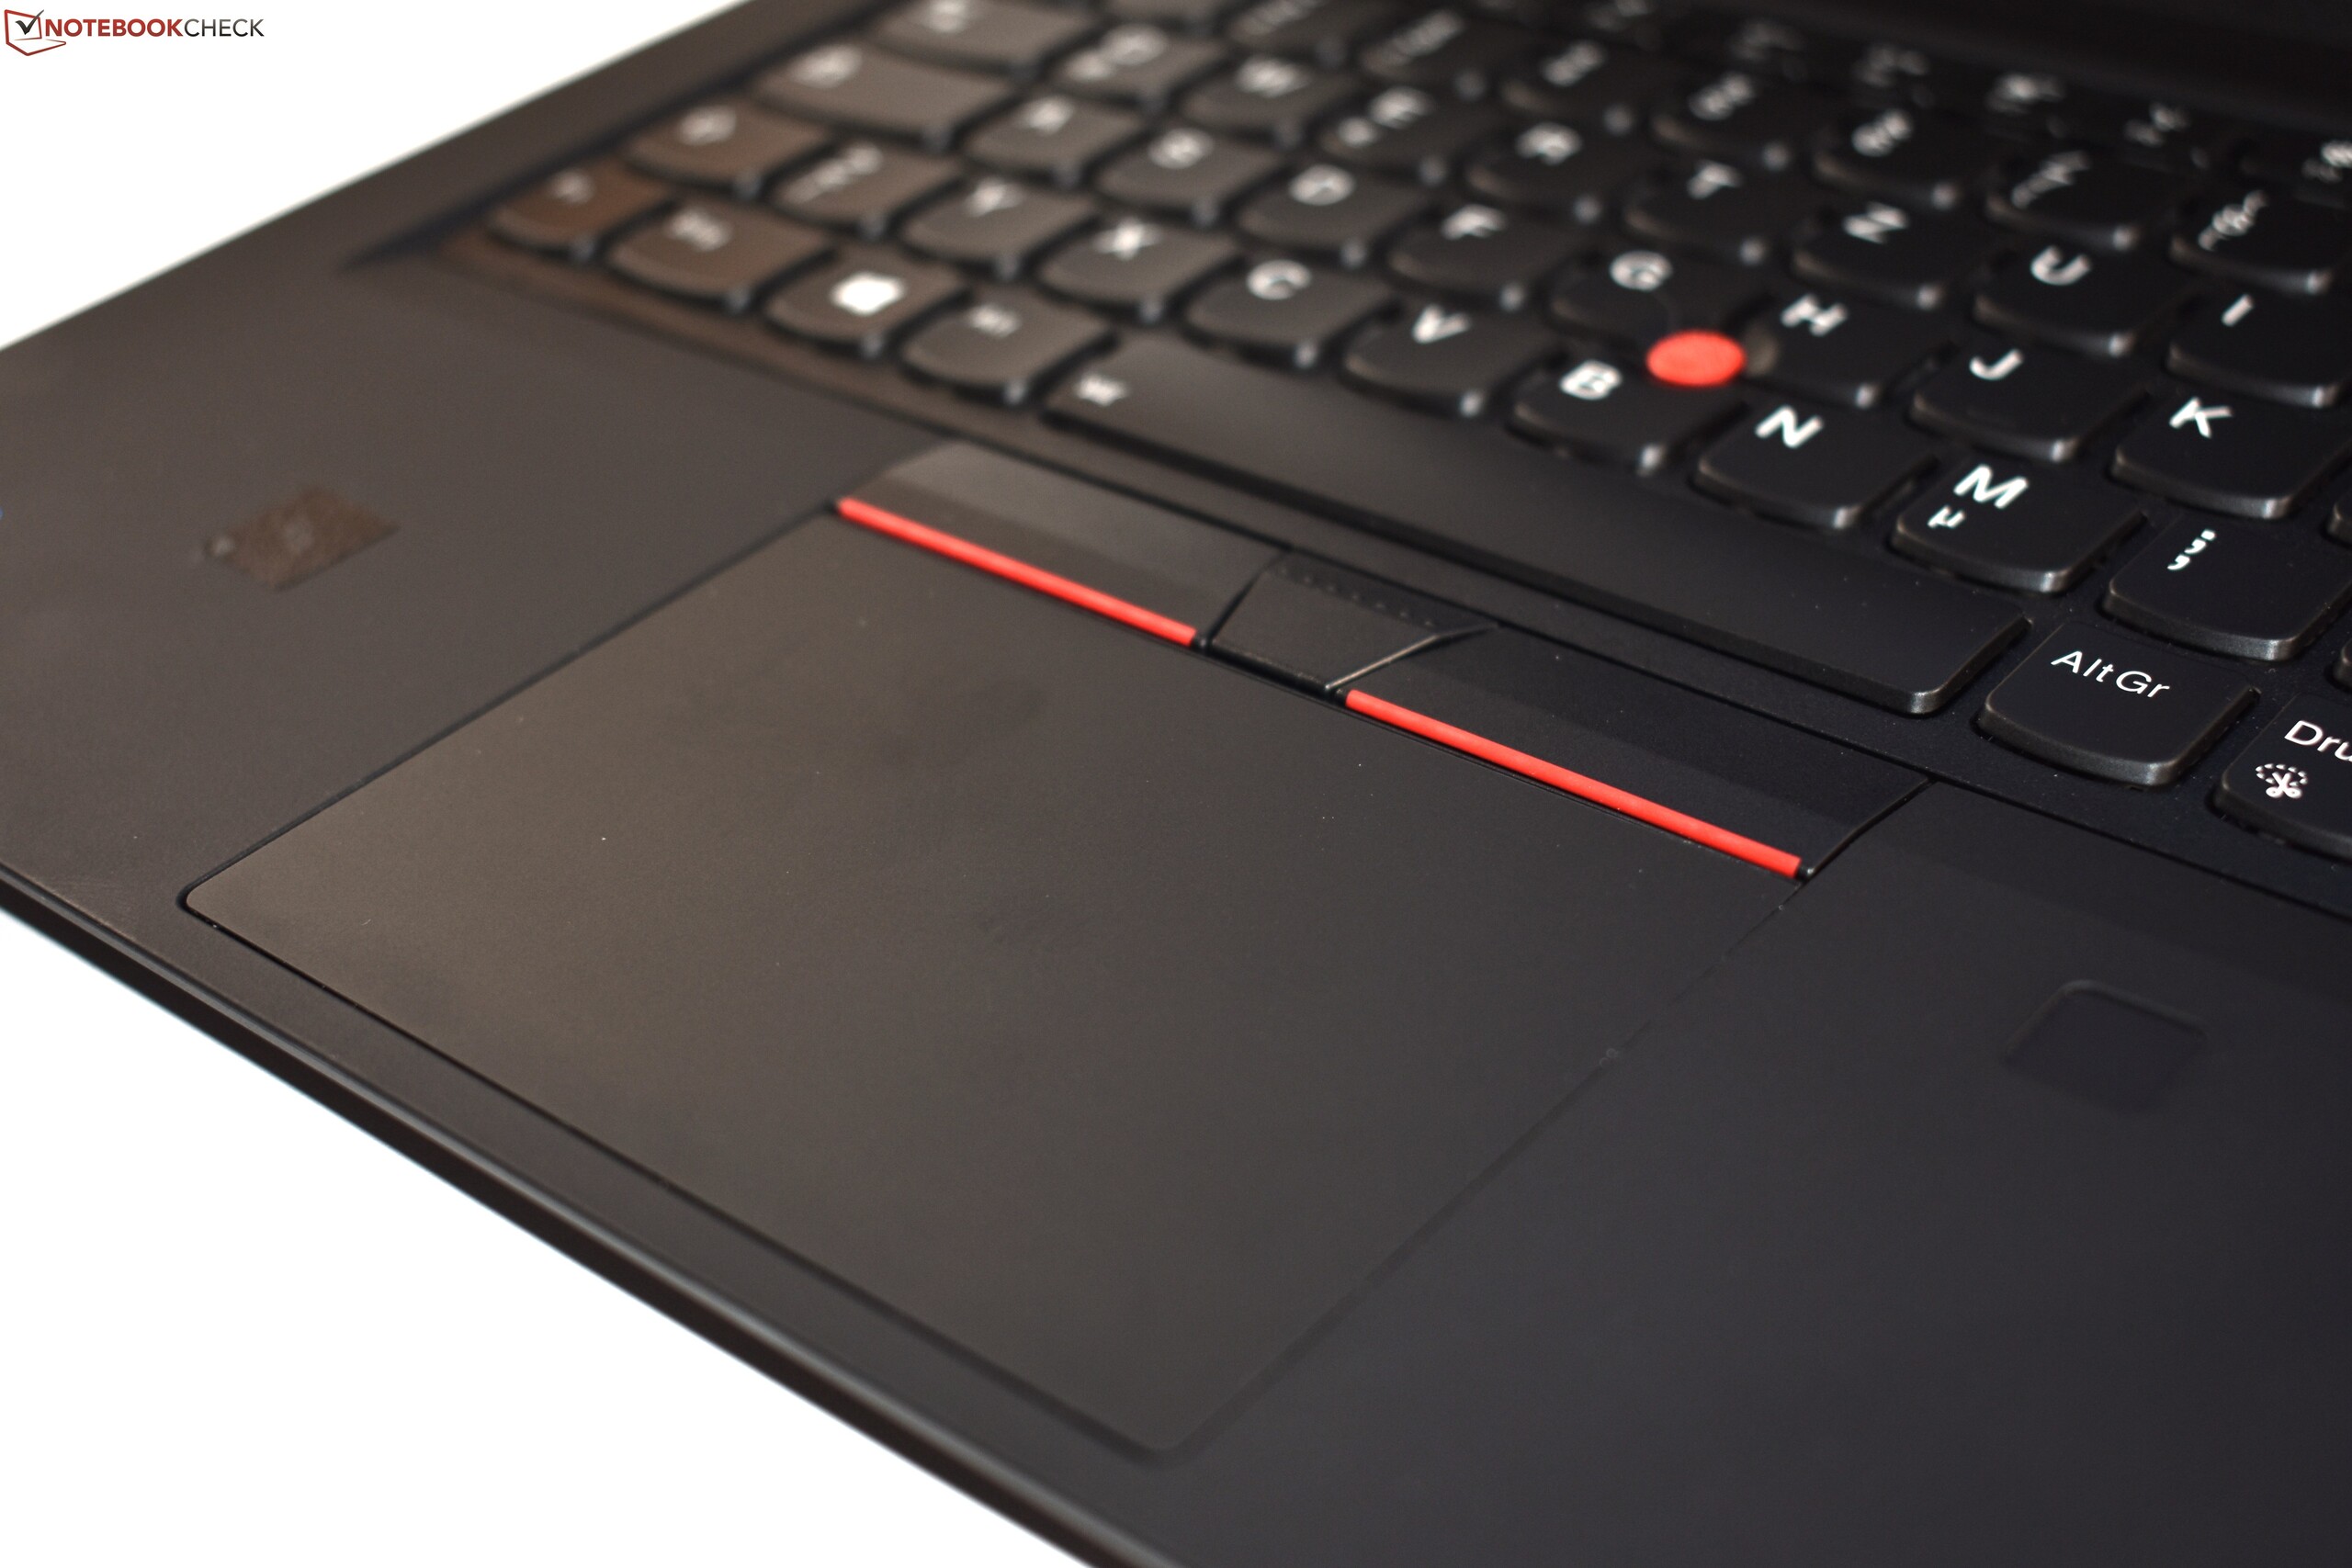
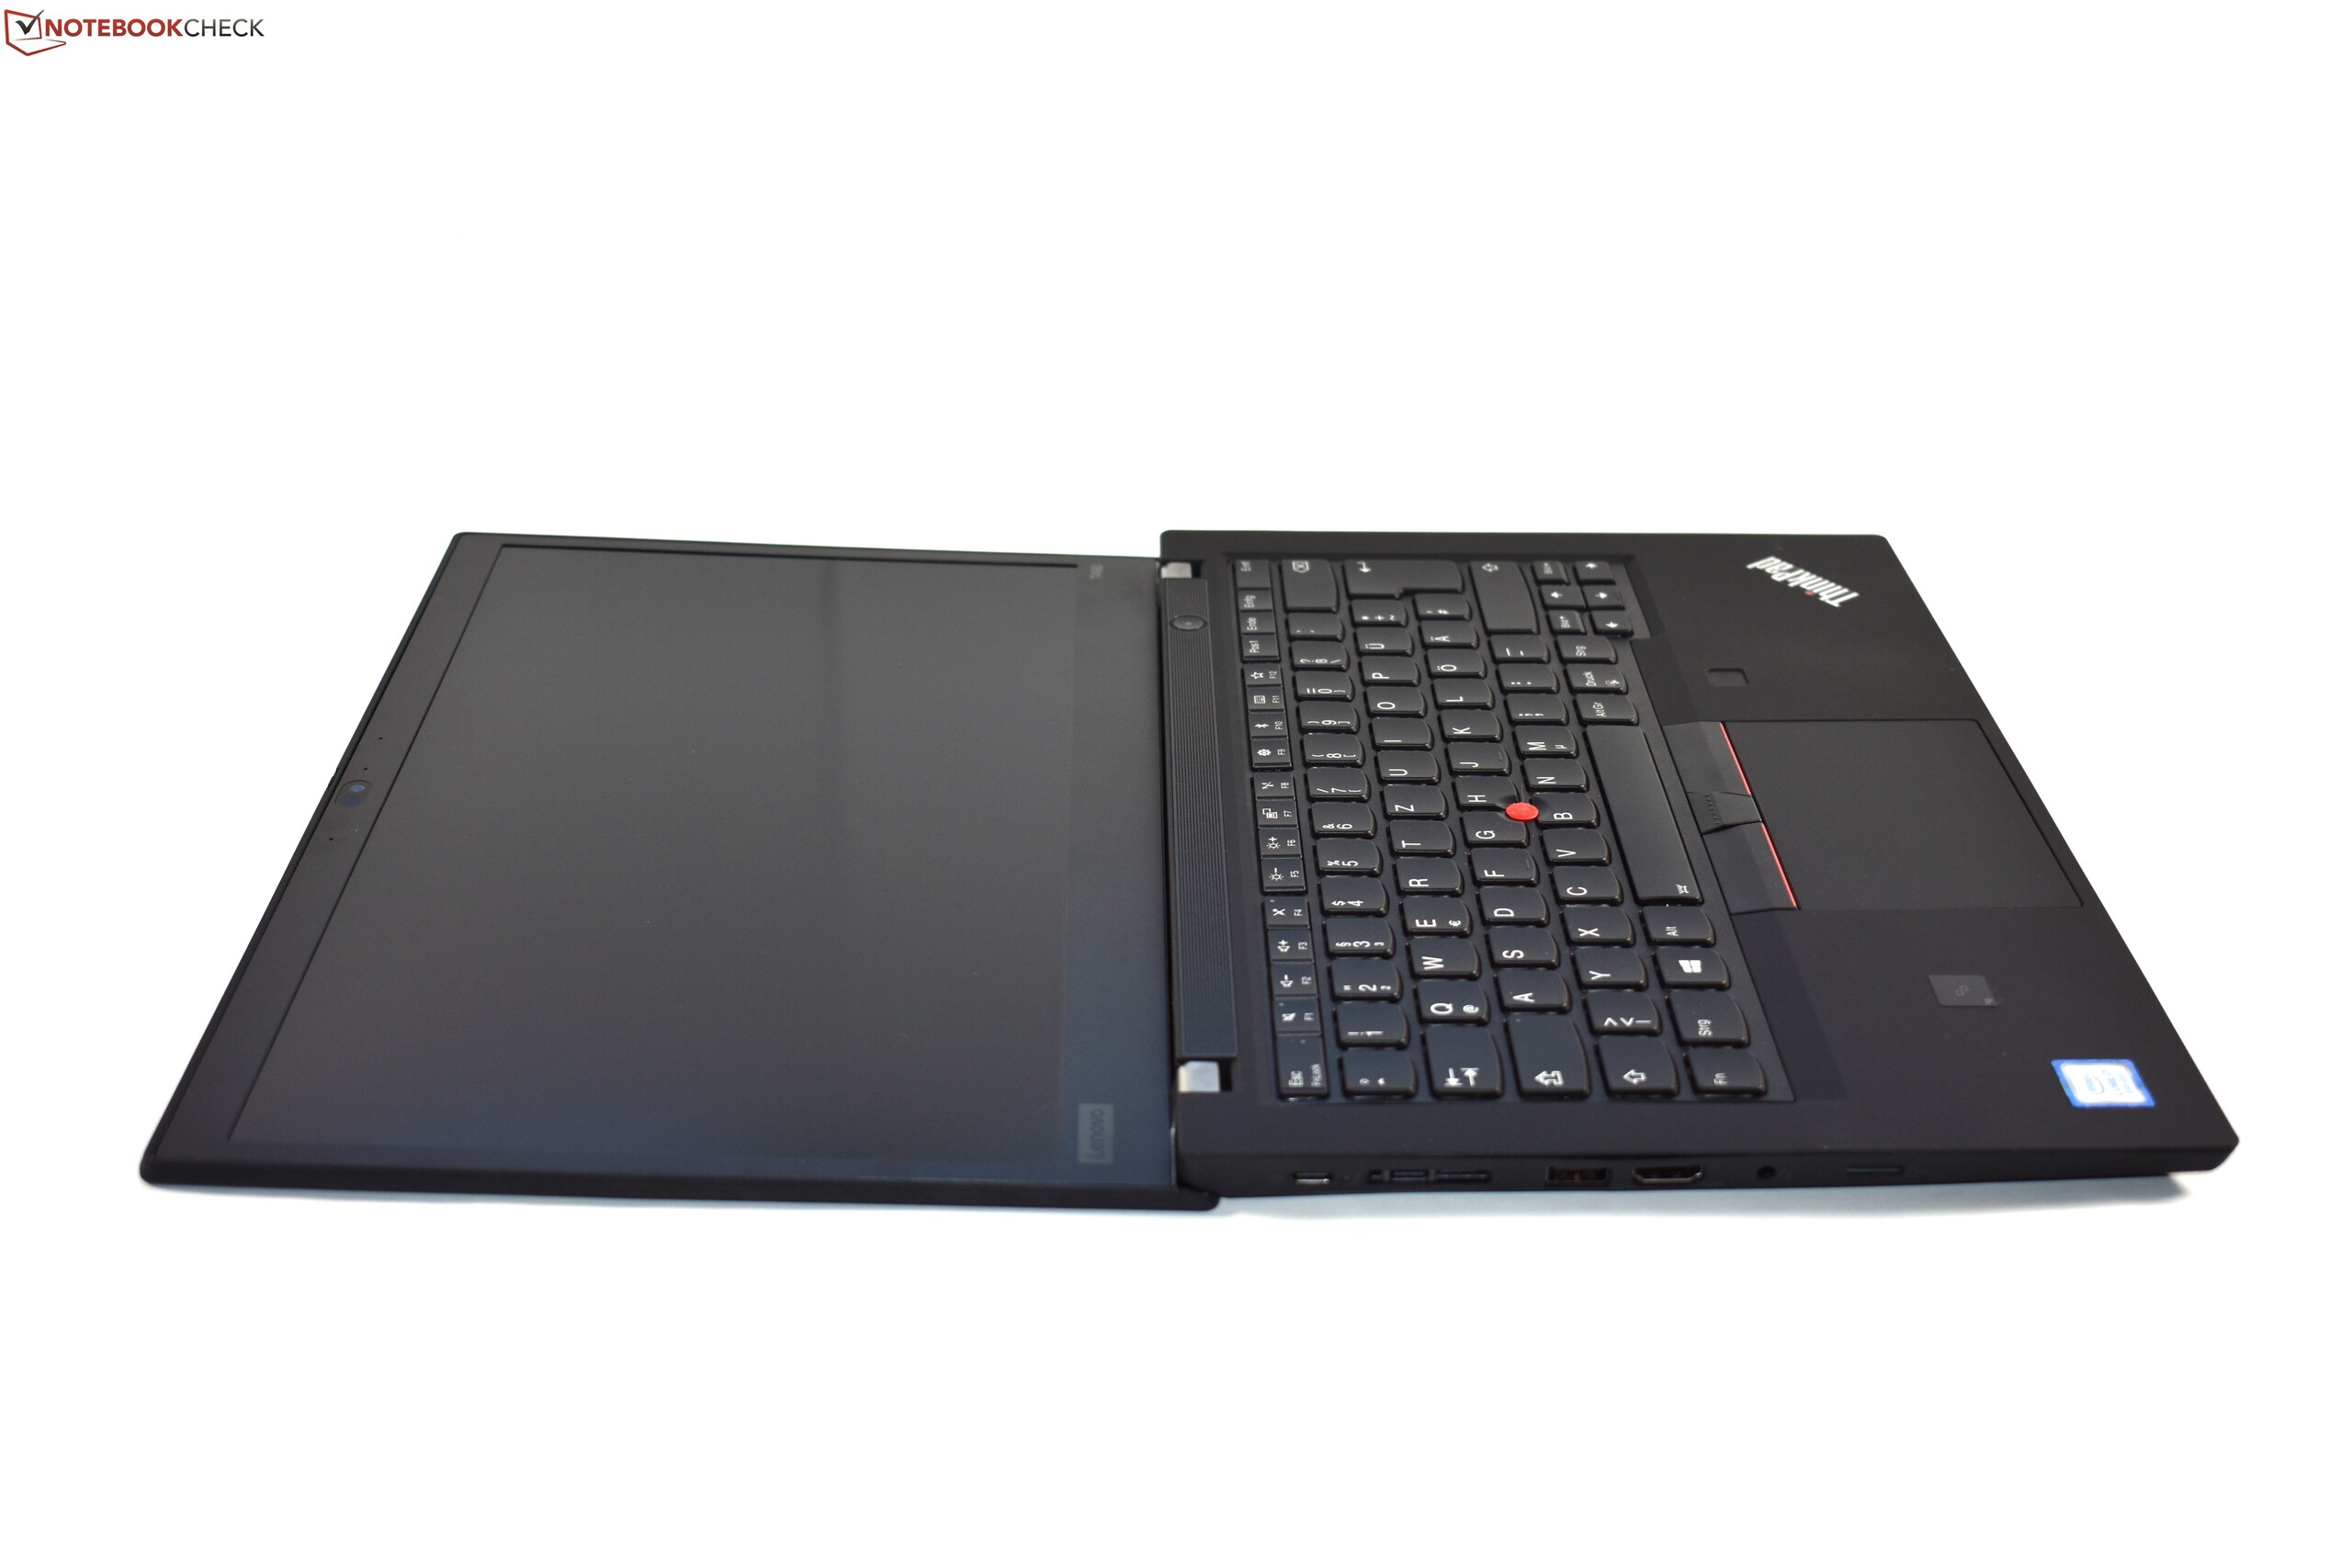
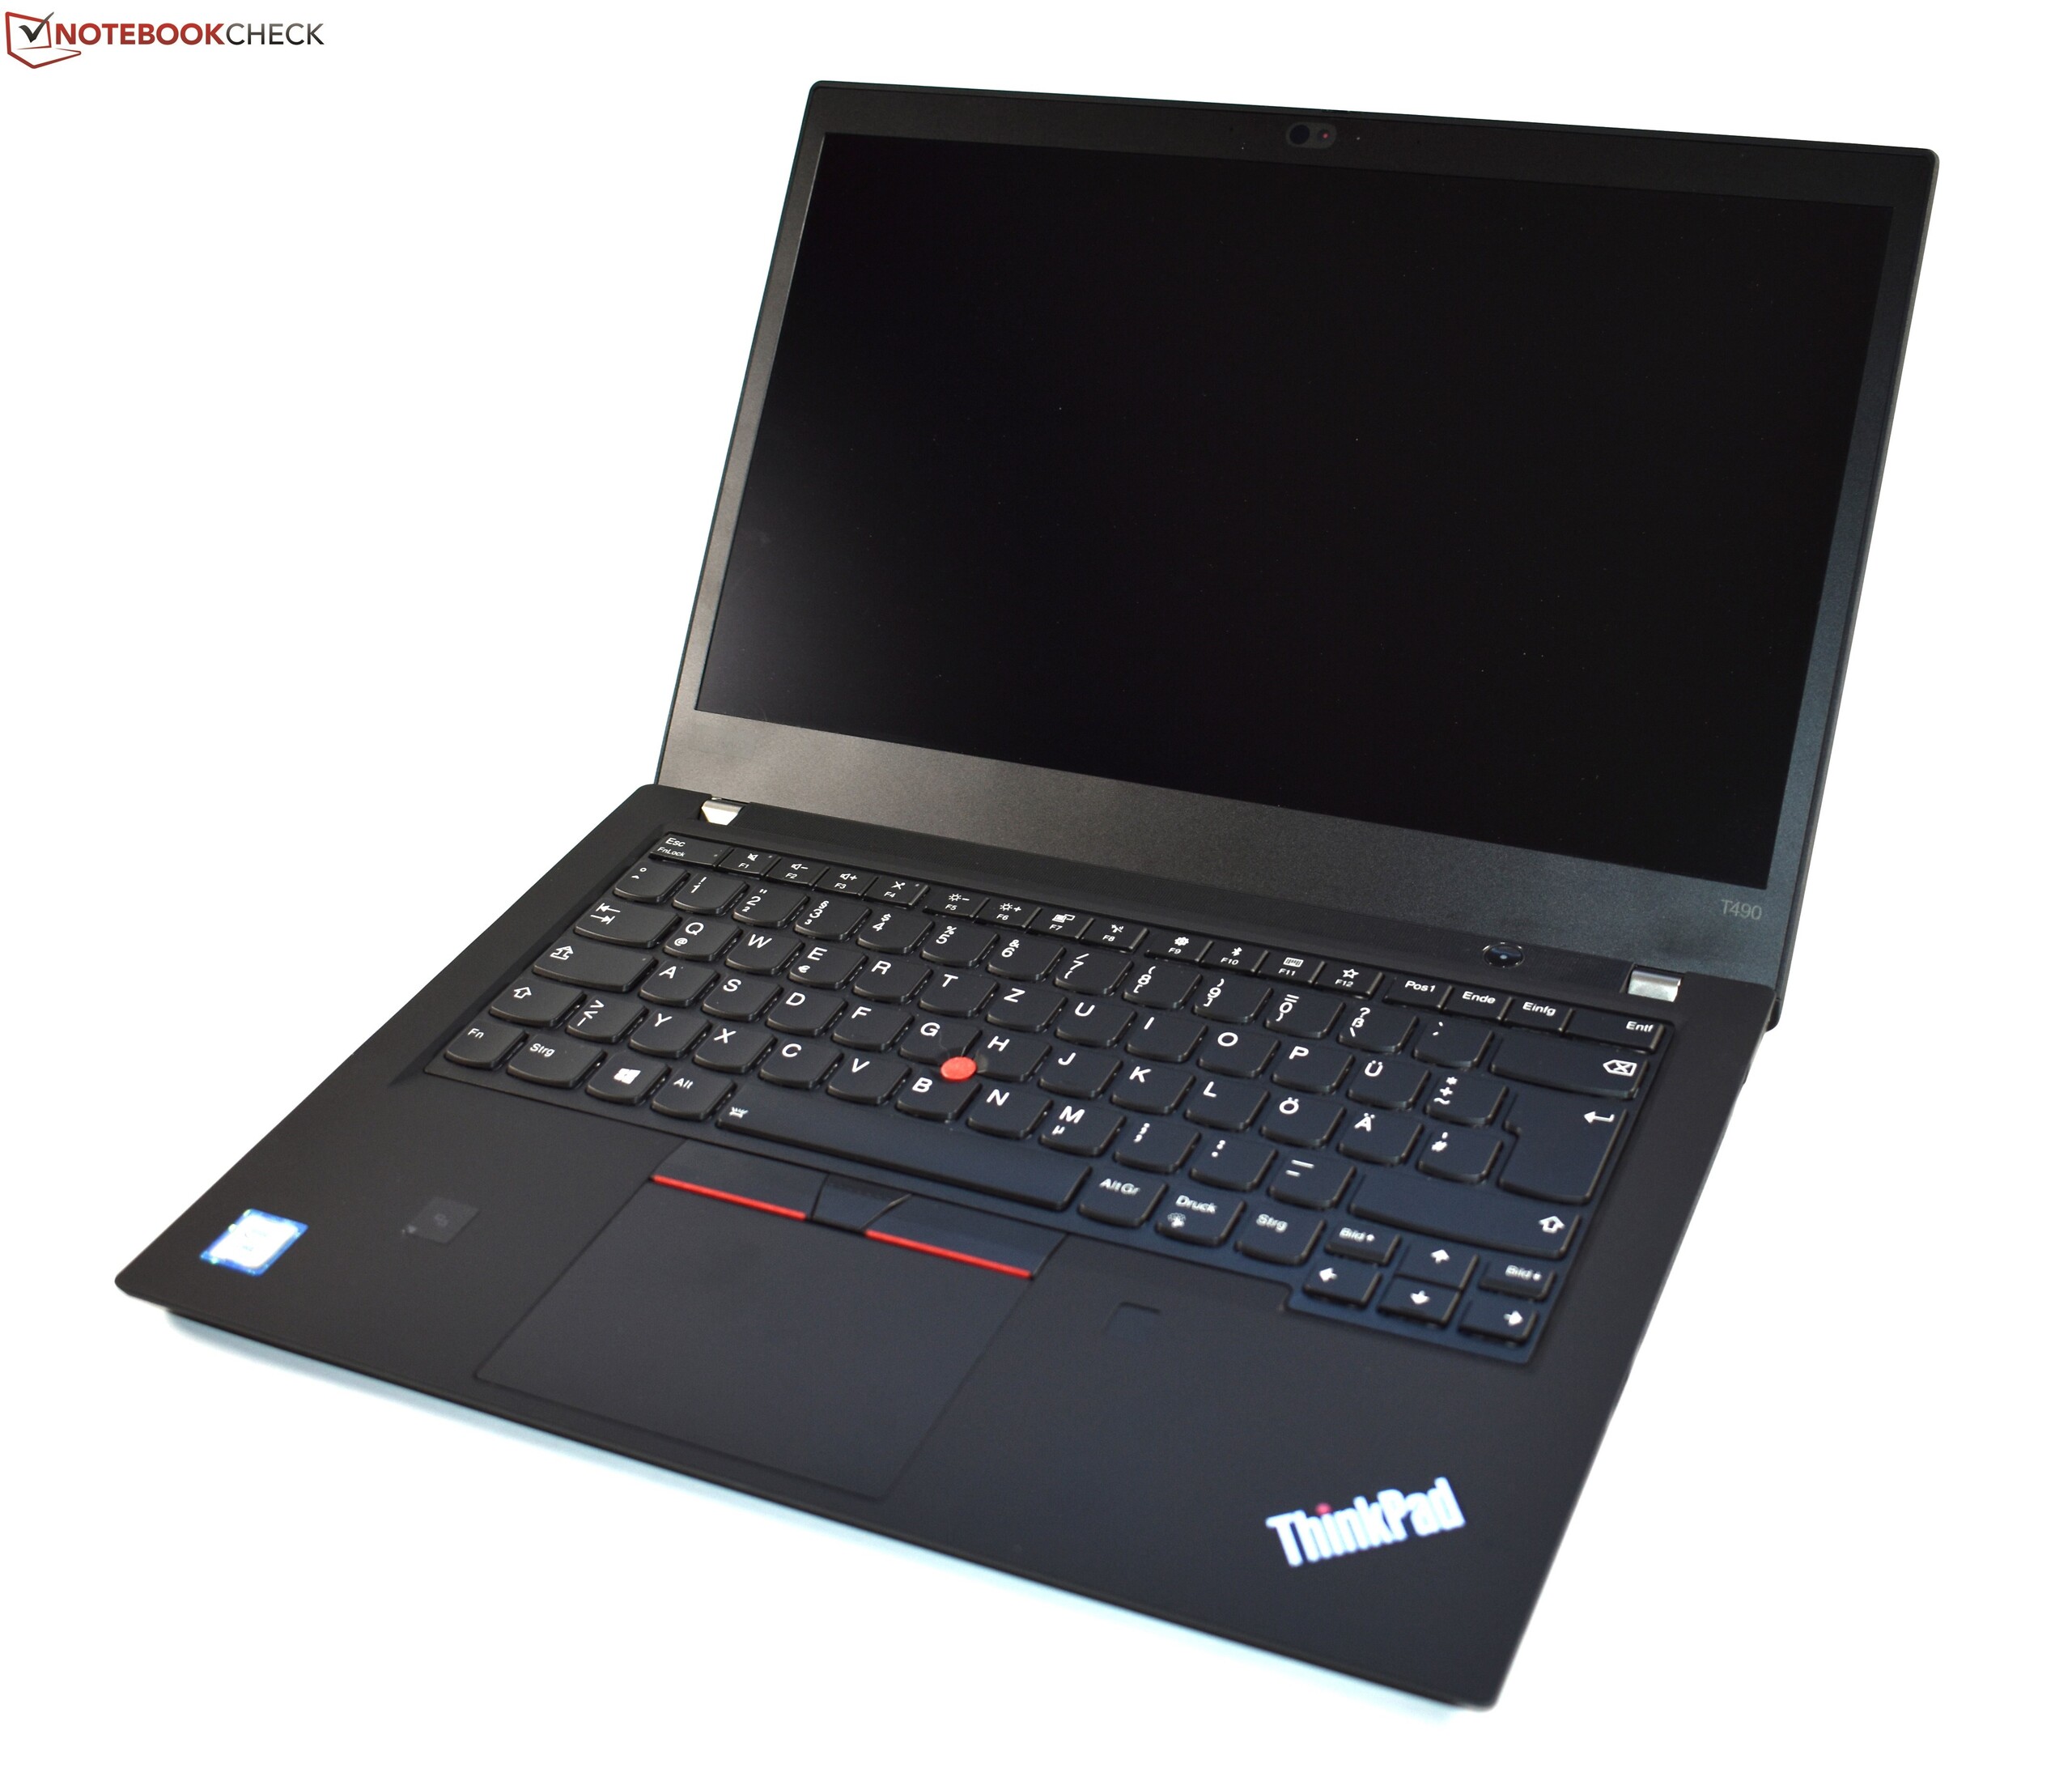
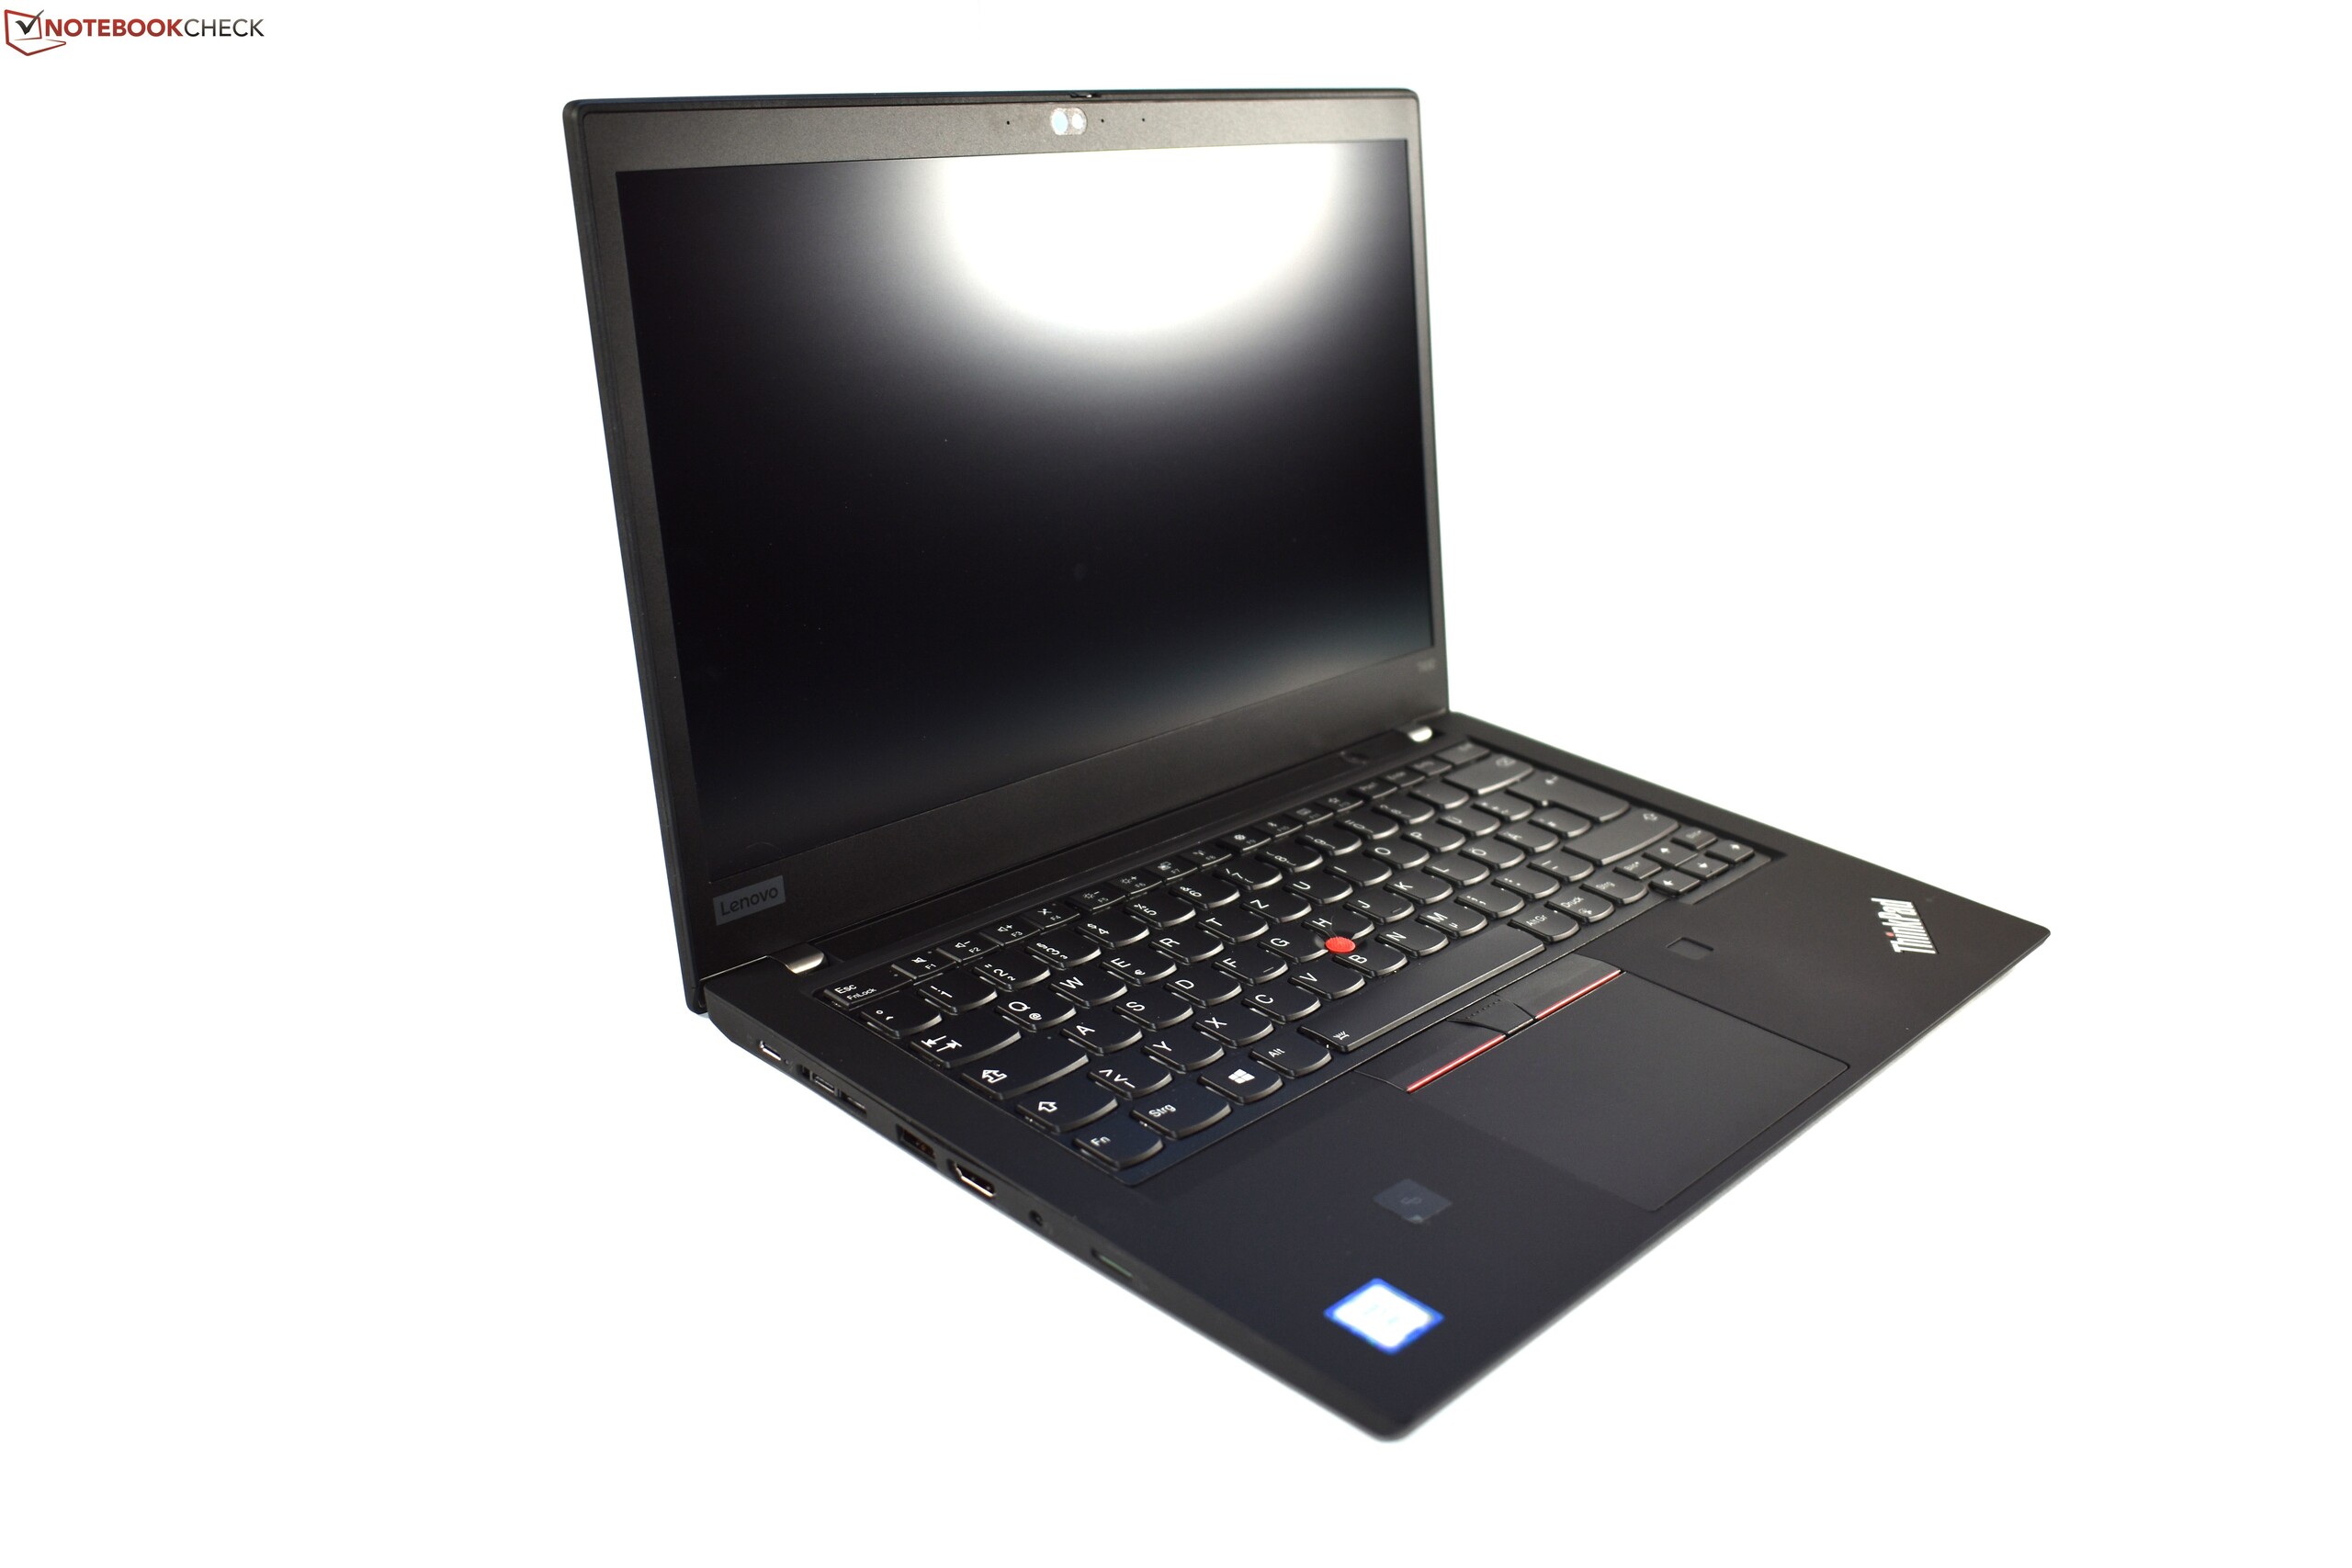
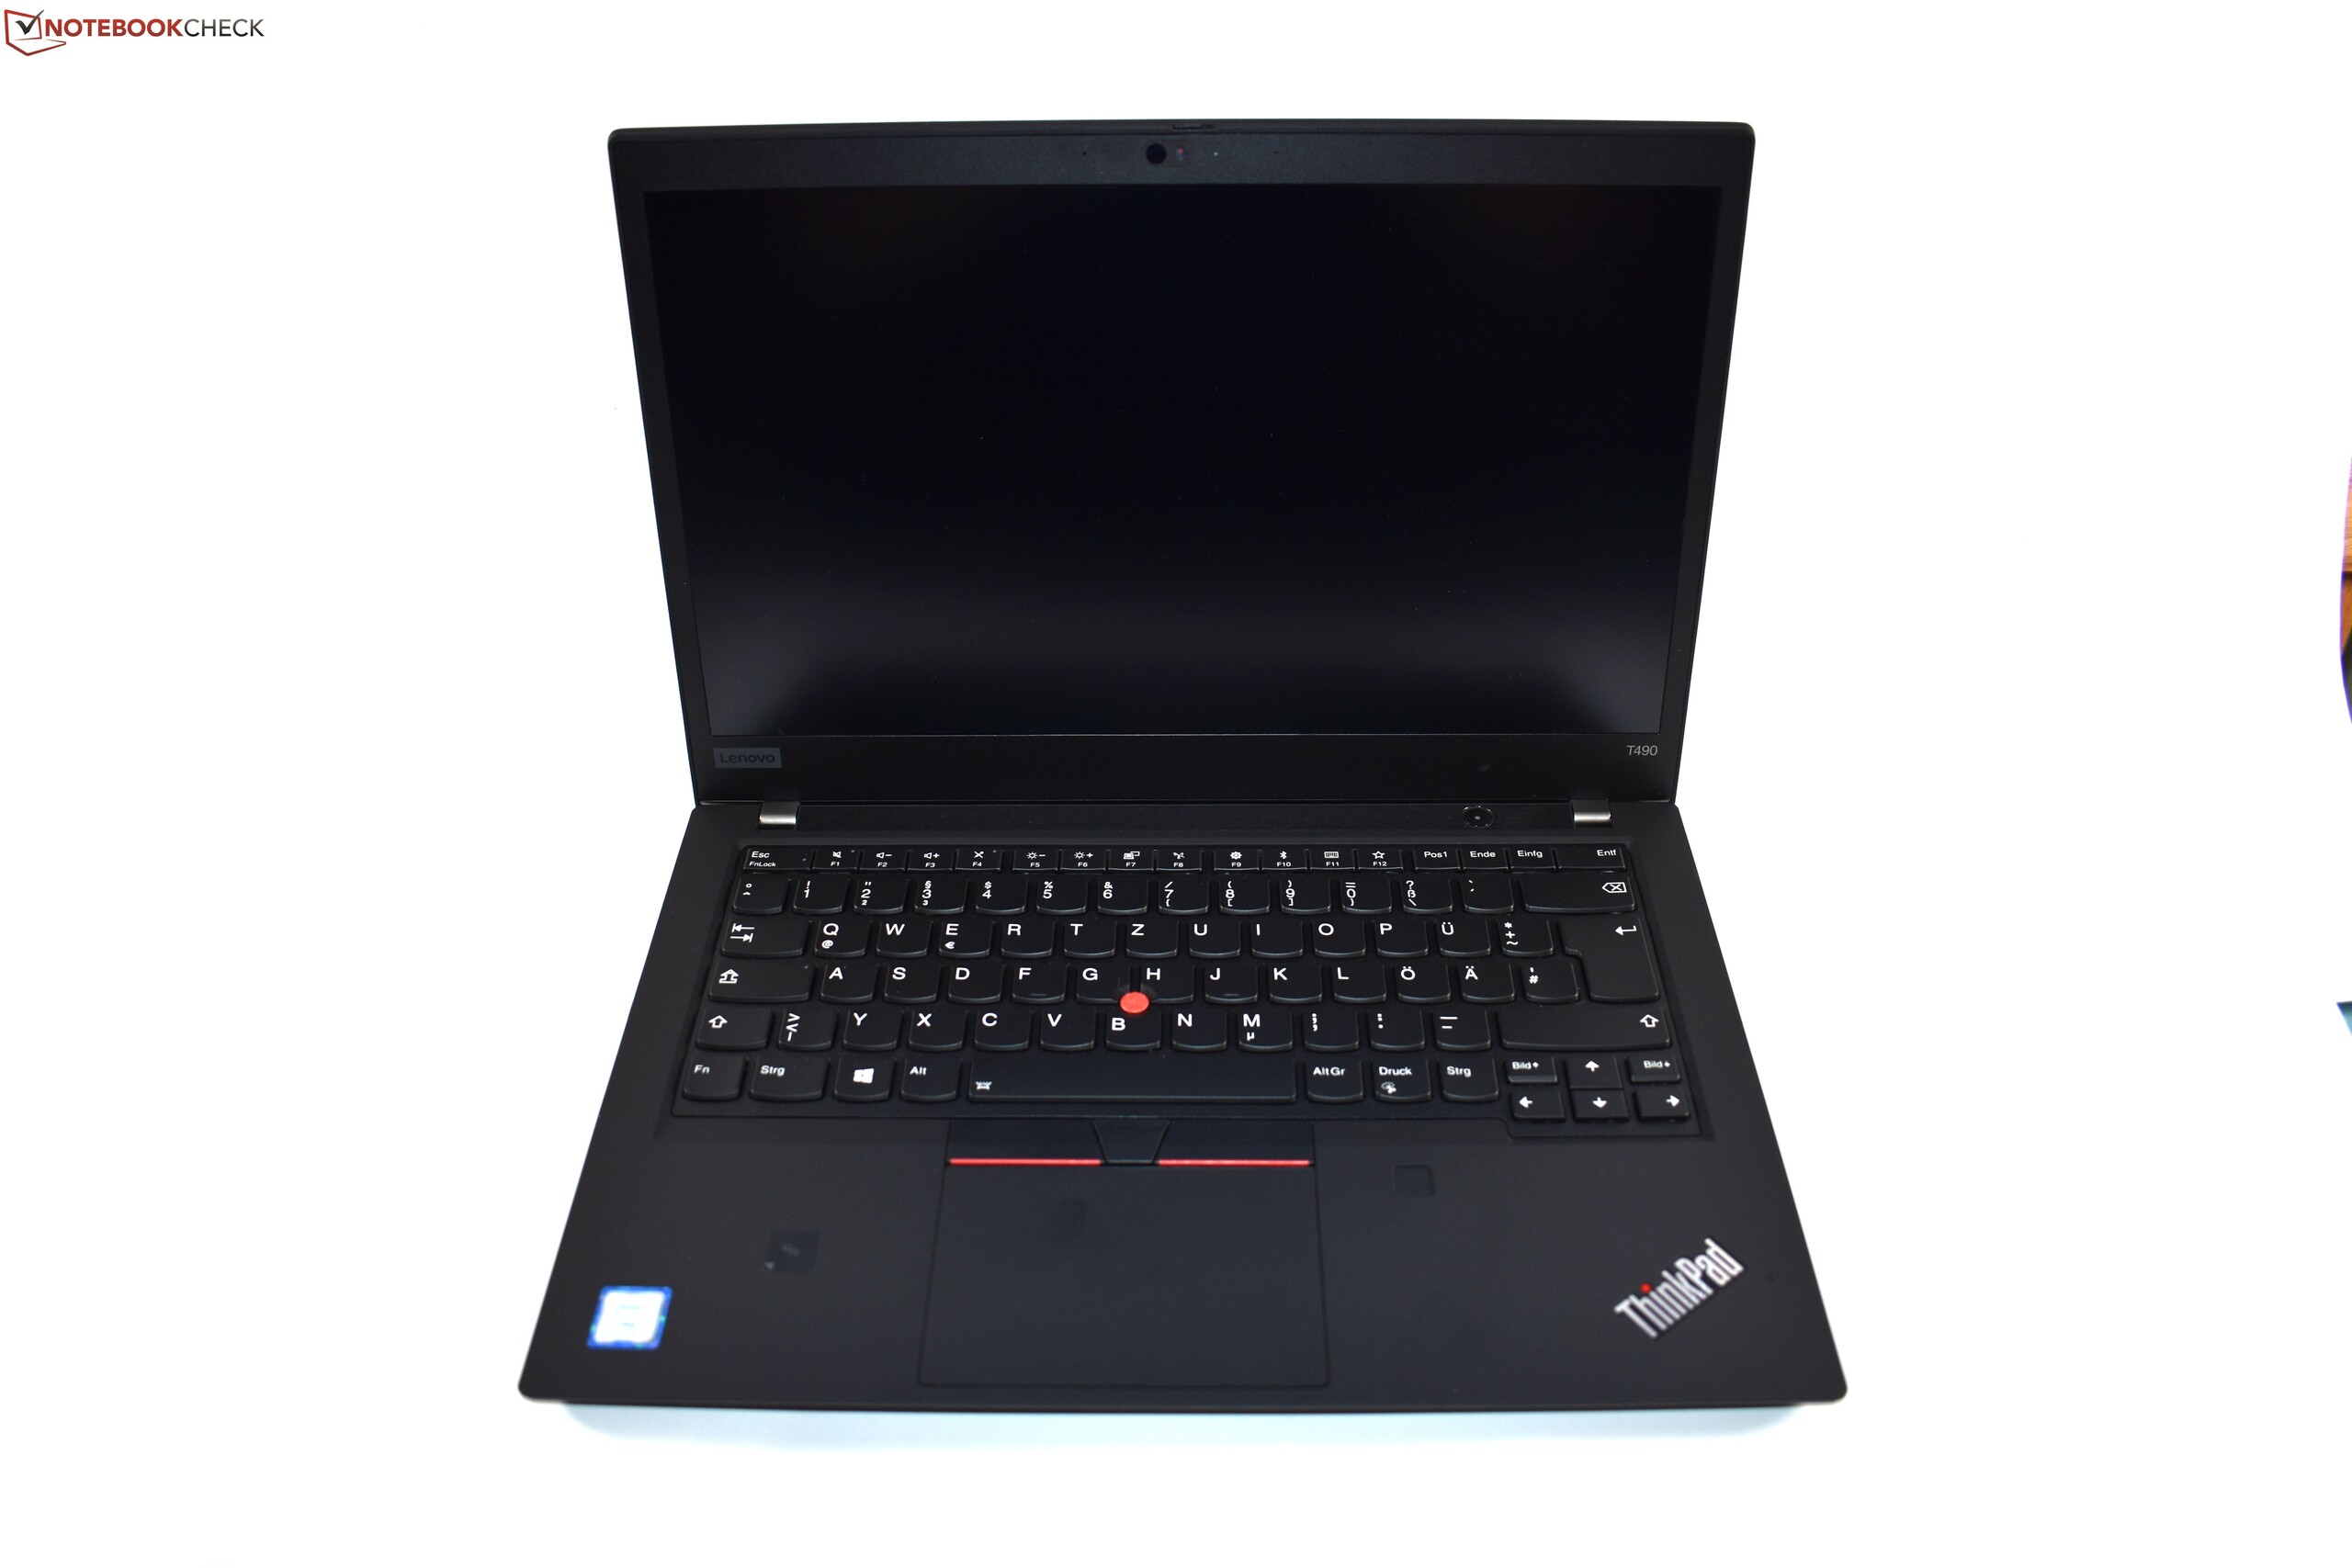
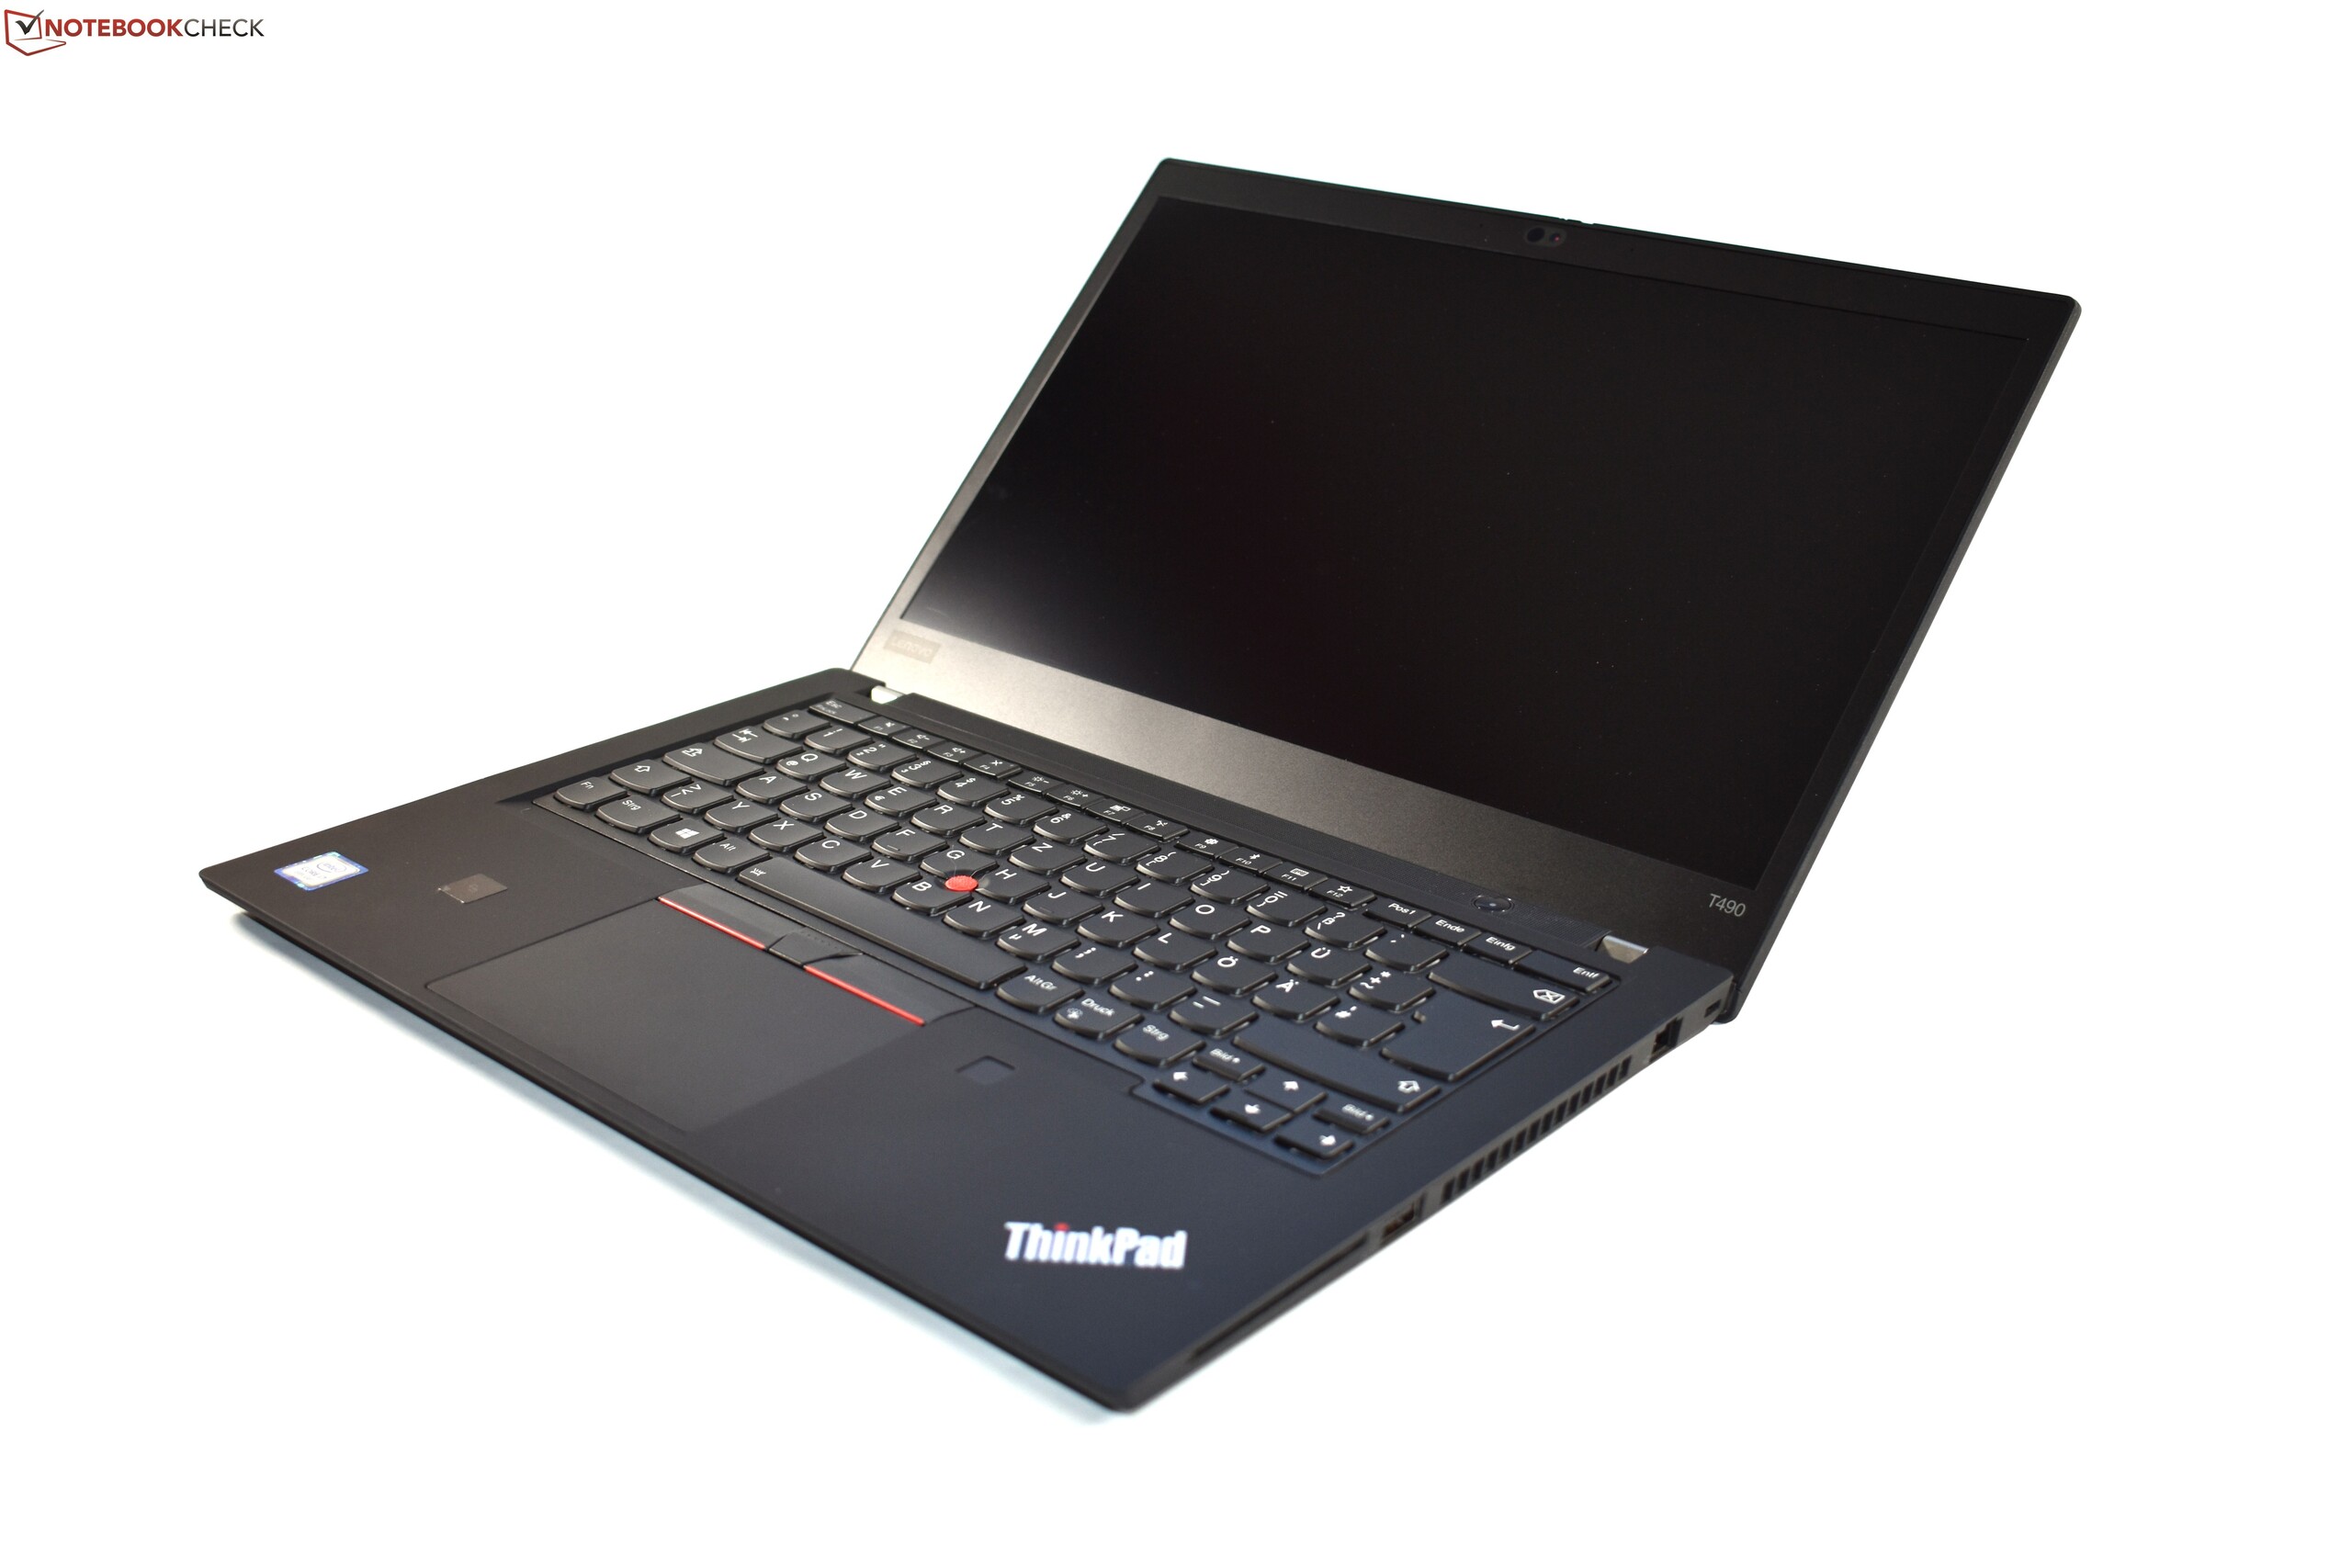
Os P43s não apenas herda a grande carcaça do modelo irmão ThinkPad T490, mas também possui o excelentes teclado (retroiluminado). Infelizmente, nosso dispositivo de teste não vem com o painel IGZO encontrado no ThinkPad T490 que analisamos. No entanto, o painel está disponível na série P43s. O último teria sido a melhor escolha óbvia. A tela existente é uma das fraquezas do P43s. Ela fornece um brilho máximo baixo. Além disso, a cobertura do espaço de cores não causa entusiasmo. Ambas as deficiências não deveriam ser encontradas na faixa de preço do P43s.
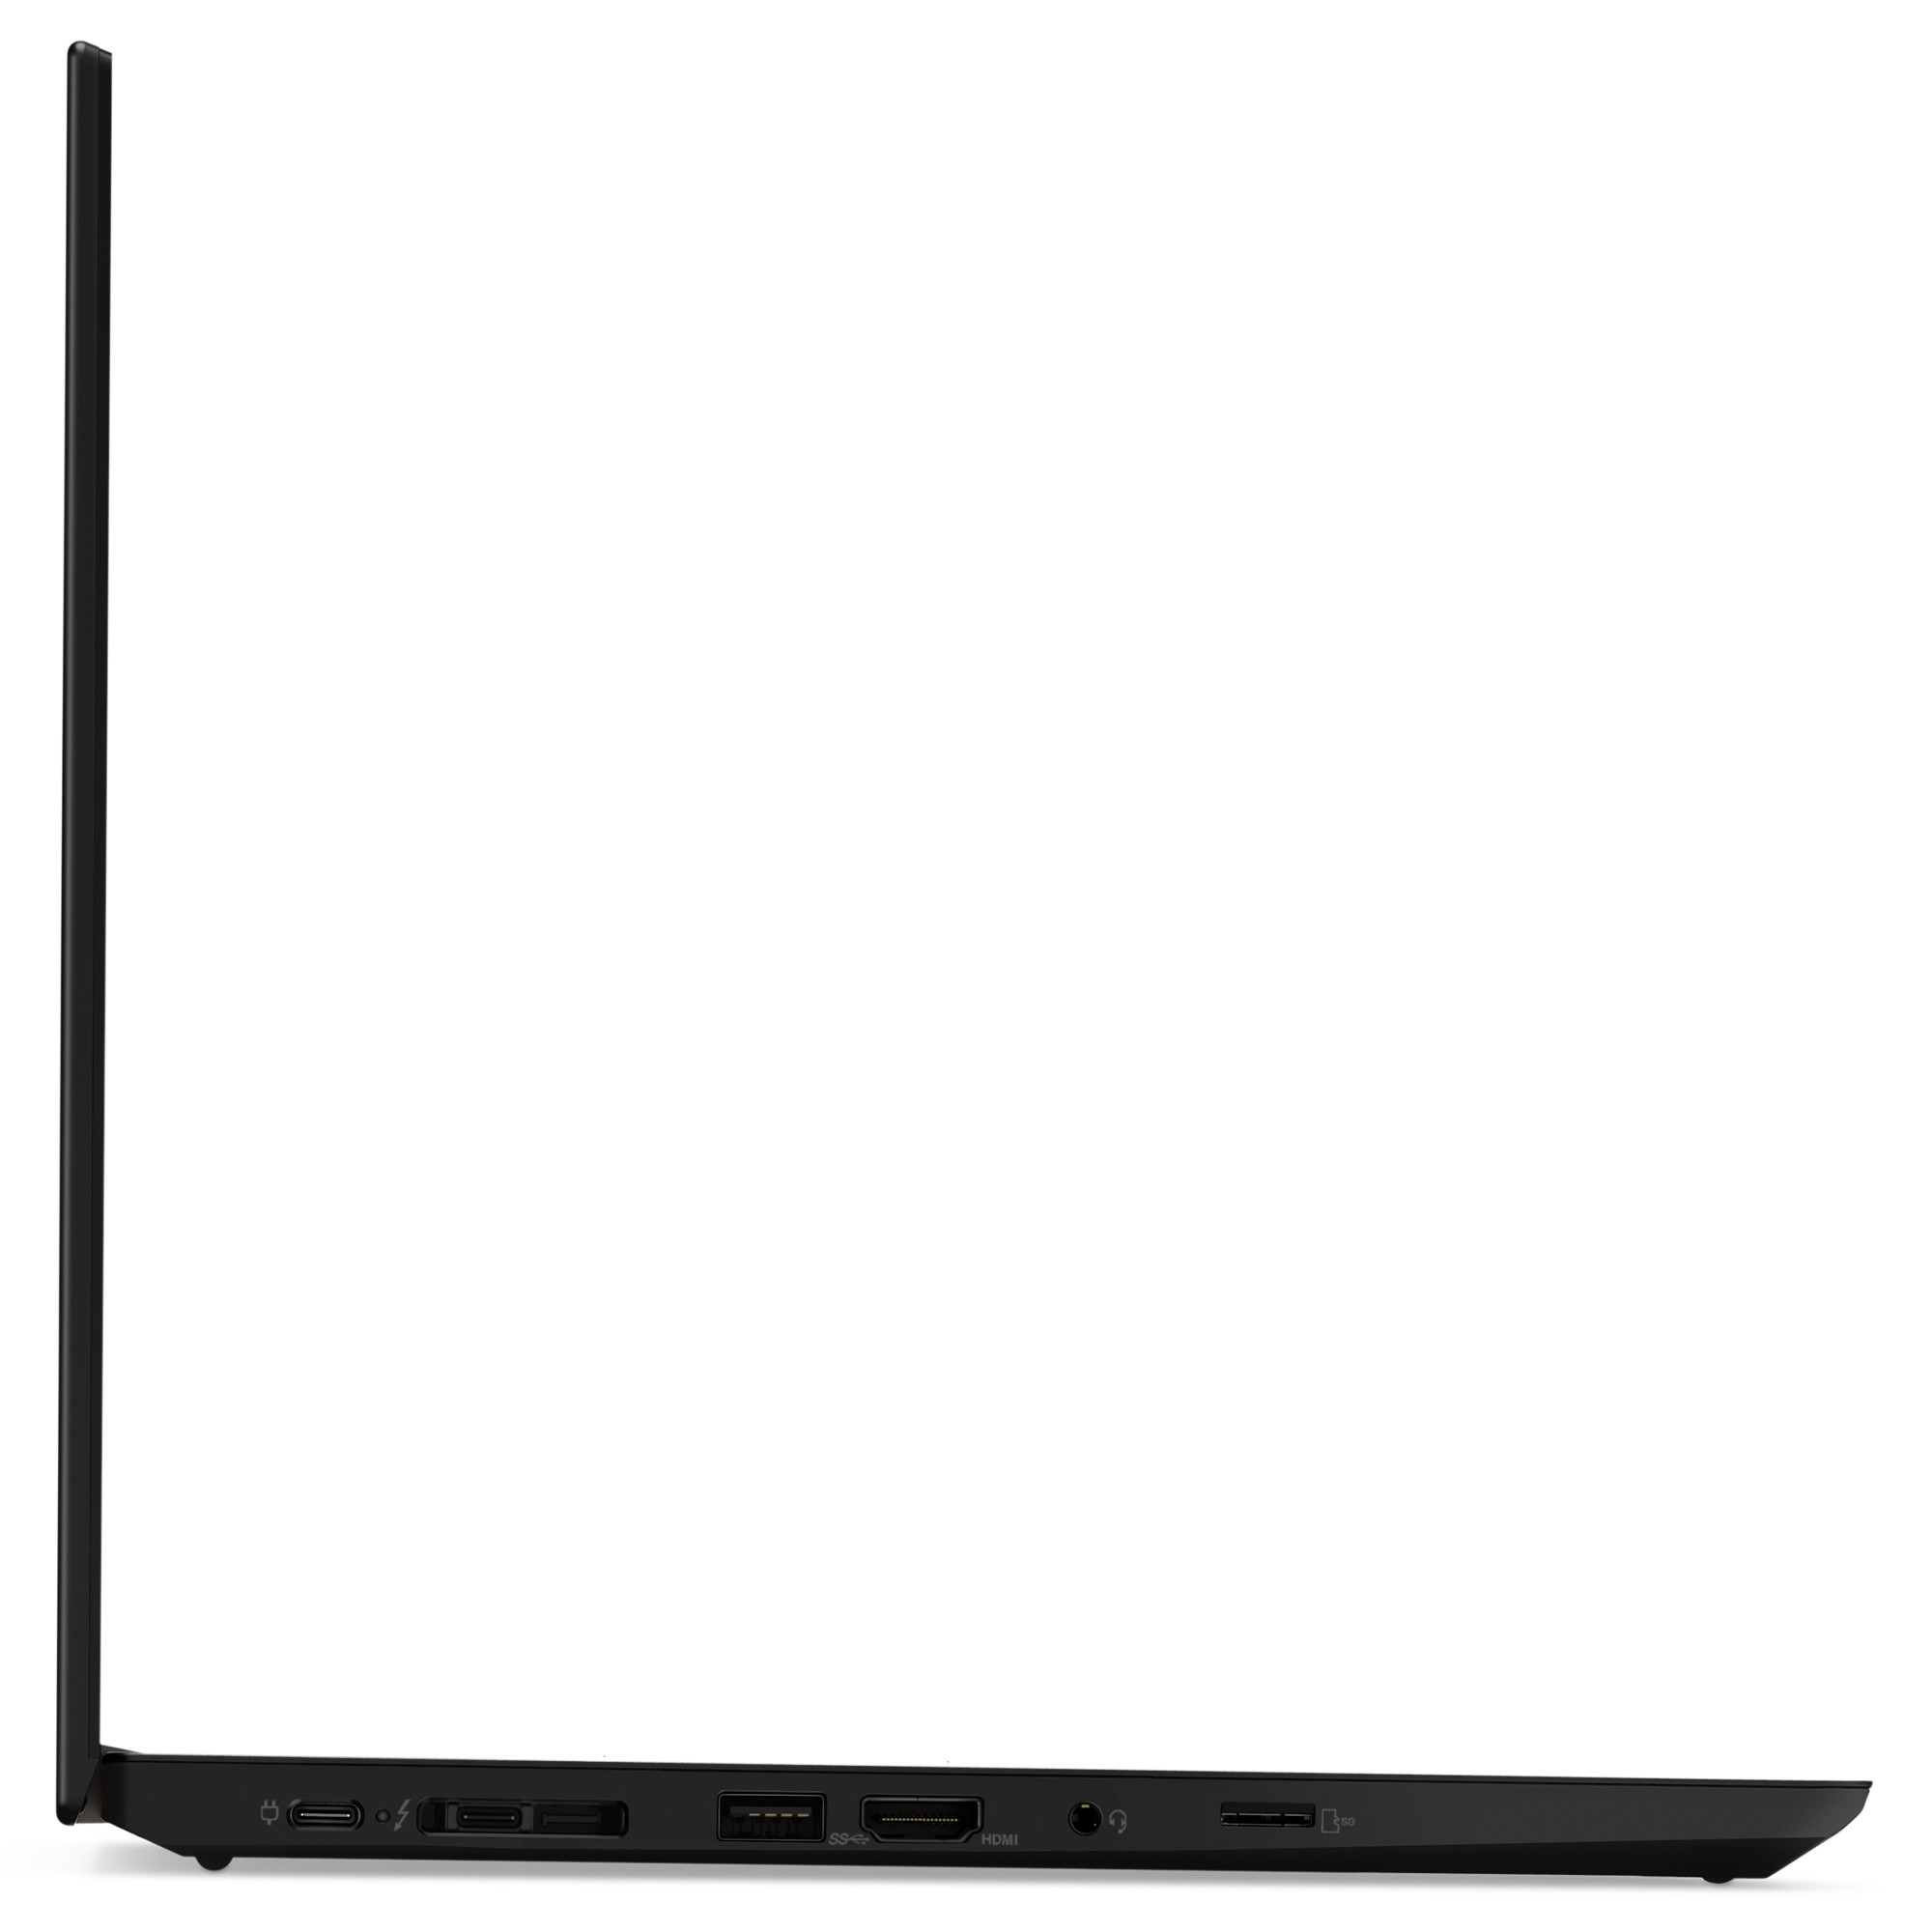
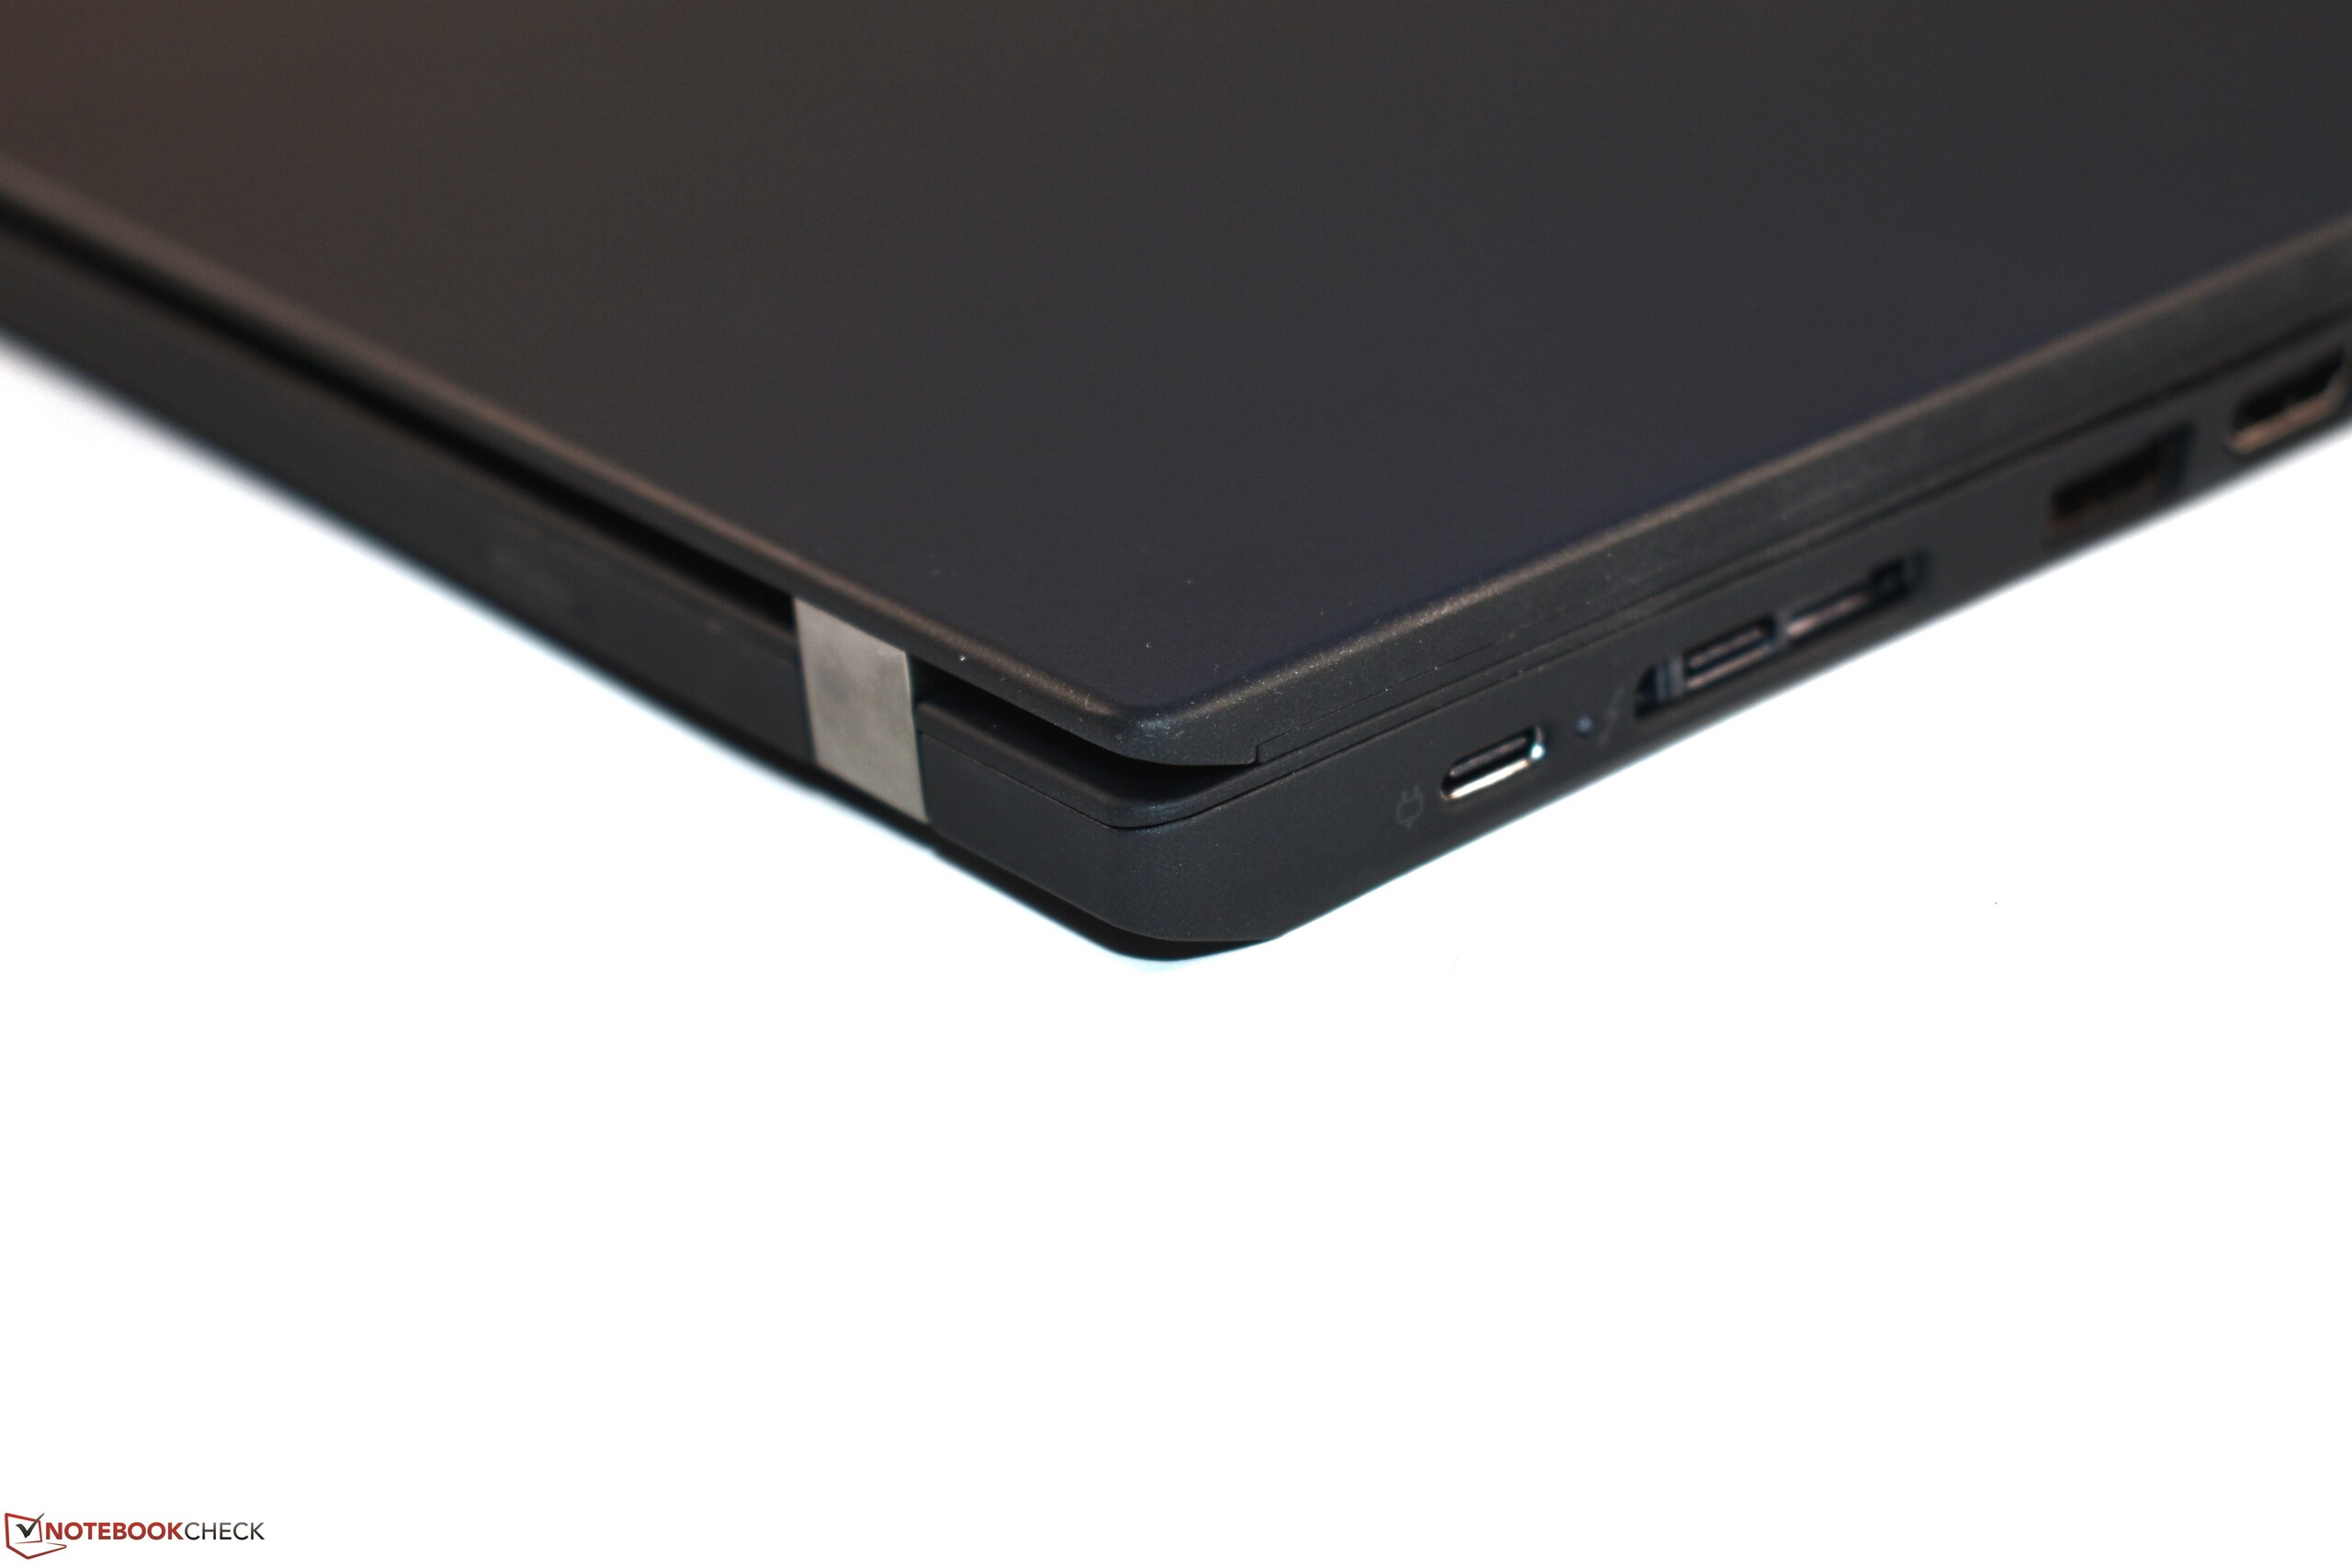
A duração da bateria é boa e um SSD NVMe contribui para um sistema rápido. Isto é completado por uma garantia de três anos. O slot Thunderbolt 3 também deve ser mencionado, o qual permite a conexão de uma GPU externa.
Lenovo ThinkPad P43s-20RH001FGE
- 10/19/2019 v7 (old)
Sascha Mölck