Breve Análise do Workstation Dell Precision 5530 2-in-1 (i7-8706G, Radeon WX Vega M GL, 4K UHD)

| SD Card Reader | |
| average JPG Copy Test (av. of 3 runs) | |
| Gigabyte Aero 15X v8 (Toshiba Exceria Pro SDXC 64 GB UHS-II) | |
| Lenovo ThinkPad X1 Extreme-20MF000XGE (Toshiba Exceria Pro SDXC 64 GB UHS-II) | |
| Dell Precision 5530 Xeon E-2176M (Toshiba Exceria Pro SDXC 64 GB UHS-II) | |
| Dell Precision 5530 2-in-1 (Toshiba Exceria Pro M501 UHS-II) | |
| maximum AS SSD Seq Read Test (1GB) | |
| Gigabyte Aero 15X v8 (Toshiba Exceria Pro SDXC 64 GB UHS-II) | |
| Lenovo ThinkPad X1 Extreme-20MF000XGE (Toshiba Exceria Pro SDXC 64 GB UHS-II) | |
| Dell Precision 5530 2-in-1 (Toshiba Exceria Pro M501 UHS-II) | |
| Dell Precision 5530 Xeon E-2176M (Toshiba Exceria Pro SDXC 64 GB UHS-II) | |
| |||||||||||||||||||||||||
iluminação: 79 %
iluminação com acumulador: 430.9 cd/m²
Contraste: 1231:1 (Preto: 0.35 cd/m²)
ΔE ColorChecker Calman: 3.29 | ∀{0.5-29.43 Ø4.73}
calibrated: 3.58
ΔE Greyscale Calman: 2.6 | ∀{0.09-98 Ø4.97}
100% sRGB (Argyll 1.6.3 3D)
87.2% AdobeRGB 1998 (Argyll 1.6.3 3D)
99.4% AdobeRGB 1998 (Argyll 3D)
99.9% sRGB (Argyll 3D)
91.2% Display P3 (Argyll 3D)
Gamma: 2.19
CCT: 6870 K
| Dell Precision 5530 2-in-1 Sharp SHP148D, IPS, 15.6", 3840x2160 | MSI GS65 Stealth Thin 8RE-051US AUO80ED, IPS, 15.6", 1920x1080 | Lenovo ThinkPad X1 Extreme-20MF000XGE B156ZAN03.2, IPS, 15.6", 3840x2160 | Dell Precision 5530 Xeon E-2176M Sharp SHP148D / LQ156D1, IGZO, 15.6", 3840x2160 | Gigabyte Aero 15X v8 LGD05C0, IPS, 15.6", 1920x1080 | HP ZBook 15u G5 2ZC05EA CMN15E7, IPS LED, 15.6", 1920x1080 | Dell XPS 15 9575 i7-8705G Sharp SHP148D, IPS, 15.6", 3840x2160 | |
|---|---|---|---|---|---|---|---|
| Display | -23% | -2% | -14% | -24% | -48% | -12% | |
| Display P3 Coverage (%) | 91.2 | 65.8 -28% | 86.3 -5% | 76.5 -16% | 63.6 -30% | 43.05 -53% | 78.7 -14% |
| sRGB Coverage (%) | 99.9 | 92.1 -8% | 100 0% | 98.4 -2% | 93.8 -6% | 64.7 -35% | 97.9 -2% |
| AdobeRGB 1998 Coverage (%) | 99.4 | 67 -33% | 99.4 0% | 76.4 -23% | 64.9 -35% | 44.5 -55% | 79.2 -20% |
| Response Times | 64% | -5% | 7% | 68% | 20% | 5% | |
| Response Time Grey 50% / Grey 80% * (ms) | 49.6 ? | 20 ? 60% | 61.6 ? -24% | 48 ? 3% | 16.8 ? 66% | 41.6 ? 16% | 48.4 ? 2% |
| Response Time Black / White * (ms) | 37.6 ? | 12 ? 68% | 32 ? 15% | 33.6 ? 11% | 11.2 ? 70% | 28.8 ? 23% | 34.8 ? 7% |
| PWM Frequency (Hz) | 990 ? | 1000 | 25770 ? | 1000 ? | |||
| Screen | -11% | -4% | -5% | 10% | -29% | 1% | |
| Brightness middle (cd/m²) | 430.9 | 250.9 -42% | 396 -8% | 451.7 5% | 313 -27% | 229 -47% | 488 13% |
| Brightness (cd/m²) | 398 | 257 -35% | 380 -5% | 440 11% | 300 -25% | 212 -47% | 440 11% |
| Brightness Distribution (%) | 79 | 83 5% | 90 14% | 90 14% | 78 -1% | 88 11% | 81 3% |
| Black Level * (cd/m²) | 0.35 | 0.32 9% | 0.28 20% | 0.4 -14% | 0.33 6% | 0.23 34% | 0.3 14% |
| Contrast (:1) | 1231 | 784 -36% | 1414 15% | 1129 -8% | 948 -23% | 996 -19% | 1627 32% |
| Colorchecker dE 2000 * | 3.29 | 2.77 16% | 4 -22% | 3.11 5% | 1.29 61% | 4.2 -28% | 3.16 4% |
| Colorchecker dE 2000 max. * | 7.46 | 5.89 21% | 7.6 -2% | 8.62 -16% | 2.04 73% | 18 -141% | 8.8 -18% |
| Colorchecker dE 2000 calibrated * | 3.58 | 2.5 30% | 0.9 75% | 3.07 14% | 4.2 -17% | ||
| Greyscale dE 2000 * | 2.6 | 4 -54% | 6.1 -135% | 3.7 -42% | 0.69 73% | 2 23% | 3.3 -27% |
| Gamma | 2.19 100% | 2.27 97% | 2.25 98% | 2.11 104% | 2.43 91% | 2.23 99% | 2.178 101% |
| CCT | 6870 95% | 6901 94% | 7786 83% | 6492 100% | 6550 99% | 6292 103% | 6811 95% |
| Color Space (Percent of AdobeRGB 1998) (%) | 87.2 | 60 -31% | 88.5 1% | 69 -21% | 60 -31% | 41 -53% | 71.7 -18% |
| Color Space (Percent of sRGB) (%) | 100 | 92 -8% | 100 0% | 98 -2% | 94 -6% | 64.5 -35% | 97.9 -2% |
| Média Total (Programa/Configurações) | 10% /
-4% | -4% /
-4% | -4% /
-5% | 18% /
11% | -19% /
-26% | -2% /
-1% |
* ... menor é melhor
Exibir tempos de resposta
| ↔ Tempo de resposta preto para branco | ||
|---|---|---|
| 37.6 ms ... ascensão ↗ e queda ↘ combinadas | ↗ 20.4 ms ascensão | 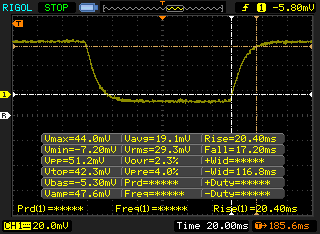 |
| ↘ 17.2 ms queda | ||
| A tela mostra taxas de resposta lentas em nossos testes e será insatisfatória para os jogadores. Em comparação, todos os dispositivos testados variam de 0.1 (mínimo) a 240 (máximo) ms. » 95 % de todos os dispositivos são melhores. Isso significa que o tempo de resposta medido é pior que a média de todos os dispositivos testados (19.9 ms). | ||
| ↔ Tempo de resposta 50% cinza a 80% cinza | ||
| 49.6 ms ... ascensão ↗ e queda ↘ combinadas | ↗ 25.2 ms ascensão | 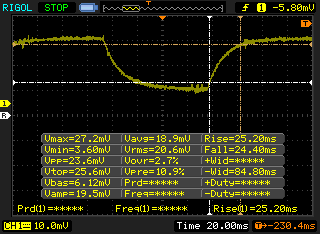 |
| ↘ 24.4 ms queda | ||
| A tela mostra taxas de resposta lentas em nossos testes e será insatisfatória para os jogadores. Em comparação, todos os dispositivos testados variam de 0.165 (mínimo) a 636 (máximo) ms. » 85 % de todos os dispositivos são melhores. Isso significa que o tempo de resposta medido é pior que a média de todos os dispositivos testados (31.1 ms). | ||
Cintilação da tela / PWM (modulação por largura de pulso)
| Tela tremeluzindo/PWM detectado | 990 Hz | ≤ 25 % configuração de brilho | 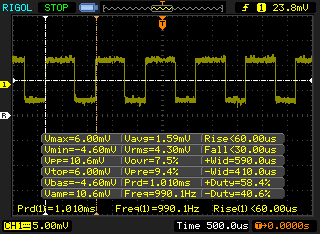 |
A luz de fundo da tela pisca em 990 Hz (pior caso, por exemplo, utilizando PWM) Cintilação detectada em uma configuração de brilho de 25 % e abaixo. Não deve haver cintilação ou PWM acima desta configuração de brilho. A frequência de 990 Hz é bastante alta, então a maioria dos usuários sensíveis ao PWM não deve notar nenhuma oscilação. [pwm_comparison] Em comparação: 52 % de todos os dispositivos testados não usam PWM para escurecer a tela. Se PWM foi detectado, uma média de 7798 (mínimo: 5 - máximo: 343500) Hz foi medida. | |||
| Cinebench R11.5 | |
| CPU Single 64Bit | |
| Média da turma Workstation (n=1últimos 2 anos) | |
| Intel Hades Canyon NUC8i7HVK | |
| Dell Precision 5530 Xeon E-2176M | |
| Dell Precision 5530 2-in-1 | |
| Dell XPS 15 9575 i7-8705G | |
| HP ZBook 15u G5 2ZC05EA | |
| MSI WS63VR 7RL-023US | |
| CPU Multi 64Bit | |
| Média da turma Workstation (n=1últimos 2 anos) | |
| Dell Precision 5530 Xeon E-2176M | |
| Intel Hades Canyon NUC8i7HVK | |
| Dell Precision 5530 2-in-1 | |
| MSI WS63VR 7RL-023US | |
| Dell XPS 15 9575 i7-8705G | |
| HP ZBook 15u G5 2ZC05EA | |
| Cinebench R10 | |
| Rendering Multiple CPUs 32Bit | |
| Média da turma Workstation (n=1últimos 2 anos) | |
| Dell Precision 5530 Xeon E-2176M | |
| MSI WS63VR 7RL-023US | |
| Intel Hades Canyon NUC8i7HVK | |
| Dell Precision 5530 2-in-1 | |
| Dell XPS 15 9575 i7-8705G | |
| HP ZBook 15u G5 2ZC05EA | |
| Rendering Single 32Bit | |
| Média da turma Workstation (n=1últimos 2 anos) | |
| Dell Precision 5530 Xeon E-2176M | |
| Intel Hades Canyon NUC8i7HVK | |
| Dell Precision 5530 2-in-1 | |
| HP ZBook 15u G5 2ZC05EA | |
| Dell XPS 15 9575 i7-8705G | |
| wPrime 2.10 - 1024m | |
| Média da turma Workstation (n=1últimos 2 anos) | |
| MSI WS63VR 7RL-023US | |
| Dell Precision 5530 2-in-1 | |
| Dell XPS 15 9575 i7-8705G | |
| Intel Hades Canyon NUC8i7HVK | |
| Dell Precision 5530 Xeon E-2176M | |
* ... menor é melhor
| PCMark 8 Home Score Accelerated v2 | 3480 pontos | |
| PCMark 8 Work Score Accelerated v2 | 4146 pontos | |
| PCMark 10 Score | 4760 pontos | |
Ajuda | ||
| Dell Precision 5530 2-in-1 SK Hynix PC401 512GB M.2 (HFS512GD9TNG) | Lenovo ThinkPad X1 Extreme-20MF000XGE Samsung SSD PM981 MZVLB1T0HALR | Dell Precision 5530 Xeon E-2176M SK hynix PC400 512 GB | HP ZBook 15u G5 2ZC05EA Toshiba XG5 KXG50ZNV256G | Média SK Hynix PC401 512GB M.2 (HFS512GD9TNG) | |
|---|---|---|---|---|---|
| AS SSD | 84% | 3% | -27% | 13% | |
| Copy Game MB/s (MB/s) | 741 | 742 0% | 837 ? 13% | ||
| Copy Program MB/s (MB/s) | 435.5 | 324.8 -25% | 470 ? 8% | ||
| Copy ISO MB/s (MB/s) | 913 | 1146 26% | 1286 ? 41% | ||
| Score Total (Points) | 2509 | 5355 113% | 2922 16% | 1697 -32% | 2787 ? 11% |
| Score Write (Points) | 1180 | 2147 82% | 1121 -5% | 710 -40% | 1188 ? 1% |
| Score Read (Points) | 899 | 2132 137% | 1226 36% | 689 -23% | 1089 ? 21% |
| Access Time Write * (ms) | 0.051 | 0.028 45% | 0.053 -4% | 0.051 -0% | 0.04845 ? 5% |
| Access Time Read * (ms) | 0.043 | 0.034 21% | 0.073 -70% | 0.103 -140% | 0.04909 ? -14% |
| 4K-64 Write (MB/s) | 990 | 1782 80% | 926 -6% | 564 -43% | 956 ? -3% |
| 4K-64 Read (MB/s) | 685 | 1805 164% | 970 42% | 488.4 -29% | 819 ? 20% |
| 4K Write (MB/s) | 101.9 | 130.9 28% | 92.8 -9% | 101.5 0% | 118.8 ? 17% |
| 4K Read (MB/s) | 42.43 | 56.8 34% | 38.43 -9% | 31.28 -26% | 43.2 ? 2% |
| Seq Write (MB/s) | 887 | 2336 163% | 1022 15% | 441 -50% | 1137 ? 28% |
| Seq Read (MB/s) | 1697 | 2703 59% | 2169 28% | 1696 0% | 2266 ? 34% |
* ... menor é melhor

| 3DMark | |
| 1280x720 Cloud Gate Standard Graphics | |
| Média da turma Workstation (46927 - 152418, n=15, últimos 2 anos) | |
| Dell Precision 7720 | |
| MSI GS65 Stealth Thin 8RE-051US | |
| MSI WS63VR 7RL-023US | |
| MSI WS63 7RF-290US | |
| Intel Hades Canyon NUC8i7HVK | |
| Dell Precision 5530 Xeon E-2176M | |
| Dell XPS 15 9575 i7-8705G | |
| Dell Precision 5530 2-in-1 | |
| HP ZBook 15u G5 2ZC05EA | |
| HP EliteBook 735 G5 3UN62EA | |
| 1920x1080 Fire Strike Graphics | |
| Média da turma Workstation (7578 - 52560, n=25, últimos 2 anos) | |
| Dell Precision 7720 | |
| MSI WS63VR 7RL-023US | |
| MSI GS65 Stealth Thin 8RE-051US | |
| Intel Hades Canyon NUC8i7HVK | |
| MSI WS63 7RF-290US | |
| Dell XPS 15 9575 i7-8705G | |
| Dell Precision 5530 2-in-1 | |
| Lenovo ThinkPad X1 Extreme-20MF000XGE | |
| Dell Precision 5530 Xeon E-2176M | |
| HP ZBook 15u G5 2ZC05EA | |
| HP EliteBook 735 G5 3UN62EA | |
| 1920x1080 Ice Storm Extreme Graphics | |
| Intel Hades Canyon NUC8i7HVK | |
| MSI WS63 7RF-290US | |
| Dell Precision 5530 Xeon E-2176M | |
| Dell XPS 15 9575 i7-8705G | |
| 3DMark 11 Performance | 9731 pontos | |
| 3DMark Ice Storm Standard Score | 49024 pontos | |
| 3DMark Cloud Gate Standard Score | 19765 pontos | |
| 3DMark Fire Strike Score | 6253 pontos | |
| 3DMark Time Spy Score | 2213 pontos | |
Ajuda | ||
| baixo | média | alto | ultra | 4K | |
|---|---|---|---|---|---|
| Sleeping Dogs (2012) | 113.1 | 95.9 | 84.6 | 36 | |
| StarCraft II: Heart of the Swarm (2013) | 254 | 146 | 134.1 | 71.4 | |
| BioShock Infinite (2013) | 106.5 | 101.2 | 102.9 | 59.6 | |
| Metro: Last Light (2013) | 98.2 | 94.8 | 77.5 | 41 | |
| Thief (2014) | 68.6 | 67.1 | 64.3 | 42.7 | |
| The Witcher 3 (2015) | 94.7 | 79 | 44.2 | 23.9 | 15.1 |
| Batman: Arkham Knight (2015) | 73 | 73 | 50 | 16 | |
| Metal Gear Solid V (2015) | 60 | 60 | 60 | 50 | 25.1 |
| Fallout 4 (2015) | 106.9 | 80.4 | 49.8 | 35.5 | 14.7 |
| Rise of the Tomb Raider (2016) | 74.4 | 77.6 | 40.4 | 31.8 | 13.8 |
| Ashes of the Singularity (2016) | 50.3 | 34.8 | 16 | ||
| Overwatch (2016) | 193.7 | 173.4 | 109.8 | 52.3 | 32.9 |
| Prey (2017) | 116.1 | 91.3 | 74.9 | 65.5 | 19.9 |
| Rocket League (2017) | 185.6 | 146.2 | 100.2 | 34.3 | |
| Dirt 4 (2017) | 194.3 | 97.1 | 54.5 | 31.3 | 18.3 |
| F1 2017 (2017) | 122 | 78 | 65 | 40 | 17 |
| Final Fantasy XV Benchmark (2018) | 63 | 32.5 | 21.8 | 8.3 | |
| F1 2018 (2018) | 107 | 65 | 54 | 34 | 15 |
| Shadow of the Tomb Raider (2018) | 82 | 37 | 33 | 28 | 8 |
| Assassin´s Creed Odyssey (2018) | 44 | 33 | 27 | 17 | 10 |
Barulho
| Ocioso |
| 28.6 / 28.6 / 29.1 dB |
| Carga |
| 39.8 / 47 dB |
 | ||
30 dB silencioso 40 dB(A) audível 50 dB(A) ruidosamente alto |
||
min: | ||
| Dell Precision 5530 2-in-1 WX Vega M GL, i7-8706G, SK Hynix PC401 512GB M.2 (HFS512GD9TNG) | MSI WS63VR 7RL-023US Quadro P4000 Max-Q, i7-7700HQ, Toshiba NVMe THNSN5512GPU7 | Lenovo ThinkPad X1 Extreme-20MF000XGE GeForce GTX 1050 Ti Max-Q, i7-8750H, Samsung SSD PM981 MZVLB1T0HALR | Dell Precision 5530 Xeon E-2176M Quadro P2000, E-2176M, SK hynix PC400 512 GB | HP ZBook 15u G5 2ZC05EA Radeon Pro WX 3100, i5-8550U, Toshiba XG5 KXG50ZNV256G | Dell XPS 15 9575 i7-8705G Vega M GL / 870, i7-8705G, SK hynix PC401 NVMe 500 GB | |
|---|---|---|---|---|---|---|
| Noise | -3% | 5% | -1% | 6% | 5% | |
| desligado / ambiente * (dB) | 28.6 | 28 2% | 28.8 -1% | 28.4 1% | 29.8 -4% | 28.2 1% |
| Idle Minimum * (dB) | 28.6 | 33.2 -16% | 28.8 -1% | 28.4 1% | 29.8 -4% | 28.2 1% |
| Idle Average * (dB) | 28.6 | 33.2 -16% | 28.8 -1% | 28.4 1% | 29.8 -4% | 28.2 1% |
| Idle Maximum * (dB) | 29.1 | 33.2 -14% | 31.3 -8% | 28.4 2% | 30.8 -6% | 28.2 3% |
| Load Average * (dB) | 39.8 | 41.4 -4% | 36.4 9% | 46.5 -17% | 32.9 17% | 29 27% |
| Witcher 3 ultra * (dB) | 47 | 38.4 18% | 36.4 23% | 46.5 1% | 36.5 22% | 44.7 5% |
| Load Maximum * (dB) | 47 | 43.5 7% | 39.2 17% | 46.5 1% | 36.5 22% | 47.4 -1% |
* ... menor é melhor
(-) A temperatura máxima no lado superior é 48.6 °C / 119 F, em comparação com a média de 38.2 °C / 101 F , variando de 22.2 a 69.8 °C para a classe Workstation.
(±) A parte inferior aquece até um máximo de 42.2 °C / 108 F, em comparação com a média de 41.1 °C / 106 F
(+) Em uso inativo, a temperatura média para o lado superior é 29.1 °C / 84 F, em comparação com a média do dispositivo de 32 °C / ### class_avg_f### F.
(±) Jogando The Witcher 3, a temperatura média para o lado superior é 35.1 °C / 95 F, em comparação com a média do dispositivo de 32 °C / ## #class_avg_f### F.
(+) Os apoios para as mãos e o touchpad são mais frios que a temperatura da pele, com um máximo de 31.2 °C / 88.2 F e, portanto, são frios ao toque.
(-) A temperatura média da área do apoio para as mãos de dispositivos semelhantes foi 27.8 °C / 82 F (-3.4 °C / -6.2 F).
Dell Precision 5530 2-in-1 análise de áudio
(±) | o volume do alto-falante é médio, mas bom (###valor### dB)
Graves 100 - 315Hz
(±) | graves reduzidos - em média 9.6% menor que a mediana
(±) | a linearidade dos graves é média (13% delta para a frequência anterior)
Médios 400 - 2.000 Hz
(+) | médios equilibrados - apenas 3.2% longe da mediana
(+) | médios são lineares (6.9% delta para frequência anterior)
Altos 2 - 16 kHz
(+) | agudos equilibrados - apenas 2.8% longe da mediana
(±) | a linearidade dos máximos é média (9.7% delta para frequência anterior)
Geral 100 - 16.000 Hz
(+) | o som geral é linear (13.9% diferença em relação à mediana)
Comparado com a mesma classe
» 28% de todos os dispositivos testados nesta classe foram melhores, 4% semelhantes, 67% piores
» O melhor teve um delta de 7%, a média foi 17%, o pior foi 35%
Comparado com todos os dispositivos testados
» 16% de todos os dispositivos testados foram melhores, 4% semelhantes, 80% piores
» O melhor teve um delta de 4%, a média foi 24%, o pior foi 134%
Apple MacBook 12 (Early 2016) 1.1 GHz análise de áudio
(+) | os alto-falantes podem tocar relativamente alto (###valor### dB)
Graves 100 - 315Hz
(±) | graves reduzidos - em média 11.3% menor que a mediana
(±) | a linearidade dos graves é média (14.2% delta para a frequência anterior)
Médios 400 - 2.000 Hz
(+) | médios equilibrados - apenas 2.4% longe da mediana
(+) | médios são lineares (5.5% delta para frequência anterior)
Altos 2 - 16 kHz
(+) | agudos equilibrados - apenas 2% longe da mediana
(+) | os máximos são lineares (4.5% delta da frequência anterior)
Geral 100 - 16.000 Hz
(+) | o som geral é linear (10.2% diferença em relação à mediana)
Comparado com a mesma classe
» 7% de todos os dispositivos testados nesta classe foram melhores, 2% semelhantes, 91% piores
» O melhor teve um delta de 5%, a média foi 18%, o pior foi 53%
Comparado com todos os dispositivos testados
» 5% de todos os dispositivos testados foram melhores, 1% semelhantes, 94% piores
» O melhor teve um delta de 4%, a média foi 24%, o pior foi 134%
| desligado | |
| Ocioso | |
| Carga |
|
Key:
min: | |
| Dell Precision 5530 2-in-1 i7-8706G, WX Vega M GL, SK Hynix PC401 512GB M.2 (HFS512GD9TNG), IPS, 3840x2160, 15.6" | MSI WS63VR 7RL-023US i7-7700HQ, Quadro P4000 Max-Q, Toshiba NVMe THNSN5512GPU7, IPS, 3840x2160, 15.6" | Lenovo ThinkPad X1 Extreme-20MF000XGE i7-8750H, GeForce GTX 1050 Ti Max-Q, Samsung SSD PM981 MZVLB1T0HALR, IPS, 3840x2160, 15.6" | Dell Precision 5530 Xeon E-2176M E-2176M, Quadro P2000, SK hynix PC400 512 GB, IGZO, 3840x2160, 15.6" | Gigabyte Aero 15X v8 i7-8750H, GeForce GTX 1070 Max-Q, Toshiba NVMe THNSN5512GPU7, IPS, 1920x1080, 15.6" | HP ZBook 15u G5 2ZC05EA i5-8550U, Radeon Pro WX 3100, Toshiba XG5 KXG50ZNV256G, IPS LED, 1920x1080, 15.6" | |
|---|---|---|---|---|---|---|
| Power Consumption | -34% | -15% | -23% | -61% | 38% | |
| Idle Minimum * (Watt) | 7.4 | 13.3 -80% | 7.6 -3% | 9.8 -32% | 14 -89% | 3.2 57% |
| Idle Average * (Watt) | 12.4 | 17.2 -39% | 14.8 -19% | 16.8 -35% | 18 -45% | 6.1 51% |
| Idle Maximum * (Watt) | 13.3 | 17.9 -35% | 17.6 -32% | 16.9 -27% | 22 -65% | 9.7 27% |
| Load Average * (Watt) | 79.2 | 83.7 -6% | 86 -9% | 102.3 -29% | 91 -15% | 62 22% |
| Witcher 3 ultra * (Watt) | 82.2 | 101.9 -24% | 85 -3% | 76.5 7% | 142 -73% | 48 42% |
| Load Maximum * (Watt) | 96.5 | 114.3 -18% | 118.9 -23% | 114.5 -19% | 173 -79% | 71 26% |
* ... menor é melhor
| Dell Precision 5530 2-in-1 i7-8706G, WX Vega M GL, 75 Wh | MSI WS63VR 7RL-023US i7-7700HQ, Quadro P4000 Max-Q, 48 Wh | Lenovo ThinkPad X1 Extreme-20MF000XGE i7-8750H, GeForce GTX 1050 Ti Max-Q, 80 Wh | Dell Precision 5530 Xeon E-2176M E-2176M, Quadro P2000, 97 Wh | Gigabyte Aero 15X v8 i7-8750H, GeForce GTX 1070 Max-Q, 94.24 Wh | HP ZBook 15u G5 2ZC05EA i5-8550U, Radeon Pro WX 3100, 56 Wh | |
|---|---|---|---|---|---|---|
| Duração da bateria | -51% | 16% | 33% | 46% | 90% | |
| Reader / Idle (h) | 12.3 | 3.9 -68% | 11.5 -7% | 16.5 34% | 12.7 3% | 21.7 76% |
| WiFi v1.3 (h) | 7.3 | 2.9 -60% | 6.4 -12% | 8.4 15% | 8.6 18% | 8.6 18% |
| Load (h) | 1.2 | 0.9 -25% | 2 67% | 1.8 50% | 2.6 117% | 3.3 175% |
| Witcher 3 ultra (h) | 1.1 |
Pro
Contra
Se você é um usuário tradicional de workstation que deseja VGA integrada, portas de tamanho grande, chassi mais robusto, memória ECC, leitores de Smart Card, mais espaço de armazenamento, compatibilidade com E-Port e facilidade de manutenção, o Precision 5530 2-em-1 não é para você. Um portátil da série Precision 7000 como o 7720 seria a opção mais certa em tais cenários estacionários.
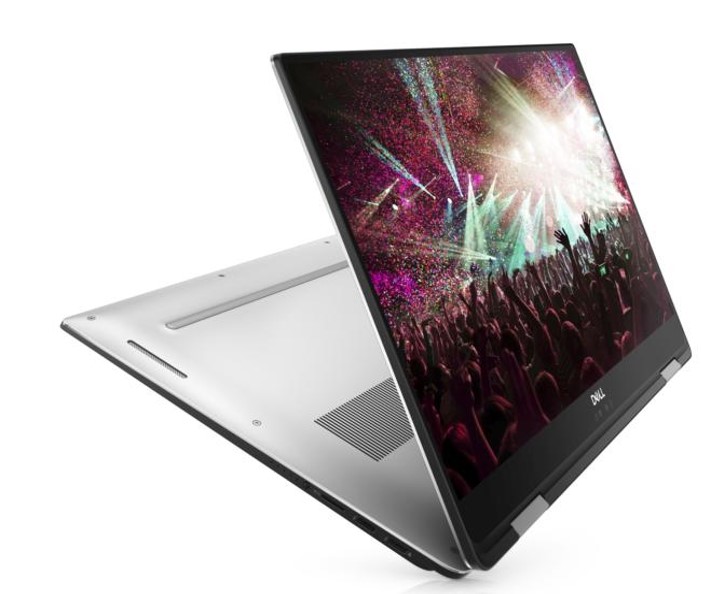
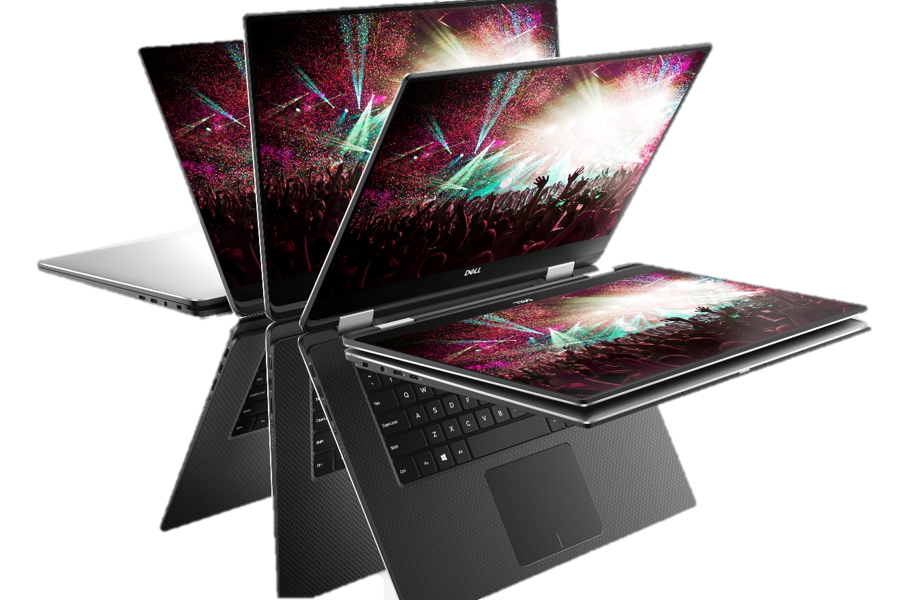
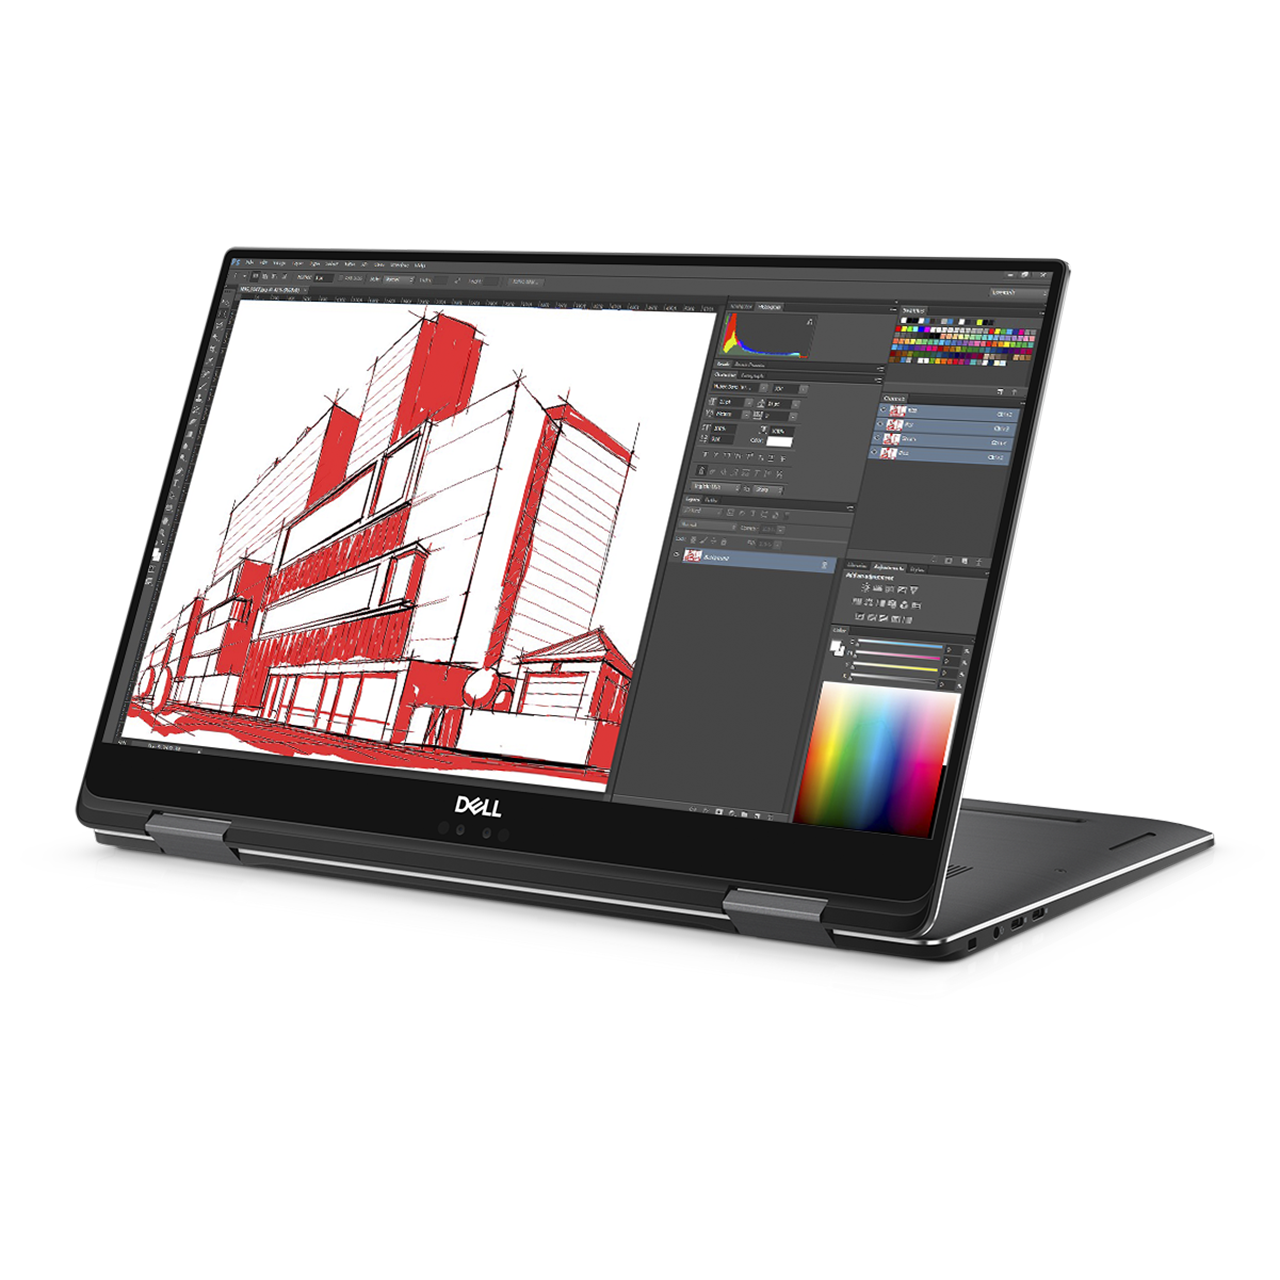
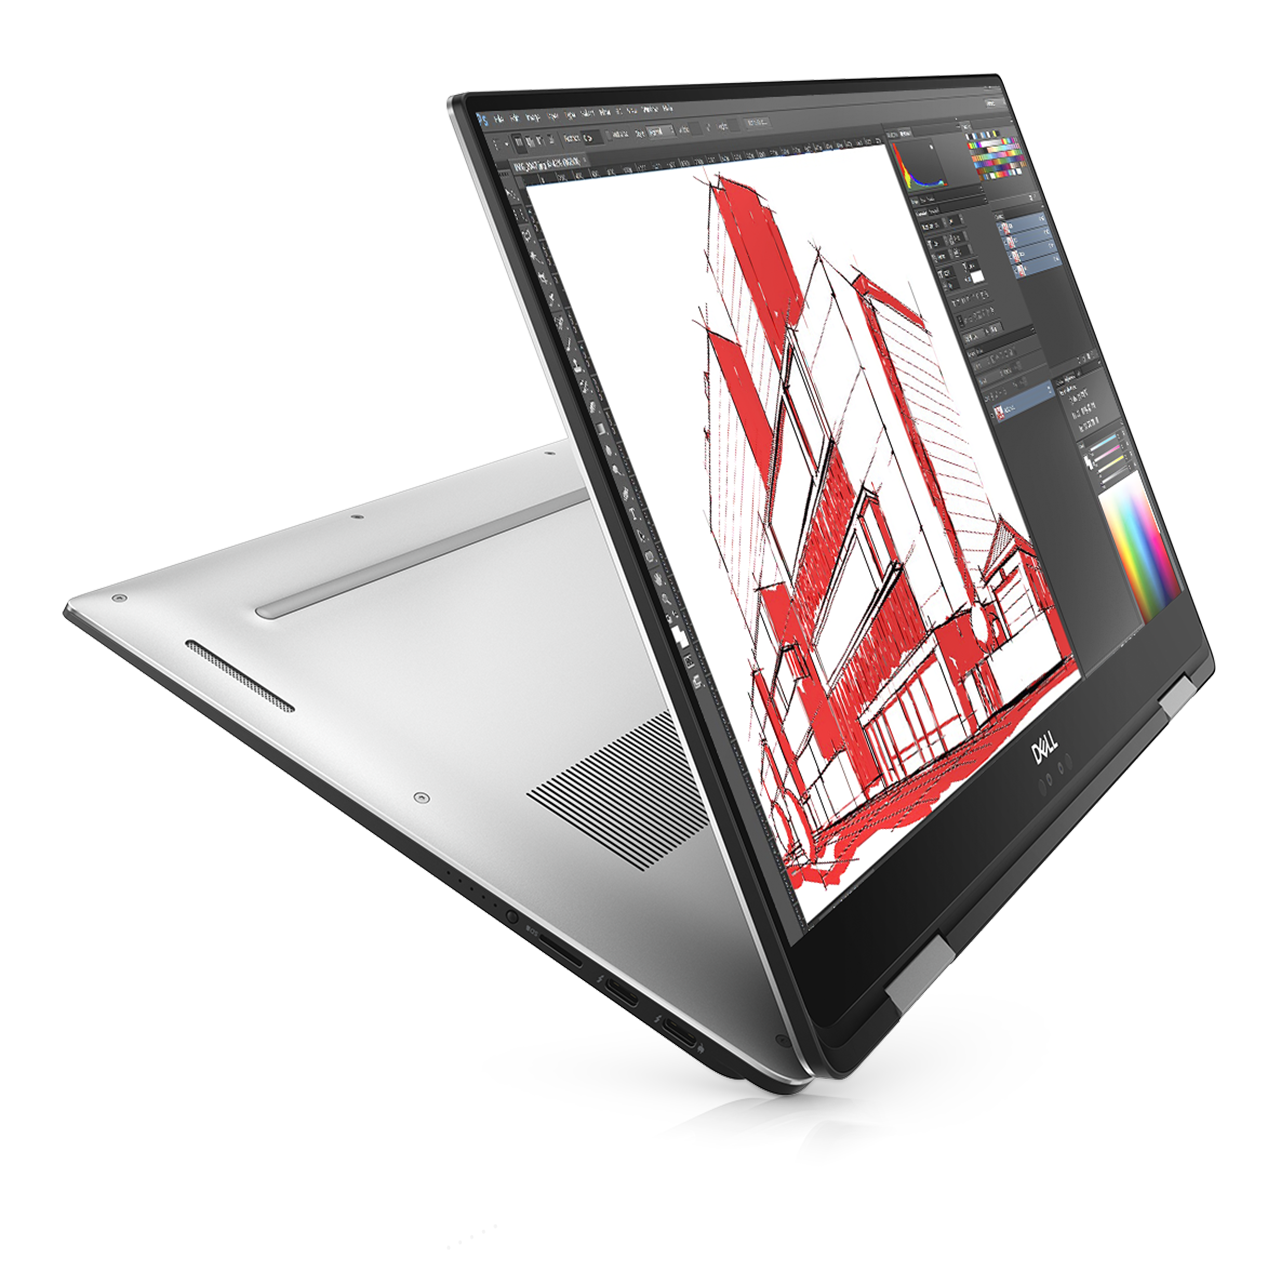
Por outro lado, os profissionais que estão constantemente levando seu trabalho para a estrada e são atraídos pelas versáteis dobradiças de 360 graus devem considerar o Precision 5530 2-em-1. Seu CPU e GPU apresentam um grande equilíbrio em termos de desempenho individual e sua tela brilhante IGZO tem o alcance necessário para reproduzir com precisão tanto o sRGB quanto o AdobeRGB. É uma estação de trabalho enganosamente poderosa, apesar da alta portabilidade e formato muito fino.
Os usuários que desejam um workstation portátil, mas que não têm interesse em recursos de tela sensível ao toque ou no modo tablet, podem querer o Precision 5530 ou MSI WS63VR como opções alternativas. O chassi MSI pode não ser tão rígido quanto o da Dell, mas oferece opções de gráficos Quadro P3000 e P4000 Max-Q mais velozes que os usuários exigentes de workstations podem gostar.
O Precision 5530 2-em-1 é uma potente máquina móvel que equilibra com precisão o desempenho e a portabilidade. Porém, se você está procurando portas e facilidade de manutenção, então, o mais tradicional Precision 7720 seria a opção mais forte e mais rápida.
Dell Precision 5530 2-in-1
- 10/12/2018 v6 (old)
Allen Ngo
Price comparison
