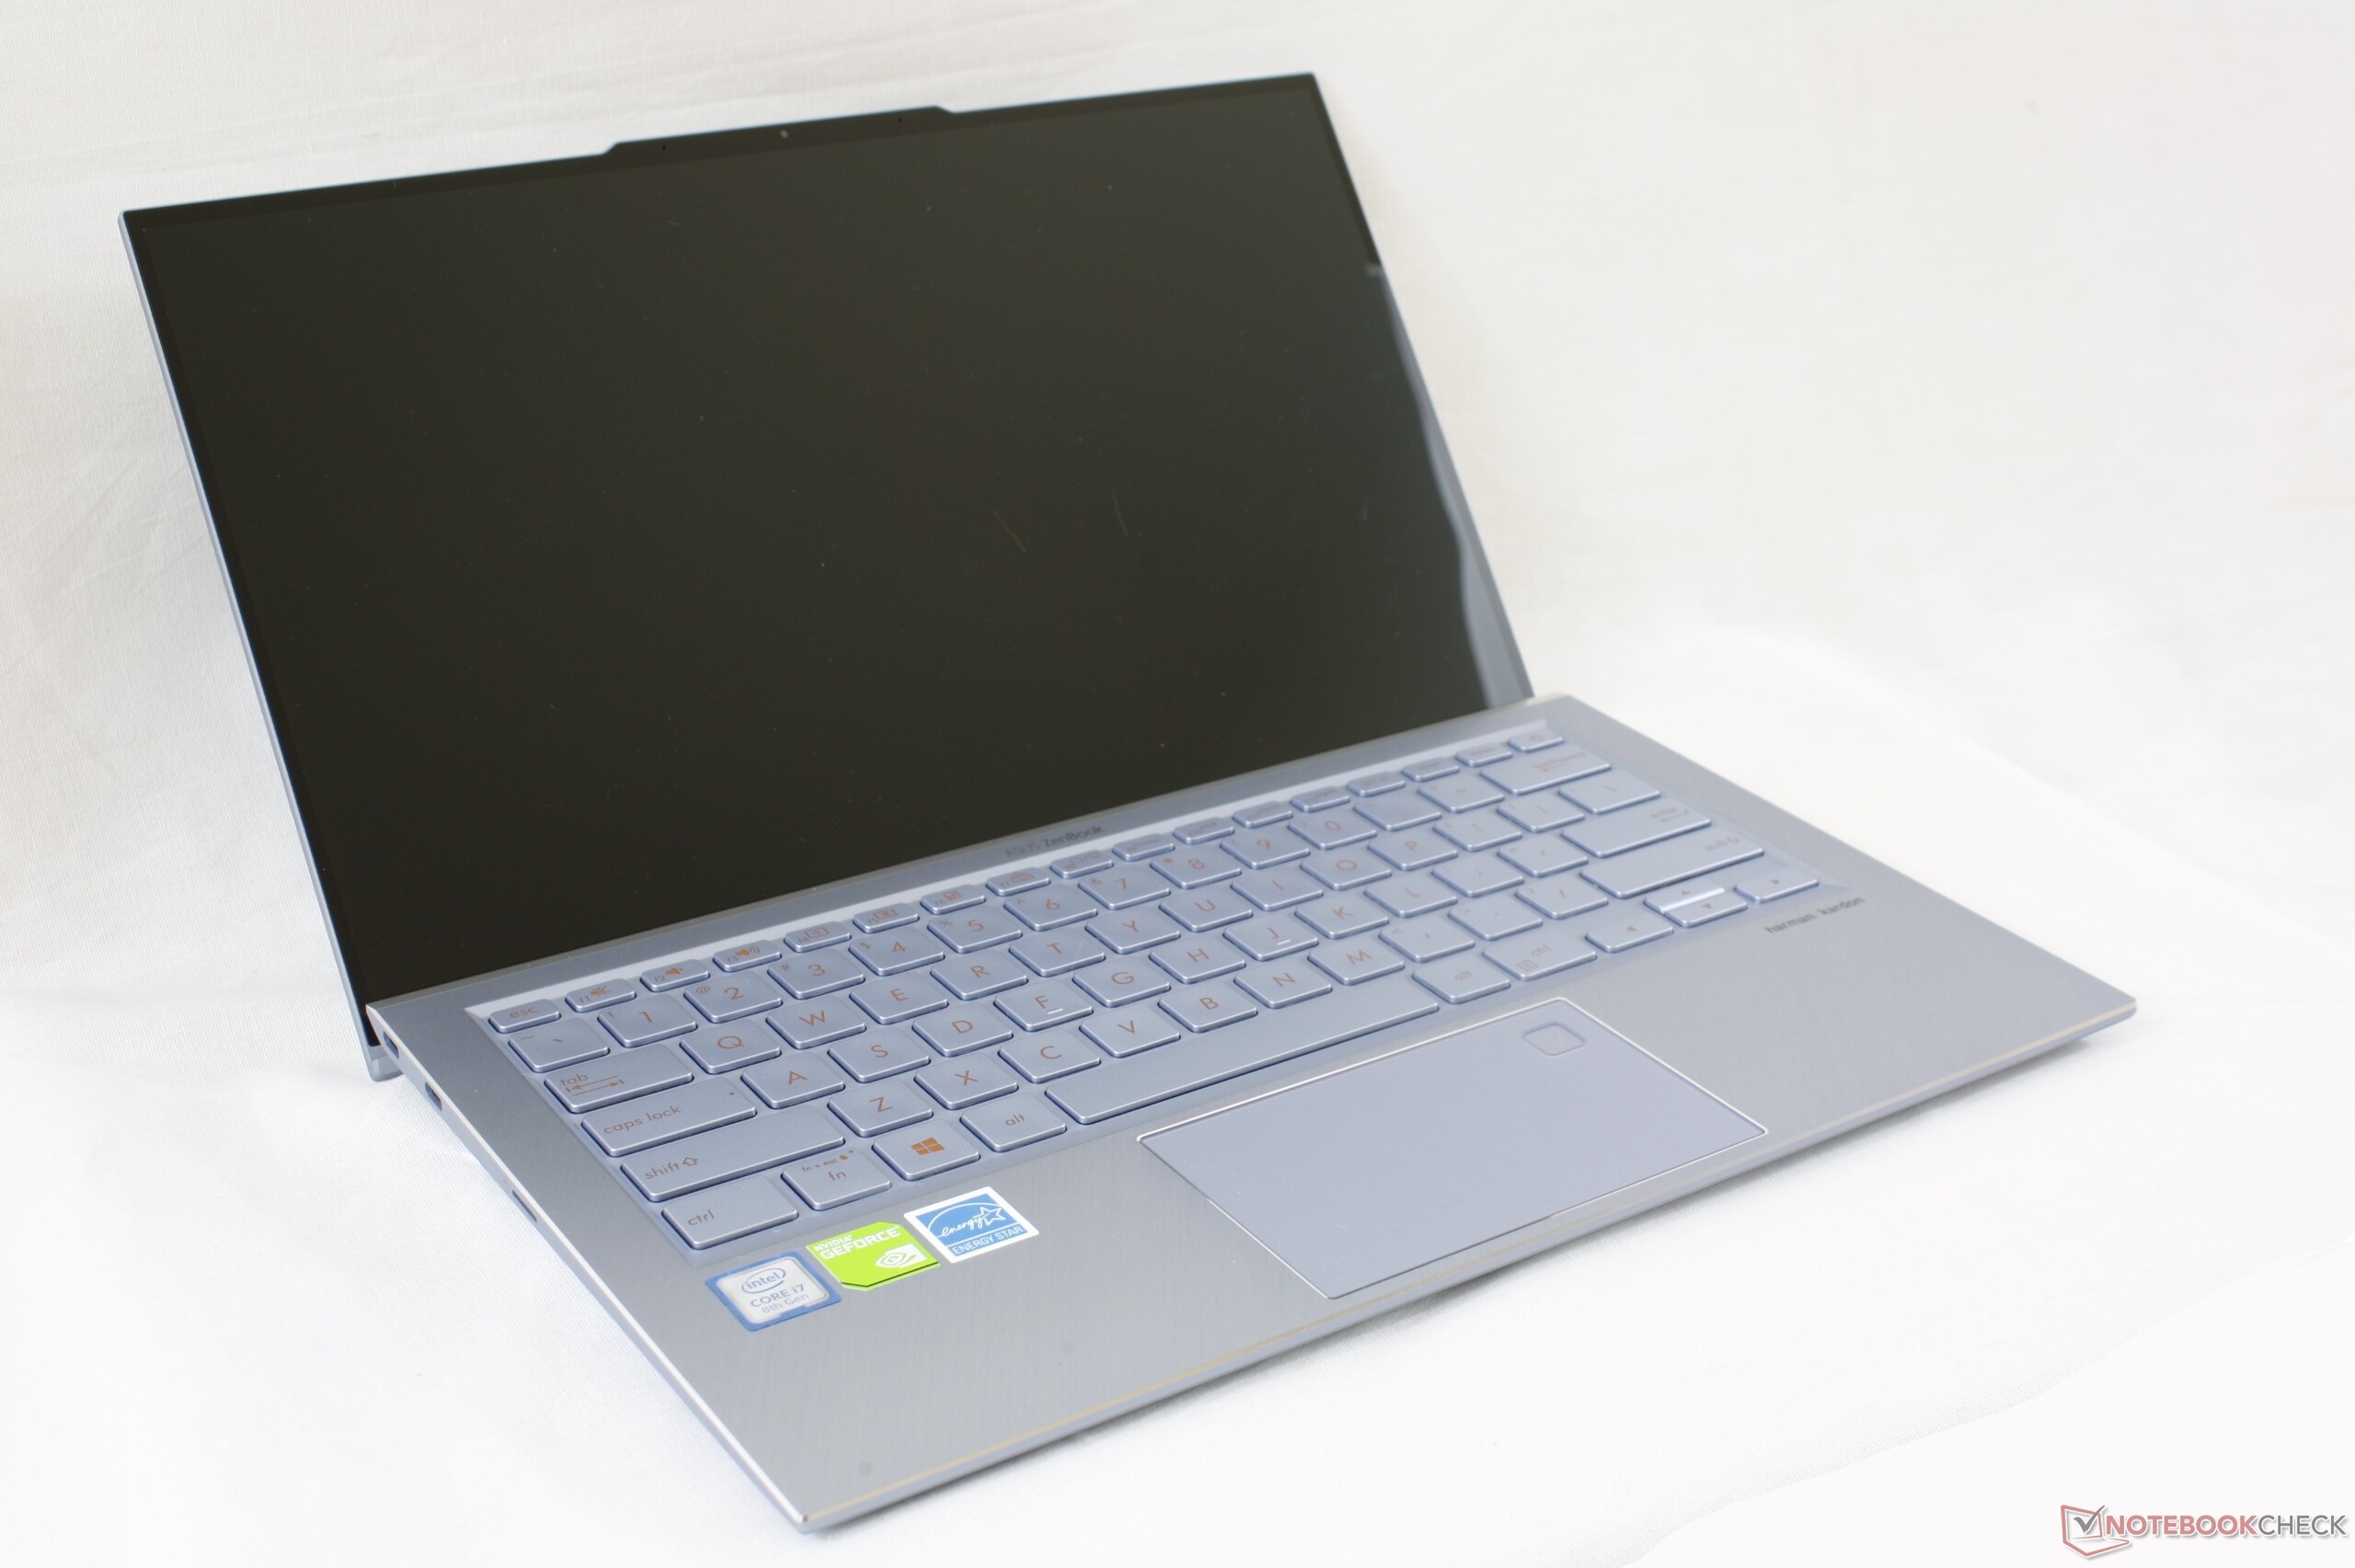
Breve Análise do Portátil Asus ZenBook S13 UX392FN (i7-8565U, GeForce MX150)
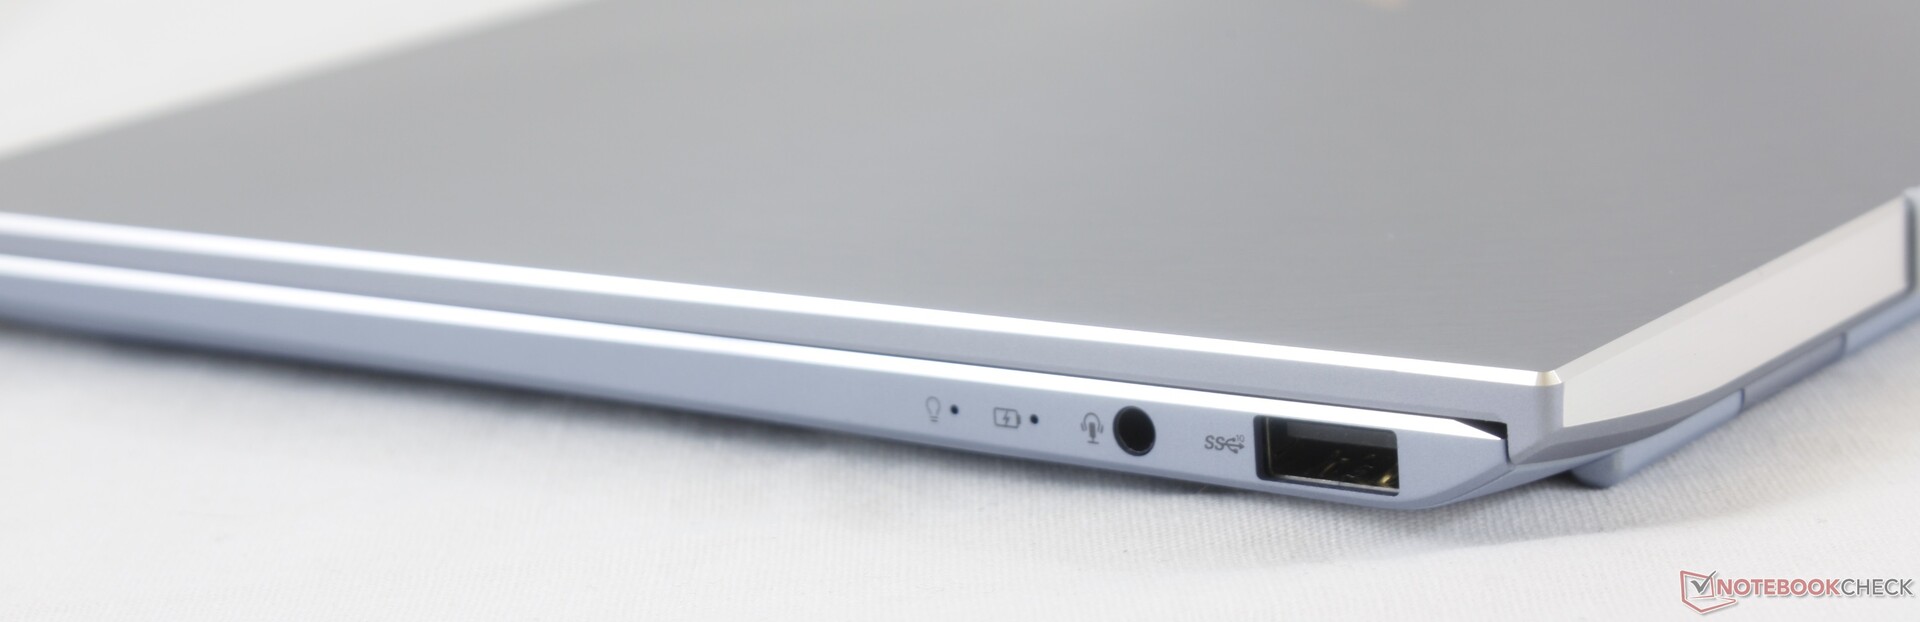
| SD Card Reader | |
| average JPG Copy Test (av. of 3 runs) | |
| Dell XPS 13 9380 2019 (Toshiba Exceria Pro SDXC 64 GB UHS-II) | |
| Asus ROG G703GX (Toshiba Exceria Pro SDXC 64 GB UHS-II) | |
| Asus ZenBook S13 UX392FN (Toshiba Exceria Pro M501 64 GB UHS-II) | |
| Chuwi HeroBook 14 (Toshiba Exceria Pro M501 64 GB UHS-II) | |
| maximum AS SSD Seq Read Test (1GB) | |
| Asus ROG G703GX (Toshiba Exceria Pro SDXC 64 GB UHS-II) | |
| Dell XPS 13 9380 2019 (Toshiba Exceria Pro SDXC 64 GB UHS-II) | |
| Asus ZenBook S13 UX392FN (Toshiba Exceria Pro M501 64 GB UHS-II) | |
| Chuwi HeroBook 14 (Toshiba Exceria Pro M501 64 GB UHS-II) | |
| Networking | |
| iperf3 transmit AX12 | |
| Dell XPS 13 9380 2019 | |
| Asus ZenBook S13 UX392FN | |
| Huawei Matebook X Pro i5 | |
| Asus ZenBook S UX391U | |
| iperf3 receive AX12 | |
| Asus ZenBook S13 UX392FN | |
| Huawei Matebook X Pro i5 | |
| Asus ZenBook S UX391U | |
| Dell XPS 13 9380 2019 | |
| |||||||||||||||||||||||||
iluminação: 90 %
iluminação com acumulador: 466 cd/m²
Contraste: 1412:1 (Preto: 0.33 cd/m²)
ΔE ColorChecker Calman: 1.93 | ∀{0.5-29.43 Ø4.71}
calibrated: 1.99
ΔE Greyscale Calman: 1.7 | ∀{0.09-98 Ø4.96}
95.7% sRGB (Argyll 1.6.3 3D)
62.2% AdobeRGB 1998 (Argyll 1.6.3 3D)
69% AdobeRGB 1998 (Argyll 3D)
95.8% sRGB (Argyll 3D)
67.5% Display P3 (Argyll 3D)
Gamma: 2.15
CCT: 6382 K
| Asus ZenBook S13 UX392FN Tianma XM, IPS, 13.9", 1920x1080 | Dell XPS 13 9380 2019 ID: AUO 282B B133ZAN Dell: 90NTH, IPS, 13.3", 3840x2160 | Asus ZenBook S UX391U AUO B133HAN04.9, IPS, 13.3", 1920x1080 | Huawei Matebook X Pro i5 Tianma XM, IPS, 13.9", 3000x2000 | Lenovo Yoga C930-13IKB B139HAN03_0, IPS, 13.9", 1920x1080 | HP Spectre x360 13t-ae000 LGD0588, IPS, 13.3", 3840x2160 | Razer Blade Stealth i7-8565U Sharp LQ133M1JW41, IPS, 13.3", 1920x1080 | |
|---|---|---|---|---|---|---|---|
| Display | -4% | -6% | -2% | -3% | 5% | -2% | |
| Display P3 Coverage (%) | 67.5 | 64.7 -4% | 64.4 -5% | 65.9 -2% | 64.3 -5% | 71.9 7% | 65.5 -3% |
| sRGB Coverage (%) | 95.8 | 93.1 -3% | 90.5 -6% | 95.2 -1% | 94.6 -1% | 98.1 2% | 96.3 1% |
| AdobeRGB 1998 Coverage (%) | 69 | 65.3 -5% | 65.2 -6% | 67.6 -2% | 66.2 -4% | 73.1 6% | 66.3 -4% |
| Response Times | -34% | -7% | 6% | 2% | -20% | -30% | |
| Response Time Grey 50% / Grey 80% * (ms) | 47.2 ? | 58 ? -23% | 44.8 ? 5% | 40.4 ? 14% | 40.8 ? 14% | 51.6 ? -9% | 57.6 ? -22% |
| Response Time Black / White * (ms) | 24.8 ? | 36 ? -45% | 29.2 ? -18% | 25.6 ? -3% | 27.6 ? -11% | 32.4 ? -31% | 34 ? -37% |
| PWM Frequency (Hz) | 22730 ? | ||||||
| Screen | -37% | -58% | -48% | -82% | -14% | 8% | |
| Brightness middle (cd/m²) | 466 | 404 -13% | 299 -36% | 442.7 -5% | 316 -32% | 329.8 -29% | 429.8 -8% |
| Brightness (cd/m²) | 462 | 389 -16% | 300 -35% | 428 -7% | 291 -37% | 318 -31% | 403 -13% |
| Brightness Distribution (%) | 90 | 85 -6% | 92 2% | 84 -7% | 83 -8% | 74 -18% | 89 -1% |
| Black Level * (cd/m²) | 0.33 | 0.37 -12% | 0.26 21% | 0.31 6% | 0.36 -9% | 0.25 24% | 0.32 3% |
| Contrast (:1) | 1412 | 1092 -23% | 1150 -19% | 1428 1% | 878 -38% | 1319 -7% | 1343 -5% |
| Colorchecker dE 2000 * | 1.93 | 3.72 -93% | 5.6 -190% | 2.24 -16% | 5.9 -206% | 2.37 -23% | 1.08 44% |
| Colorchecker dE 2000 max. * | 4.26 | 7.38 -73% | 9.1 -114% | 7.19 -69% | 12.9 -203% | 4.08 4% | 3.96 7% |
| Colorchecker dE 2000 calibrated * | 1.99 | 2.06 -4% | 2.6 -31% | 1.11 44% | 1.3 35% | 1.21 39% | |
| Greyscale dE 2000 * | 1.7 | 4.44 -161% | 5.5 -224% | 9.7 -471% | 8.6 -406% | 2.8 -65% | 1.3 24% |
| Gamma | 2.15 102% | 2.34 94% | 2.47 89% | 1.42 155% | 2.1 105% | 2.145 103% | 2.23 99% |
| CCT | 6382 102% | 7095 92% | 7533 86% | 6227 104% | 6854 95% | 6441 101% | 6452 101% |
| Color Space (Percent of AdobeRGB 1998) (%) | 62.2 | 60 -4% | 58.9 -5% | 61.6 -1% | 60.7 -2% | 67 8% | 61.4 -1% |
| Color Space (Percent of sRGB) (%) | 95.7 | 93 -3% | 90.3 -6% | 95 -1% | 94.5 -1% | 98 2% | 96.3 1% |
| Média Total (Programa/Configurações) | -25% /
-31% | -24% /
-42% | -15% /
-33% | -28% /
-57% | -10% /
-11% | -8% /
2% |
* ... menor é melhor
Exibir tempos de resposta
| ↔ Tempo de resposta preto para branco | ||
|---|---|---|
| 24.8 ms ... ascensão ↗ e queda ↘ combinadas | ↗ 14 ms ascensão | 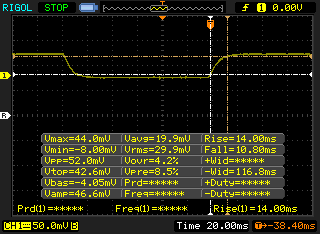 |
| ↘ 10.8 ms queda | ||
| A tela mostra boas taxas de resposta em nossos testes, mas pode ser muito lenta para jogadores competitivos. Em comparação, todos os dispositivos testados variam de 0.1 (mínimo) a 240 (máximo) ms. » 58 % de todos os dispositivos são melhores. Isso significa que o tempo de resposta medido é pior que a média de todos os dispositivos testados (19.8 ms). | ||
| ↔ Tempo de resposta 50% cinza a 80% cinza | ||
| 47.2 ms ... ascensão ↗ e queda ↘ combinadas | ↗ 23.6 ms ascensão | 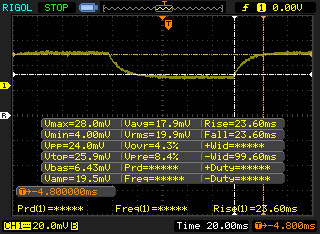 |
| ↘ 23.6 ms queda | ||
| A tela mostra taxas de resposta lentas em nossos testes e será insatisfatória para os jogadores. Em comparação, todos os dispositivos testados variam de 0.165 (mínimo) a 636 (máximo) ms. » 82 % de todos os dispositivos são melhores. Isso significa que o tempo de resposta medido é pior que a média de todos os dispositivos testados (31 ms). | ||
Cintilação da tela / PWM (modulação por largura de pulso)
| Tela tremeluzindo / PWM não detectado | 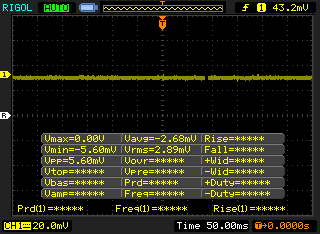 | ||
[pwm_comparison] Em comparação: 52 % de todos os dispositivos testados não usam PWM para escurecer a tela. Se PWM foi detectado, uma média de 7757 (mínimo: 5 - máximo: 343500) Hz foi medida. | |||
| Cinebench R15 | |
| CPU Single 64Bit | |
| Asus ZenBook S13 UX392FN | |
| Razer Blade Stealth i7-8565U | |
| Média Intel Core i7-8565U (138.3 - 193, n=51) | |
| Asus Zephyrus S GX531GX | |
| Dell XPS 13 9370 i7 UHD | |
| VAIO SX14 | |
| Acer Nitro 5 AN515-42-R6V0 | |
| Lenovo ThinkPad 13 20J1005TPB | |
| Huawei Matebook X Pro i5 | |
| Xiaomi Mi Gaming Laptop 7300HQ 1050Ti | |
| HP x2 210 G2 | |
| CPU Multi 64Bit | |
| Asus Zephyrus S GX531GX | |
| Asus ZenBook S13 UX392FN | |
| Razer Blade Stealth i7-8565U | |
| Acer Nitro 5 AN515-42-R6V0 | |
| VAIO SX14 | |
| Dell XPS 13 9370 i7 UHD | |
| Média Intel Core i7-8565U (452 - 815, n=52) | |
| Huawei Matebook X Pro i5 | |
| Xiaomi Mi Gaming Laptop 7300HQ 1050Ti | |
| Lenovo ThinkPad 13 20J1005TPB | |
| HP x2 210 G2 | |
| Cinebench R10 | |
| Rendering Multiple CPUs 32Bit | |
| Dell XPS 13 9370 i7 UHD | |
| Média Intel Core i7-8565U (13806 - 23118, n=16) | |
| Huawei Matebook X Pro i5 | |
| HP x2 210 G2 | |
| Rendering Single 32Bit | |
| Média Intel Core i7-8565U (2682 - 8906, n=16) | |
| Dell XPS 13 9370 i7 UHD | |
| Huawei Matebook X Pro i5 | |
| HP x2 210 G2 | |
| wPrime 2.10 - 1024m | |
| Lenovo ThinkPad 13 20J1005TPB | |
| Dell XPS 13 9370 i7 UHD | |
| Média Intel Core i7-8565U (263 - 420, n=7) | |
| Huawei Matebook X Pro i5 | |
* ... menor é melhor
| PCMark 10 | |
| Score | |
| Razer Blade Stealth i7-8565U | |
| Média Intel Core i7-8565U, NVIDIA GeForce MX150 (3704 - 4344, n=6) | |
| Asus ZenBook S13 UX392FN | |
| Asus Zenbook 14 UX433FN-A6023T | |
| Huawei Matebook X Pro i5 | |
| Asus ZenBook S UX391U | |
| Essentials | |
| Razer Blade Stealth i7-8565U | |
| Asus ZenBook S13 UX392FN | |
| Média Intel Core i7-8565U, NVIDIA GeForce MX150 (6763 - 8382, n=6) | |
| Asus Zenbook 14 UX433FN-A6023T | |
| Asus ZenBook S UX391U | |
| Huawei Matebook X Pro i5 | |
| Productivity | |
| Razer Blade Stealth i7-8565U | |
| Média Intel Core i7-8565U, NVIDIA GeForce MX150 (5994 - 7281, n=6) | |
| Asus ZenBook S13 UX392FN | |
| Asus ZenBook S UX391U | |
| Asus Zenbook 14 UX433FN-A6023T | |
| Huawei Matebook X Pro i5 | |
| Digital Content Creation | |
| Razer Blade Stealth i7-8565U | |
| Média Intel Core i7-8565U, NVIDIA GeForce MX150 (3194 - 3722, n=6) | |
| Asus ZenBook S13 UX392FN | |
| Asus Zenbook 14 UX433FN-A6023T | |
| Huawei Matebook X Pro i5 | |
| Asus ZenBook S UX391U | |
| PCMark 8 | |
| Home Score Accelerated v2 | |
| Razer Blade Stealth i7-8565U | |
| Asus ZenBook S13 UX392FN | |
| Asus Zenbook 14 UX433FN-A6023T | |
| Média Intel Core i7-8565U, NVIDIA GeForce MX150 (3141 - 4092, n=6) | |
| Asus ZenBook S UX391U | |
| Huawei Matebook X Pro i5 | |
| Work Score Accelerated v2 | |
| Asus ZenBook S13 UX392FN | |
| Razer Blade Stealth i7-8565U | |
| Asus Zenbook 14 UX433FN-A6023T | |
| Média Intel Core i7-8565U, NVIDIA GeForce MX150 (4240 - 5254, n=6) | |
| Asus ZenBook S UX391U | |
| Huawei Matebook X Pro i5 | |
| PCMark 8 Home Score Accelerated v2 | 3712 pontos | |
| PCMark 8 Work Score Accelerated v2 | 5159 pontos | |
| PCMark 10 Score | 3970 pontos | |
Ajuda | ||
| Asus ZenBook S13 UX392FN WDC PC SN520 SDAPNUW-512G | Dell XPS 13 9380 2019 SK hynix PC401 HFS256GD9TNG | Asus ZenBook S UX391U Samsung PM961 NVMe MZVLW512HMJP | Huawei Matebook X Pro i5 Samsung PM961 MZVLW256HEHP | Lenovo Yoga C930-13IKB SK hynix PC401 HFS256GD9TNG | |
|---|---|---|---|---|---|
| AS SSD | -34% | -3% | -12% | -45% | |
| Seq Read (MB/s) | 1224 | 2035 66% | 1907 56% | 2416 97% | 1850 51% |
| Seq Write (MB/s) | 907 | 658 -27% | 1031 14% | 1170 29% | 661 -27% |
| 4K Read (MB/s) | 41.46 | 39.74 -4% | 43.64 5% | 48.33 17% | 38.04 -8% |
| 4K Write (MB/s) | 126.2 | 105.7 -16% | 112.5 -11% | 103.1 -18% | 95 -25% |
| 4K-64 Read (MB/s) | 1021 | 461 -55% | 703 -31% | 1039 2% | 434.3 -57% |
| 4K-64 Write (MB/s) | 1251 | 300.1 -76% | 1037 -17% | 399.6 -68% | 266.3 -79% |
| Access Time Read * (ms) | 0.053 | 0.061 -15% | 0.036 32% | 0.058 -9% | 0.069 -30% |
| Access Time Write * (ms) | 0.027 | 0.051 -89% | 0.033 -22% | 0.036 -33% | 0.056 -107% |
| Score Read (Points) | 1185 | 704 -41% | 938 -21% | 1329 12% | 657 -45% |
| Score Write (Points) | 1468 | 471 -68% | 1252 -15% | 620 -58% | 427 -71% |
| Score Total (Points) | 3250 | 1479 -54% | 2637 -19% | 2575 -21% | 1373 -58% |
| Copy ISO MB/s (MB/s) | 1404 | 893 -36% | 739 -47% | 539 -62% | |
| Copy Program MB/s (MB/s) | 402.4 | 287.9 -28% | 312.3 -22% | 209.7 -48% | |
| Copy Game MB/s (MB/s) | 902 | 618 -31% | 486.3 -46% | 340 -62% |
* ... menor é melhor

| 3DMark | |
| 1280x720 Cloud Gate Standard Graphics | |
| Asus FX504GD | |
| Asus Zenbook UX510UW-CN044T | |
| Razer Blade Stealth i7-8565U | |
| Acer Aspire 5 A515-52G-723L | |
| Média NVIDIA GeForce MX150 (16227 - 22183, n=43) | |
| Asus ZenBook UX530UX-FY070T | |
| Asus ZenBook S13 UX392FN | |
| Acer Swift 3 SF315-41-R6J9 | |
| Asus VivoBook S410UQ-NH74 | |
| Dell XPS 13 9380 2019 | |
| Lenovo ThinkPad 13 20J1005TPB | |
| 1920x1080 Fire Strike Graphics | |
| Asus FX504GD | |
| Asus Zenbook UX510UW-CN044T | |
| Razer Blade Stealth i7-8565U | |
| Acer Aspire 5 A515-52G-723L | |
| Média NVIDIA GeForce MX150 (2323 - 3739, n=44) | |
| Asus ZenBook UX530UX-FY070T | |
| Asus ZenBook S13 UX392FN | |
| Acer Swift 3 SF315-41-R6J9 | |
| Asus VivoBook S410UQ-NH74 | |
| Lenovo ThinkPad 13 20J1005TPB | |
| 3DMark 11 Performance | 3896 pontos | |
| 3DMark Cloud Gate Standard Score | 12643 pontos | |
| 3DMark Fire Strike Score | 2585 pontos | |
| 3DMark Time Spy Score | 964 pontos | |
Ajuda | ||
| The Witcher 3 | |
| 1366x768 Medium Graphics & Postprocessing | |
| Asus FX504GD | |
| Acer Nitro 5 AN515-42-R6V0 | |
| Asus GL552VW-DK725T | |
| Razer Blade Stealth i7-8565U | |
| Acer Aspire 5 A515-52G-723L | |
| Asus ZenBook UX530UX-FY070T | |
| Média NVIDIA GeForce MX150 (24.4 - 43.2, n=26) | |
| Asus ZenBook S13 UX392FN | |
| Asus VivoBook S410UQ-NH74 | |
| 1920x1080 High Graphics & Postprocessing (Nvidia HairWorks Off) | |
| Asus FX504GD | |
| Acer Nitro 5 AN515-42-R6V0 | |
| Razer Blade Stealth i7-8565U | |
| Asus GL552VW-DK725T | |
| Acer Aspire 5 A515-52G-723L | |
| Asus ZenBook UX530UX-FY070T | |
| Média NVIDIA GeForce MX150 (13.3 - 23.8, n=25) | |
| Asus ZenBook S13 UX392FN | |
| Dell Latitude 14 5495 | |
| baixo | média | alto | ultra | |
|---|---|---|---|---|
| BioShock Infinite (2013) | 147.1 | 95.7 | 81.6 | 30.5 |
| The Witcher 3 (2015) | 57.6 | 32.5 | 18 | 10 |
| Rise of the Tomb Raider (2016) | 63.2 | 36.9 | 19.2 | 16.7 |
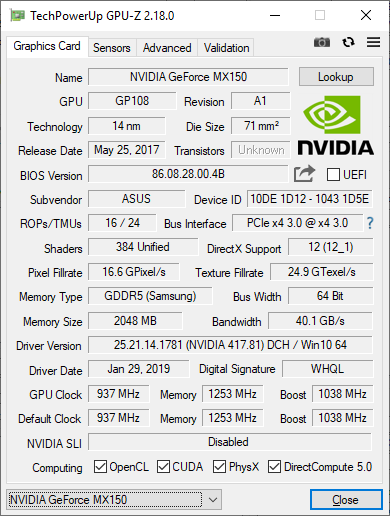
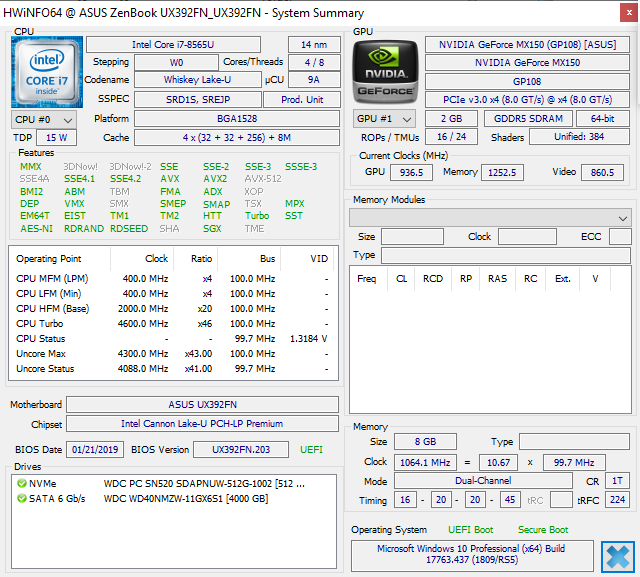
| Asus ZenBook S13 UX392FN GeForce MX150, i7-8565U, WDC PC SN520 SDAPNUW-512G | Dell XPS 13 9380 2019 UHD Graphics 620, i5-8265U, SK hynix PC401 HFS256GD9TNG | Asus ZenBook S UX391U UHD Graphics 620, i5-8550U, Samsung PM961 NVMe MZVLW512HMJP | Huawei Matebook X Pro i5 GeForce MX150, i5-8250U, Samsung PM961 MZVLW256HEHP | Lenovo Yoga C930-13IKB UHD Graphics 620, i5-8250U, SK hynix PC401 HFS256GD9TNG | Razer Blade Stealth i7-8565U GeForce MX150, i7-8565U, Lite-On CA3-8D256-Q11 | |
|---|---|---|---|---|---|---|
| Noise | 0% | -0% | 0% | 5% | -2% | |
| desligado / ambiente * (dB) | 28.1 | 30.4 -8% | 29.7 -6% | 27.9 1% | 29.3 -4% | 28.4 -1% |
| Idle Minimum * (dB) | 28.1 | 30.4 -8% | 29.7 -6% | 27.9 1% | 29.3 -4% | 28.5 -1% |
| Idle Average * (dB) | 28.1 | 30.4 -8% | 29.7 -6% | 27.9 1% | 29.3 -4% | 29 -3% |
| Idle Maximum * (dB) | 29 | 30.4 -5% | 30.1 -4% | 27.9 4% | 29.7 -2% | 29.1 -0% |
| Load Average * (dB) | 41.1 | 31.7 23% | 36.8 10% | 36.2 12% | 31.8 23% | 42.8 -4% |
| Witcher 3 ultra * (dB) | 41.1 | 45 -9% | 41.4 -1% | |||
| Load Maximum * (dB) | 41.1 | 38.1 7% | 36.8 10% | 45.2 -10% | 32.7 20% | 41.6 -1% |
* ... menor é melhor
Barulho
| Ocioso |
| 28.1 / 28.1 / 29 dB |
| Carga |
| 41.1 / 41.1 dB |
 | ||
30 dB silencioso 40 dB(A) audível 50 dB(A) ruidosamente alto |
||
min: | ||
(±) A temperatura máxima no lado superior é 42.4 °C / 108 F, em comparação com a média de 35.9 °C / 97 F , variando de 21.4 a 59 °C para a classe Subnotebook.
(-) A parte inferior aquece até um máximo de 48.6 °C / 119 F, em comparação com a média de 39.2 °C / 103 F
(+) Em uso inativo, a temperatura média para o lado superior é 28.4 °C / 83 F, em comparação com a média do dispositivo de 30.8 °C / ### class_avg_f### F.
(±) Jogando The Witcher 3, a temperatura média para o lado superior é 33.6 °C / 92 F, em comparação com a média do dispositivo de 30.8 °C / ## #class_avg_f### F.
(+) Os apoios para as mãos e o touchpad são mais frios que a temperatura da pele, com um máximo de 30.2 °C / 86.4 F e, portanto, são frios ao toque.
(±) A temperatura média da área do apoio para as mãos de dispositivos semelhantes foi 28.2 °C / 82.8 F (-2 °C / -3.6 F).
Asus ZenBook S13 UX392FN análise de áudio
(±) | o volume do alto-falante é médio, mas bom (###valor### dB)
Graves 100 - 315Hz
(±) | graves reduzidos - em média 10.9% menor que a mediana
(±) | a linearidade dos graves é média (12% delta para a frequência anterior)
Médios 400 - 2.000 Hz
(±) | médios mais altos - em média 6.4% maior que a mediana
(±) | a linearidade dos médios é média (8.4% delta para frequência anterior)
Altos 2 - 16 kHz
(+) | agudos equilibrados - apenas 2.3% longe da mediana
(±) | a linearidade dos máximos é média (7.6% delta para frequência anterior)
Geral 100 - 16.000 Hz
(±) | a linearidade do som geral é média (21.9% diferença em relação à mediana)
Comparado com a mesma classe
» 74% de todos os dispositivos testados nesta classe foram melhores, 6% semelhantes, 20% piores
» O melhor teve um delta de 5%, a média foi 18%, o pior foi 53%
Comparado com todos os dispositivos testados
» 63% de todos os dispositivos testados foram melhores, 7% semelhantes, 30% piores
» O melhor teve um delta de 4%, a média foi 23%, o pior foi 134%
Apple MacBook 12 (Early 2016) 1.1 GHz análise de áudio
(+) | os alto-falantes podem tocar relativamente alto (###valor### dB)
Graves 100 - 315Hz
(±) | graves reduzidos - em média 11.3% menor que a mediana
(±) | a linearidade dos graves é média (14.2% delta para a frequência anterior)
Médios 400 - 2.000 Hz
(+) | médios equilibrados - apenas 2.4% longe da mediana
(+) | médios são lineares (5.5% delta para frequência anterior)
Altos 2 - 16 kHz
(+) | agudos equilibrados - apenas 2% longe da mediana
(+) | os máximos são lineares (4.5% delta da frequência anterior)
Geral 100 - 16.000 Hz
(+) | o som geral é linear (10.2% diferença em relação à mediana)
Comparado com a mesma classe
» 7% de todos os dispositivos testados nesta classe foram melhores, 2% semelhantes, 90% piores
» O melhor teve um delta de 5%, a média foi 18%, o pior foi 53%
Comparado com todos os dispositivos testados
» 5% de todos os dispositivos testados foram melhores, 1% semelhantes, 94% piores
» O melhor teve um delta de 4%, a média foi 23%, o pior foi 134%
| desligado | |
| Ocioso | |
| Carga |
|
Key:
min: | |
| Asus ZenBook S13 UX392FN i7-8565U, GeForce MX150, WDC PC SN520 SDAPNUW-512G, IPS, 1920x1080, 13.9" | Dell XPS 13 9380 2019 i5-8265U, UHD Graphics 620, SK hynix PC401 HFS256GD9TNG, IPS, 3840x2160, 13.3" | Asus ZenBook S UX391U i5-8550U, UHD Graphics 620, Samsung PM961 NVMe MZVLW512HMJP, IPS, 1920x1080, 13.3" | Huawei Matebook X Pro i5 i5-8250U, GeForce MX150, Samsung PM961 MZVLW256HEHP, IPS, 3000x2000, 13.9" | Lenovo Yoga C930-13IKB i5-8250U, UHD Graphics 620, SK hynix PC401 HFS256GD9TNG, IPS, 1920x1080, 13.9" | Razer Blade Stealth i7-8565U i7-8565U, GeForce MX150, Lite-On CA3-8D256-Q11, IPS, 1920x1080, 13.3" | |
|---|---|---|---|---|---|---|
| Power Consumption | -6% | 12% | -10% | 7% | -36% | |
| Idle Minimum * (Watt) | 3.4 | 4.8 -41% | 3.24 5% | 3.5 -3% | 3.3 3% | 6.7 -97% |
| Idle Average * (Watt) | 6.3 | 8.6 -37% | 6.1 3% | 8.9 -41% | 6.8 -8% | 8.6 -37% |
| Idle Maximum * (Watt) | 10.4 | 10.4 -0% | 9.2 12% | 12.3 -18% | 9.5 9% | 9.4 10% |
| Load Average * (Watt) | 51 | 37.9 26% | 38.8 24% | 54.2 -6% | 40.8 20% | 64.1 -26% |
| Witcher 3 ultra * (Watt) | 39 | 42.4 -9% | 63.7 -63% | |||
| Load Maximum * (Watt) | 62.7 | 48.5 23% | 52.6 16% | 52.1 17% | 57 9% | 64.1 -2% |
* ... menor é melhor
| Asus ZenBook S13 UX392FN i7-8565U, GeForce MX150, 50 Wh | Dell XPS 13 9380 2019 i5-8265U, UHD Graphics 620, 52 Wh | Asus ZenBook S UX391U i5-8550U, UHD Graphics 620, 50 Wh | Huawei Matebook X Pro i5 i5-8250U, GeForce MX150, 57.4 Wh | Lenovo Yoga C930-13IKB i5-8250U, UHD Graphics 620, 60 Wh | HP Spectre x360 13t-ae000 i5-8550U, UHD Graphics 620, 60 Wh | Razer Blade Stealth i7-8565U i7-8565U, GeForce MX150, 53.1 Wh | |
|---|---|---|---|---|---|---|---|
| Duração da bateria | 0% | -4% | 4% | 6% | 2% | 5% | |
| Reader / Idle (h) | 28.5 | 17.2 -40% | 22.3 -22% | 20.7 -27% | 23.9 -16% | 20.5 -28% | |
| WiFi v1.3 (h) | 8.4 | 8.3 -1% | 8.2 -2% | 9.3 11% | 9.2 10% | 7.1 -15% | 9.5 13% |
| Load (h) | 1.7 | 2.4 41% | 1.9 12% | 2.2 29% | 2.1 24% | 2 18% | 2.2 29% |
Pro
Contra
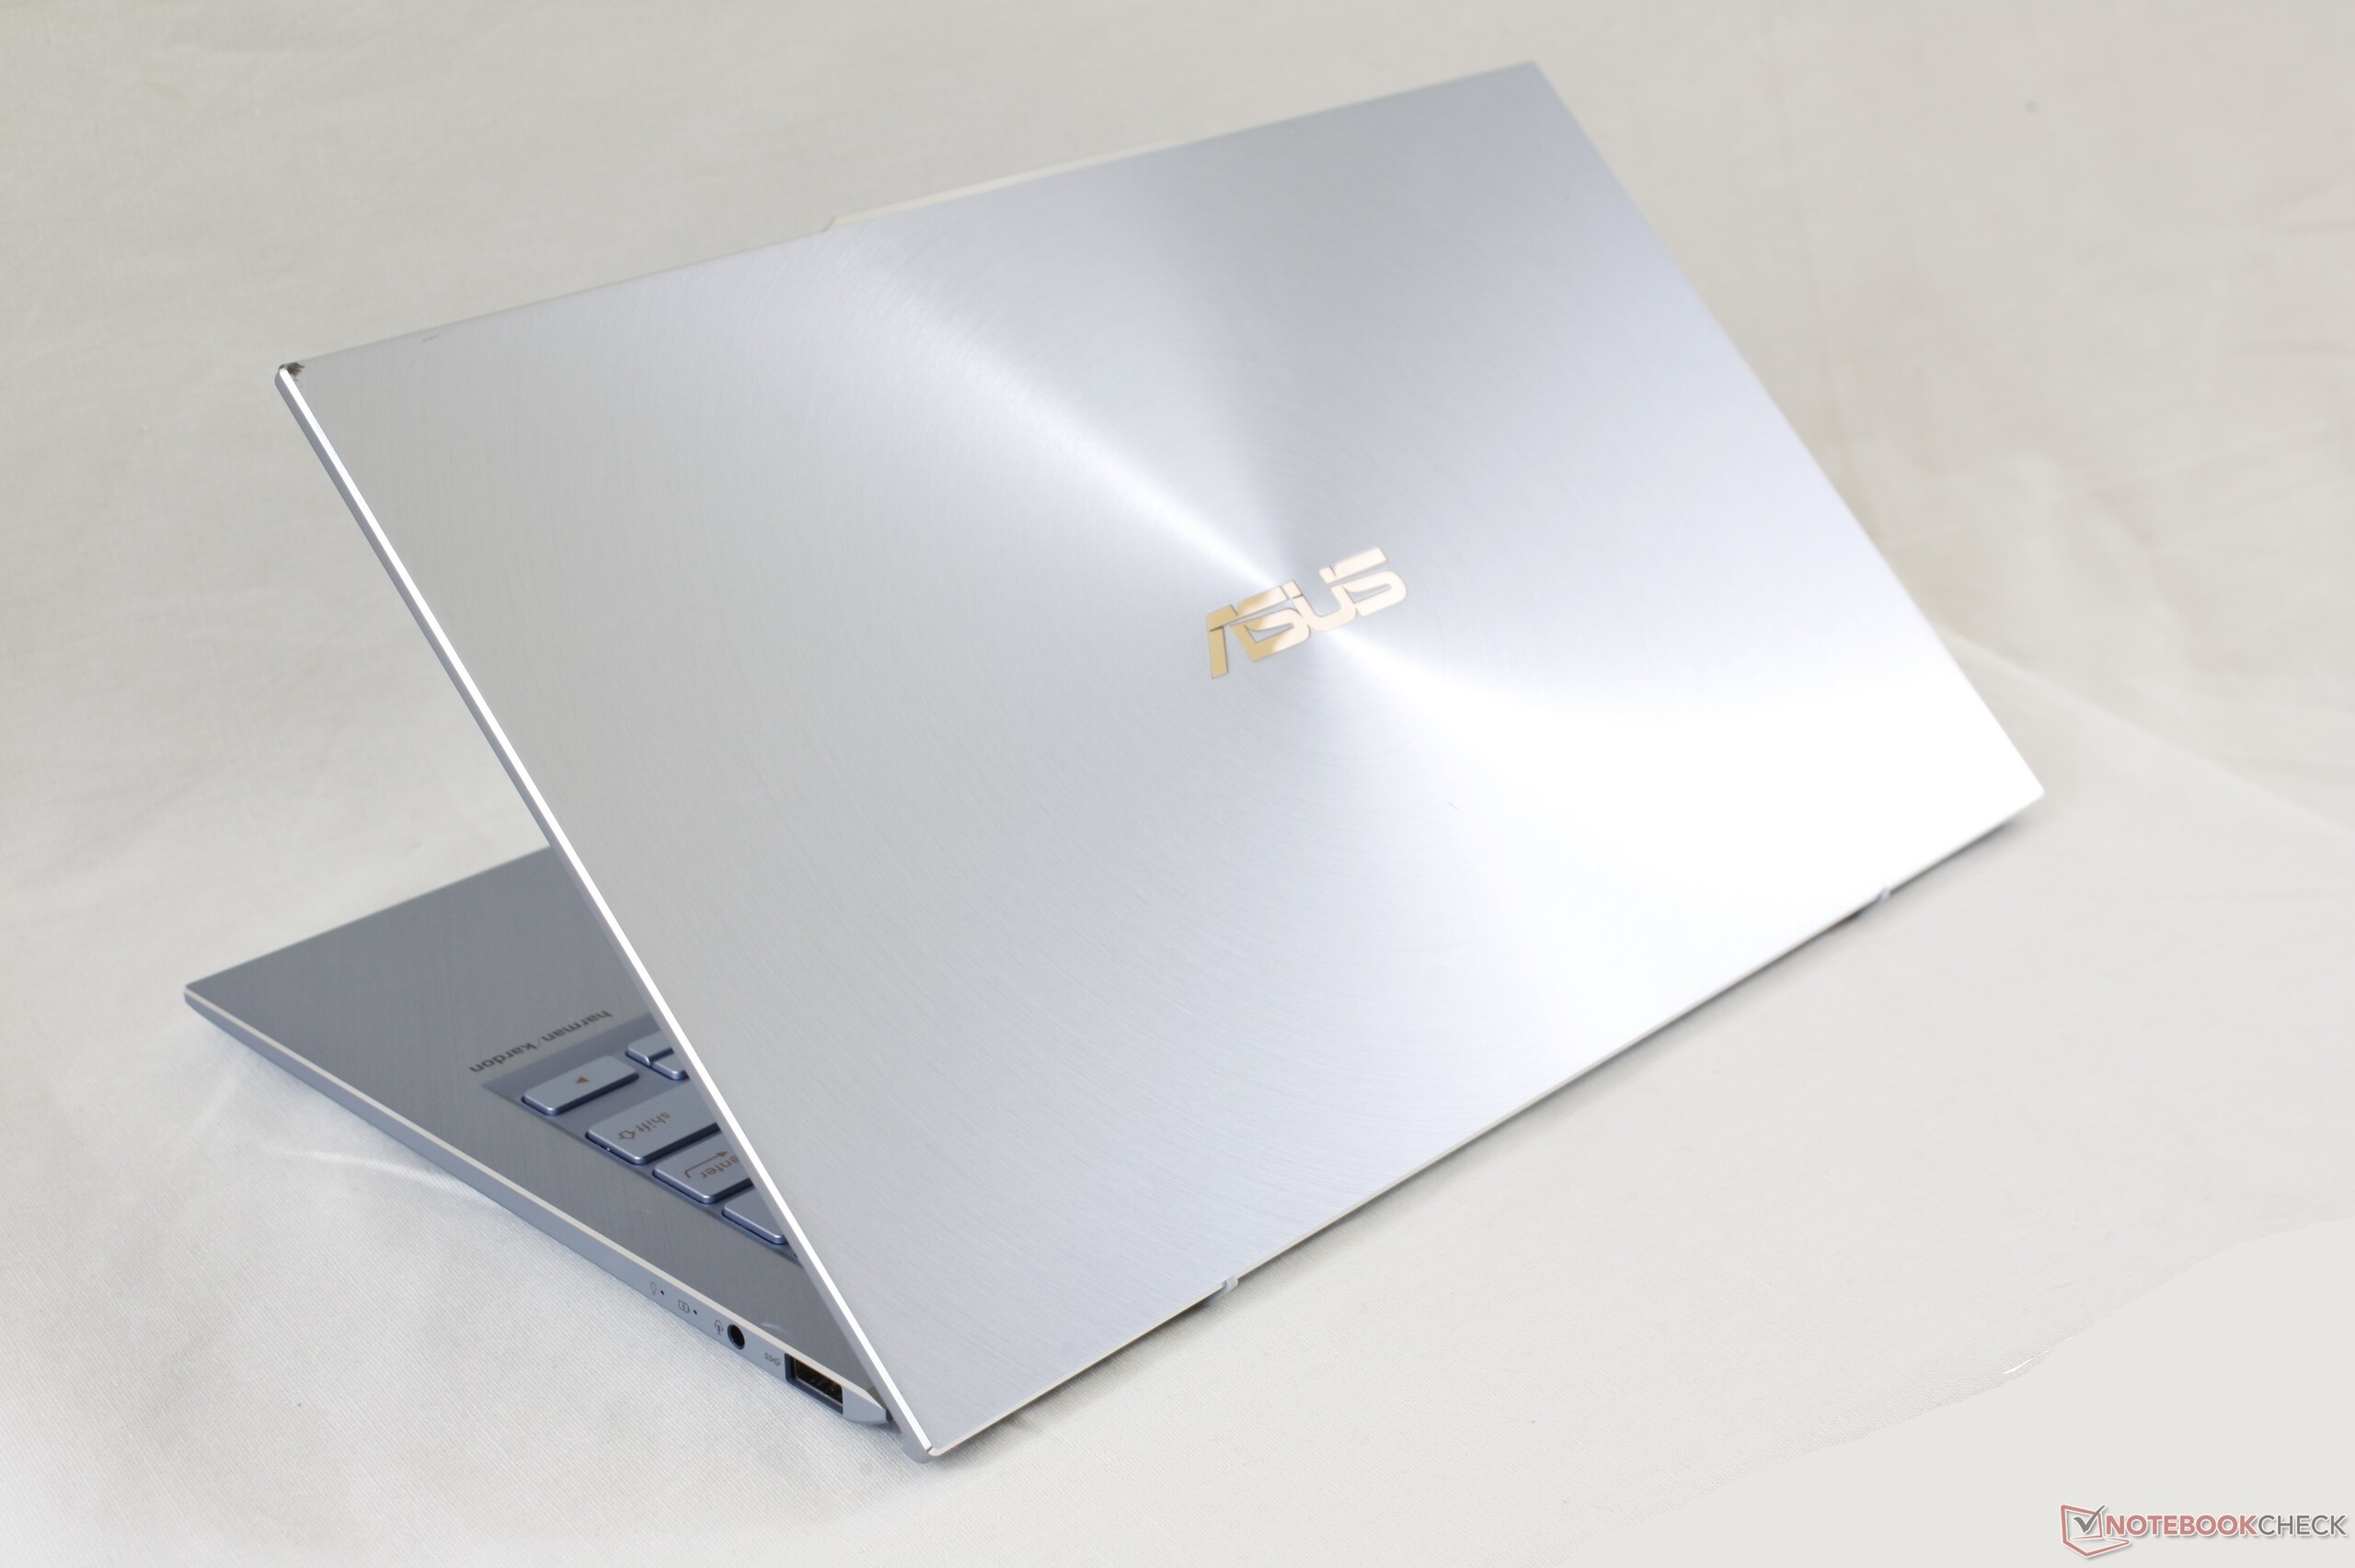
O Asus ZenBook S13 UX392 vem com muitas promessas. Ele supostamente tem os marcos mais finos do mundo, a maior relação tela-a-corpo do mundo e o design mais fino do mundo, com gráficos Nvidia discretos. Ao ter como alvo esses objetivos grandiosos, a Asus criou um de 13,9 polegadas que é mais leve ou menor do que muitos dos mais novos Ultrabooks de 13,3 polegadas no mercado, incluindo o O XPS 139380. ou HP Spectre 13. O UX392 ainda consegue ser mais graficamente capaz, pois não está limitado a gráficos UHD integrados, ao contrário da maioria dos Ultrabooks. O fato de que ele oferece uma tela maior com mais potência de GPU sem ser maior ou mais pesado, o torna uma recomendação extremamente atraente sobre as alternativas mencionadas acima.
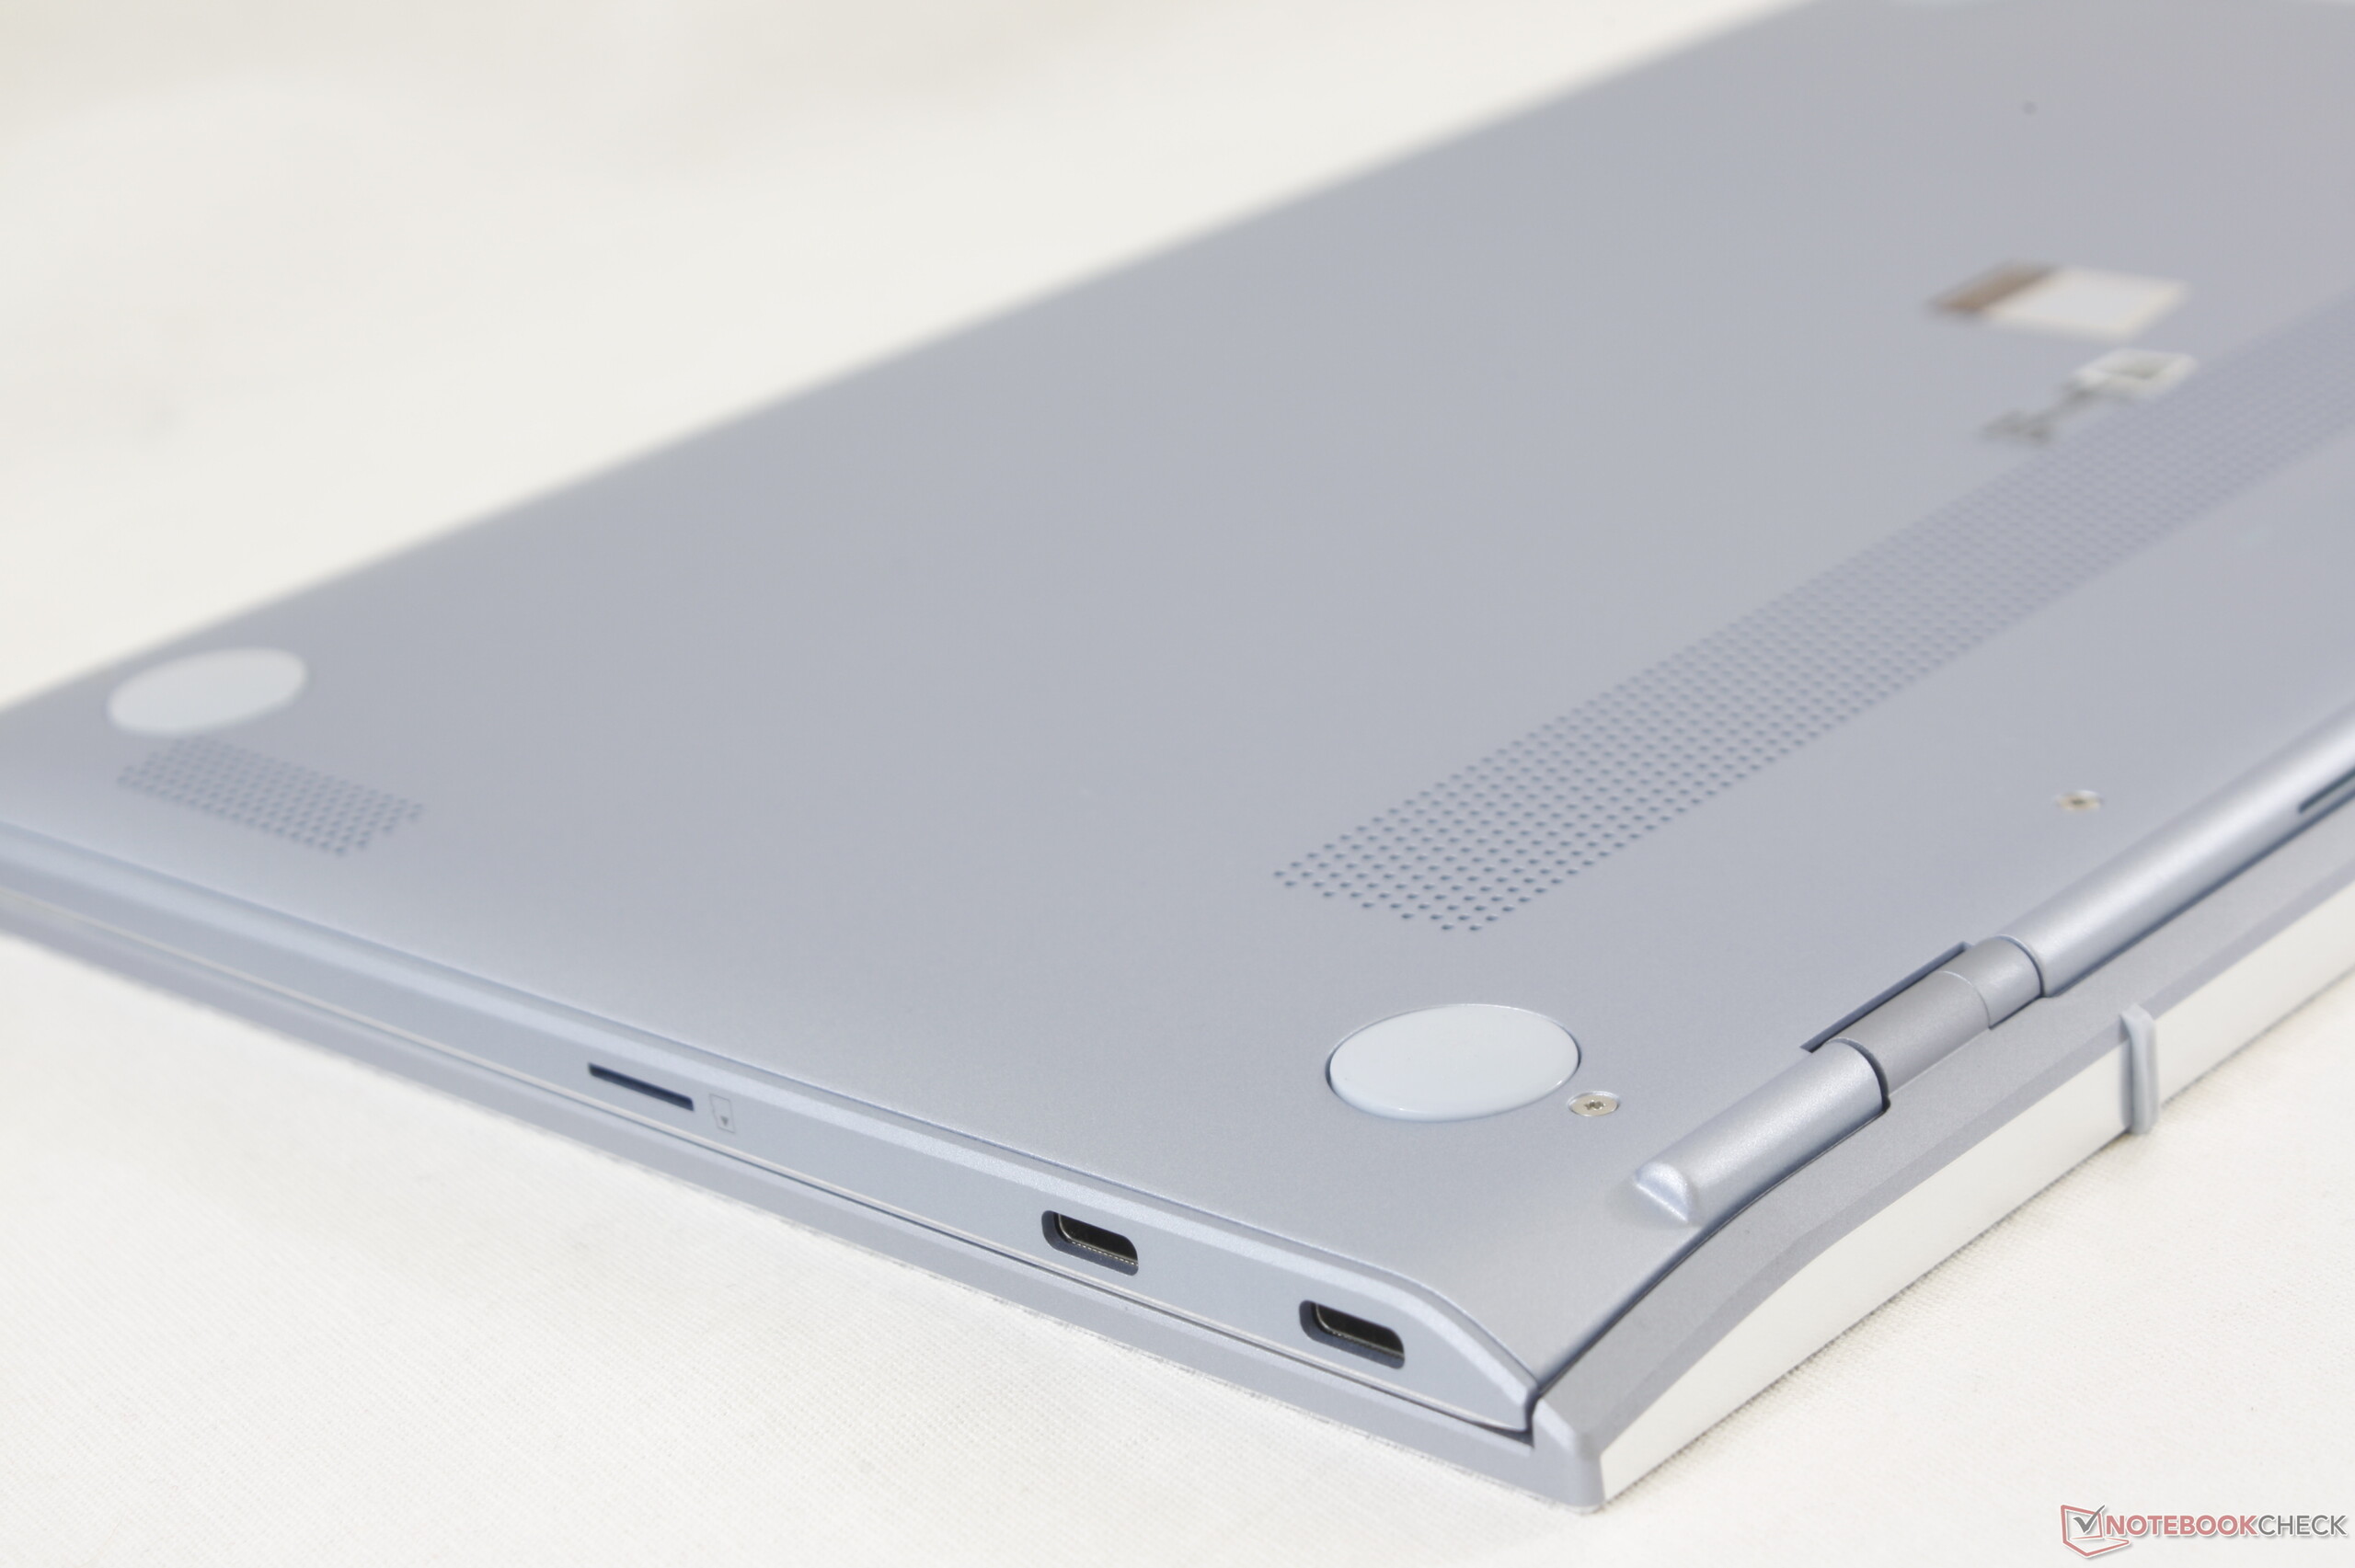
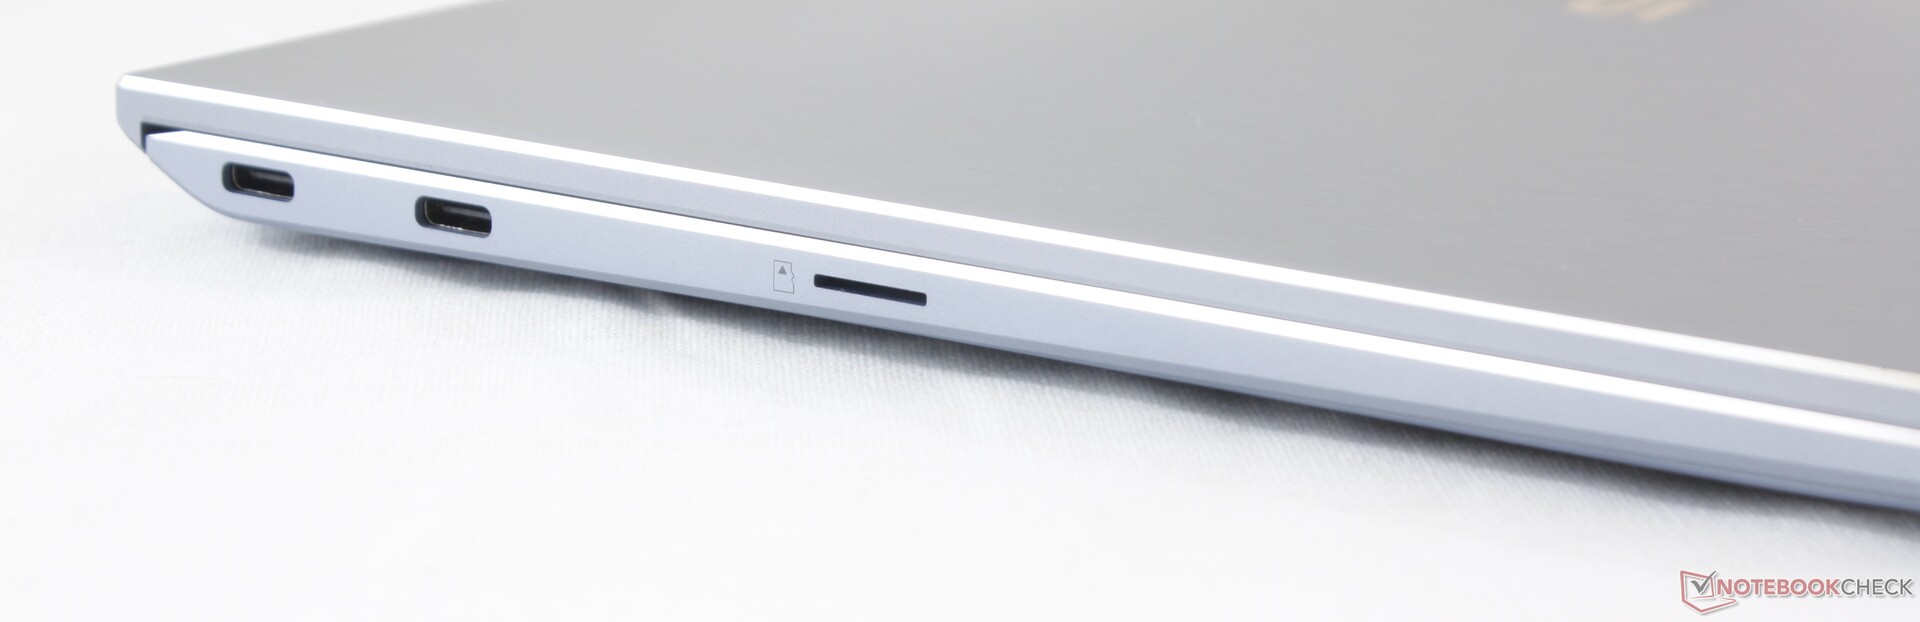
Há um punhado de desvantagens para se ter em mente. A ausência do Thunderbolt 3, por exemplo, significa que os usuários que desejarem conectar monitores externos 4K UHD ou usar estações dock eGPU estarão sem sorte. Enquanto isso, a GPU GeForce MX150 de 10W é consideravelmente mais lenta do que a versão de 25 W e a sustentabilidade do Turbo Boost da CPU é medíocre. Os concorrentes Huawei MateBook 13 e Razer Blade Stealth estão equipados com a mesma CPU e uma GPU mais rápida de 25 W para mostrar que a Asus pode se sair melhor no quesito de desempenho. O trackpad grudento também torna o controle do cursor menos fluente do que nos equivalentes da Dell e da HP.
Finalmente, há alguns cantos menores que vale a pena mencionar. As opções mínimas de atualização, o desempenho médio do MicroSD e o SSD PCIe x2, em vez do PCIe x4, são estranhas em um Ultrabook carro-chefe. Felizmente, isso não afeta o desempenho do dia a dia, a menos que você seja um grande defensor do Wi-Fi 6, recursos de tela táctil/WACOM, WWAN ou RAM expansível. Caso contrário, este é certamente um subportátil que deve estar no topo da lista de compras de todos.
Se você está prestes a comprar um Ultrabook de 13 polegadas, pare e dê uma olhada no Asus ZenBook S13 UX392. Há uma boa chance de que ele ofereça o que você está procurando, mas com uma tela maior e uma GPU mais rápida, ao mesmo tempo em que é pequeno e leve.
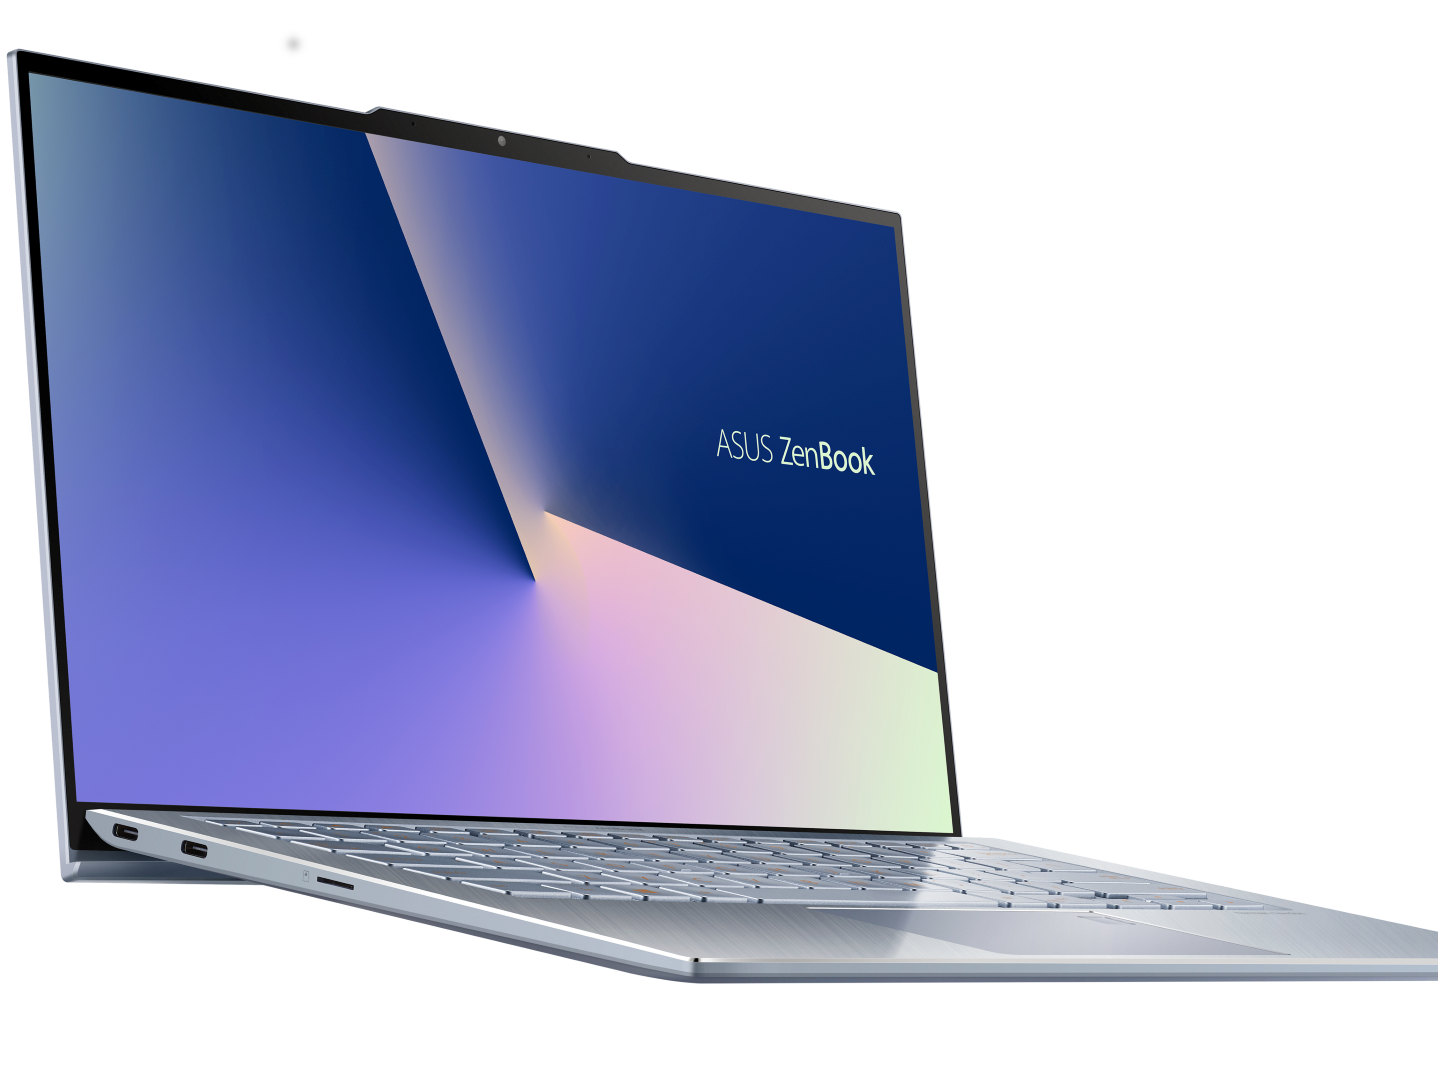
Asus ZenBook S13 UX392FN
- 05/01/2019 v6 (old)
Allen Ngo
Price comparison
