Breve Análise do Portátil Lenovo ThinkPad T14: A atualização Comet Lake não adiciona muito
Avaliação | Data | Modelo | Peso | Altura | Size | Resolução | Preço |
|---|---|---|---|---|---|---|---|
| 88 % v7 (old) | 07/2020 | Lenovo ThinkPad T14-20S1S06B00 i5-10210U, UHD Graphics 620 | 1.5 kg | 17.9 mm | 14.00" | 1920x1080 | |
| 87.9 % v7 (old) | 06/2019 | Lenovo ThinkPad T490-20N2004EGE i5-8265U, UHD Graphics 620 | 1.4 kg | 17.9 mm | 14.00" | 1920x1080 | |
| 87.2 % v7 (old) | 09/2019 | Dell Latitude 7400-8N6DH i7-8665U, UHD Graphics 620 | 1.5 kg | 18.9 mm | 14.00" | 1920x1080 | |
| 87.8 % v7 (old) | 06/2018 | HP EliteBook 840 G5-3JX61EA i5-8550U, UHD Graphics 620 | 1.5 kg | 17.9 mm | 14.00" | 1920x1080 | |
| 89.3 % v7 (old) | 05/2019 | Lenovo ThinkPad T490s-20NYS02A00 i5-8265U, UHD Graphics 620 | 1.3 kg | 16.1 mm | 14.00" | 1920x1080 |
| SD Card Reader | |
| average JPG Copy Test (av. of 3 runs) | |
| Dell Latitude 7400-8N6DH (Toshiba Exceria Pro M501 64 GB UHS-II) | |
| Lenovo ThinkPad T14-20S1S06B00 (Toshiba Exceria Pro M501 64 GB UHS-II) | |
| Lenovo ThinkPad T490 20RY0002US (Toshiba Exceria Pro M501 64 GB UHS-II) | |
| Lenovo ThinkPad T490s-20NYS02A00 (Toshiba Exceria Pro M501) | |
| Média da turma Office (19.8 - 198.5, n=22, últimos 2 anos) | |
| maximum AS SSD Seq Read Test (1GB) | |
| Dell Latitude 7400-8N6DH (Toshiba Exceria Pro M501 64 GB UHS-II) | |
| Lenovo ThinkPad T490s-20NYS02A00 (Toshiba Exceria Pro M501) | |
| Lenovo ThinkPad T490 20RY0002US (Toshiba Exceria Pro M501 64 GB UHS-II) | |
| Lenovo ThinkPad T14-20S1S06B00 (Toshiba Exceria Pro M501 64 GB UHS-II) | |
| Média da turma Office (27.4 - 249, n=21, últimos 2 anos) | |


| |||||||||||||||||||||||||
iluminação: 90 %
iluminação com acumulador: 398 cd/m²
Contraste: 1985:1 (Preto: 0.2 cd/m²)
ΔE ColorChecker Calman: 3.6 | ∀{0.5-29.43 Ø4.71}
calibrated: 1.2
ΔE Greyscale Calman: 3.9 | ∀{0.09-98 Ø4.96}
96.6% sRGB (Argyll 1.6.3 3D)
61.4% AdobeRGB 1998 (Argyll 1.6.3 3D)
67.1% AdobeRGB 1998 (Argyll 3D)
96.8% sRGB (Argyll 3D)
66% Display P3 (Argyll 3D)
Gamma: 2.48
CCT: 7090 K
| Lenovo ThinkPad T14-20S1S06B00 B140HAN05.7, LTPS IPS LED, 1920x1080, 14" | Lenovo ThinkPad T490-20N2004EGE NE140FHM-N61, IGZO IPS LED, 1920x1080, 14" | Dell Latitude 7400-8N6DH AU Optronics B140HAN, IPS, 1920x1080, 14" | HP EliteBook 840 G5-3JX61EA IVO M140NVF7 R0, IPS, 1920x1080, 14" | Lenovo ThinkPad T490s-20NYS02A00 B140HAN05.7, IPS, 1920x1080, 14" | |
|---|---|---|---|---|---|
| Display | 0% | -0% | -8% | 2% | |
| Display P3 Coverage (%) | 66 | 69.2 5% | 66.1 0% | 61 -8% | 67.1 2% |
| sRGB Coverage (%) | 96.8 | 92.3 -5% | 95.3 -2% | 87.7 -9% | 97.6 1% |
| AdobeRGB 1998 Coverage (%) | 67.1 | 67.6 1% | 67.5 1% | 62.1 -7% | 68.5 2% |
| Response Times | -46% | -24% | 23% | -26% | |
| Response Time Grey 50% / Grey 80% * (ms) | 58.4 ? | 71.2 ? -22% | 62 ? -6% | 33 ? 43% | 61.6 ? -5% |
| Response Time Black / White * (ms) | 26.4 ? | 44.8 ? -70% | 37.6 ? -42% | 26 ? 2% | 38.8 ? -47% |
| PWM Frequency (Hz) | 2427 ? | 3125 ? | |||
| Screen | -22% | -18% | -22% | -0% | |
| Brightness middle (cd/m²) | 397 | 428 8% | 289 -27% | 655 65% | 391 -2% |
| Brightness (cd/m²) | 394 | 409 4% | 286 -27% | 630 60% | 389 -1% |
| Brightness Distribution (%) | 90 | 91 1% | 91 1% | 93 3% | 87 -3% |
| Black Level * (cd/m²) | 0.2 | 0.29 -45% | 0.16 20% | 0.56 -180% | 0.23 -15% |
| Contrast (:1) | 1985 | 1476 -26% | 1806 -9% | 1170 -41% | 1700 -14% |
| Colorchecker dE 2000 * | 3.6 | 4.6 -28% | 4.7 -31% | 3.27 9% | 3.4 6% |
| Colorchecker dE 2000 max. * | 5.9 | 8.2 -39% | 8.7 -47% | 5.92 -0% | 4.7 20% |
| Colorchecker dE 2000 calibrated * | 1.2 | 2 -67% | 1.3 -8% | 3.22 -168% | 1.1 8% |
| Greyscale dE 2000 * | 3.9 | 5.4 -38% | 6.4 -64% | 2.85 27% | 4 -3% |
| Gamma | 2.48 89% | 2.09 105% | 2.54 87% | 2.45 90% | 2.49 88% |
| CCT | 7090 92% | 7562 86% | 5977 109% | 6065 107% | 6809 95% |
| Color Space (Percent of AdobeRGB 1998) (%) | 61.4 | 60 -2% | 61.2 0% | 57 -7% | 62.4 2% |
| Color Space (Percent of sRGB) (%) | 96.6 | 92.2 -5% | 95.1 -2% | 88 -9% | 97.4 1% |
| Média Total (Programa/Configurações) | -23% /
-21% | -14% /
-15% | -2% /
-14% | -8% /
-3% |
* ... menor é melhor
Exibir tempos de resposta
| ↔ Tempo de resposta preto para branco | ||
|---|---|---|
| 26.4 ms ... ascensão ↗ e queda ↘ combinadas | ↗ 12.4 ms ascensão | 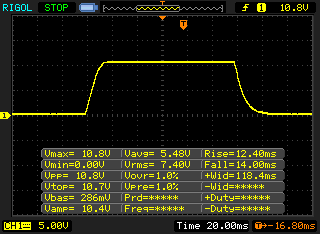 |
| ↘ 14 ms queda | ||
| A tela mostra taxas de resposta relativamente lentas em nossos testes e pode ser muito lenta para os jogadores. Em comparação, todos os dispositivos testados variam de 0.1 (mínimo) a 240 (máximo) ms. » 66 % de todos os dispositivos são melhores. Isso significa que o tempo de resposta medido é pior que a média de todos os dispositivos testados (19.8 ms). | ||
| ↔ Tempo de resposta 50% cinza a 80% cinza | ||
| 58.4 ms ... ascensão ↗ e queda ↘ combinadas | ↗ 28.4 ms ascensão | 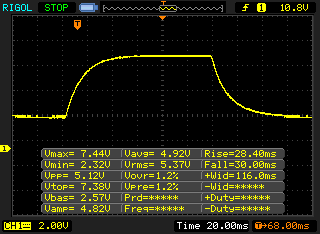 |
| ↘ 30 ms queda | ||
| A tela mostra taxas de resposta lentas em nossos testes e será insatisfatória para os jogadores. Em comparação, todos os dispositivos testados variam de 0.165 (mínimo) a 636 (máximo) ms. » 95 % de todos os dispositivos são melhores. Isso significa que o tempo de resposta medido é pior que a média de todos os dispositivos testados (31 ms). | ||
Cintilação da tela / PWM (modulação por largura de pulso)
| Tela tremeluzindo / PWM não detectado | 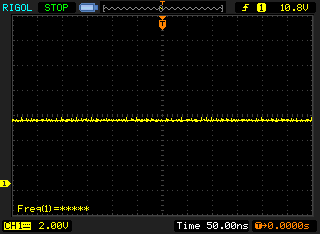 | ||
[pwm_comparison] Em comparação: 52 % de todos os dispositivos testados não usam PWM para escurecer a tela. Se PWM foi detectado, uma média de 7757 (mínimo: 5 - máximo: 343500) Hz foi medida. | |||
Cinebench R20: CPU (Multi Core) | CPU (Single Core)
Blender: v2.79 BMW27 CPU
7-Zip 18.03: 7z b 4 -mmt1 | 7z b 4
Geekbench 5.5: Single-Core | Multi-Core
HWBOT x265 Benchmark v2.2: 4k Preset
LibreOffice : 20 Documents To PDF
R Benchmark 2.5: Overall mean
| Cinebench R15 / CPU Multi 64Bit | |
| Média da turma Office (250 - 3380, n=77, últimos 2 anos) | |
| Lenovo ThinkPad T14-20S1S06B00 | |
| Lenovo ThinkPad T490s-20NYS02A00 | |
| Dell Latitude 7400-8N6DH | |
| Lenovo ThinkPad T490 20RY0002US | |
| Lenovo ThinkPad T490-20N2004EGE | |
| Média Intel Core i5-10210U (320 - 790, n=35) | |
| HP EliteBook 840 G5-3JX61EA | |
| Cinebench R15 / CPU Single 64Bit | |
| Média da turma Office (99.5 - 316, n=77, últimos 2 anos) | |
| Lenovo ThinkPad T490 20RY0002US | |
| Dell Latitude 7400-8N6DH | |
| HP EliteBook 840 G5-3JX61EA | |
| Lenovo ThinkPad T14-20S1S06B00 | |
| Média Intel Core i5-10210U (134 - 174, n=35) | |
| Lenovo ThinkPad T490-20N2004EGE | |
| Lenovo ThinkPad T490s-20NYS02A00 | |
| Cinebench R20 / CPU (Multi Core) | |
| Média da turma Office (648 - 8840, n=75, últimos 2 anos) | |
| Lenovo ThinkPad T490 20RY0002US | |
| Lenovo ThinkPad T490s-20NYS02A00 | |
| Dell Latitude 7400-8N6DH | |
| Lenovo ThinkPad T490-20N2004EGE | |
| Lenovo ThinkPad T14-20S1S06B00 | |
| Média Intel Core i5-10210U (722 - 1820, n=30) | |
| Cinebench R20 / CPU (Single Core) | |
| Média da turma Office (345 - 816, n=75, últimos 2 anos) | |
| Lenovo ThinkPad T490 20RY0002US | |
| Dell Latitude 7400-8N6DH | |
| Lenovo ThinkPad T14-20S1S06B00 | |
| Média Intel Core i5-10210U (322 - 428, n=30) | |
| Lenovo ThinkPad T490s-20NYS02A00 | |
| Lenovo ThinkPad T490-20N2004EGE | |
| Blender / v2.79 BMW27 CPU | |
| Lenovo ThinkPad T490-20N2004EGE | |
| Média Intel Core i5-10210U (585 - 1339, n=24) | |
| Lenovo ThinkPad T14-20S1S06B00 | |
| Lenovo ThinkPad T490s-20NYS02A00 | |
| Dell Latitude 7400-8N6DH | |
| Média da turma Office (158 - 1940, n=76, últimos 2 anos) | |
| 7-Zip 18.03 / 7z b 4 -mmt1 | |
| Média da turma Office (3387 - 6469, n=77, últimos 2 anos) | |
| Dell Latitude 7400-8N6DH | |
| Lenovo ThinkPad T14-20S1S06B00 | |
| Média Intel Core i5-10210U (3504 - 4467, n=24) | |
| Lenovo ThinkPad T490s-20NYS02A00 | |
| Lenovo ThinkPad T490-20N2004EGE | |
| 7-Zip 18.03 / 7z b 4 | |
| Média da turma Office (7098 - 76886, n=77, últimos 2 anos) | |
| Lenovo ThinkPad T490s-20NYS02A00 | |
| Dell Latitude 7400-8N6DH | |
| Lenovo ThinkPad T14-20S1S06B00 | |
| Média Intel Core i5-10210U (10920 - 21679, n=24) | |
| Lenovo ThinkPad T490-20N2004EGE | |
| Geekbench 5.5 / Single-Core | |
| Média da turma Office (811 - 2175, n=73, últimos 2 anos) | |
| Média Intel Core i5-10210U (949 - 1133, n=27) | |
| Lenovo ThinkPad T14-20S1S06B00 | |
| Geekbench 5.5 / Multi-Core | |
| Média da turma Office (1483 - 16999, n=73, últimos 2 anos) | |
| Média Intel Core i5-10210U (2079 - 4256, n=27) | |
| Lenovo ThinkPad T14-20S1S06B00 | |
| HWBOT x265 Benchmark v2.2 / 4k Preset | |
| Média da turma Office (2.21 - 26, n=76, últimos 2 anos) | |
| Lenovo ThinkPad T490s-20NYS02A00 | |
| Dell Latitude 7400-8N6DH | |
| Lenovo ThinkPad T14-20S1S06B00 | |
| Média Intel Core i5-10210U (2.36 - 6.28, n=24) | |
| Lenovo ThinkPad T490-20N2004EGE | |
| LibreOffice / 20 Documents To PDF | |
| Média Intel Core i5-10210U (49.6 - 80.3, n=18) | |
| Lenovo ThinkPad T14-20S1S06B00 | |
| Média da turma Office (39.9 - 102.3, n=76, últimos 2 anos) | |
| R Benchmark 2.5 / Overall mean | |
| Média Intel Core i5-10210U (0.658 - 0.901, n=24) | |
| Lenovo ThinkPad T14-20S1S06B00 | |
| Média da turma Office (0.393 - 0.888, n=76, últimos 2 anos) | |
* ... menor é melhor
| PCMark 8 Home Score Accelerated v2 | 3544 pontos | |
| PCMark 8 Work Score Accelerated v2 | 5042 pontos | |
| PCMark 10 Score | 3932 pontos | |
Ajuda | ||
| DPC Latencies / LatencyMon - interrupt to process latency (max), Web, Youtube, Prime95 | |
| Lenovo ThinkPad T14-20S1S06B00 | |
* ... menor é melhor
| Lenovo ThinkPad T14-20S1S06B00 Lite-On CA5-8D512 | Lenovo ThinkPad T490-20N2004EGE Toshiba KXG5AZNV256G | Dell Latitude 7400-8N6DH Samsung SSD PM981 MZVLB512HAJQ | HP EliteBook 840 G5-3JX61EA Toshiba KXG50ZNV1T02 | Lenovo ThinkPad T490s-20NYS02A00 Intel SSD Pro 7600p SSDPEKKF512G8L | Média Lite-On CA5-8D512 | |
|---|---|---|---|---|---|---|
| CrystalDiskMark 5.2 / 6 | -16% | -3% | -23% | -12% | 13% | |
| Write 4K (MB/s) | 114.1 | 119.9 5% | 118.6 4% | 96.1 -16% | 122 7% | 132.9 ? 16% |
| Read 4K (MB/s) | 53.6 | 39.94 -25% | 44.68 -17% | 31.12 -42% | 45.56 -15% | 55 ? 3% |
| Write Seq (MB/s) | 1743 | 1334 -23% | 1866 7% | 919 -47% | 1497 -14% | 2155 ? 24% |
| Read Seq (MB/s) | 2092 | 1357 -35% | 2173 4% | 2089 0% | 2385 14% | 2264 ? 8% |
| Write 4K Q32T1 (MB/s) | 394.8 | 311.2 -21% | 330.9 -16% | 425.6 8% | 240.9 -39% | 470 ? 19% |
| Read 4K Q32T1 (MB/s) | 372.6 | 400.6 8% | 343.1 -8% | 275.3 -26% | 338 -9% | 500 ? 34% |
| Write Seq Q32T1 (MB/s) | 2176 | 1642 -25% | 1927 -11% | 958 -56% | 1528 -30% | 2217 ? 2% |
| Read Seq Q32T1 (MB/s) | 3204 | 2778 -13% | 3528 10% | 3118 -3% | 2915 -9% | 3228 ? 1% |

| 3DMark 11 Performance | 1926 pontos | |
| 3DMark Cloud Gate Standard Score | 7581 pontos | |
| 3DMark Fire Strike Score | 963 pontos | |
| 3DMark Time Spy Score | 410 pontos | |
Ajuda | ||
| baixo | média | alto | ultra | |
|---|---|---|---|---|
| The Witcher 3 (2015) | 15.5 | |||
| Dota 2 Reborn (2015) | 69.4 | 39.1 | 18.8 | 16.2 |
| X-Plane 11.11 (2018) | 12.8 | 11 | 10.8 | |
| Shadow of the Tomb Raider (2018) | 13 | |||
| Total War: Three Kingdoms (2019) | 23.7 |
Barulho
| Ocioso |
| 29.6 / 29.6 / 29.6 dB |
| Carga |
| 33.5 / 33.5 dB |
 | ||
30 dB silencioso 40 dB(A) audível 50 dB(A) ruidosamente alto |
||
min: | ||
(-) A temperatura máxima no lado superior é 53 °C / 127 F, em comparação com a média de 34.3 °C / 94 F , variando de 21.2 a 62.5 °C para a classe Office.
(-) A parte inferior aquece até um máximo de 67.2 °C / 153 F, em comparação com a média de 36.8 °C / 98 F
(+) Em uso inativo, a temperatura média para o lado superior é 25.4 °C / 78 F, em comparação com a média do dispositivo de 29.5 °C / ### class_avg_f### F.
(+) Os apoios para as mãos e o touchpad estão atingindo a temperatura máxima da pele (34.7 °C / 94.5 F) e, portanto, não estão quentes.
(-) A temperatura média da área do apoio para as mãos de dispositivos semelhantes foi 27.5 °C / 81.5 F (-7.2 °C / -13 F).
Lenovo ThinkPad T14-20S1S06B00 análise de áudio
(-) | alto-falantes não muito altos (###valor### dB)
Graves 100 - 315Hz
(±) | graves reduzidos - em média 12.6% menor que a mediana
(±) | a linearidade dos graves é média (12.5% delta para a frequência anterior)
Médios 400 - 2.000 Hz
(±) | médios mais altos - em média 7.7% maior que a mediana
(+) | médios são lineares (6.7% delta para frequência anterior)
Altos 2 - 16 kHz
(+) | agudos equilibrados - apenas 2.9% longe da mediana
(+) | os máximos são lineares (5.8% delta da frequência anterior)
Geral 100 - 16.000 Hz
(±) | a linearidade do som geral é média (24.5% diferença em relação à mediana)
Comparado com a mesma classe
» 71% de todos os dispositivos testados nesta classe foram melhores, 8% semelhantes, 21% piores
» O melhor teve um delta de 7%, a média foi 21%, o pior foi 53%
Comparado com todos os dispositivos testados
» 74% de todos os dispositivos testados foram melhores, 6% semelhantes, 20% piores
» O melhor teve um delta de 4%, a média foi 23%, o pior foi 134%
Lenovo ThinkPad T490-20N3S02L00 análise de áudio
(-) | alto-falantes não muito altos (###valor### dB)
Graves 100 - 315Hz
(-) | quase nenhum baixo - em média 20.8% menor que a mediana
(±) | a linearidade dos graves é média (8.7% delta para a frequência anterior)
Médios 400 - 2.000 Hz
(±) | médios mais altos - em média 5.5% maior que a mediana
(±) | a linearidade dos médios é média (8.8% delta para frequência anterior)
Altos 2 - 16 kHz
(+) | agudos equilibrados - apenas 3.4% longe da mediana
(±) | a linearidade dos máximos é média (7.3% delta para frequência anterior)
Geral 100 - 16.000 Hz
(±) | a linearidade do som geral é média (28.9% diferença em relação à mediana)
Comparado com a mesma classe
» 90% de todos os dispositivos testados nesta classe foram melhores, 2% semelhantes, 8% piores
» O melhor teve um delta de 7%, a média foi 21%, o pior foi 53%
Comparado com todos os dispositivos testados
» 87% de todos os dispositivos testados foram melhores, 2% semelhantes, 11% piores
» O melhor teve um delta de 4%, a média foi 23%, o pior foi 134%
| desligado | |
| Ocioso | |
| Carga |
|
Key:
min: | |
| Lenovo ThinkPad T14-20S1S06B00 i5-10210U, UHD Graphics 620, Lite-On CA5-8D512, LTPS IPS LED, 1920x1080, 14" | Lenovo ThinkPad T490-20N2004EGE i5-8265U, UHD Graphics 620, Toshiba KXG5AZNV256G, IGZO IPS LED, 1920x1080, 14" | Dell Latitude 7400-8N6DH i7-8665U, UHD Graphics 620, Samsung SSD PM981 MZVLB512HAJQ, IPS, 1920x1080, 14" | HP EliteBook 840 G5-3JX61EA i5-8550U, UHD Graphics 620, Toshiba KXG50ZNV1T02, IPS, 1920x1080, 14" | Lenovo ThinkPad T490s-20NYS02A00 i5-8265U, UHD Graphics 620, Intel SSD Pro 7600p SSDPEKKF512G8L, IPS, 1920x1080, 14" | Média Intel UHD Graphics 620 | Média da turma Office | |
|---|---|---|---|---|---|---|---|
| Power Consumption | 22% | 1% | 2% | 14% | 7% | -5% | |
| Idle Minimum * (Watt) | 3.2 | 2.34 27% | 3.9 -22% | 3.8 -19% | 2.62 18% | 3.81 ? -19% | 4.26 ? -33% |
| Idle Average * (Watt) | 6.1 | 5.22 14% | 6.1 -0% | 8.3 -36% | 5.16 15% | 6.94 ? -14% | 7.31 ? -20% |
| Idle Maximum * (Watt) | 10.4 | 8.82 15% | 8.2 21% | 10.7 -3% | 8.7 16% | 8.75 ? 16% | 8.55 ? 18% |
| Load Average * (Watt) | 45.6 | 35.8 21% | 41 10% | 35.5 22% | 40 12% | 35 ? 23% | 43.8 ? 4% |
| Load Maximum * (Watt) | 68.6 | 47.3 31% | 69.7 -2% | 37 46% | 64 7% | 47.5 ? 31% | 64.5 ? 6% |
* ... menor é melhor
| Lenovo ThinkPad T14-20S1S06B00 i5-10210U, UHD Graphics 620, 50 Wh | Lenovo ThinkPad T490-20N2004EGE i5-8265U, UHD Graphics 620, 50 Wh | Dell Latitude 7400-8N6DH i7-8665U, UHD Graphics 620, 60 Wh | HP EliteBook 840 G5-3JX61EA i5-8550U, UHD Graphics 620, 50 Wh | Lenovo ThinkPad T490s-20NYS02A00 i5-8265U, UHD Graphics 620, 57 Wh | Média da turma Office | |
|---|---|---|---|---|---|---|
| Duração da bateria | 34% | 43% | -33% | 19% | 36% | |
| H.264 (h) | 10.4 | 11.3 9% | 14.4 38% | 13.9 34% | 15.5 ? 49% | |
| WiFi v1.3 (h) | 11 | 9.5 -14% | 11.6 5% | 7.4 -33% | 10.1 -8% | 13.2 ? 20% |
| Load (h) | 1.3 | 2.7 108% | 2.4 85% | 1.7 31% | 1.808 ? 39% |
Pro
Contra
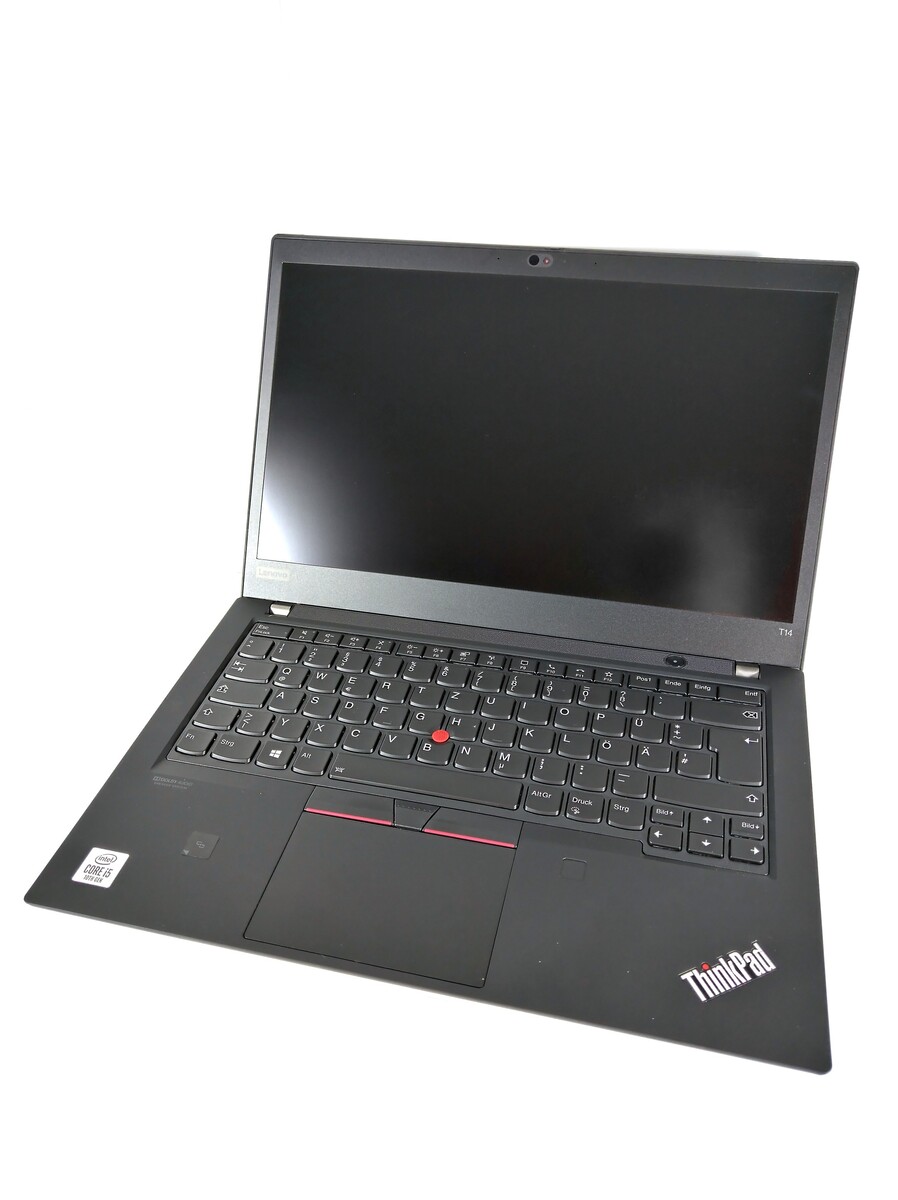

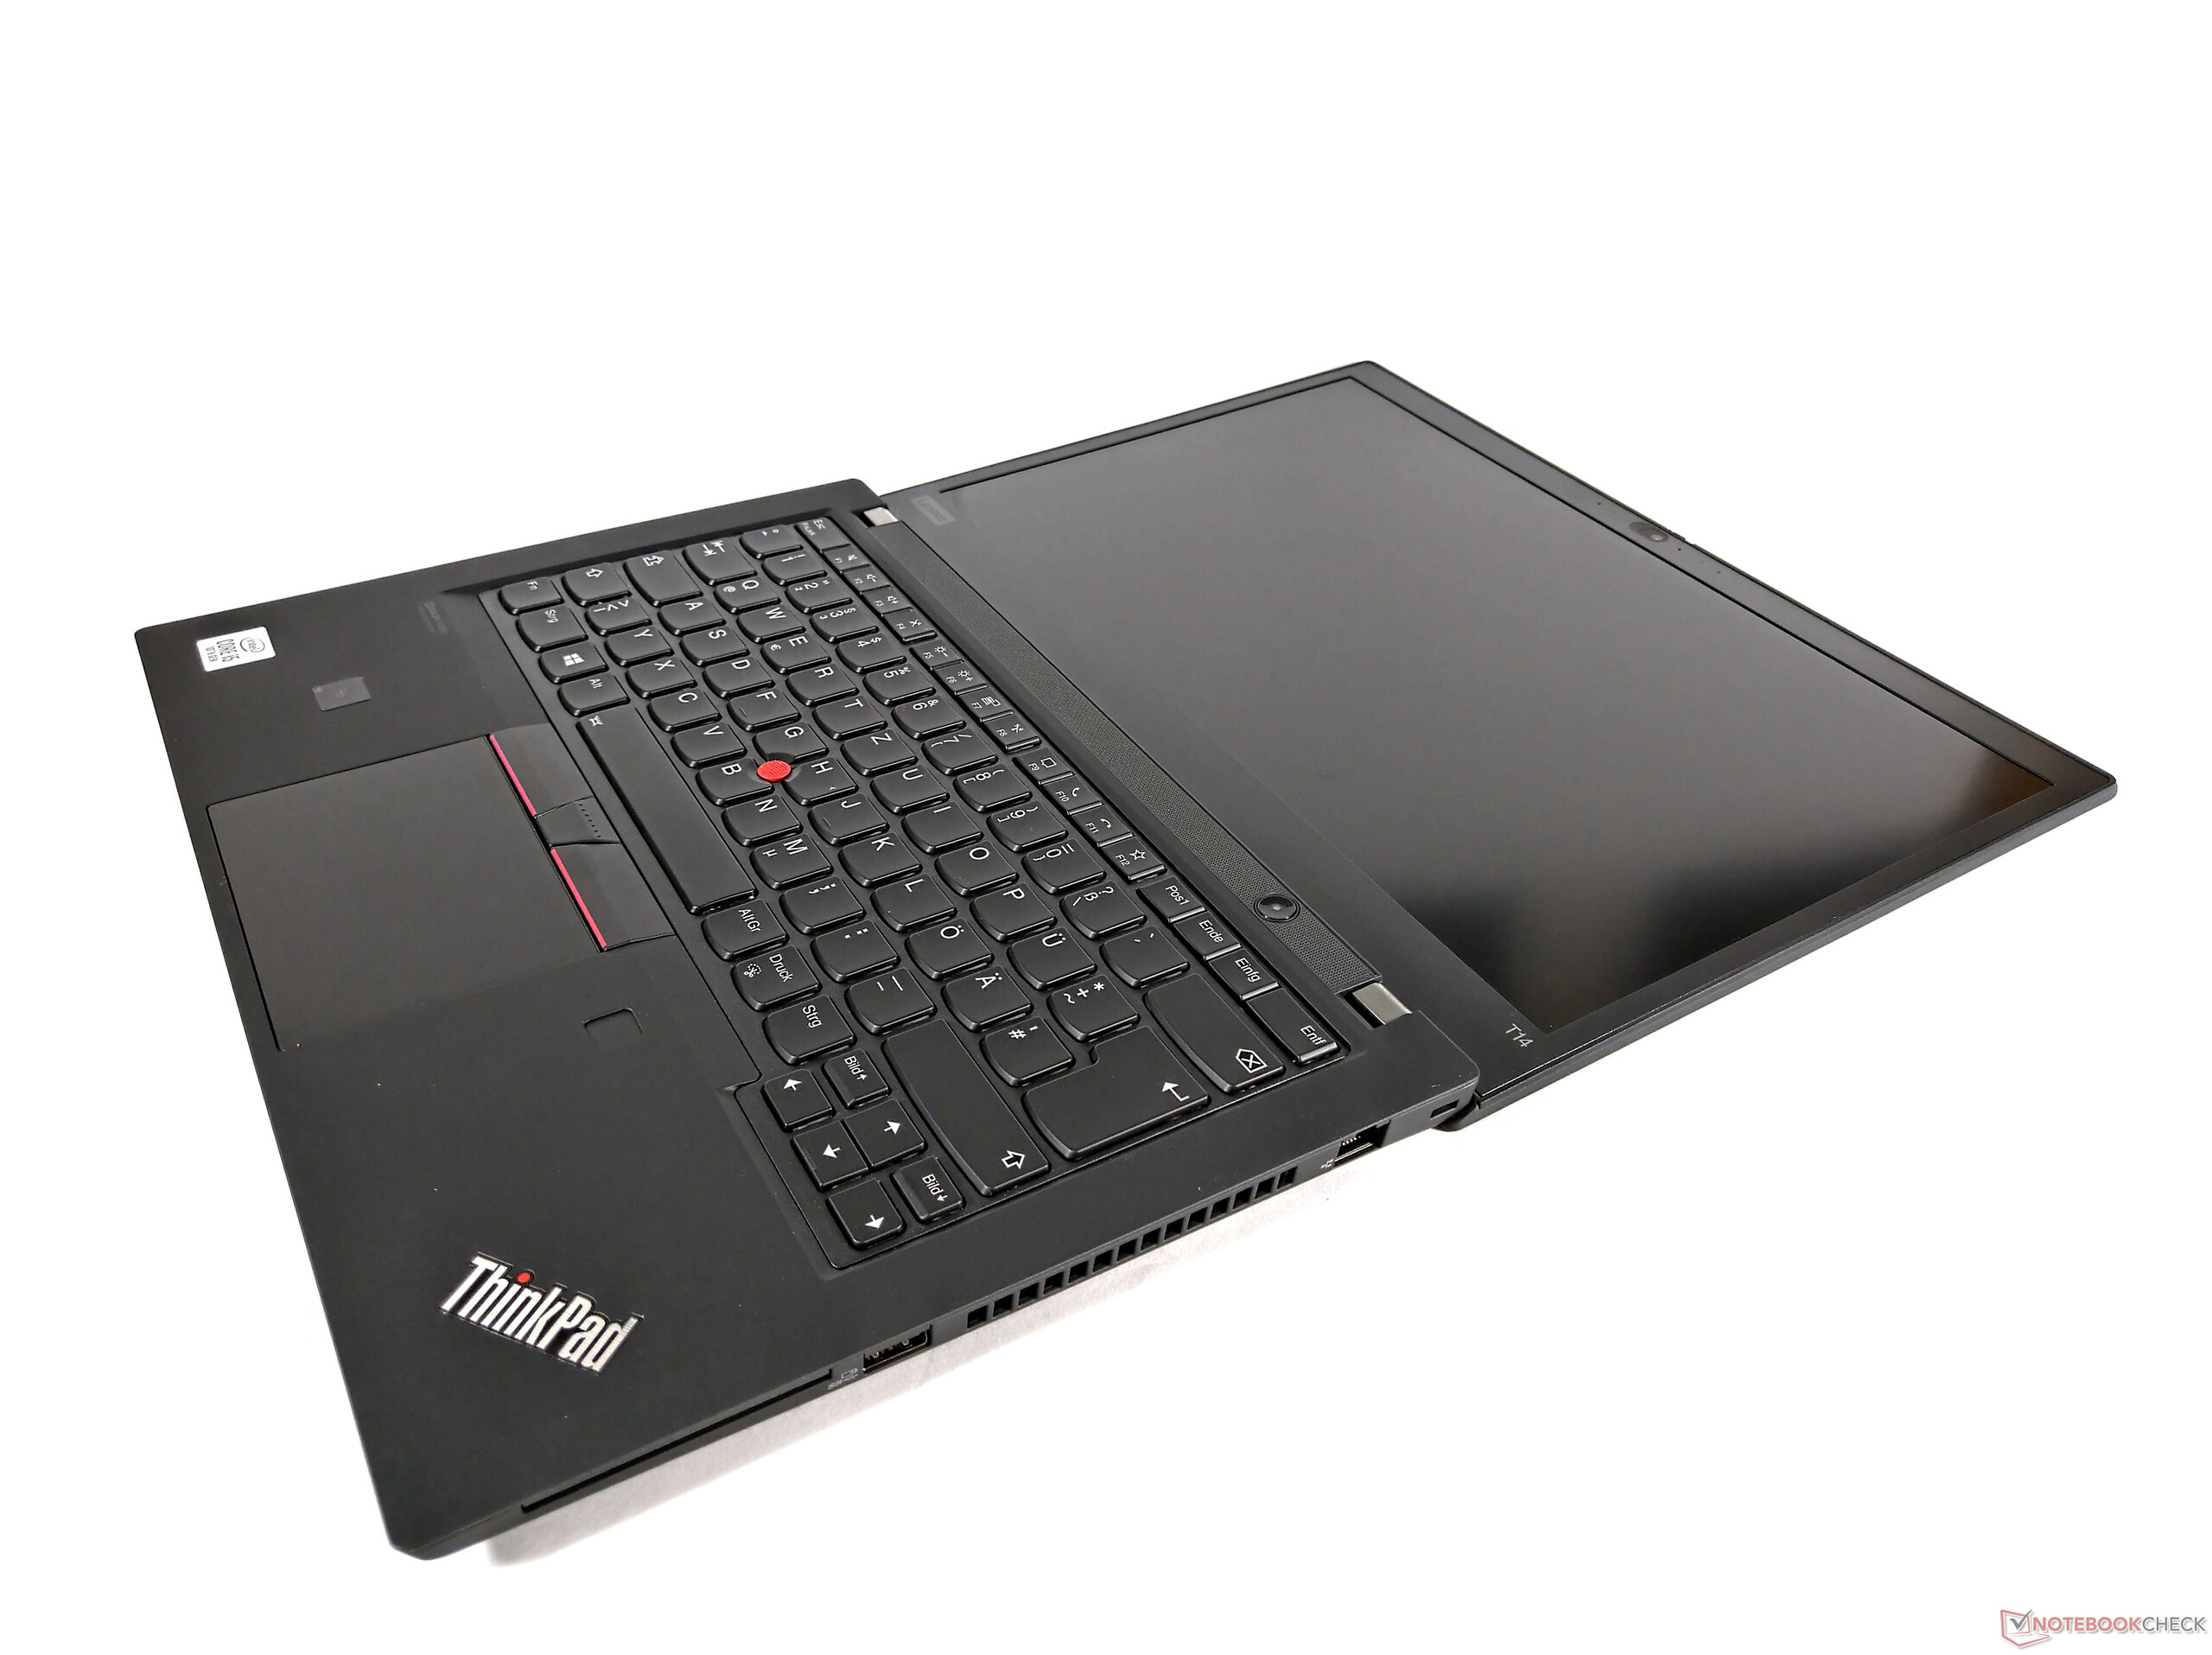
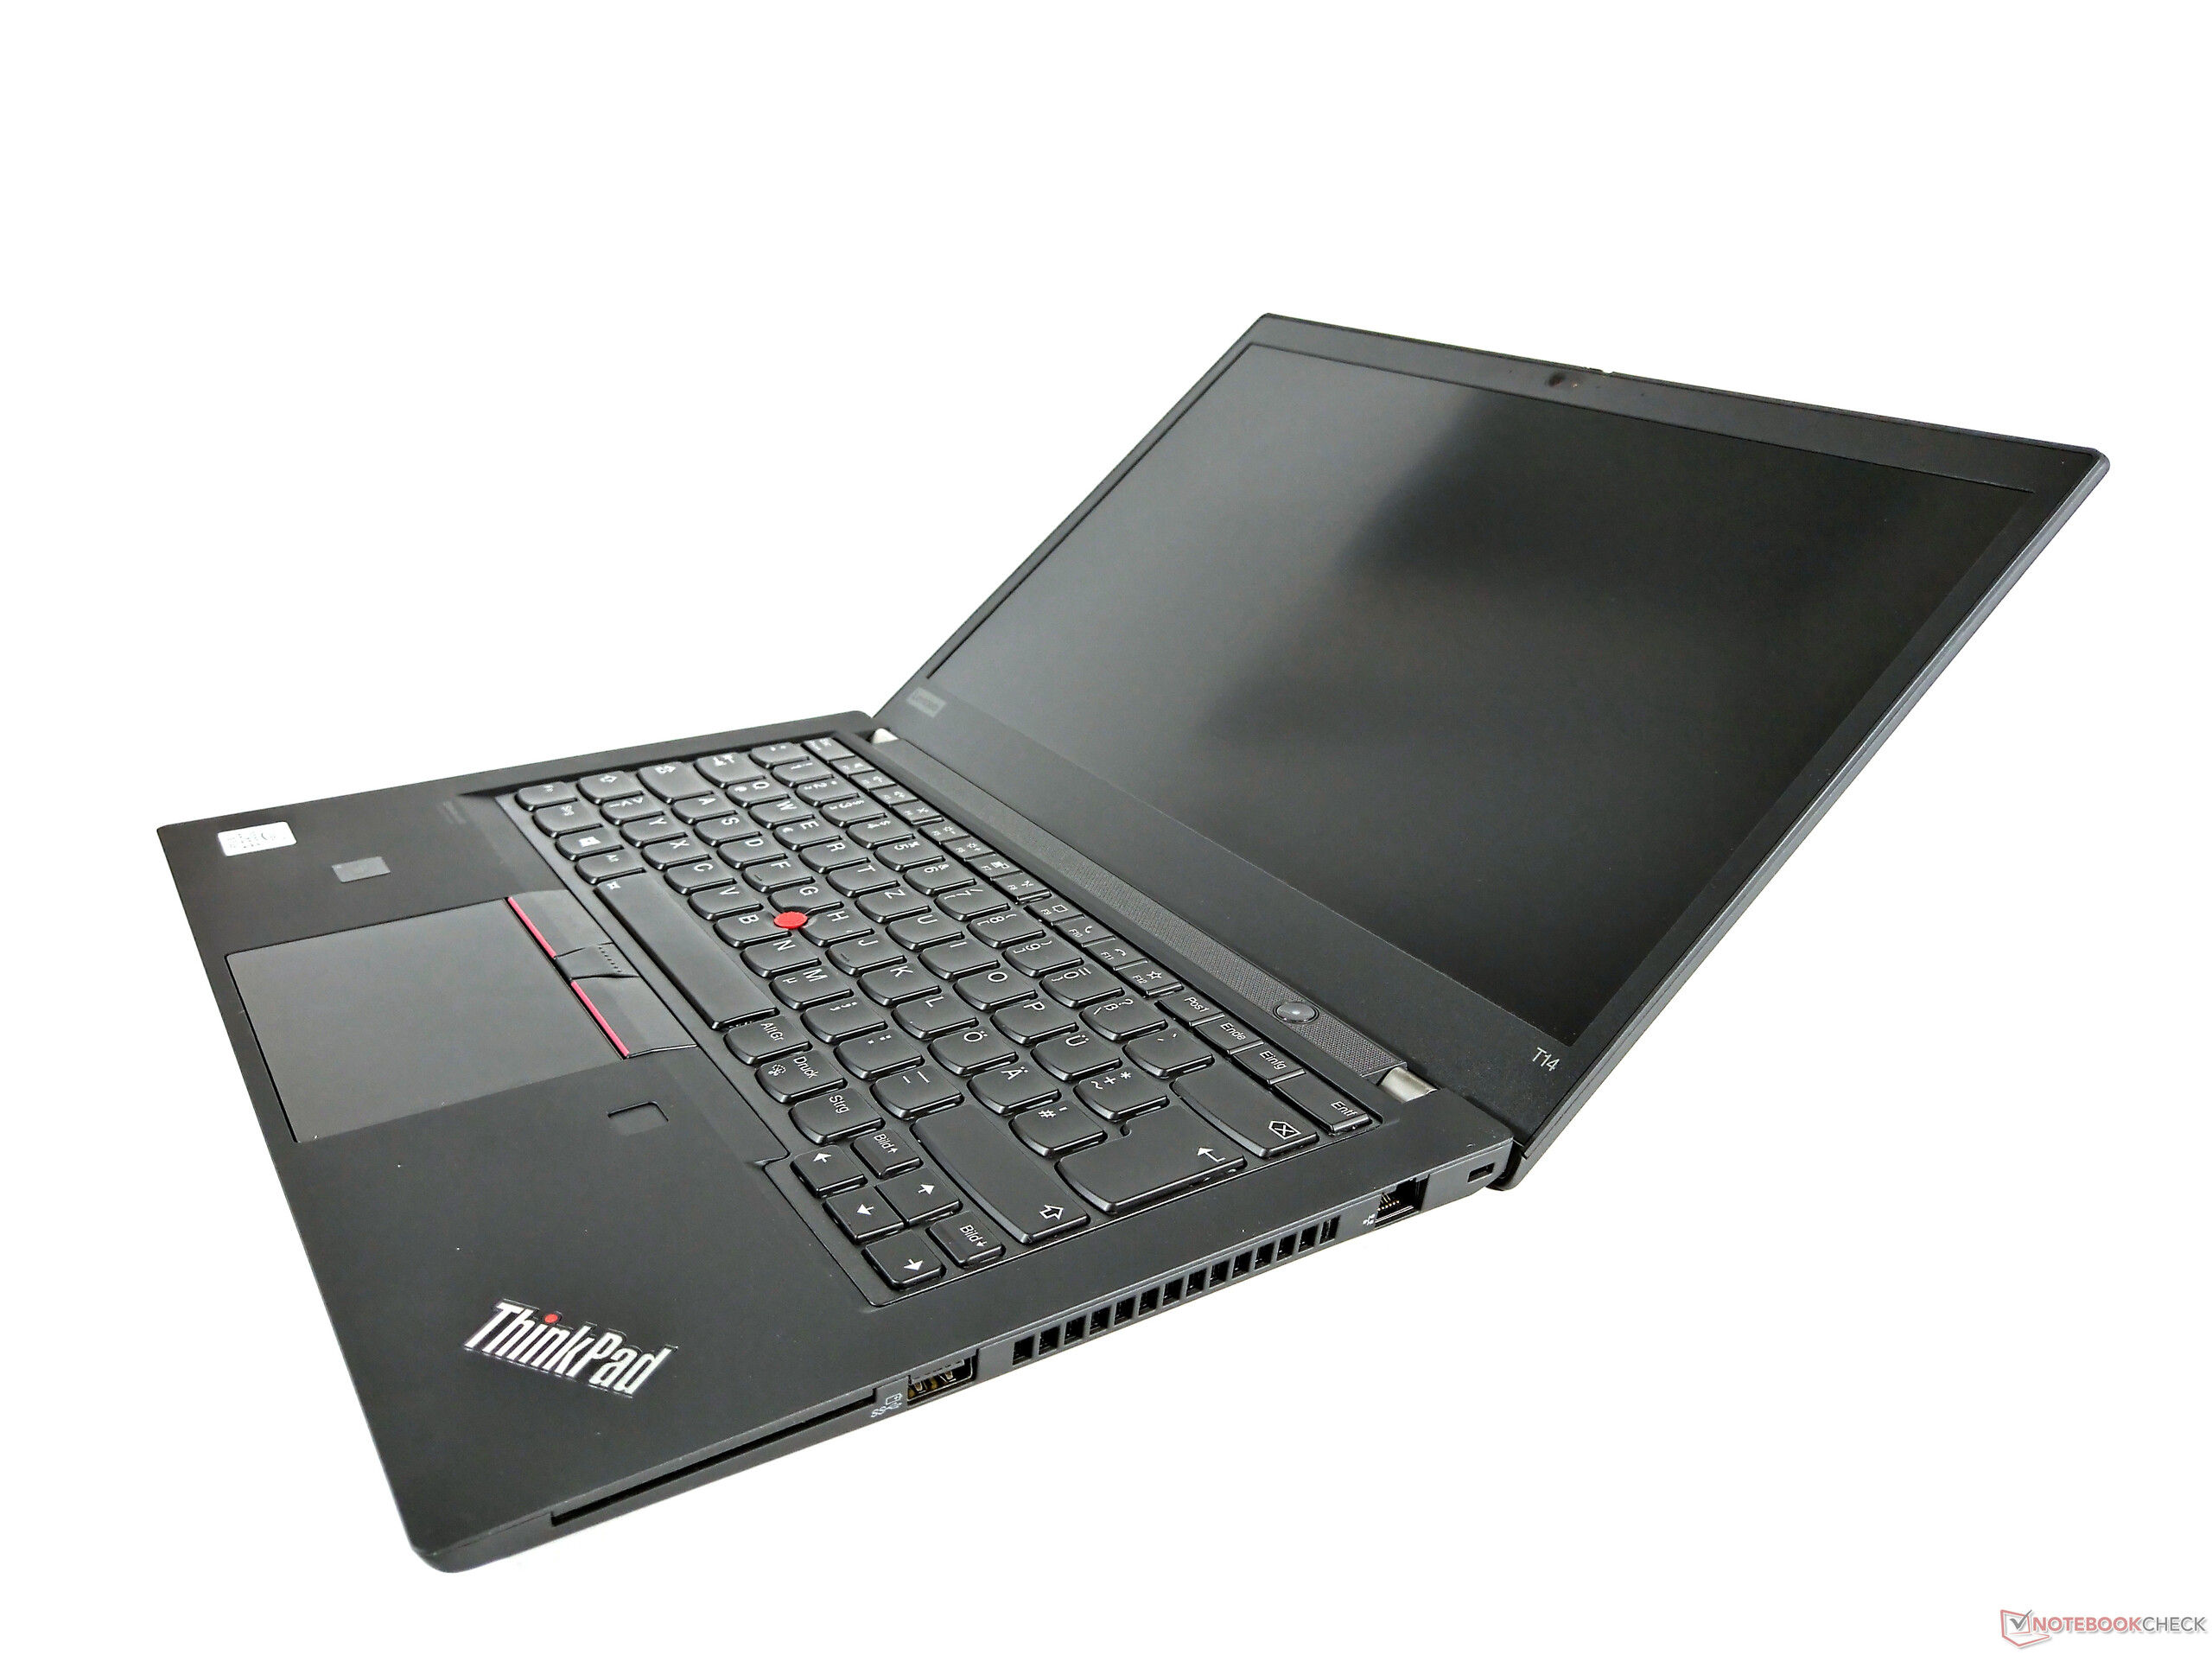
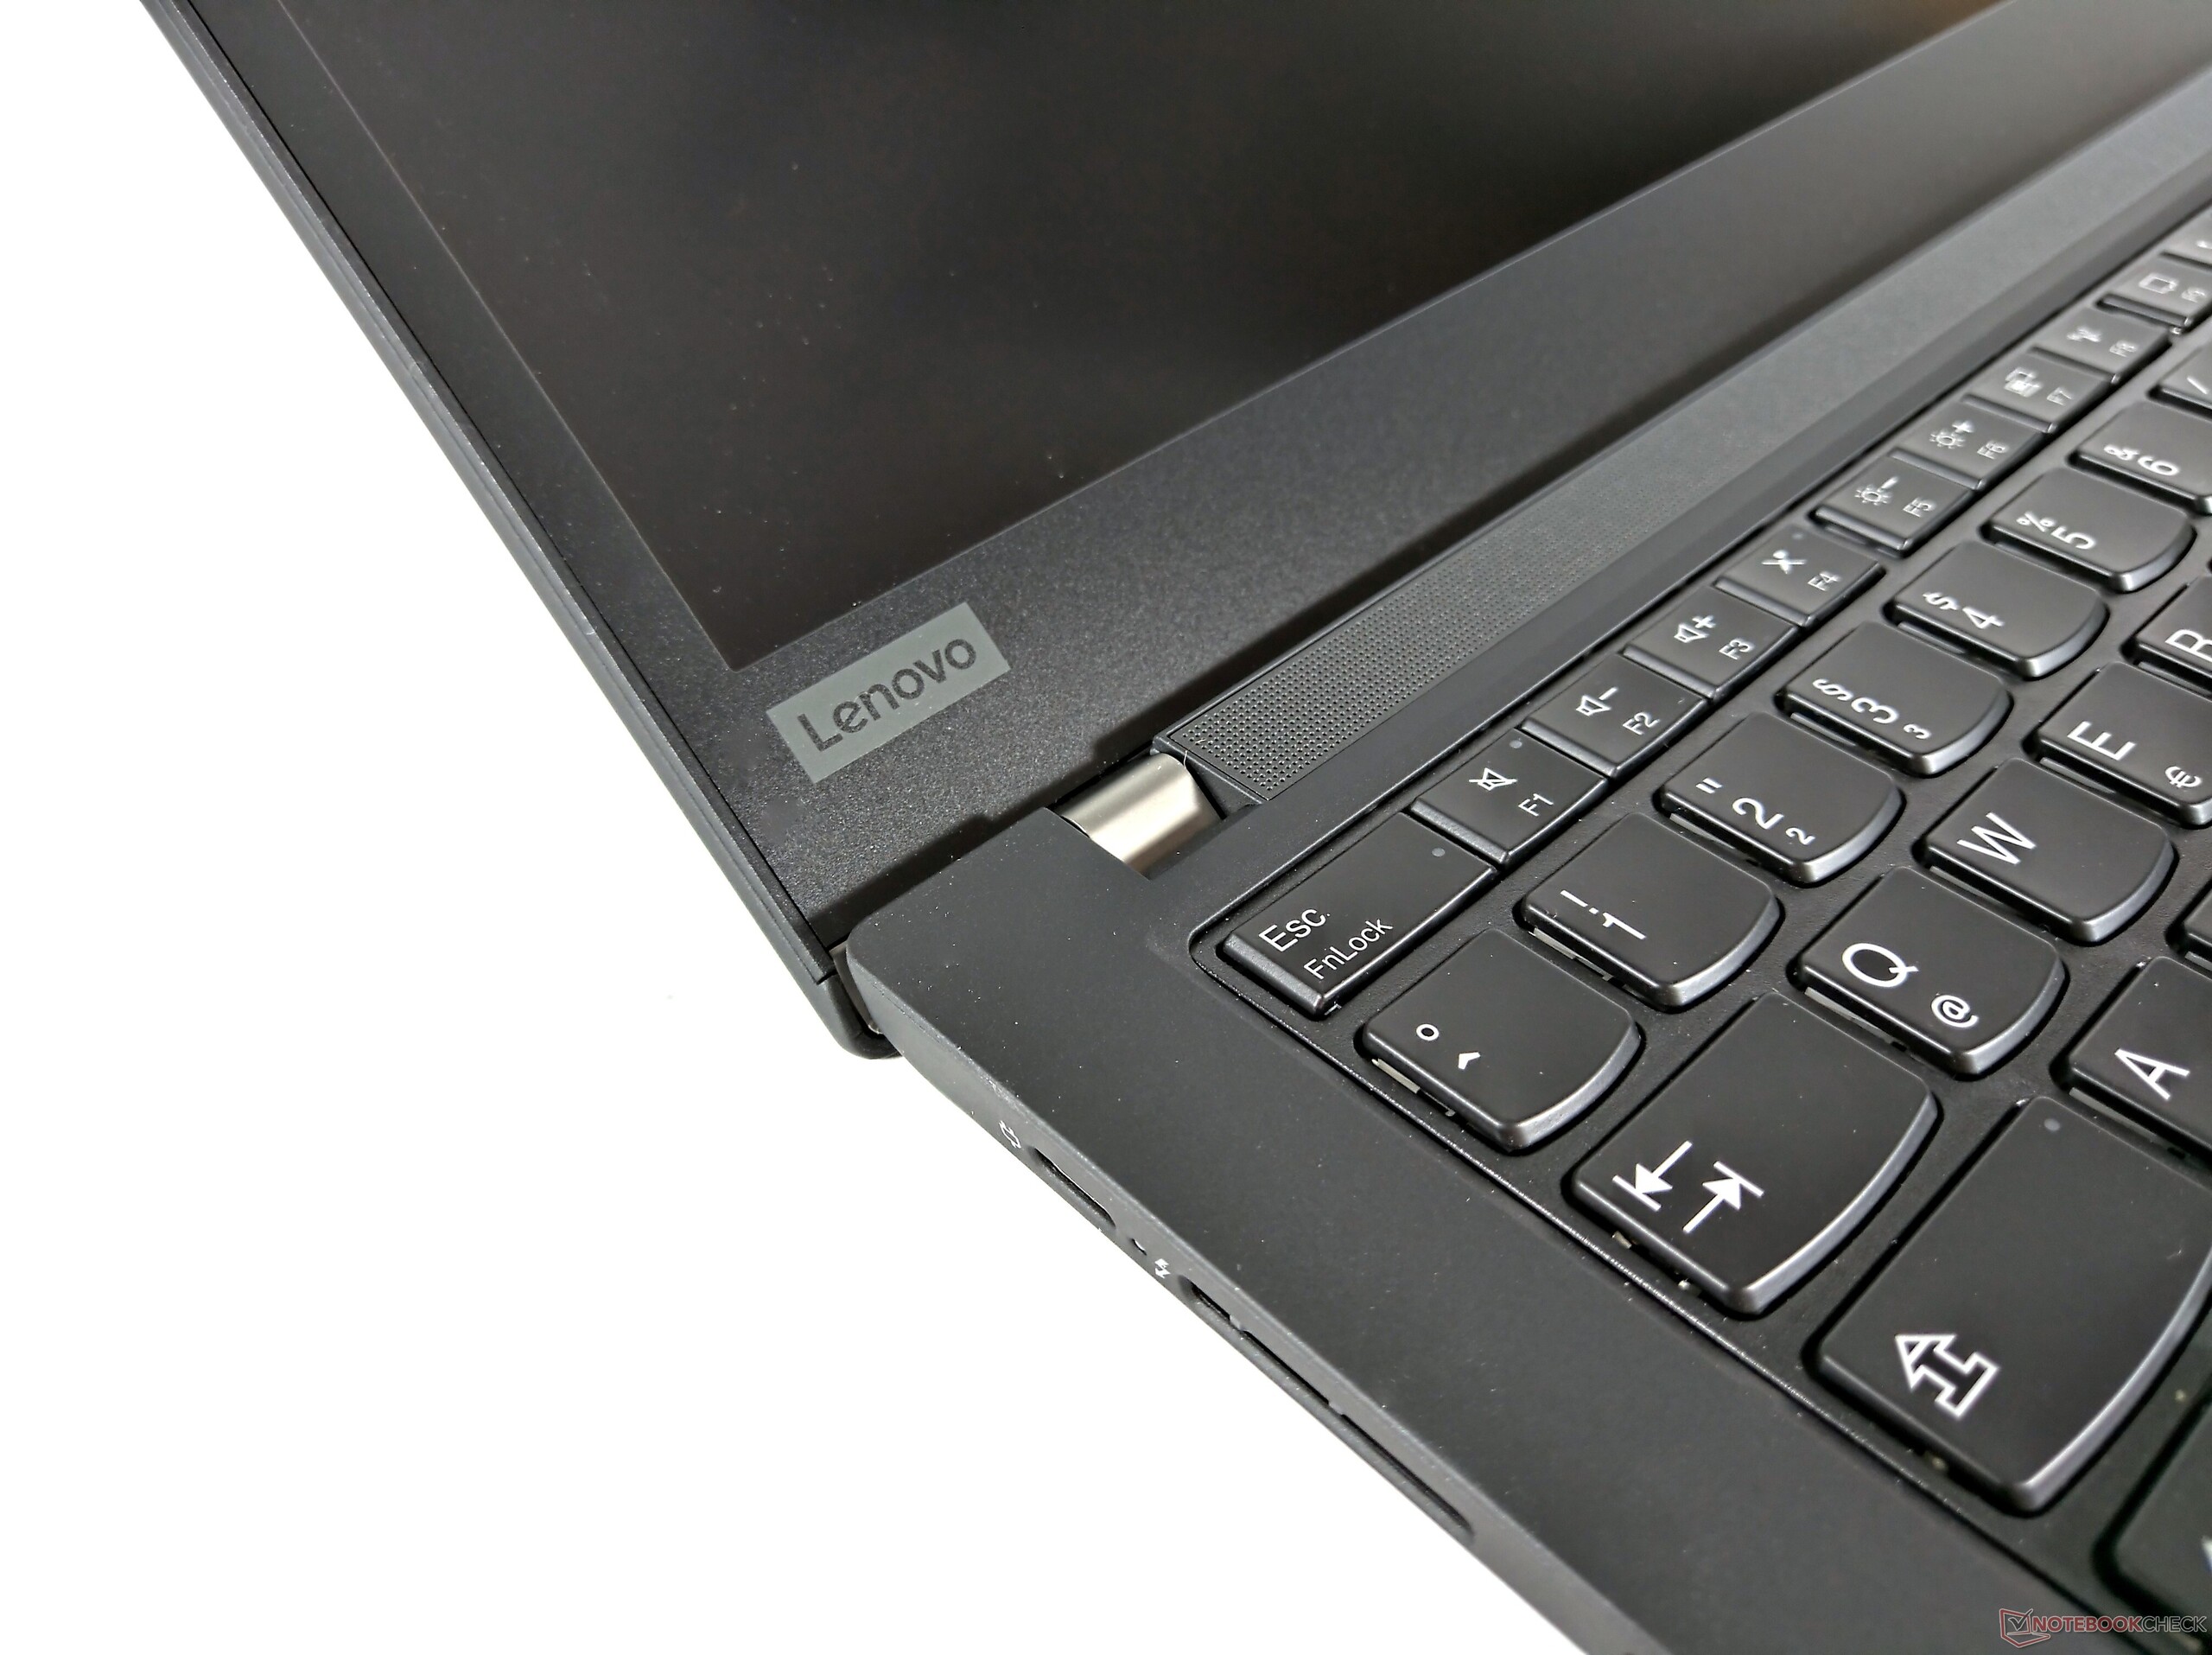
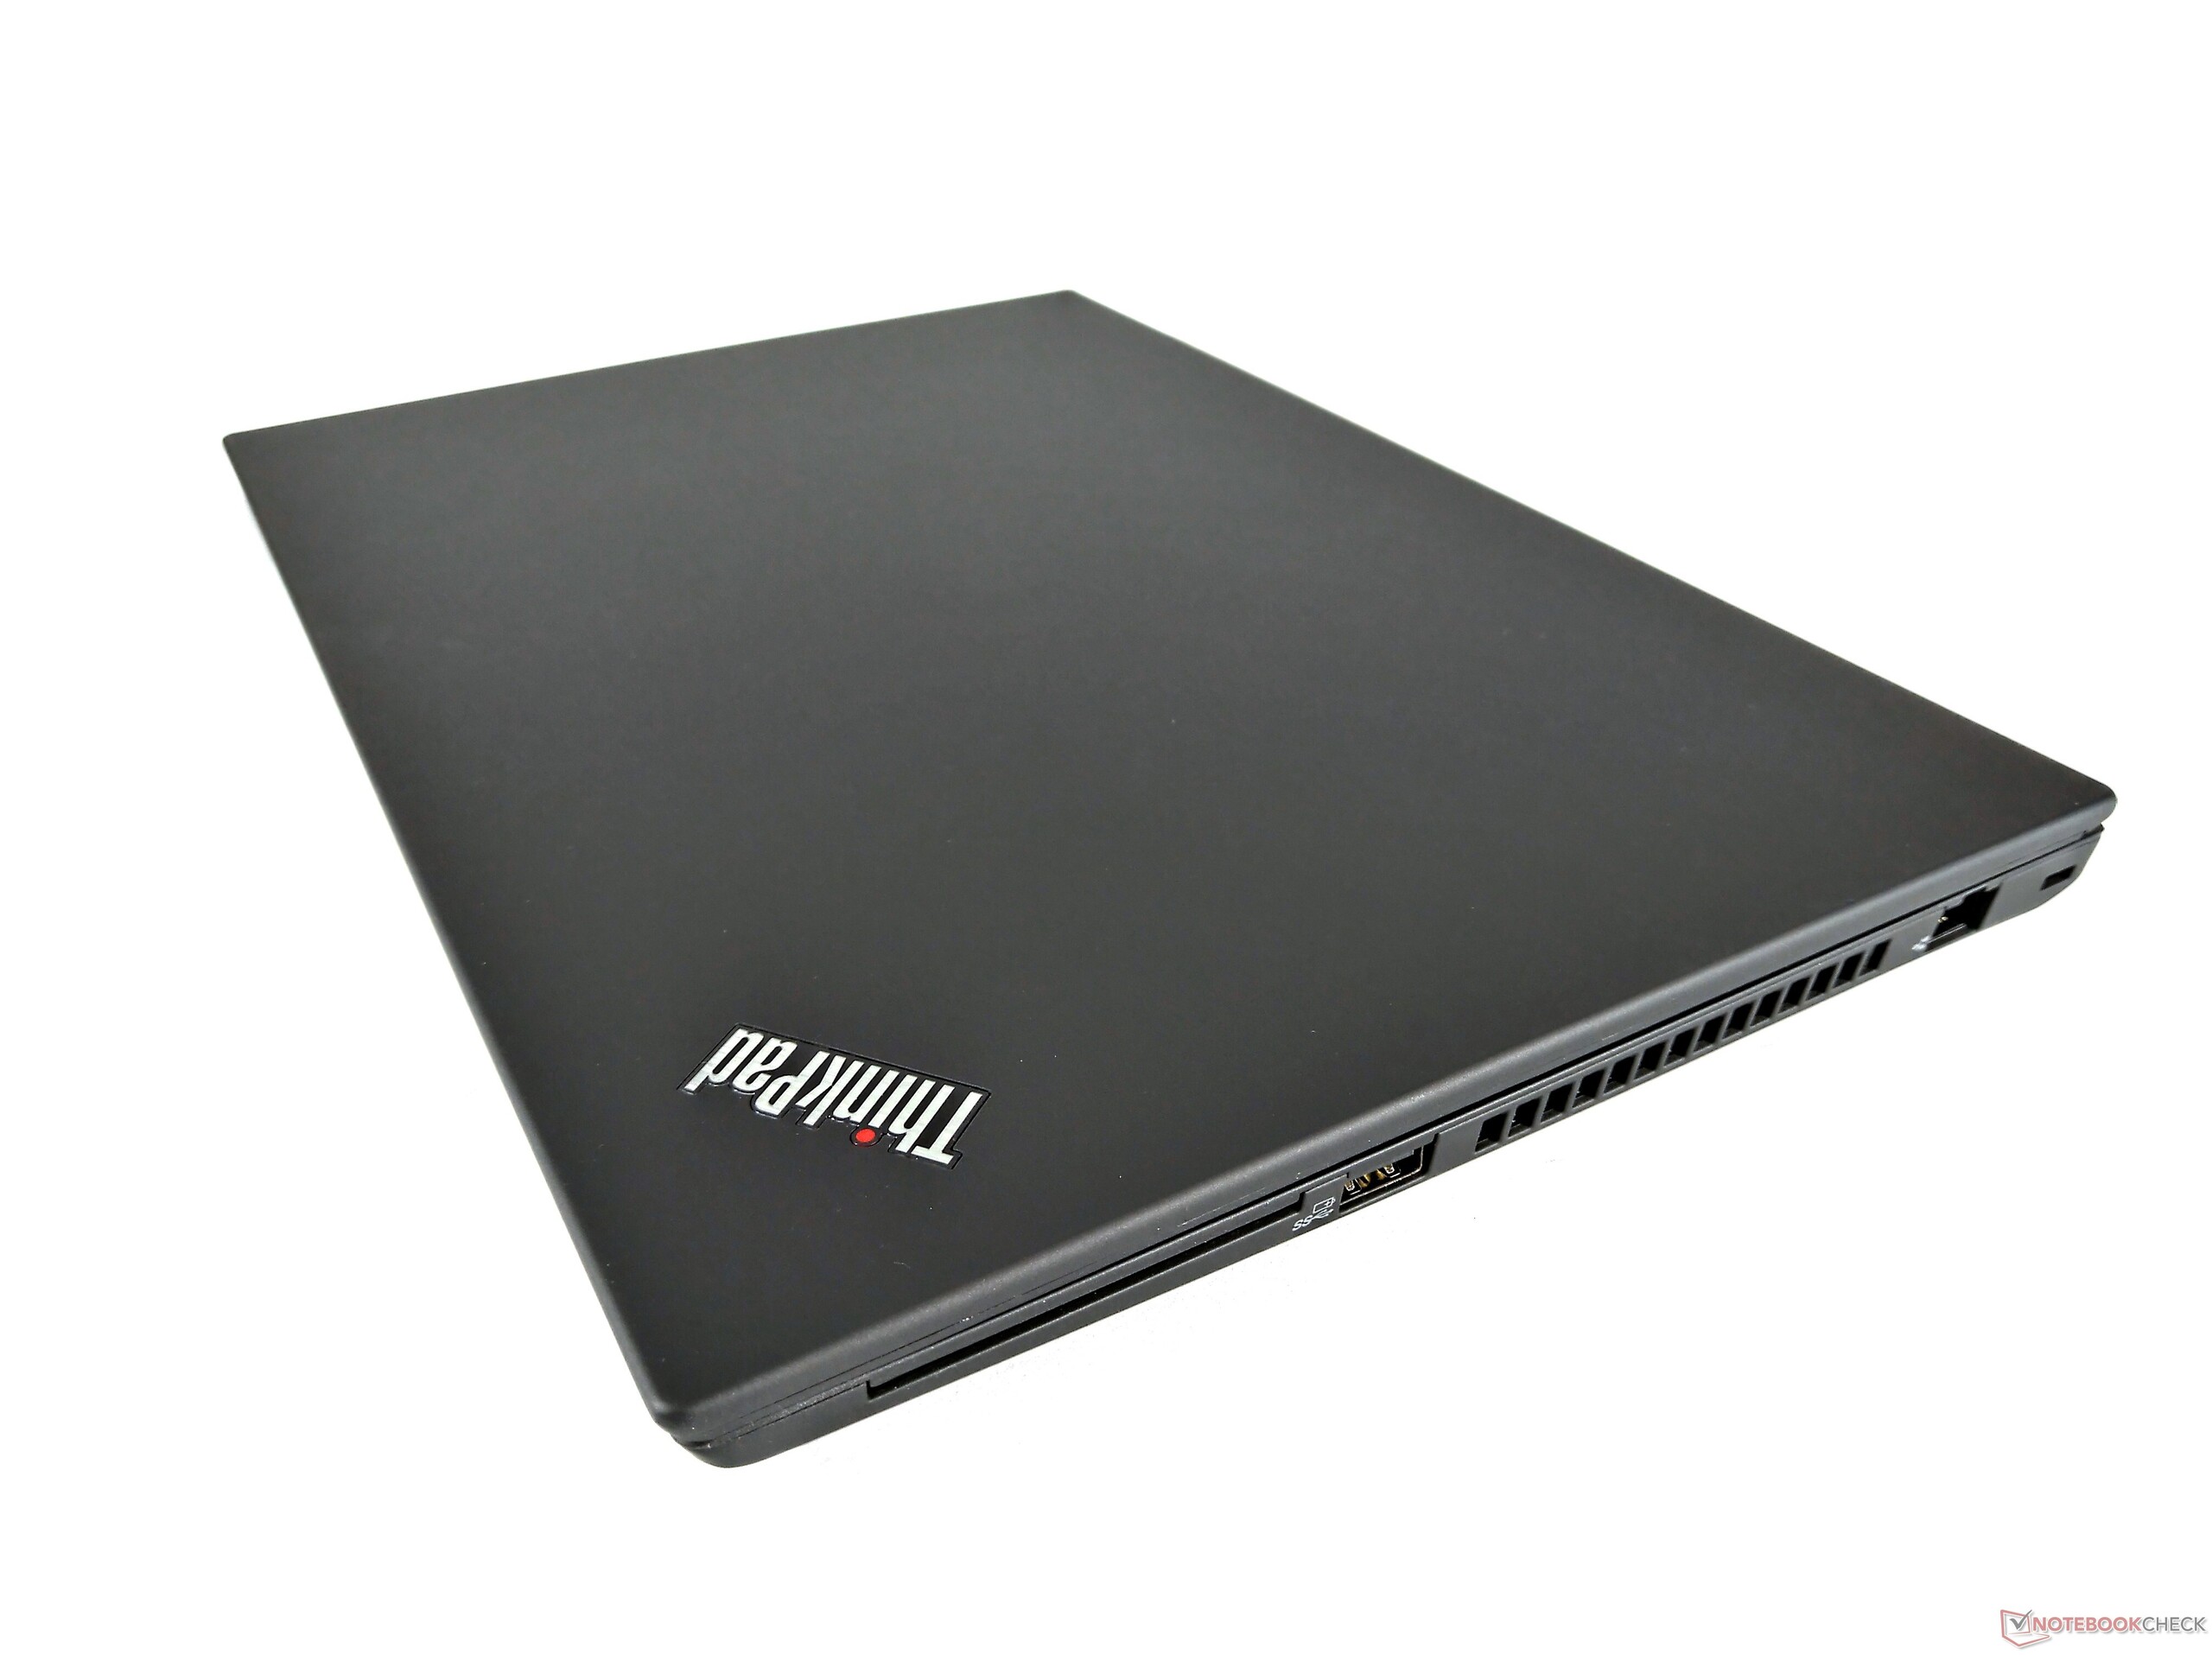
Diferente em nome, mas quase o mesmo: O Lenovo ThinkPad T14 Gen 1 é apenas uma pequena atualização do ThinkPad T490. De fato, existem algumas melhorias em detalhes, mas, em geral, surge a questão de saber se faz sentido.
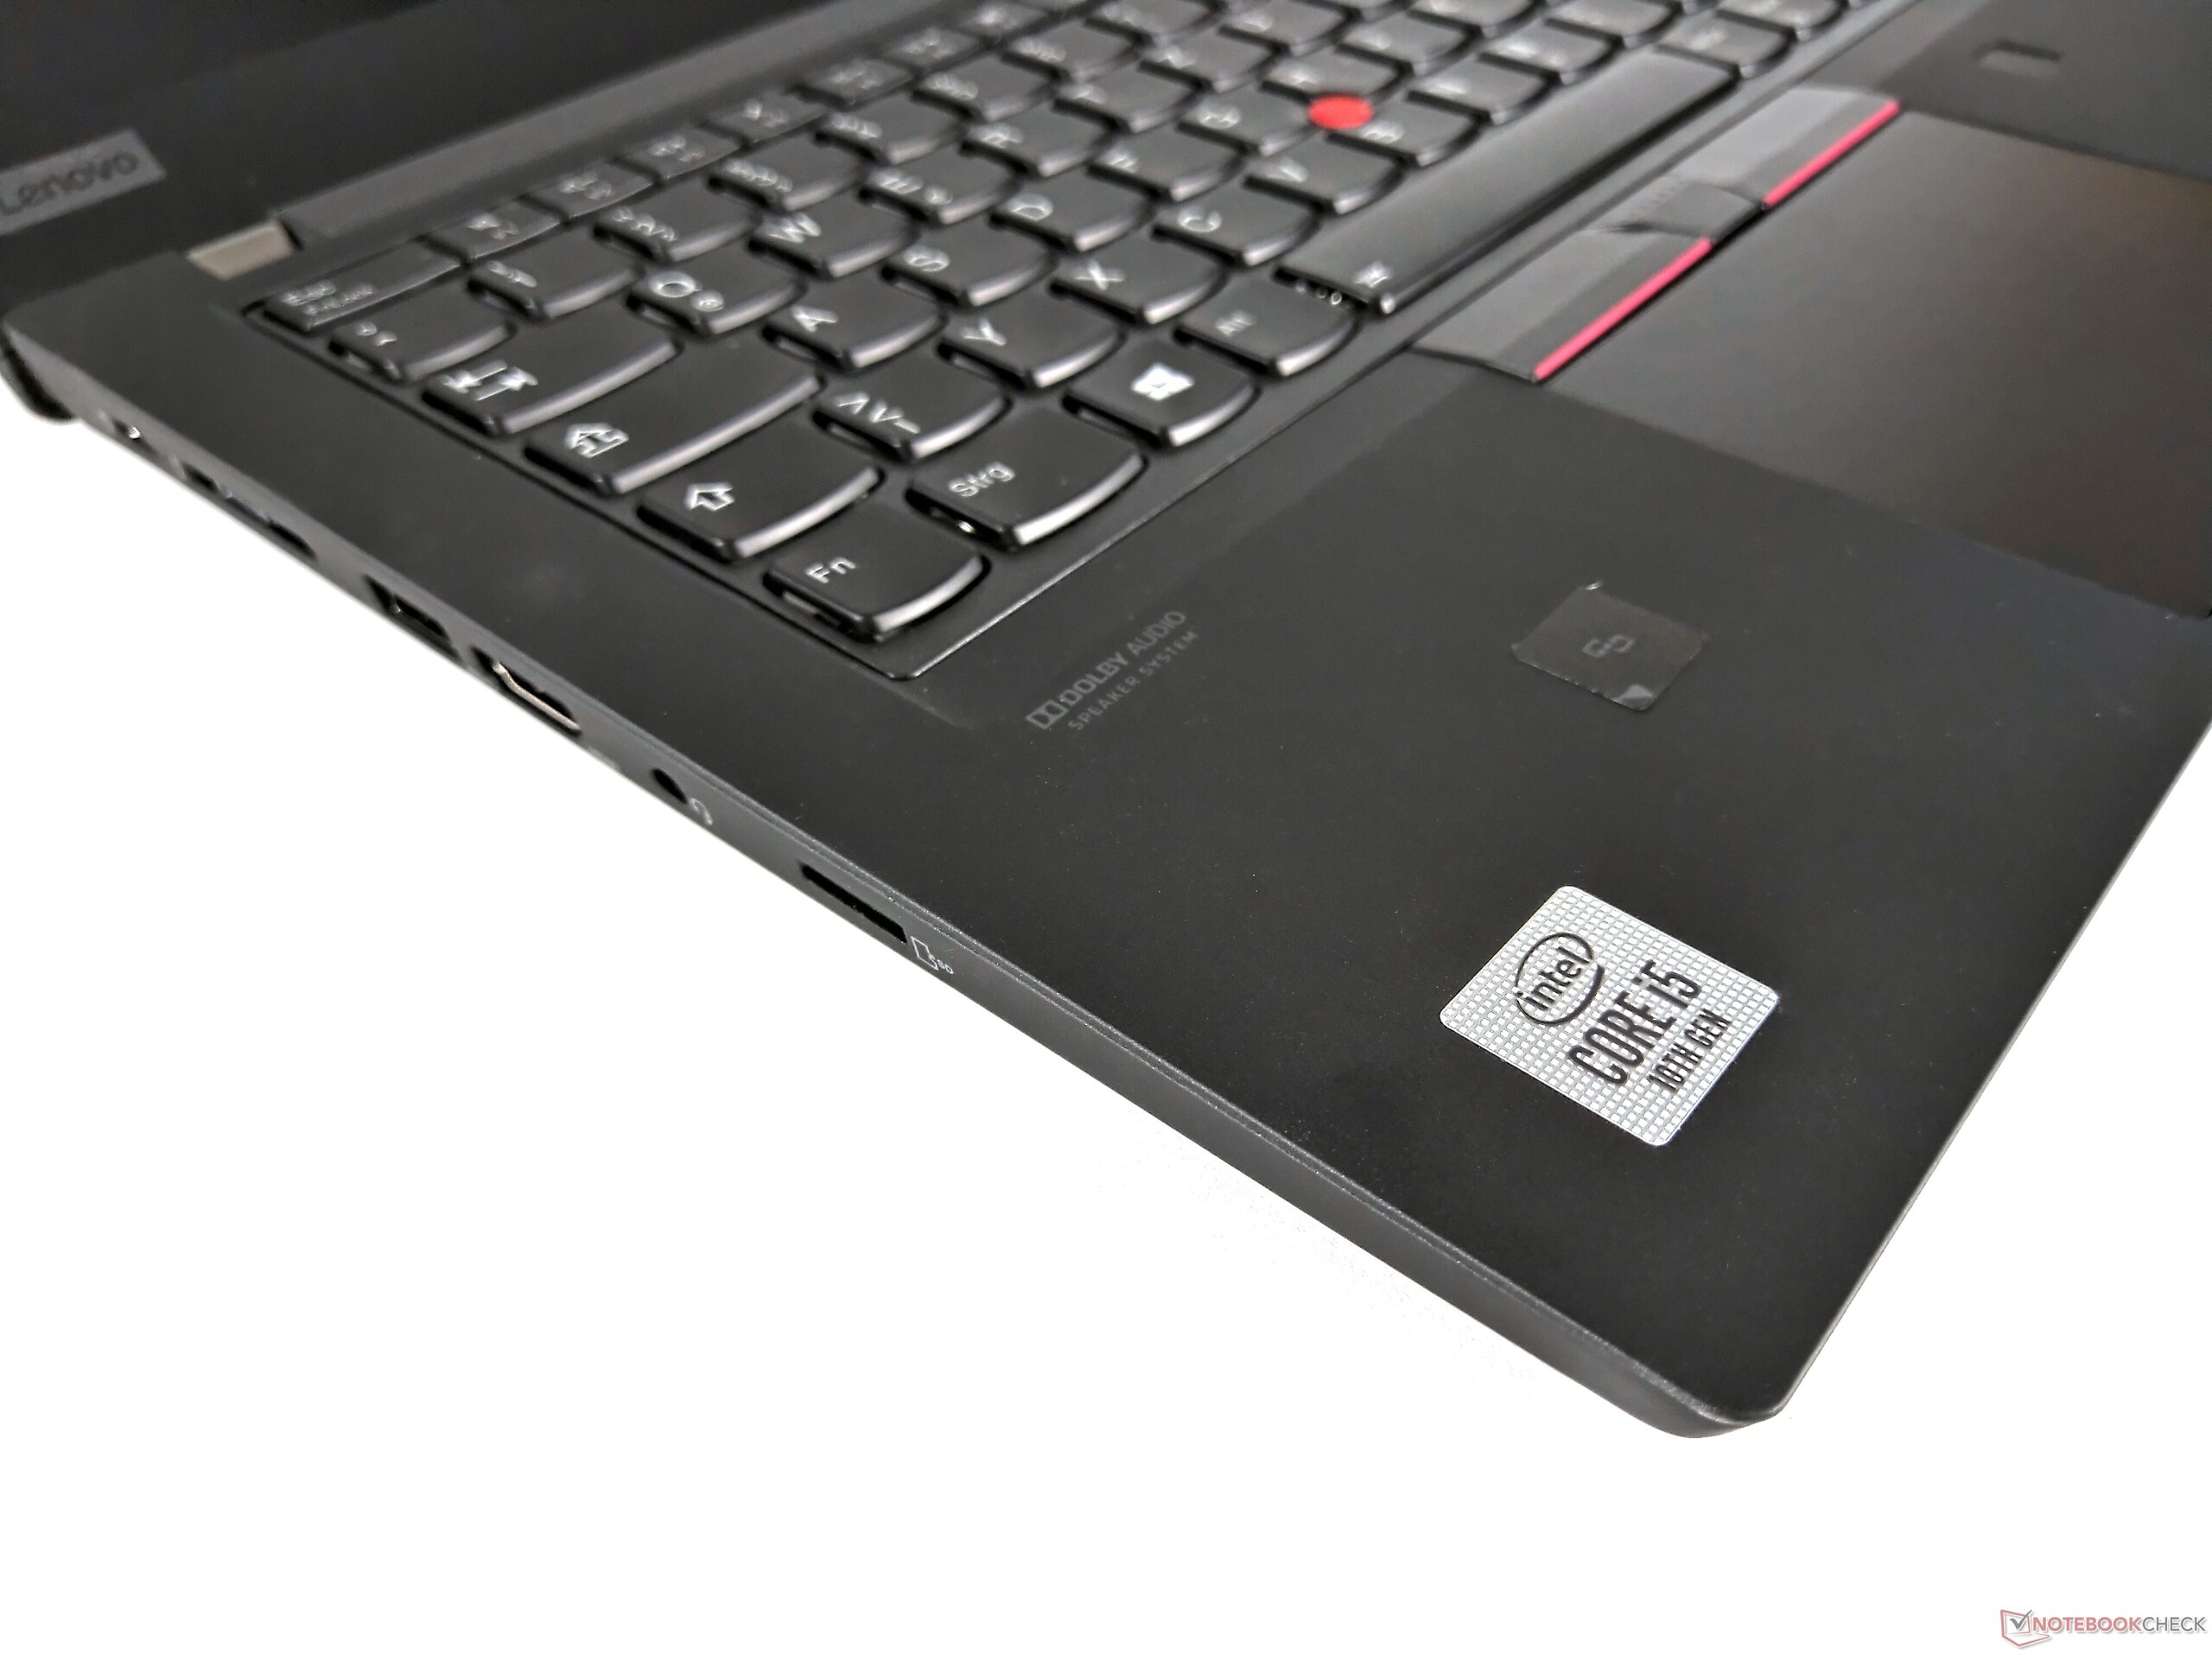
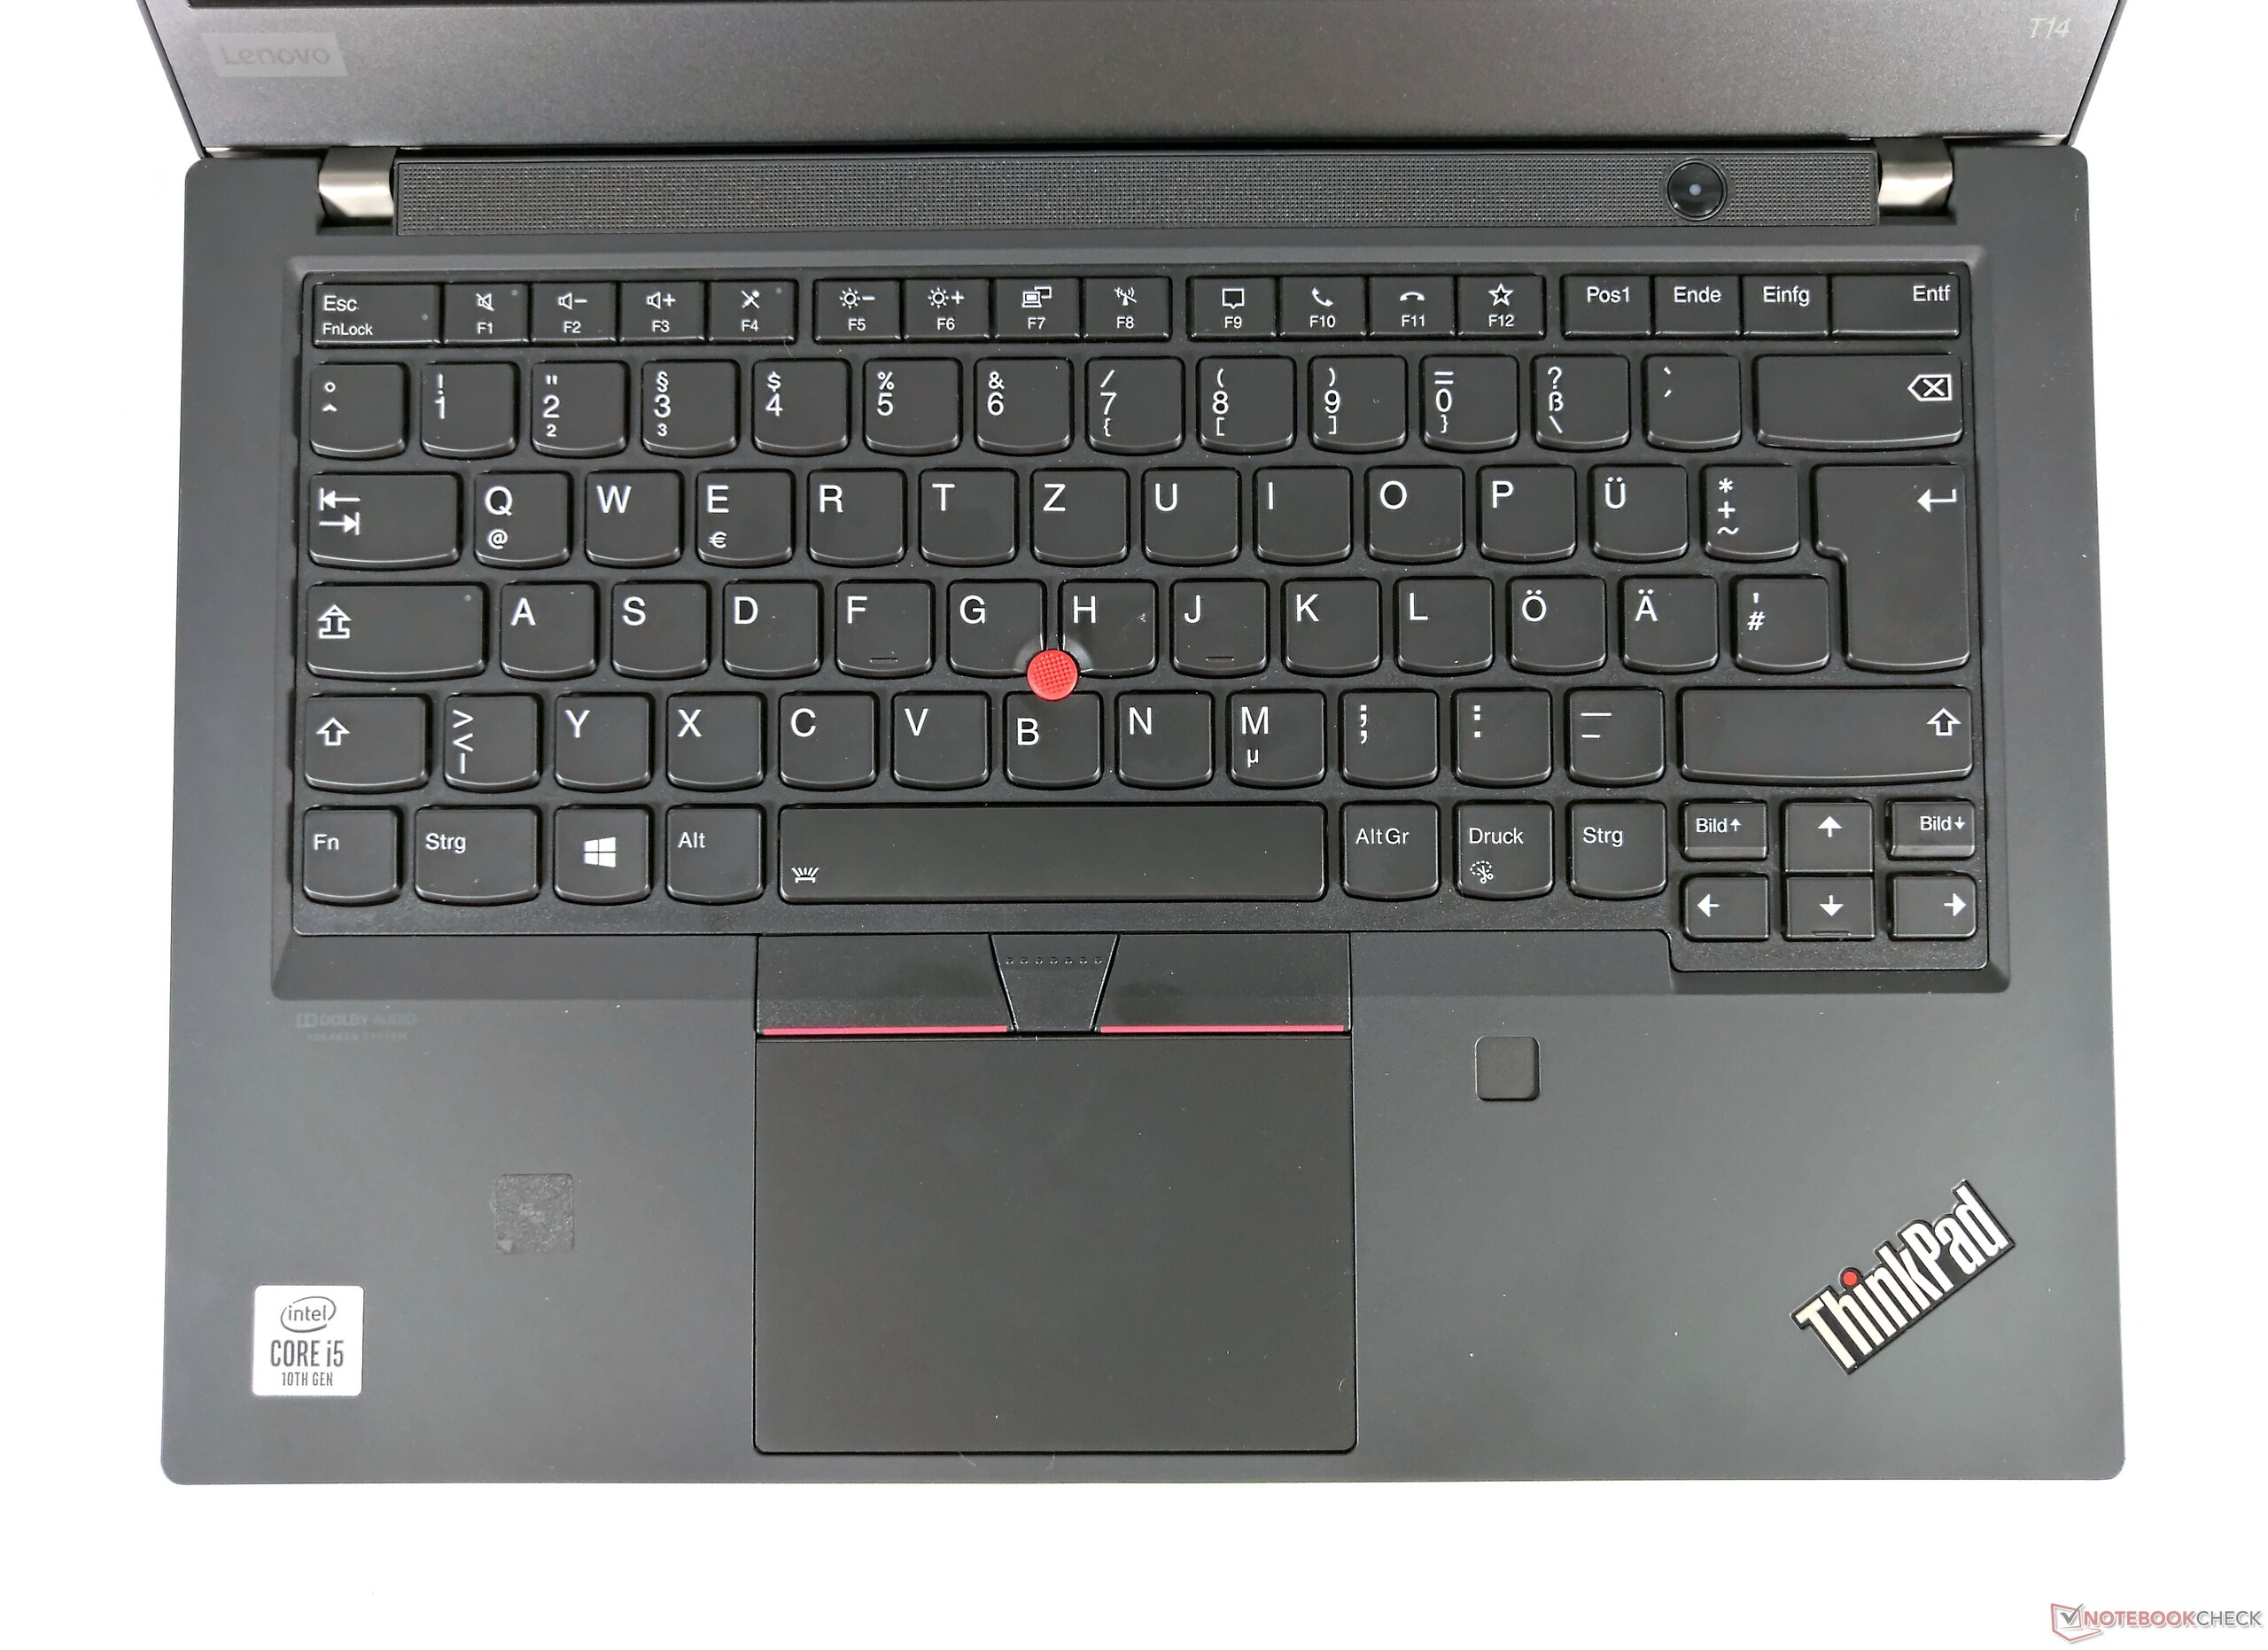
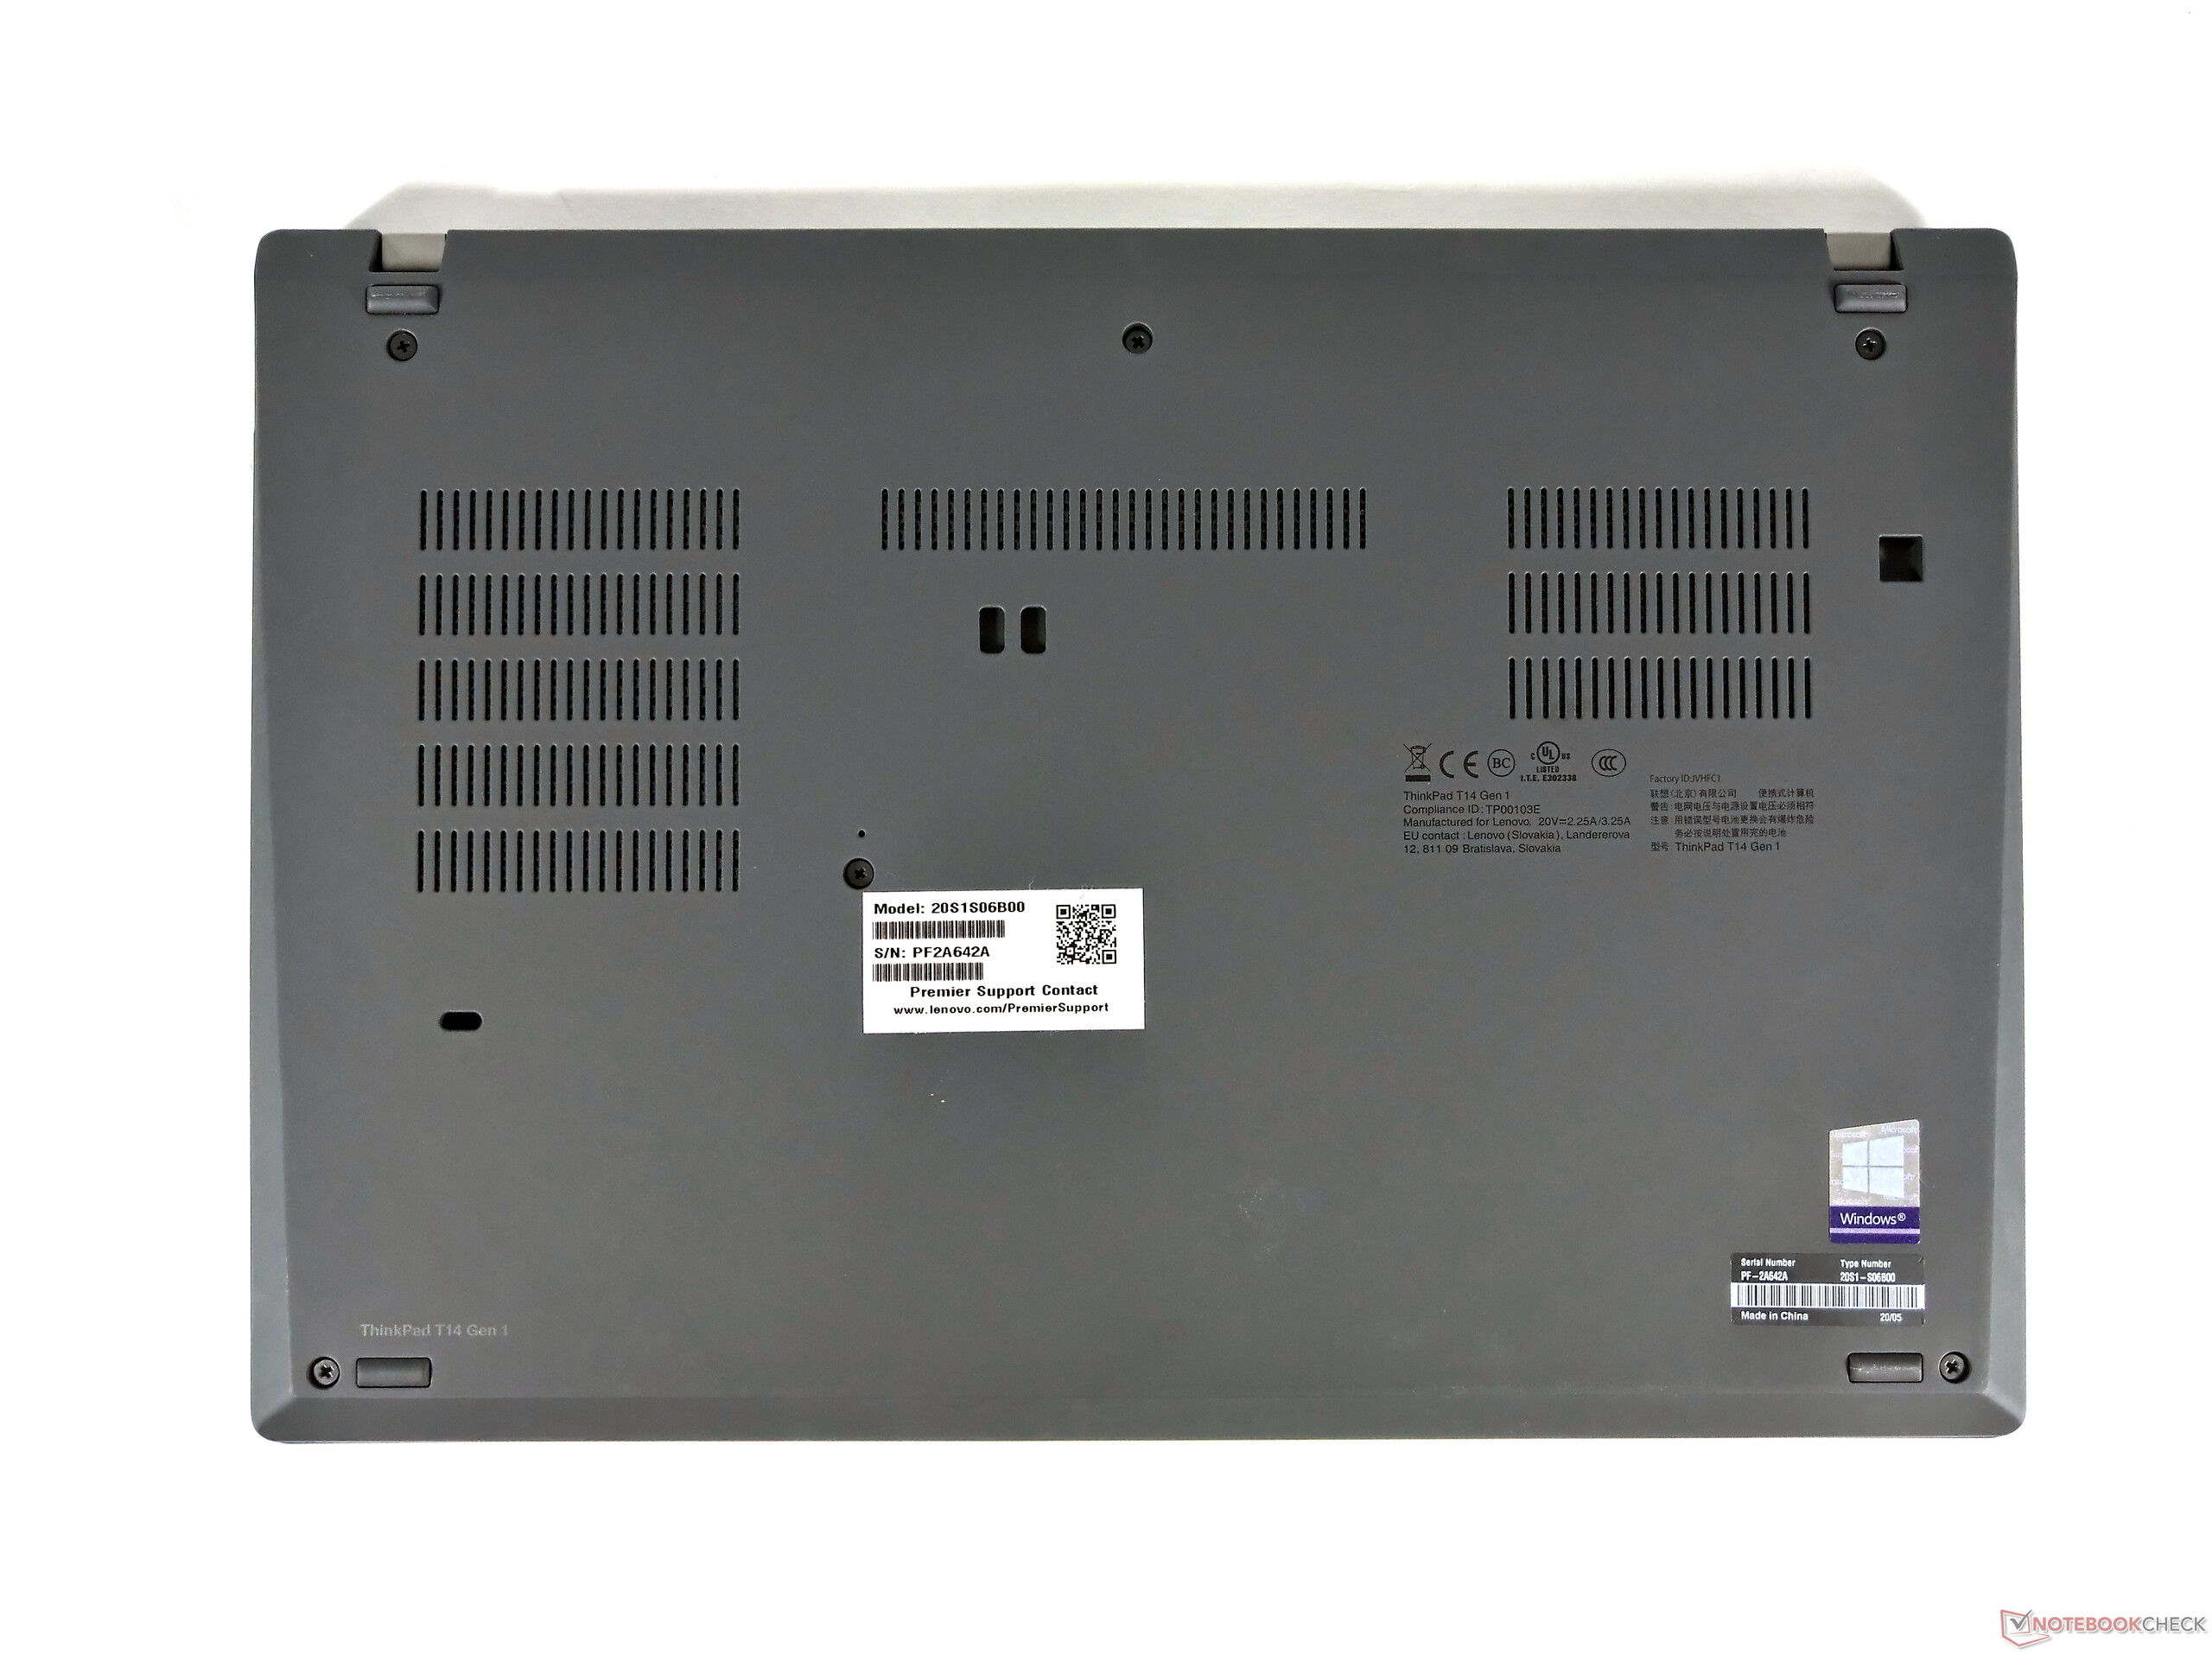
Os pontos fortes do ThinkPad T490 foram adotados, mas certamente os pontos fracos também. Isso inclui a conexão Thunderbolt com PCIe de apenas duas faixas, o slot para cartão SD de tamanho completo ausente e a carcaça difícil de abrir. Quanto aos pontos fortes do portátil, temos a carcaça, os dispositivos de entrada, a conectividade, a tela e a garantia. Entre as mudanças positivas estão os alto-falantes aprimorados e que o ventilador agora funciona ainda mais silenciosamente.
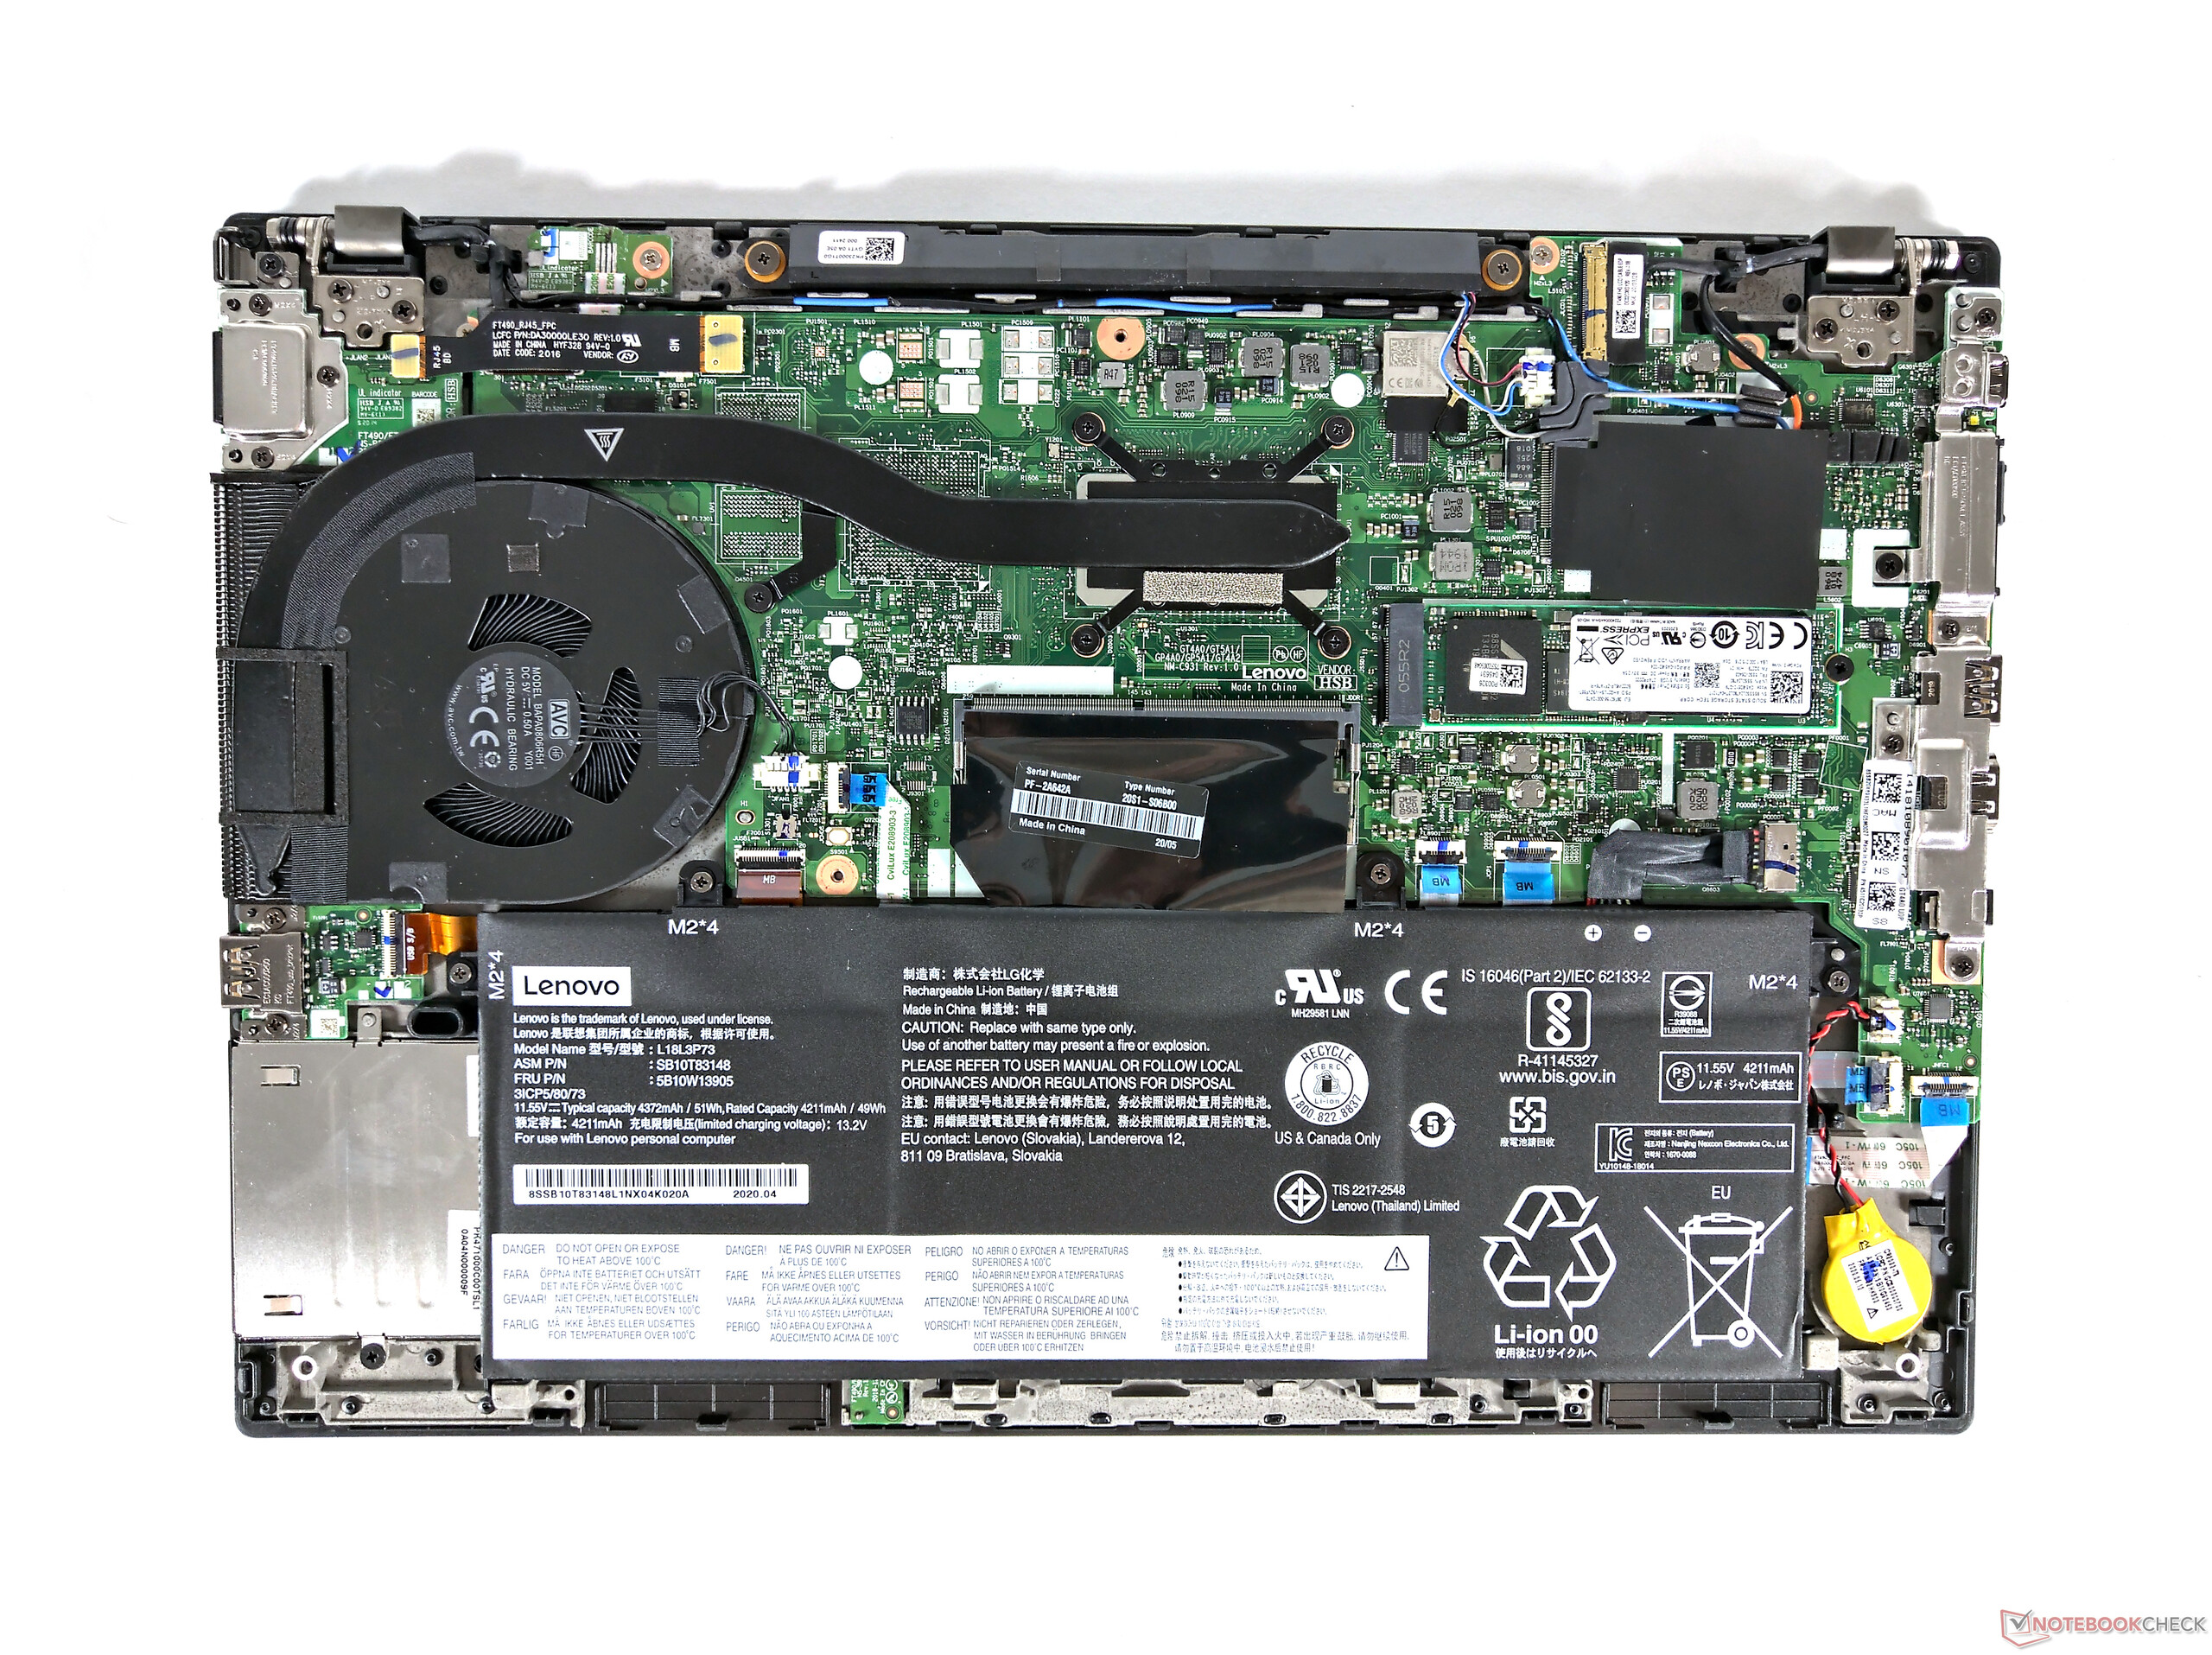
De qualquer forma, o menor nível de ruído pode ser visto como uma vantagem. Mas você também pode considerar um aspecto negativo, porque o ThinkPad T14 2020 tem um problema de calor. Mais de 65 °C (~149 °F) na parte inferior do teste de estresse é demais (e isso para o modelo iGPU!). Outro ponto crucial é o desempenho da CPU, que quase não melhorou e até piorou até certo ponto. Isso levanta a questão de por que alguém deveria optar por um novo ThinkPad Intel.
O Lenovo ThinkPad T14 dificilmente fornece argumentos para se preferir ao seu antecessor.
Deve-se comprar o ThinkPad T14 com a CPU Intel Comet Lake? Se o modelo da AMD for muito mais rápido, a resposta é não. Somente o Thunderbolt 3 e a tela 4K UHD disponível opcionalmente fazem o modelo Intel fazer sentido. Caso contrário, o seguinte se aplica: A AMD é provavelmente a melhor escolha este ano, já que o Comet Lake não oferece muitos motivos para atualizar além do Wi-Fi 6.
Lenovo ThinkPad T14-20S1S06B00
- 07/01/2020 v7 (old)
Benjamin Herzig
Price comparison
