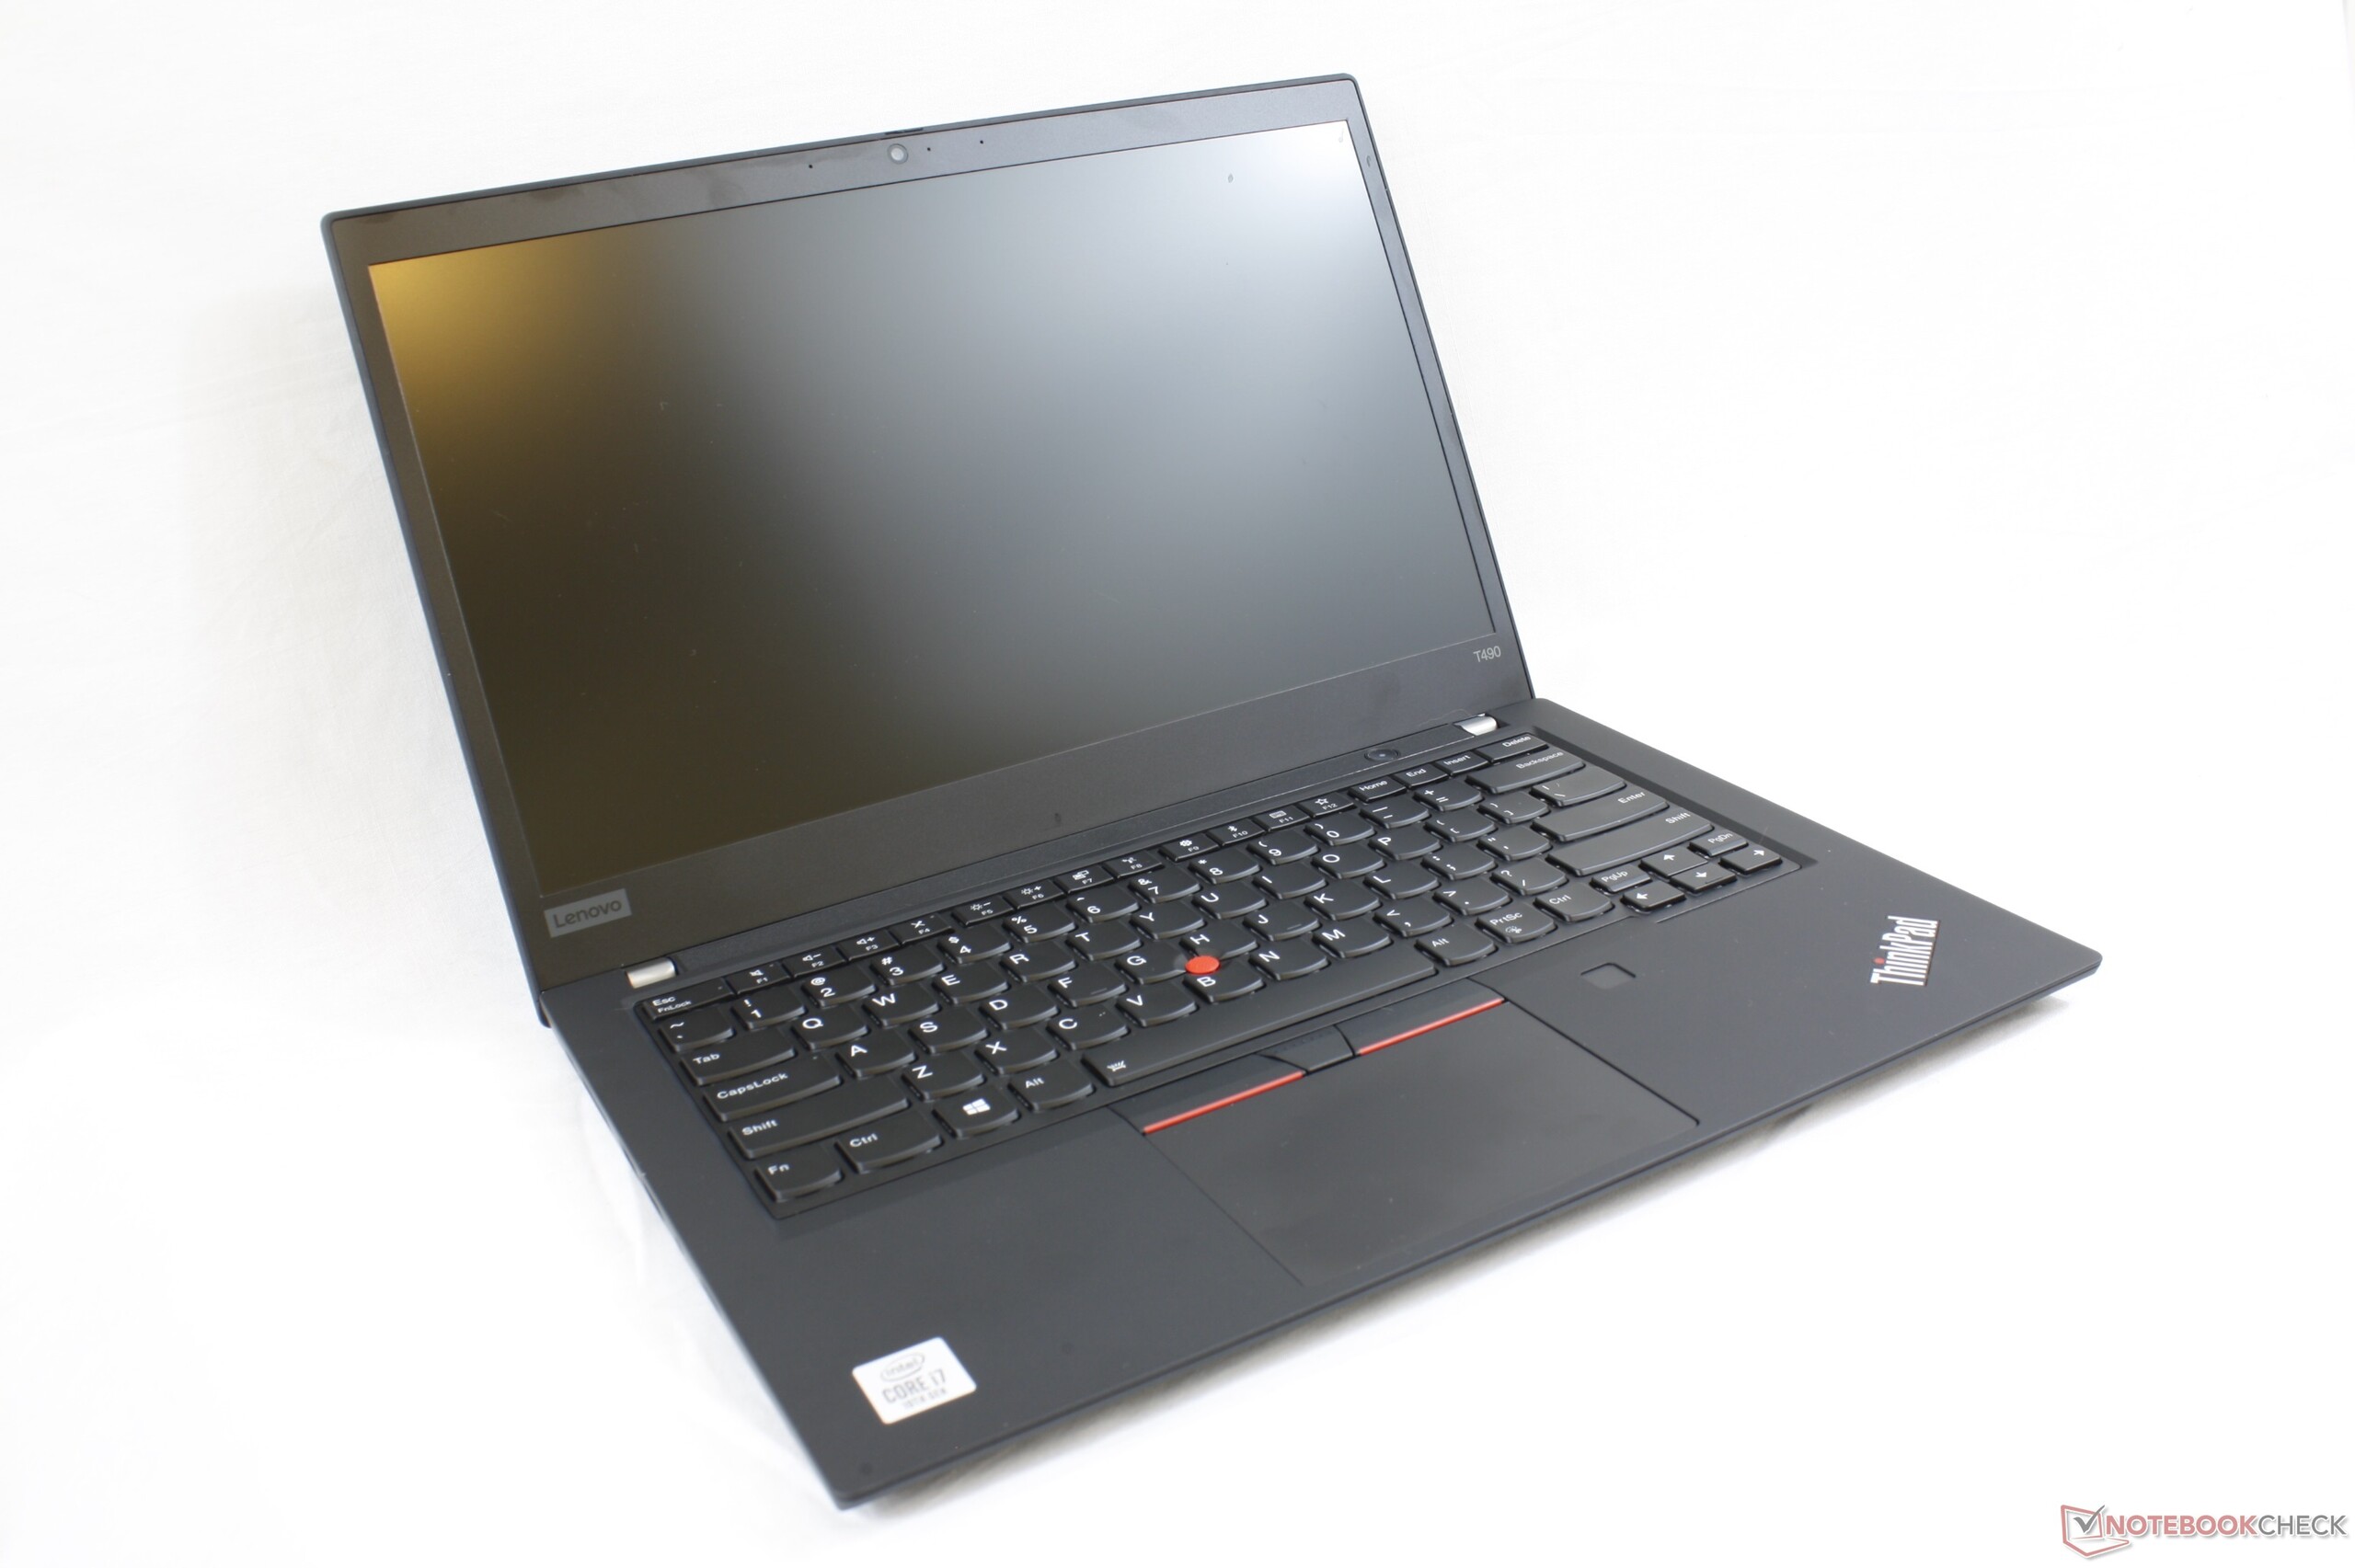
Breve Análise do Portátil Lenovo ThinkPad T490: A atualização Comet Lake-U
Avaliação | Data | Modelo | Peso | Altura | Size | Resolução | Preço |
|---|---|---|---|---|---|---|---|
| 86.3 % v7 (old) | 03/2020 | Lenovo ThinkPad T490 20RY0002US i7-10510U, UHD Graphics 620 | 1.5 kg | 17.9 mm | 14.00" | 1920x1080 | |
| 89.6 % v6 (old) | 04/2018 | Lenovo ThinkPad T480-20L6S01V00 i5-8550U, GeForce MX150 | 1.8 kg | 20 mm | 14.00" | 1920x1080 | |
| 79.7 % v6 (old) | 08/2019 | Dell Inspiron 15 5000 5585 R7 3700U, Vega 10 | 1.8 kg | 19.5 mm | 15.60" | 1920x1080 | |
| 88.4 % v7 (old) | 09/2019 | Lenovo ThinkPad T495s-20QKS01E00 R7 PRO 3700U, Vega 10 | 1.3 kg | 16.1 mm | 14.00" | 1920x1080 | |
| 81.8 % v7 (old) | 02/2020 | Lenovo ThinkBook 15 i5-10210U, UHD Graphics 620 | 1.9 kg | 18.9 mm | 15.60" | 1920x1080 |
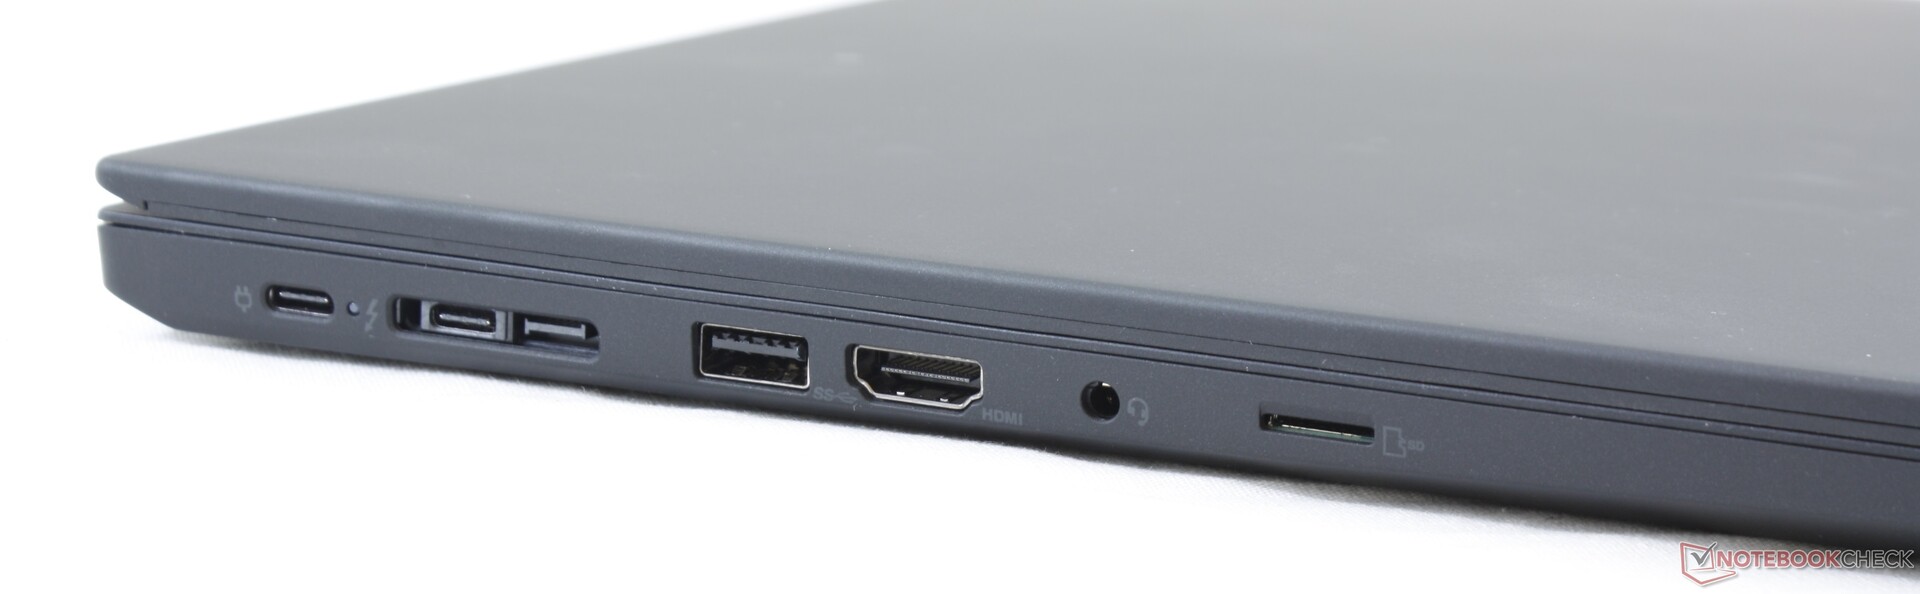
| SD Card Reader | |
| average JPG Copy Test (av. of 3 runs) | |
| Lenovo ThinkPad T495s-20QKS01E00 (Toshiba Exceria Pro M501 64 GB UHS-II) | |
| Lenovo ThinkPad T480-20L6S01V00 (Toshiba Exceria Pro SDXC 64 GB UHS-II) | |
| Lenovo ThinkPad T470-20HD002HGE (Toshiba Exceria Pro SDXC 64 GB UHS-II) | |
| Lenovo ThinkPad T490 20RY0002US (Toshiba Exceria Pro M501 64 GB UHS-II) | |
| Lenovo ThinkPad T460-20FN003LGE | |
| maximum AS SSD Seq Read Test (1GB) | |
| Lenovo ThinkPad T495s-20QKS01E00 (Toshiba Exceria Pro M501 64 GB UHS-II) | |
| Lenovo ThinkPad T470-20HD002HGE (Toshiba Exceria Pro SDXC 64 GB UHS-II) | |
| Lenovo ThinkPad T480-20L6S01V00 (Toshiba Exceria Pro SDXC 64 GB UHS-II) | |
| Lenovo ThinkPad T460-20FN003LGE | |
| Lenovo ThinkPad T490 20RY0002US (Toshiba Exceria Pro M501 64 GB UHS-II) | |
| Networking | |
| iperf3 transmit AX12 | |
| Lenovo ThinkPad T490 20RY0002US | |
| Acer Aspire 5 A514-52 | |
| Lenovo Yoga C740-14IML | |
| Alienware m17 R2 P41E | |
| iperf3 receive AX12 | |
| Lenovo ThinkPad T490 20RY0002US | |
| Acer Aspire 5 A514-52 | |
| Lenovo Yoga C740-14IML | |
| Alienware m17 R2 P41E | |

| |||||||||||||||||||||||||
iluminação: 91 %
iluminação com acumulador: 305.6 cd/m²
Contraste: 1528:1 (Preto: 0.2 cd/m²)
ΔE ColorChecker Calman: 4.27 | ∀{0.5-29.43 Ø4.73}
calibrated: 3.66
ΔE Greyscale Calman: 2.8 | ∀{0.09-98 Ø4.97}
61.1% sRGB (Argyll 1.6.3 3D)
39.1% AdobeRGB 1998 (Argyll 1.6.3 3D)
42.37% AdobeRGB 1998 (Argyll 3D)
61.3% sRGB (Argyll 3D)
40.99% Display P3 (Argyll 3D)
Gamma: 2.33
CCT: 6416 K
| Lenovo ThinkPad T490 20RY0002US R140NWF5 RA, IPS, 14", 1920x1080 | Lenovo ThinkPad T480-20L6S01V00 Lenovo LP140WF6-SPB7, IPS, 14", 1920x1080 | Lenovo ThinkPad T470-20HD002HGE N140HCA-EAB, IPS, 14", 1920x1080 | Lenovo ThinkPad T460-20FN003LGE Lenovo LEN40A9 / N140HCE-EAA, IPS, 14", 1920x1080 | Lenovo ThinkPad T450-20BV001VGE Samsung LTN140KT14401, TN-Panel, 14", 1600x900 | Lenovo ThinkPad T495s-20QKS01E00 B140HAN05.7, IPS, 14", 1920x1080 | |
|---|---|---|---|---|---|---|
| Display | -4% | 1% | 2% | -3% | 61% | |
| Display P3 Coverage (%) | 40.99 | 39.24 -4% | 41.6 1% | 42.09 3% | 39.62 -3% | 67 63% |
| sRGB Coverage (%) | 61.3 | 58.8 -4% | 61.9 1% | 62 1% | 59.6 -3% | 96.8 58% |
| AdobeRGB 1998 Coverage (%) | 42.37 | 40.56 -4% | 43.06 2% | 43.6 3% | 40.94 -3% | 68.3 61% |
| Response Times | 18% | -5% | 11% | -32% | ||
| Response Time Grey 50% / Grey 80% * (ms) | 47.2 ? | 35.6 ? 25% | 41.6 ? 12% | 42.4 ? 10% | 60.8 ? -29% | |
| Response Time Black / White * (ms) | 28 ? | 24.8 ? 11% | 34 ? -21% | 24.8 ? 11% | 37.6 ? -34% | |
| PWM Frequency (Hz) | 980 ? | |||||
| Screen | -13% | -20% | -33% | -87% | 24% | |
| Brightness middle (cd/m²) | 305.6 | 307 0% | 306 0% | 230 -25% | 166 -46% | 380 24% |
| Brightness (cd/m²) | 293 | 295 1% | 287 -2% | 216 -26% | 163 -44% | 381 30% |
| Brightness Distribution (%) | 91 | 90 -1% | 88 -3% | 85 -7% | 68 -25% | 87 -4% |
| Black Level * (cd/m²) | 0.2 | 0.25 -25% | 0.3 -50% | 0.26 -30% | 0.71 -255% | 0.22 -10% |
| Contrast (:1) | 1528 | 1228 -20% | 1020 -33% | 885 -42% | 234 -85% | 1727 13% |
| Colorchecker dE 2000 * | 4.27 | 5.7 -33% | 6.2 -45% | 7.32 -71% | 7.16 -68% | 4 6% |
| Colorchecker dE 2000 max. * | 22.5 | 21.3 5% | 13.6 40% | 18.14 19% | 5.7 75% | |
| Colorchecker dE 2000 calibrated * | 3.66 | 4.7 -28% | 1.2 67% | |||
| Greyscale dE 2000 * | 2.8 | 3.7 -32% | 5.8 -107% | 6.98 -149% | 7.62 -172% | 4.4 -57% |
| Gamma | 2.33 94% | 2.11 104% | 2.04 108% | 2.5 88% | 2.25 98% | 2.54 87% |
| CCT | 6416 101% | 7353 88% | 6277 104% | 6683 97% | 9371 69% | 6963 93% |
| Color Space (Percent of AdobeRGB 1998) (%) | 39.1 | 37.4 -4% | 39.62 1% | 39.97 2% | 37.8 -3% | 62.2 59% |
| Color Space (Percent of sRGB) (%) | 61.1 | 58.7 -4% | 61.44 1% | 61.55 1% | 96.6 58% | |
| Média Total (Programa/Configurações) | 0% /
-7% | -8% /
-14% | -7% /
-20% | -45% /
-64% | 18% /
24% |
* ... menor é melhor
Exibir tempos de resposta
| ↔ Tempo de resposta preto para branco | ||
|---|---|---|
| 28 ms ... ascensão ↗ e queda ↘ combinadas | ↗ 14.8 ms ascensão | 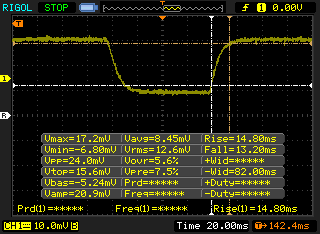 |
| ↘ 13.2 ms queda | ||
| A tela mostra taxas de resposta relativamente lentas em nossos testes e pode ser muito lenta para os jogadores. Em comparação, todos os dispositivos testados variam de 0.1 (mínimo) a 240 (máximo) ms. » 71 % de todos os dispositivos são melhores. Isso significa que o tempo de resposta medido é pior que a média de todos os dispositivos testados (19.9 ms). | ||
| ↔ Tempo de resposta 50% cinza a 80% cinza | ||
| 47.2 ms ... ascensão ↗ e queda ↘ combinadas | ↗ 26 ms ascensão | 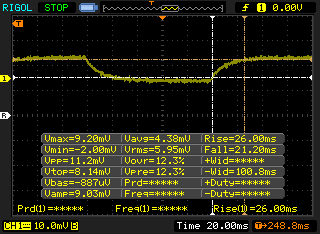 |
| ↘ 21.2 ms queda | ||
| A tela mostra taxas de resposta lentas em nossos testes e será insatisfatória para os jogadores. Em comparação, todos os dispositivos testados variam de 0.165 (mínimo) a 636 (máximo) ms. » 81 % de todos os dispositivos são melhores. Isso significa que o tempo de resposta medido é pior que a média de todos os dispositivos testados (31.1 ms). | ||
Cintilação da tela / PWM (modulação por largura de pulso)
| Tela tremeluzindo/PWM detectado | 980 Hz | ≤ 99 % configuração de brilho | 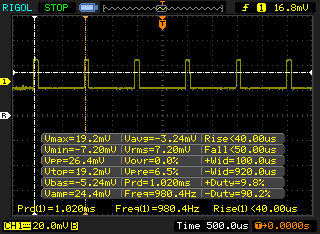 |
A luz de fundo da tela pisca em 980 Hz (pior caso, por exemplo, utilizando PWM) Cintilação detectada em uma configuração de brilho de 99 % e abaixo. Não deve haver cintilação ou PWM acima desta configuração de brilho. A frequência de 980 Hz é bastante alta, então a maioria dos usuários sensíveis ao PWM não deve notar nenhuma oscilação. [pwm_comparison] Em comparação: 52 % de todos os dispositivos testados não usam PWM para escurecer a tela. Se PWM foi detectado, uma média de 7798 (mínimo: 5 - máximo: 343500) Hz foi medida. | |||
| Cinebench R10 | |
| Rendering Multiple CPUs 32Bit | |
| Microsoft Surface Laptop 3 13 Core i5-1035G7 | |
| Média Intel Core i7-10510U (6763 - 26265, n=3) | |
| Rendering Single 32Bit | |
| Média Intel Core i7-10510U (5740 - 7748, n=3) | |
| Microsoft Surface Laptop 3 13 Core i5-1035G7 | |
| wPrime 2.10 - 1024m | |
| Microsoft Surface Laptop 3 13 Core i5-1035G7 | |
* ... menor é melhor
| PCMark 8 Home Score Accelerated v2 | 3883 pontos | |
| PCMark 8 Work Score Accelerated v2 | 5293 pontos | |
| PCMark 10 Score | 4661 pontos | |
Ajuda | ||
| Lenovo ThinkPad T490 20RY0002US Sabrent Rocket Q 1TB RKT30Q.1 | Lenovo ThinkPad T480-20L6S01V00 Samsung SSD PM981 MZVLB512HAJQ | Lenovo ThinkPad T460-20FN003LGE Toshiba HG6 THNSFJ256GCSU | Lenovo ThinkPad T470s-20HF0012US Samsung PM961 MZVLW256HEHP | Lenovo ThinkPad T450-20BV001VGE Samsung SSD PM851 256 GB MZ7TE256HMHP | Lenovo ThinkPad T495s-20QKS01E00 Samsung PM981a MZVLB1T0HBLR | |
|---|---|---|---|---|---|---|
| AS SSD | -282% | -76% | -3% | -60% | 15% | |
| Seq Read (MB/s) | 2073 | 1441 -30% | 503 -76% | 2691 30% | 508 -75% | 2661 28% |
| Seq Write (MB/s) | 1865 | 487.1 -74% | 432.8 -77% | 1170 -37% | 230 -88% | 2314 24% |
| 4K Read (MB/s) | 50.9 | 58 14% | 19.57 -62% | 48.84 -4% | 33.9 -33% | 45.52 -11% |
| 4K Write (MB/s) | 157.6 | 1.76 -99% | 62.6 -60% | 147.9 -6% | 98.7 -37% | 105.3 -33% |
| 4K-64 Read (MB/s) | 689 | 1278 85% | 347 -50% | 1765 156% | 362.7 -47% | 1806 162% |
| 4K-64 Write (MB/s) | 1615 | 96.2 -94% | 114.5 -93% | 538 -67% | 184.2 -89% | 1650 2% |
| Access Time Read * (ms) | 0.043 | 0.041 5% | 0.133 -209% | 0.06 -40% | 0.04 7% | |
| Access Time Write * (ms) | 0.07 | 2.515 -3493% | 0.061 13% | 0.025 64% | 0.033 53% | 0.041 41% |
| Score Read (Points) | 947 | 1480 56% | 417 -56% | 2083 120% | 447 -53% | 2118 124% |
| Score Write (Points) | 1959 | 147 -92% | 220 -89% | 803 -59% | 306 -84% | 1986 1% |
| Score Total (Points) | 3394 | 2348 -31% | 852 -75% | 3875 14% | 980 -71% | 5169 52% |
| Copy ISO MB/s (MB/s) | 3024 | 921 -70% | 797 -74% | 225.8 -93% | 1131 -63% | |
| Copy Program MB/s (MB/s) | 715 | 254.8 -64% | 291 -59% | 153.3 -79% | 267.1 -63% | |
| Copy Game MB/s (MB/s) | 1650 | 676 -59% | 309.9 -81% | 191.2 -88% | 691 -58% | |
| CrystalDiskMark 5.2 / 6 | -28% | -15% | ||||
| Write 4K (MB/s) | 227.2 | 153.1 -33% | 142.3 -37% | |||
| Read 4K (MB/s) | 55.3 | 48.3 -13% | 46.69 -16% | |||
| Write Seq (MB/s) | 1411 | 866 -39% | ||||
| Read Seq (MB/s) | 1046 | 904 -14% | ||||
| Write 4K Q32T1 (MB/s) | 643 | 424.6 -34% | 268.3 -58% | |||
| Read 4K Q32T1 (MB/s) | 625 | 403.2 -35% | 359.6 -42% | |||
| Write Seq Q32T1 (MB/s) | 1972 | 1725 -13% | 3033 54% | |||
| Read Seq Q32T1 (MB/s) | 3247 | 1780 -45% | 3561 10% | |||
| Write 4K Q8T8 (MB/s) | 1491 | |||||
| Read 4K Q8T8 (MB/s) | 1499 | |||||
| Média Total (Programa/Configurações) | -155% /
-190% | -76% /
-76% | -3% /
-3% | -60% /
-60% | 0% /
6% |
* ... menor é melhor

| 3DMark 11 Performance | 2218 pontos | |
| 3DMark Cloud Gate Standard Score | 9432 pontos | |
| 3DMark Fire Strike Score | 1234 pontos | |
| 3DMark Time Spy Score | 492 pontos | |
Ajuda | ||
| baixo | média | alto | ultra | |
|---|---|---|---|---|
| BioShock Infinite (2013) | 87 | 41.5 | 34.5 | 10.8 |
| Lenovo ThinkPad T490 20RY0002US UHD Graphics 620, i7-10510U, Sabrent Rocket Q 1TB RKT30Q.1 | Lenovo ThinkPad T480-20L6S01V00 GeForce MX150, i5-8550U, Samsung SSD PM981 MZVLB512HAJQ | Lenovo ThinkPad T470-20HD002HGE HD Graphics 620, i5-7200U, Samsung PM961 NVMe MZVLW512HMJP | Lenovo ThinkPad T460-20FN003LGE HD Graphics 520, 6200U, Toshiba HG6 THNSFJ256GCSU | Lenovo ThinkPad T450-20BV001VGE HD Graphics 5500, 5200U, Samsung SSD PM851 256 GB MZ7TE256HMHP | Lenovo ThinkPad T495s-20QKS01E00 Vega 10, R7 PRO 3700U, Samsung PM981a MZVLB1T0HBLR | |
|---|---|---|---|---|---|---|
| Noise | -0% | 4% | -1% | 0% | 3% | |
| desligado / ambiente * (dB) | 28.2 | 29 -3% | 28 1% | 29 -3% | 28.9 -2% | |
| Idle Minimum * (dB) | 28.2 | 29 -3% | 28 1% | 29 -3% | 29.2 -4% | 28.9 -2% |
| Idle Average * (dB) | 28.2 | 29 -3% | 28 1% | 29 -3% | 29.2 -4% | 28.9 -2% |
| Idle Maximum * (dB) | 29.2 | 29 1% | 29.4 -1% | 29 1% | 29.2 -0% | 28.9 1% |
| Load Average * (dB) | 35.5 | 35.6 -0% | 31.4 12% | 34.2 4% | 34.9 2% | 31.5 11% |
| Load Maximum * (dB) | 38 | 35.6 6% | 34.6 9% | 37.8 1% | 35.1 8% | 33.8 11% |
| Witcher 3 ultra * (dB) | 32.5 |
* ... menor é melhor
Barulho
| Ocioso |
| 28.2 / 28.2 / 29.2 dB |
| Carga |
| 35.5 / 38 dB |
 | ||
30 dB silencioso 40 dB(A) audível 50 dB(A) ruidosamente alto |
||
min: | ||
(-) A temperatura máxima no lado superior é 50.8 °C / 123 F, em comparação com a média de 34.3 °C / 94 F , variando de 21.2 a 62.5 °C para a classe Office.
(-) A parte inferior aquece até um máximo de 61.6 °C / 143 F, em comparação com a média de 36.8 °C / 98 F
(+) Em uso inativo, a temperatura média para o lado superior é 29.1 °C / 84 F, em comparação com a média do dispositivo de 29.5 °C / ### class_avg_f### F.
(+) Os apoios para as mãos e o touchpad estão atingindo a temperatura máxima da pele (32.4 °C / 90.3 F) e, portanto, não estão quentes.
(-) A temperatura média da área do apoio para as mãos de dispositivos semelhantes foi 27.5 °C / 81.5 F (-4.9 °C / -8.8 F).
| desligado | |
| Ocioso | |
| Carga |
|
Key:
min: | |
| Lenovo ThinkPad T490 20RY0002US i7-10510U, UHD Graphics 620, Sabrent Rocket Q 1TB RKT30Q.1, IPS, 1920x1080, 14" | Lenovo ThinkPad T480-20L6S01V00 i5-8550U, GeForce MX150, Samsung SSD PM981 MZVLB512HAJQ, IPS, 1920x1080, 14" | Lenovo ThinkPad T470-20HD002HGE i5-7200U, HD Graphics 620, Samsung PM961 NVMe MZVLW512HMJP, IPS, 1920x1080, 14" | Lenovo ThinkPad T460-20FN003LGE 6200U, HD Graphics 520, Toshiba HG6 THNSFJ256GCSU, IPS, 1920x1080, 14" | Lenovo ThinkPad T450-20BV001VGE 5200U, HD Graphics 5500, Samsung SSD PM851 256 GB MZ7TE256HMHP, TN-Panel, 1600x900, 14" | Lenovo ThinkPad T495s-20QKS01E00 R7 PRO 3700U, Vega 10, Samsung PM981a MZVLB1T0HBLR, IPS, 1920x1080, 14" | |
|---|---|---|---|---|---|---|
| Power Consumption | -20% | 22% | 18% | 24% | -5% | |
| Idle Minimum * (Watt) | 4.3 | 3.6 16% | 3.21 25% | 3.5 19% | 3 30% | 4.7 -9% |
| Idle Average * (Watt) | 7 | 7.1 -1% | 6.15 12% | 6.7 4% | 5.5 21% | 7.28 -4% |
| Idle Maximum * (Watt) | 7.2 | 9.5 -32% | 6.82 5% | 7.3 -1% | 6.4 11% | 9.48 -32% |
| Load Average * (Watt) | 34.9 | 63.9 -83% | 28.5 18% | 28.2 19% | 28.4 19% | 35.3 -1% |
| Load Maximum * (Watt) | 68.4 | 67.3 2% | 34.5 50% | 34.6 49% | 40.7 40% | 55.5 19% |
| Witcher 3 ultra * (Watt) | 53.9 |
* ... menor é melhor
| Lenovo ThinkPad T490 20RY0002US i7-10510U, UHD Graphics 620, 50 Wh | Lenovo ThinkPad T480-20L6S01V00 i5-8550U, GeForce MX150, 72 Wh | Lenovo ThinkPad T470-20HD002HGE i5-7200U, HD Graphics 620, 48 Wh | Lenovo ThinkPad T460-20FN003LGE 6200U, HD Graphics 520, 46 Wh | Lenovo ThinkPad T450-20BV001VGE 5200U, HD Graphics 5500, 48 Wh | Lenovo ThinkPad T495s-20QKS01E00 R7 PRO 3700U, Vega 10, 57 Wh | |
|---|---|---|---|---|---|---|
| Duração da bateria | 57% | -13% | -33% | -36% | 35% | |
| WiFi v1.3 (h) | 8.4 | 13.2 57% | 7.3 -13% | 5.6 -33% | 5.4 -36% | 11.3 35% |
| Reader / Idle (h) | 27.9 | 15.9 | 15.6 | |||
| Load (h) | 2.7 | 1.8 | 1.6 | 1.6 |
Pro
Contra

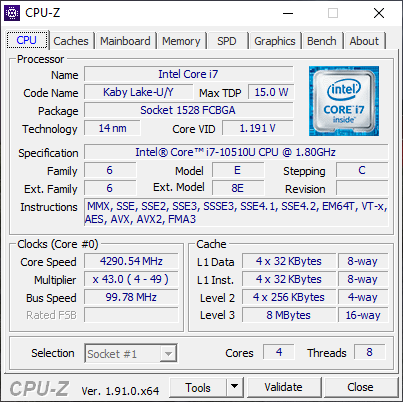
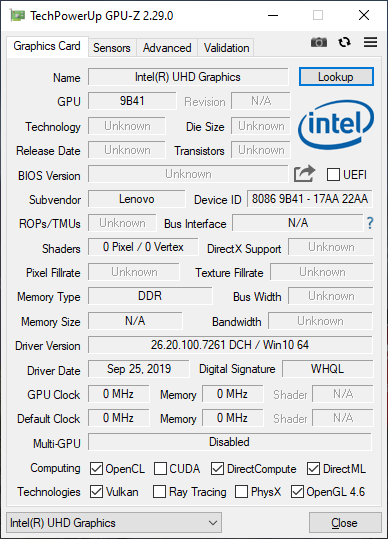
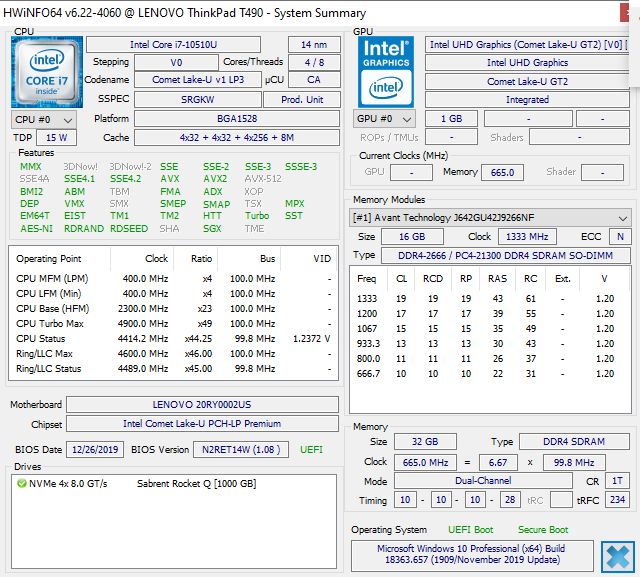
Conforme observado em nossa visão geral inicial da série, os benefícios do desempenho bruto do Comet Lake-U sobre Whiskey Lake-U são marginais, exceto para o Core i7-10710U de seis núcleos, que infelizmente não está disponível no ThinkPad T490. Em vez disso, os usuários podem configurar apenas o Core i7-10510U de quatro núcleos.
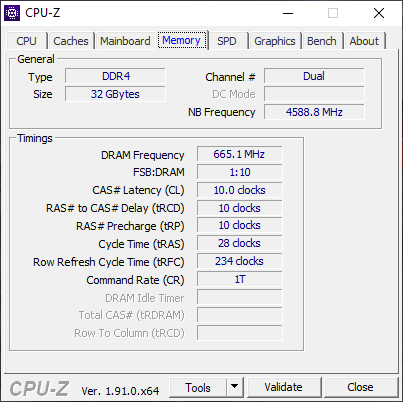
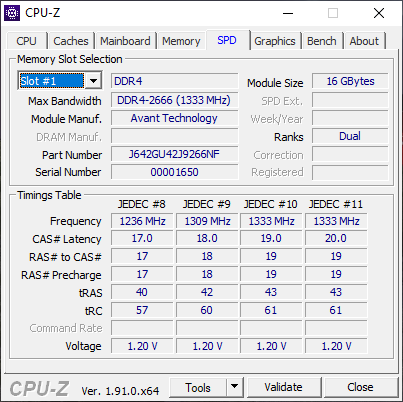
Além da atualização da CPU, os SKUs Comet Lake-U ThinkPad T490 possuem RAM mais rápida (DDR4-2400 a DDR4-2666) e Wi-Fi (802.11ac a 802.11ax) que os SKUs Whiskey Lake-U mais antigos. As diferenças entre gerações, no entanto, são novamente marginais, na melhor das hipóteses.
Para maximizar o valor, recomendamos uma configuração mais antiga do Whiskey Lake-U com uma das opções de tela mais brilhantes da Lenovo. O T490 oferece painéis FHD de 400 nit e WQHD de 500 nit para ser mais brilhante do que a tela de 300 nit que temos aqui. Investir em uma tela melhor será muito mais perceptível do que o salto da Intel de 8ª para 10ª geração a esse respeito.
As alterações de CPU, RAM e WLAN são pequenas atualizações em relação ao modelo do ano passado. Se você deseja um ThinkPad da série T de 14 polegadas, aguarde o ThinkPad T14 ou simplesmente opte pela configuração Whiskey Lake-U T490.
Lenovo ThinkPad T490 20RY0002US
- 03/06/2020 v7 (old)
Allen Ngo
Price comparison
