Lenovo ThinkPad T14 G3 review - Laptop comercial é pior com Intel e Nvidia
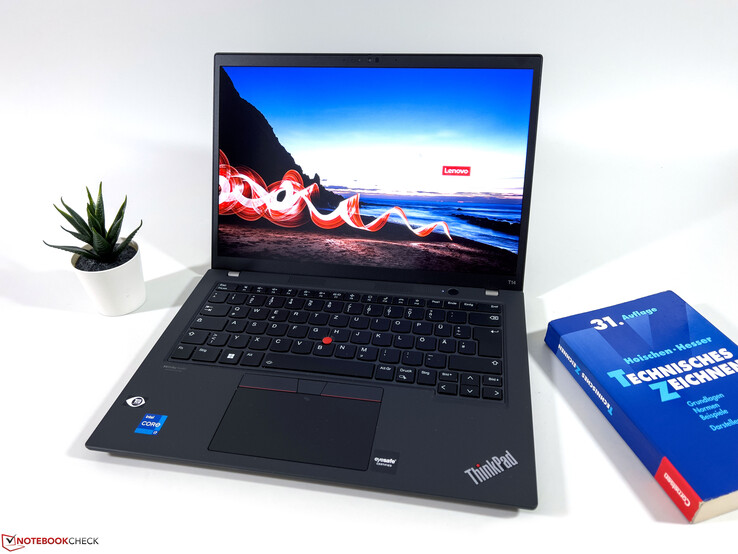
Já testamos oThinkPad T14 G3 versão com o AMD Ryzen 7 Proincluindo o rápido Radeon 680M iGPU extensivamente, mas a Lenovo também continua a oferecer o laptop comercial de 14 polegadas com processadores Intel e GPU opcional Nvidia GeForce. Com o modelo 21AJS00400, agora temos um representante que combina o Alder Lake Core i7-1260Pcom o GeForce MX550 em nosso banco de testes. Podemos negligenciar o fato de que um processador Raptor Lake ainda não é usado aqui, uma vez que o aumento de desempenho seria apenas pequeno, já que nós já capaz de ver.
Basicamente, a AMD e o modelo Intel compartilham o mesmo estojo e dispositivos de entrada, webcam e alto-falantes. No teste seguinte, portanto, vamos nos concentrar principalmente na questão de qual versão é melhor e se a placa gráfica adicional ainda vale realmente a pena.
Possíveis concorrentes em comparação
Avaliação | Data | Modelo | Peso | Altura | Size | Resolução | Preço |
|---|---|---|---|---|---|---|---|
| 86.4 % v7 (old) | 03/2023 | Lenovo ThinkPad T14 G3-21AJS00400 i7-1260P, GeForce MX550 | 1.5 kg | 17.9 mm | 14.00" | 1920x1200 | |
| 88.8 % v7 (old) | 09/2022 | Lenovo ThinkPad T14 G3-21CF004NGE R7 PRO 6850U, Radeon 680M | 1.4 kg | 17.9 mm | 14.00" | 1920x1200 | |
| 88.7 % v7 (old) | 12/2022 | HP EliteBook 840 G9 i7-1280P, Iris Xe G7 96EUs | 1.5 kg | 19 mm | 14.00" | 1920x1200 | |
| 88.8 % v7 (old) | 10/2022 | Schenker Vision 14 2022 RTX 3050 Ti i7-12700H, GeForce RTX 3050 Ti Laptop GPU | 1.3 kg | 16.6 mm | 14.00" | 2880x1800 | |
| 90.3 % v7 (old) | 09/2022 | Huawei MateBook X Pro 2022 i7-1260P, Iris Xe G7 96EUs | 1.3 kg | 15.6 mm | 14.20" | 3120x2080 |
Diferenças com o ThinkPad T14 G3 AMD
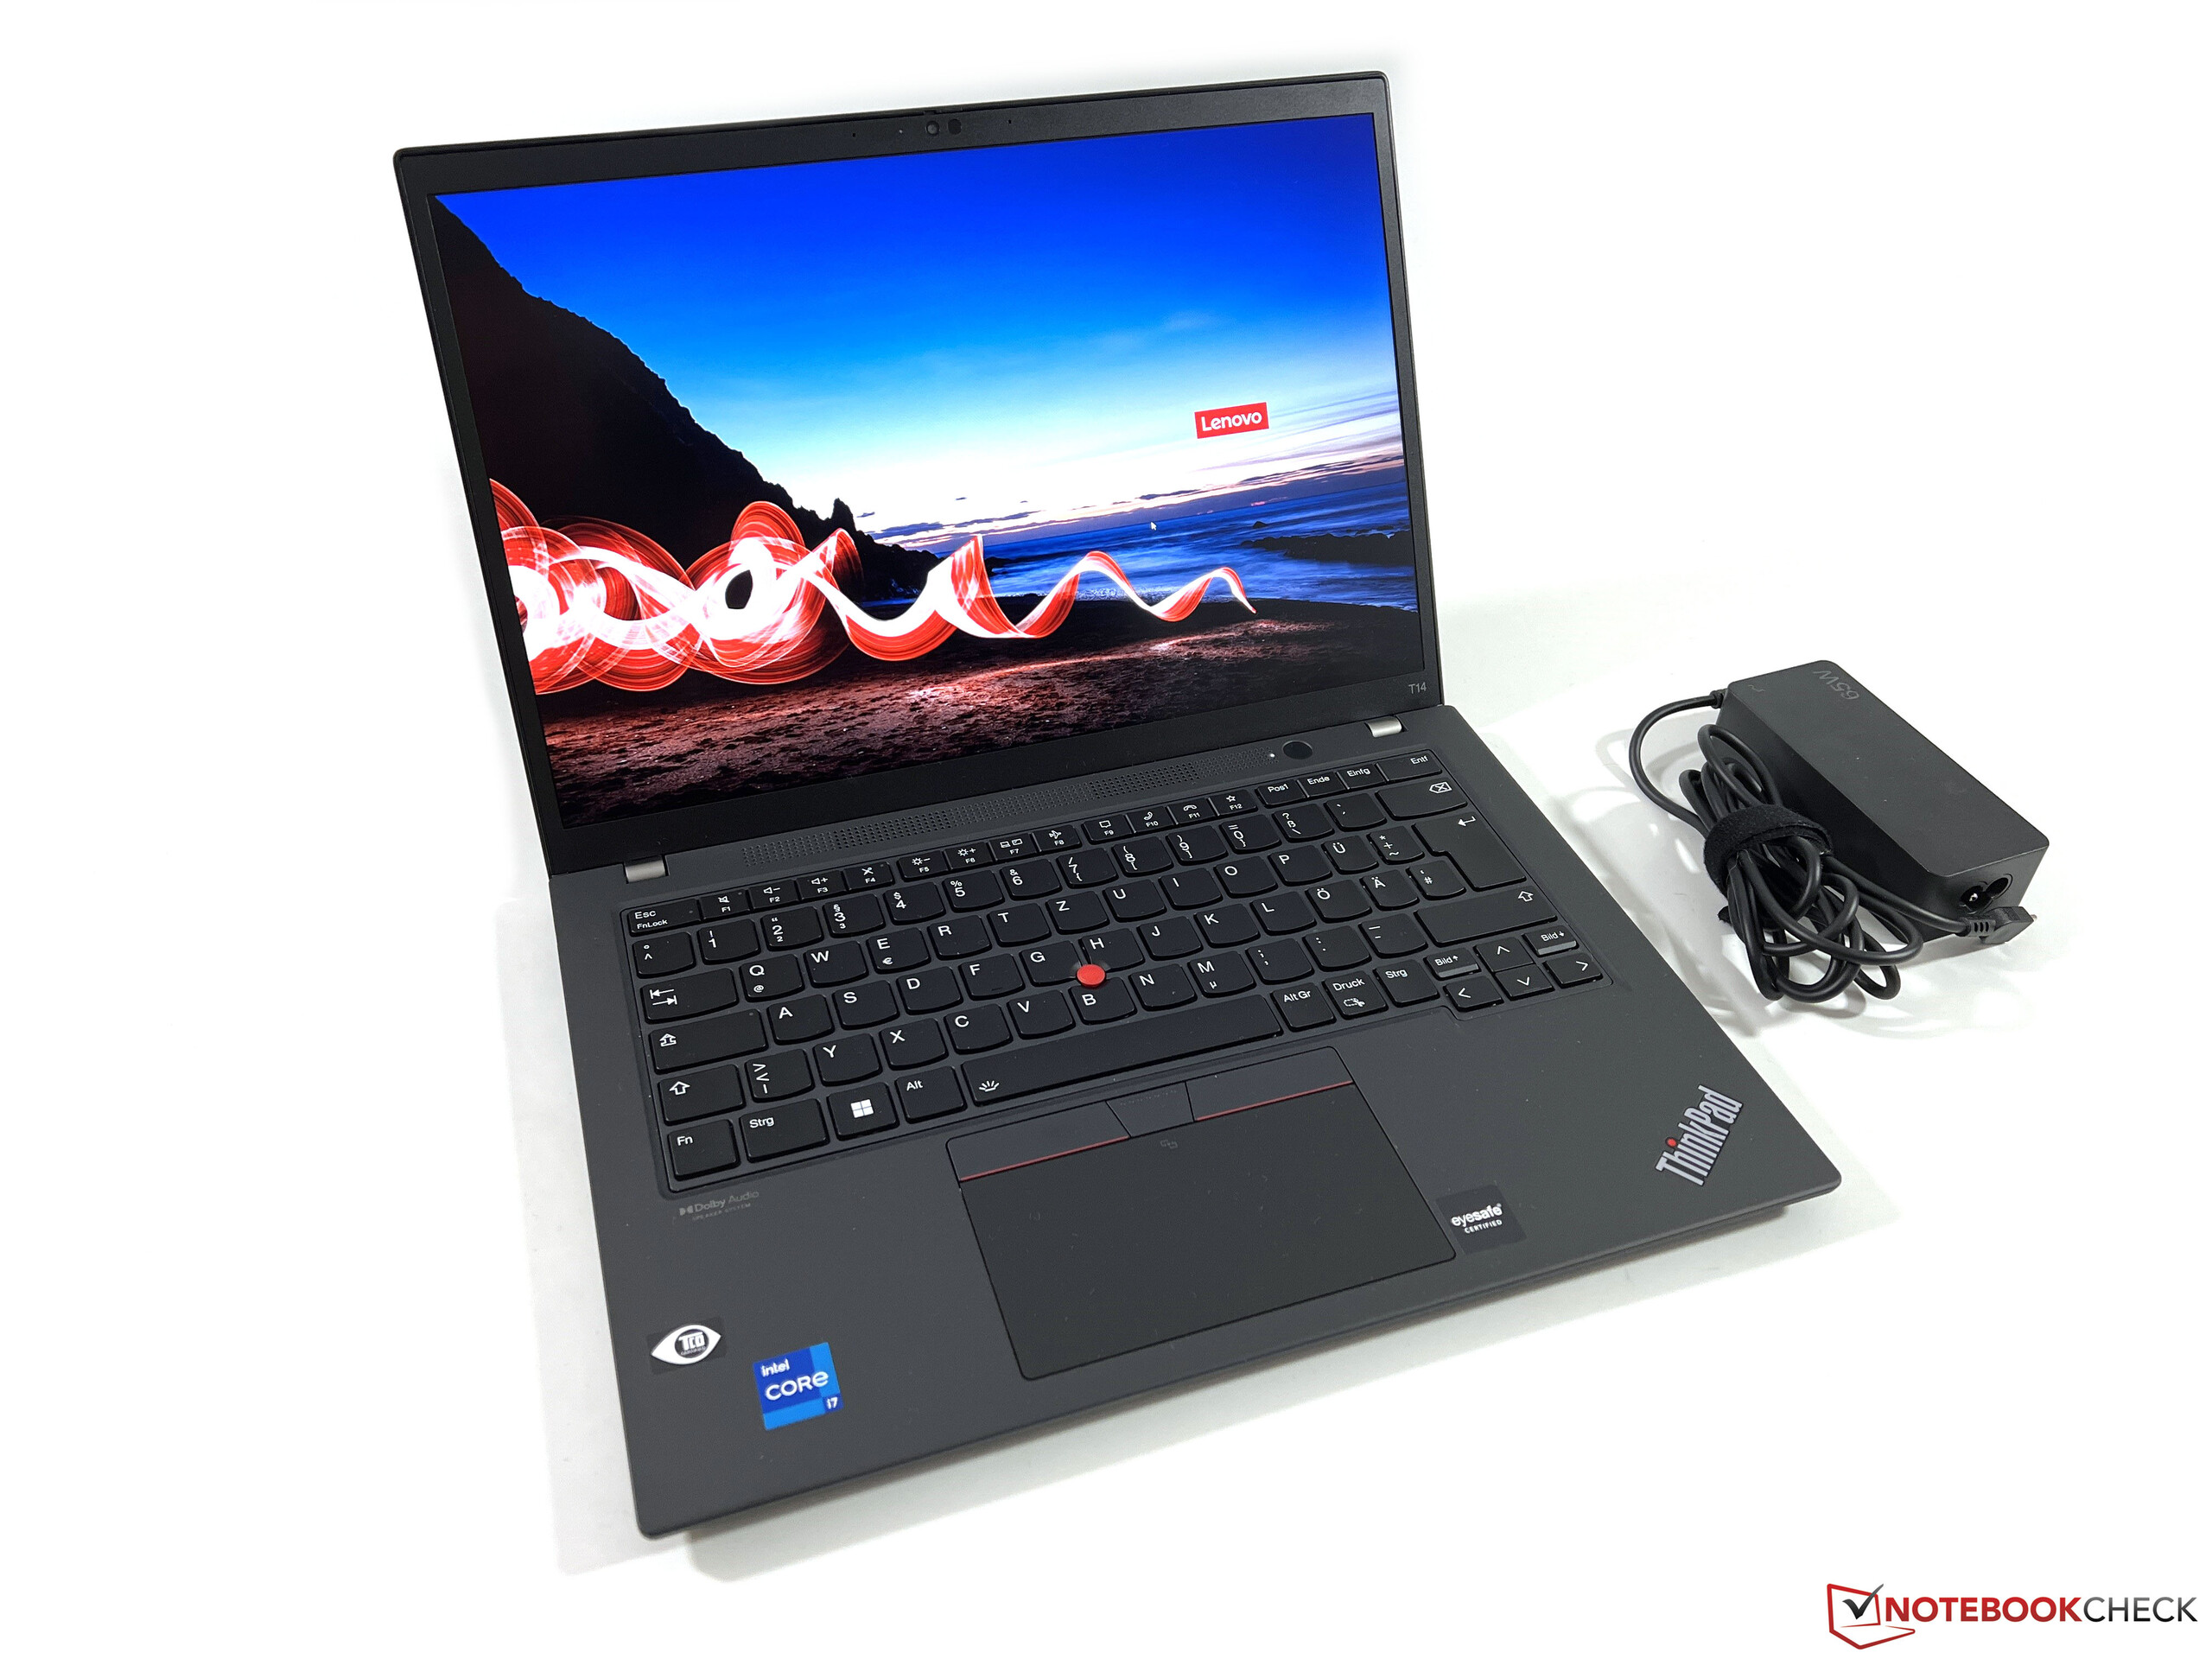
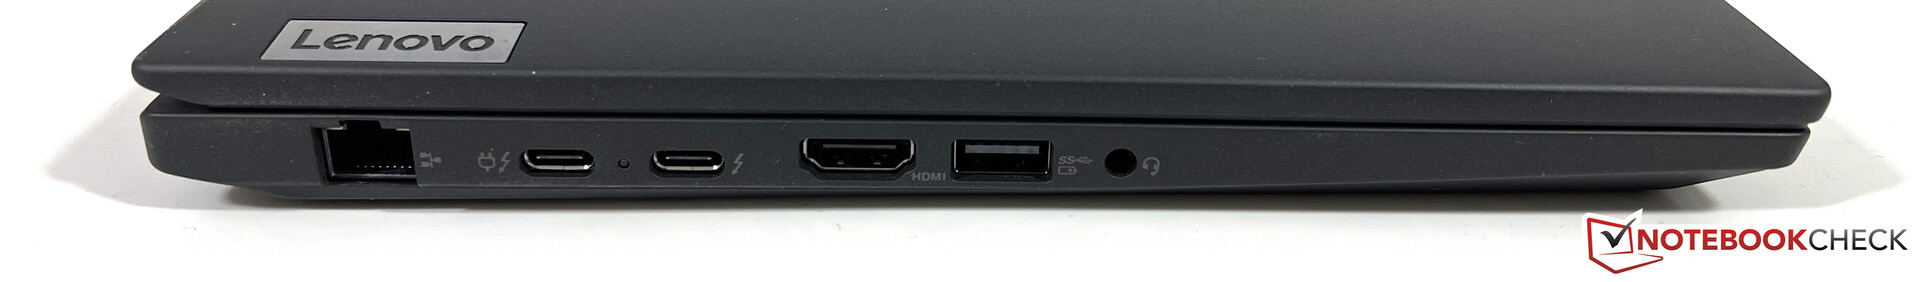
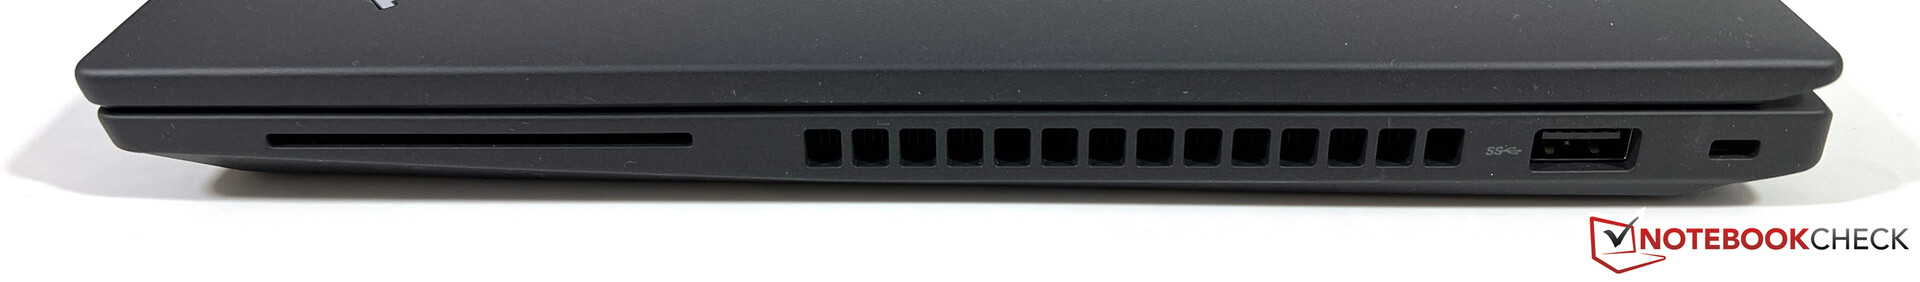
Além dos diferentes adesivos no apoio de palma, não há diferenças no exterior das duas versões do ThinkPad T14, por isso, remetemos você para nosso teste extensivo do modelo AMDsobre isto. As conexões básicas também são as mesmas, mas enquanto a Lenovo renuncia ao USB 4.0 no modelo AMD, a versão Intel vem com duas conexões USB-C que suportam o Thunderbolt 4.
Com a placa AX211 WLAN, o modelo Intel também suporta a moderna rede 6-GHz, mas não conseguimos nos conectar à rede correspondente usando nosso roteador de rede de referência durante o teste. Entretanto, o desempenho na rede normal de 5G também foi muito bom. Nossa unidade de teste está pronta para o WWAN, e o slot Nano-SIM na parte traseira, bem como as antenas necessárias para o módulo LTE, já estão instaladas.
| Networking | |
| Lenovo ThinkPad T14 G3-21AJS00400 | |
| iperf3 receive AXE11000 | |
| iperf3 transmit AXE11000 | |
| Lenovo ThinkPad T14 G3-21CF004NGE | |
| iperf3 receive AXE11000 6GHz | |
| iperf3 transmit AXE11000 6GHz | |
| HP EliteBook 840 G9 | |
| iperf3 receive AXE11000 6GHz | |
| iperf3 receive AXE11000 | |
| iperf3 transmit AXE11000 6GHz | |
| iperf3 transmit AXE11000 | |
| Schenker Vision 14 2022 RTX 3050 Ti | |
| iperf3 receive AXE11000 | |
| iperf3 transmit AXE11000 | |
| Huawei MateBook X Pro 2022 | |
| iperf3 receive AXE11000 6GHz | |
| iperf3 transmit AXE11000 6GHz | |


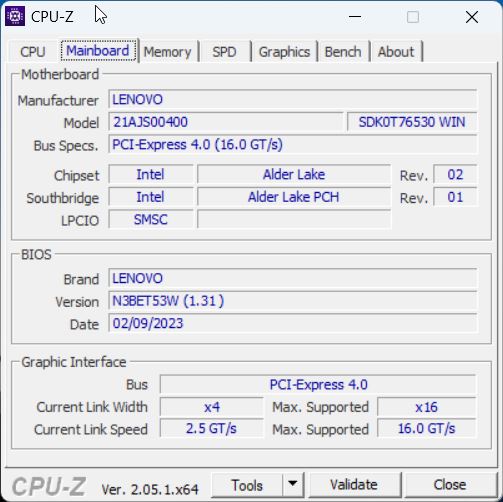
Manutenção
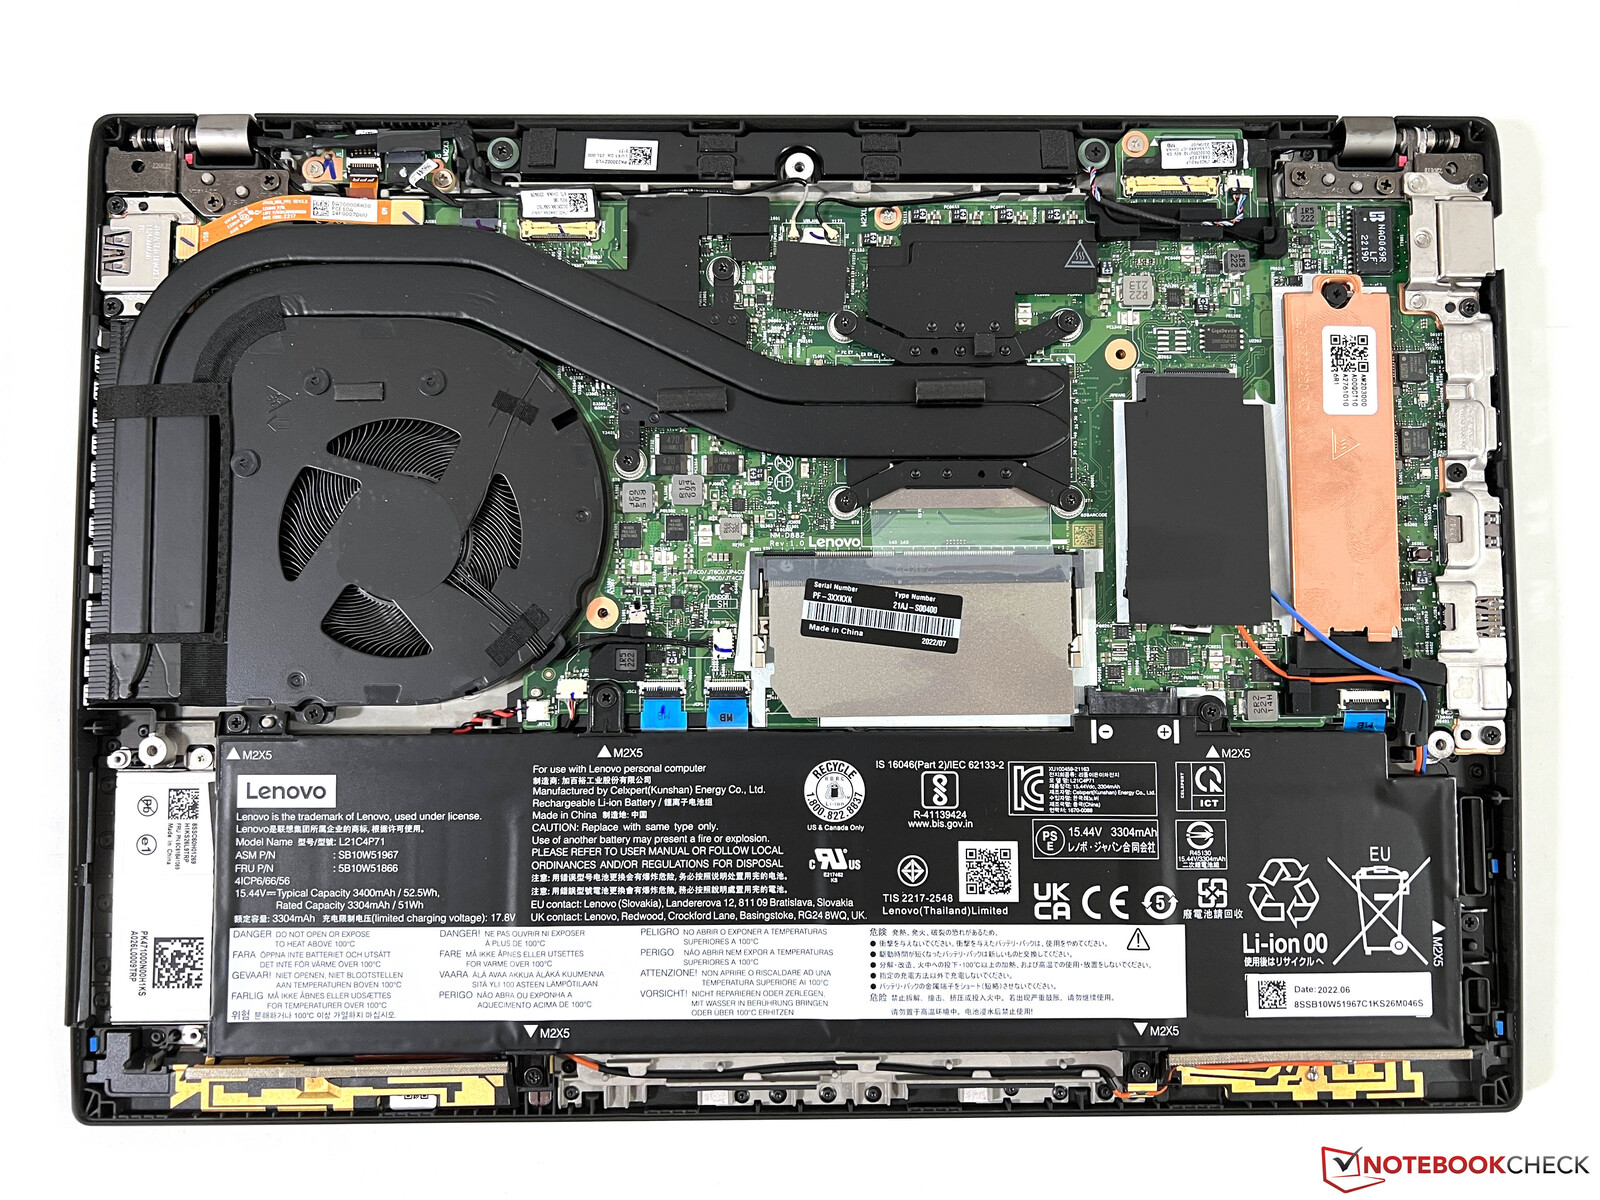
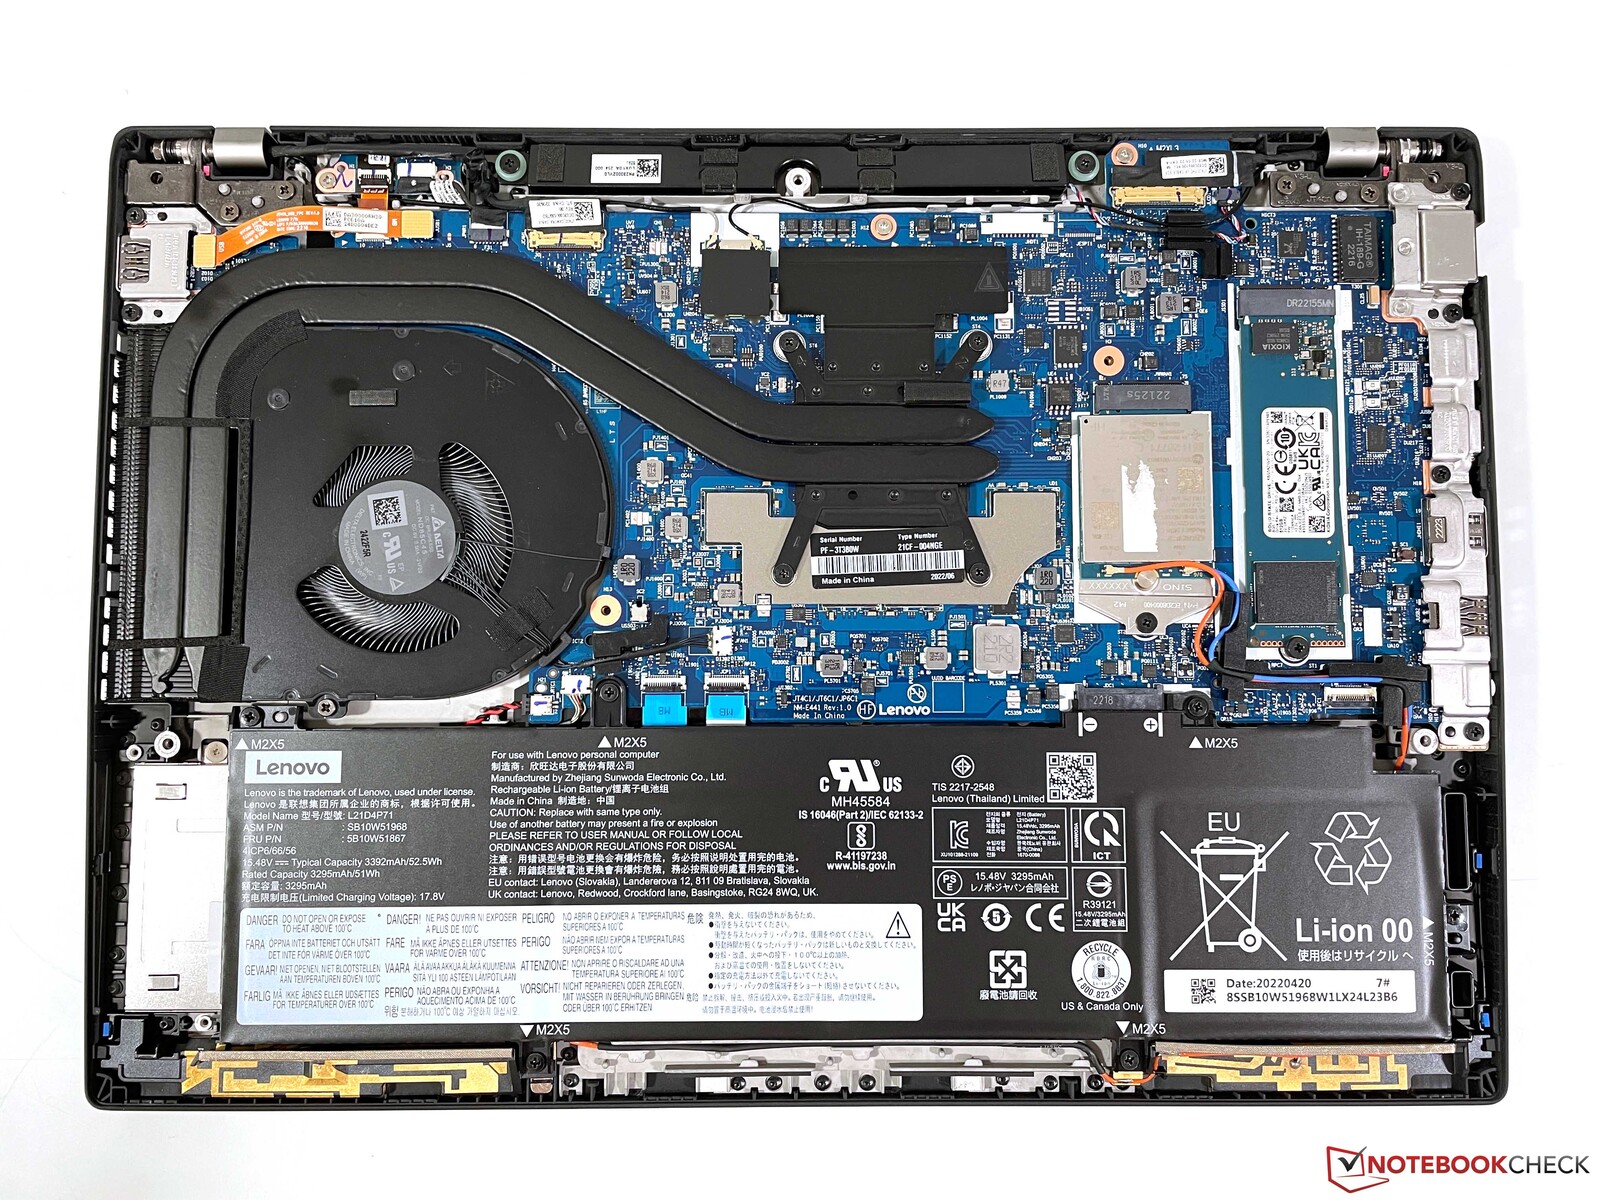
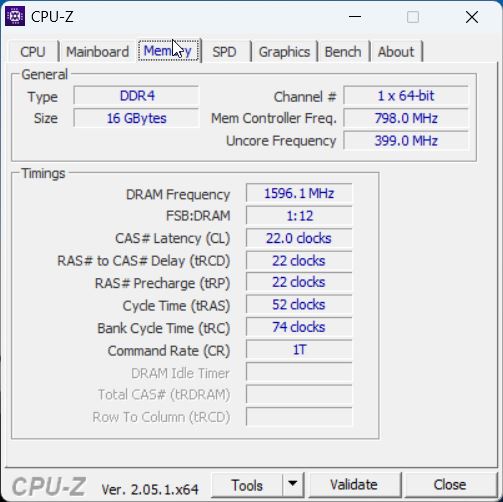
Há também uma diferença no layout interno. Enquanto a Lenovo entrega o Modelo AMDexclusivamente com RAM soldada sem oferecer nenhuma capacidade de expansão ao usuário, a situação parece diferente para o modelo Intel. Além de um módulo soldado (16 GB em nosso caso), há também um slot SO-DIMM gratuito, elevando a quantidade total possível de RAM para 48 GB.
Display - A loteria do painel continua
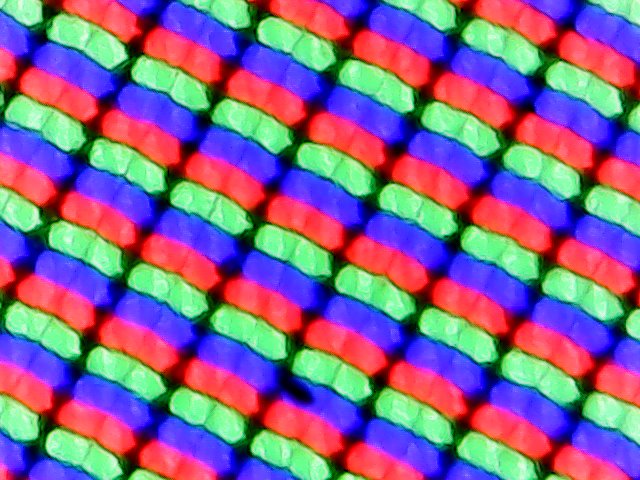
Como já nos modelos ThinkPad anteriores, a Lenovo também utiliza vários fabricantes de painéis para os modelos atuais. Embora ambas as nossas unidades de teste estejam equipadas com o painel de 14 polegadas LowPower Full-HD, há diferenças aqui, mesmo que as especificações técnicas básicas de ambas as versões (ou até mais, já que havia até 4 versões no passado) sejam mantidas. Em contraste com oPainel LG de nossa unidade de teste AMD anteriora unidade de teste atual da Intel utiliza um painel da AUO, que subjetivamente não é completamente convincente, uma vez que as áreas brilhantes parecem ligeiramente granulosas. Os tempos de resposta também são significativamente mais lentos aqui, e há alguns efeitos fantasmas visíveis, por exemplo, ao mover o ponteiro do mouse. Entretanto, o PWM também não é usado aqui.
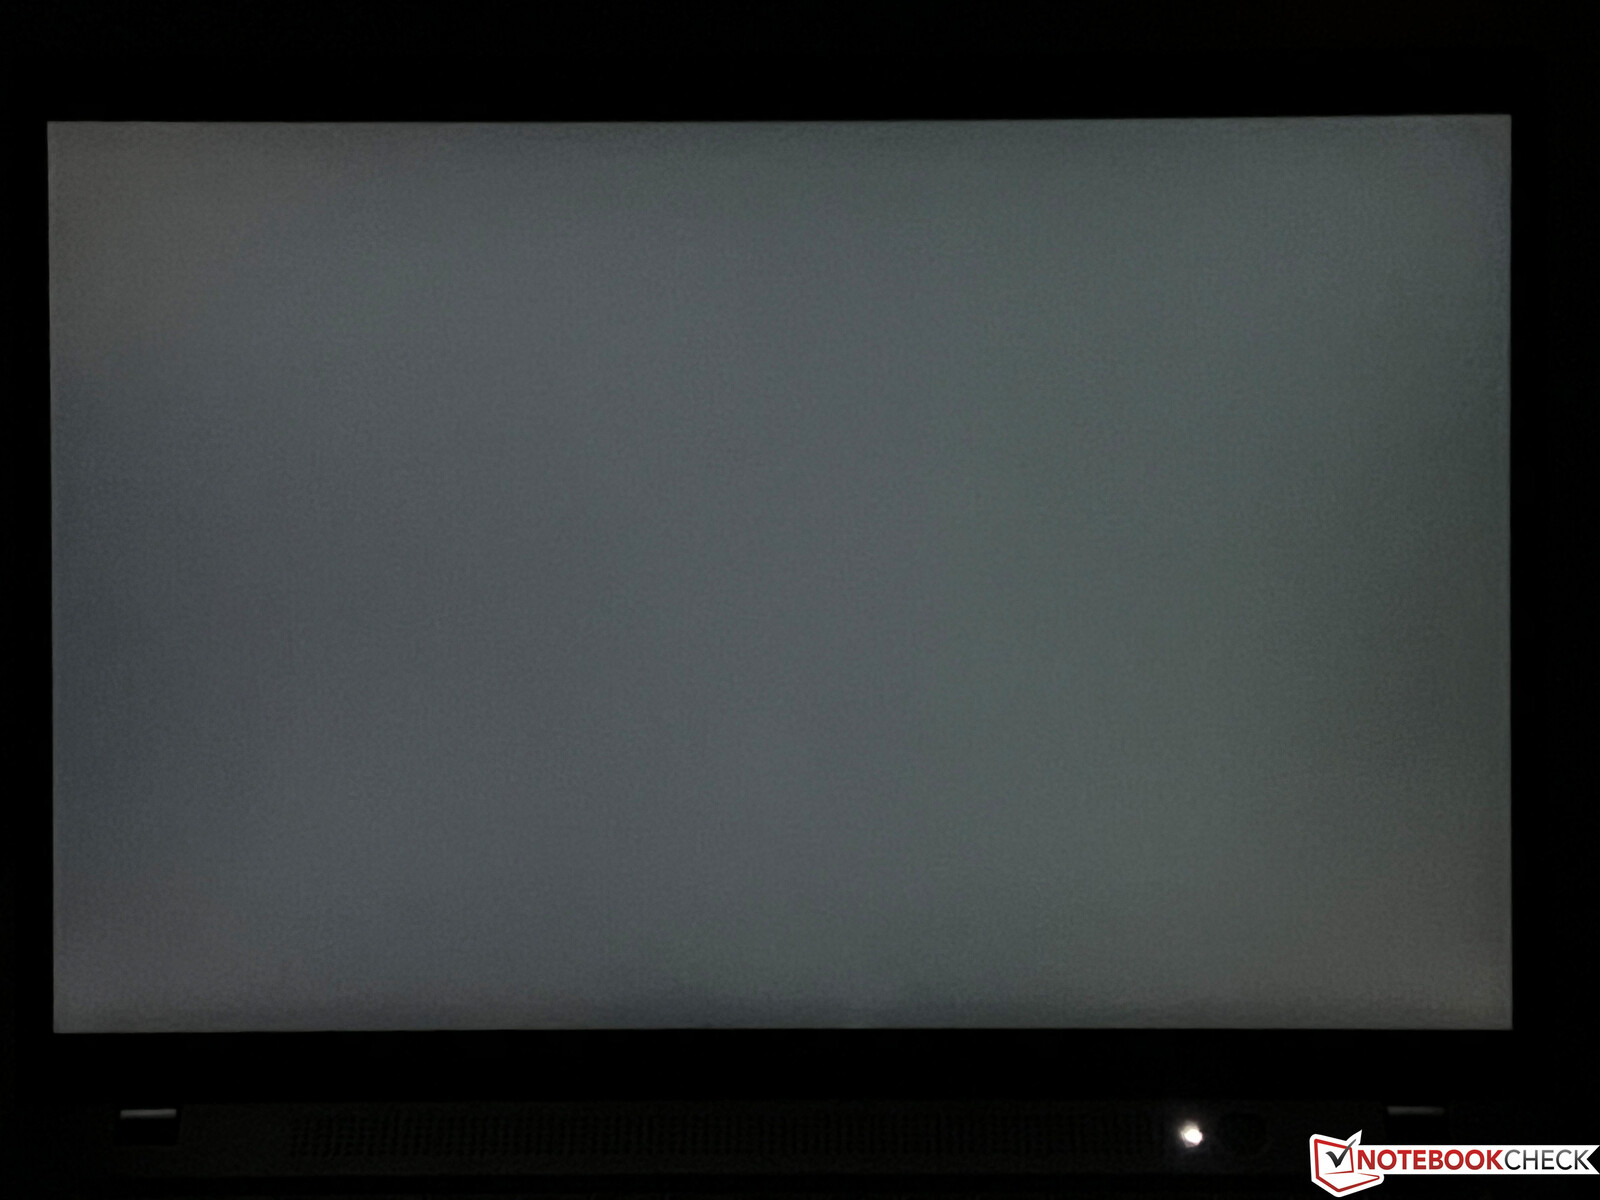
O mesmo vale para o brilho, que se revela inferior ao do modelo LG. No entanto, ele ainda atinge os 400 cd/m² anunciados. Graças ao baixo valor de preto, a relação de contraste não oferece nenhum motivo de reclamação. Nossa unidade de teste não tem nenhum problema com turvação ou sangramento na tela, nem mesmo no nível mais alto de luminosidade.
| |||||||||||||||||||||||||
iluminação: 91 %
iluminação com acumulador: 399 cd/m²
Contraste: 2105:1 (Preto: 0.19 cd/m²)
ΔE ColorChecker Calman: 3.5 | ∀{0.5-29.43 Ø4.71}
calibrated: 1.6
ΔE Greyscale Calman: 4.8 | ∀{0.09-98 Ø4.96}
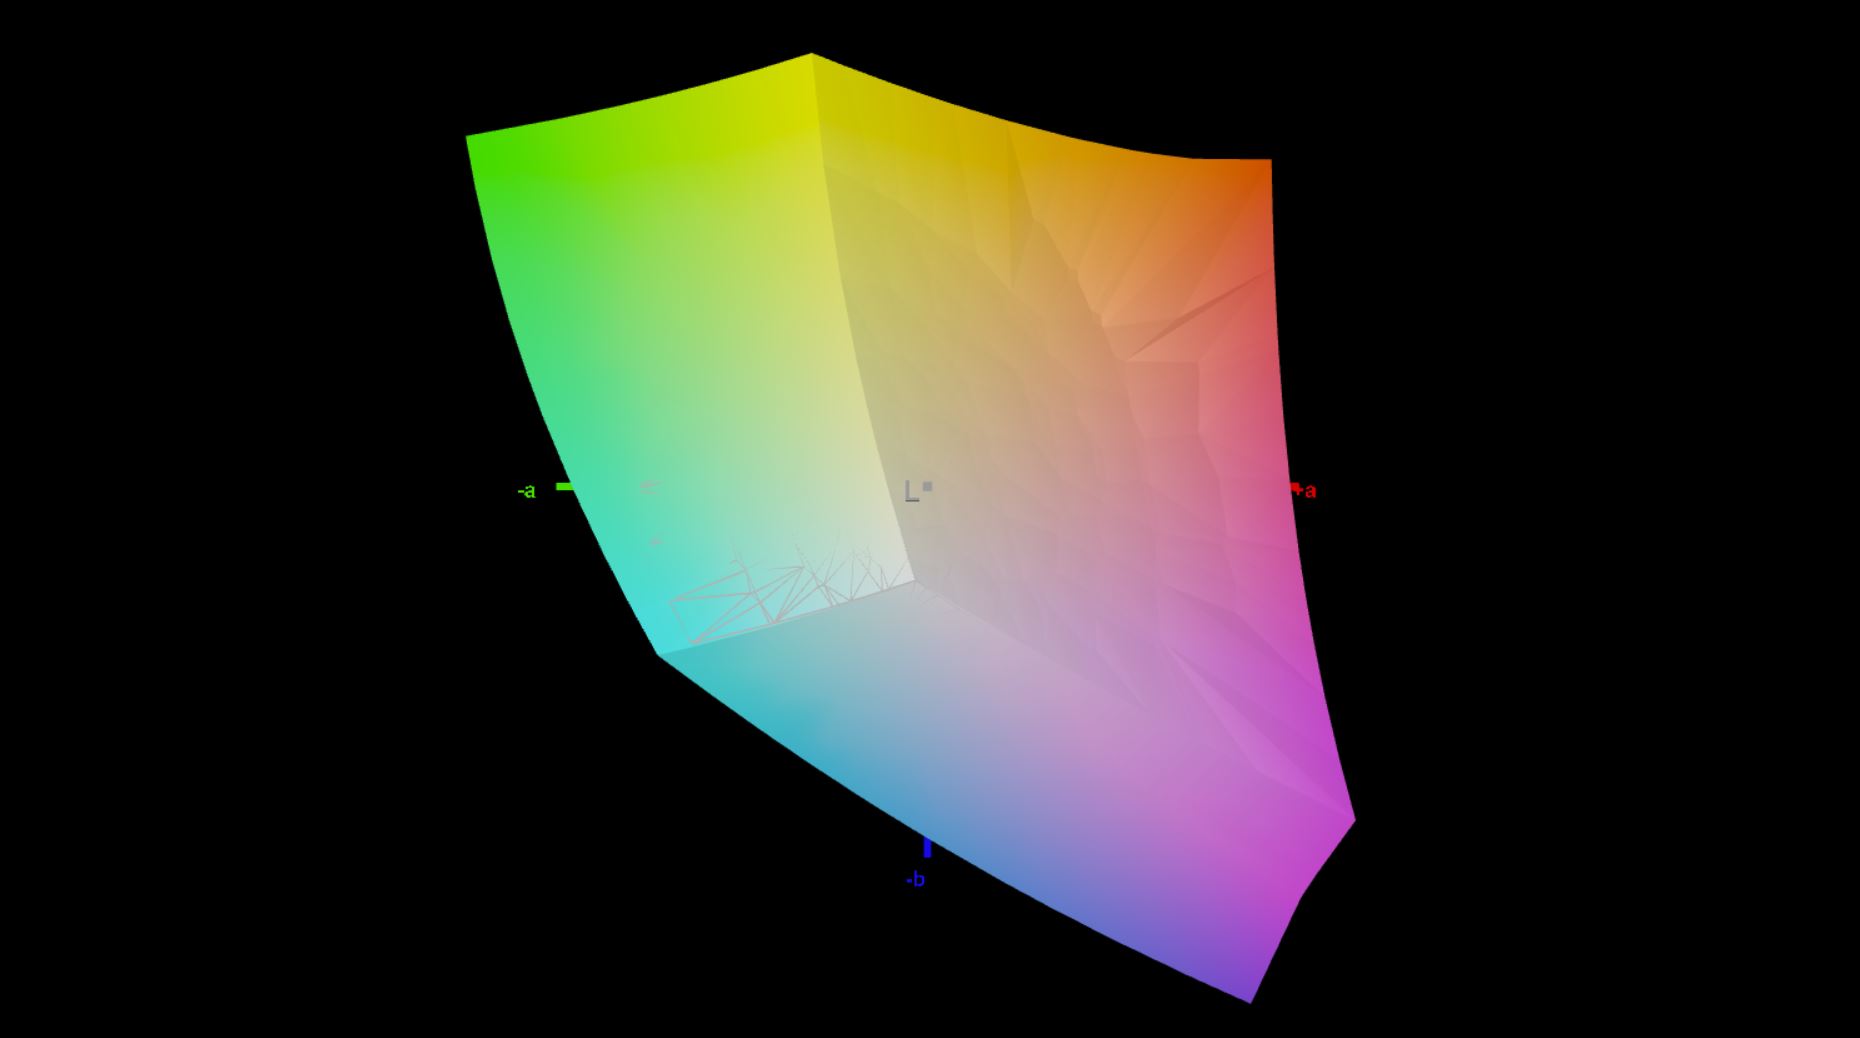
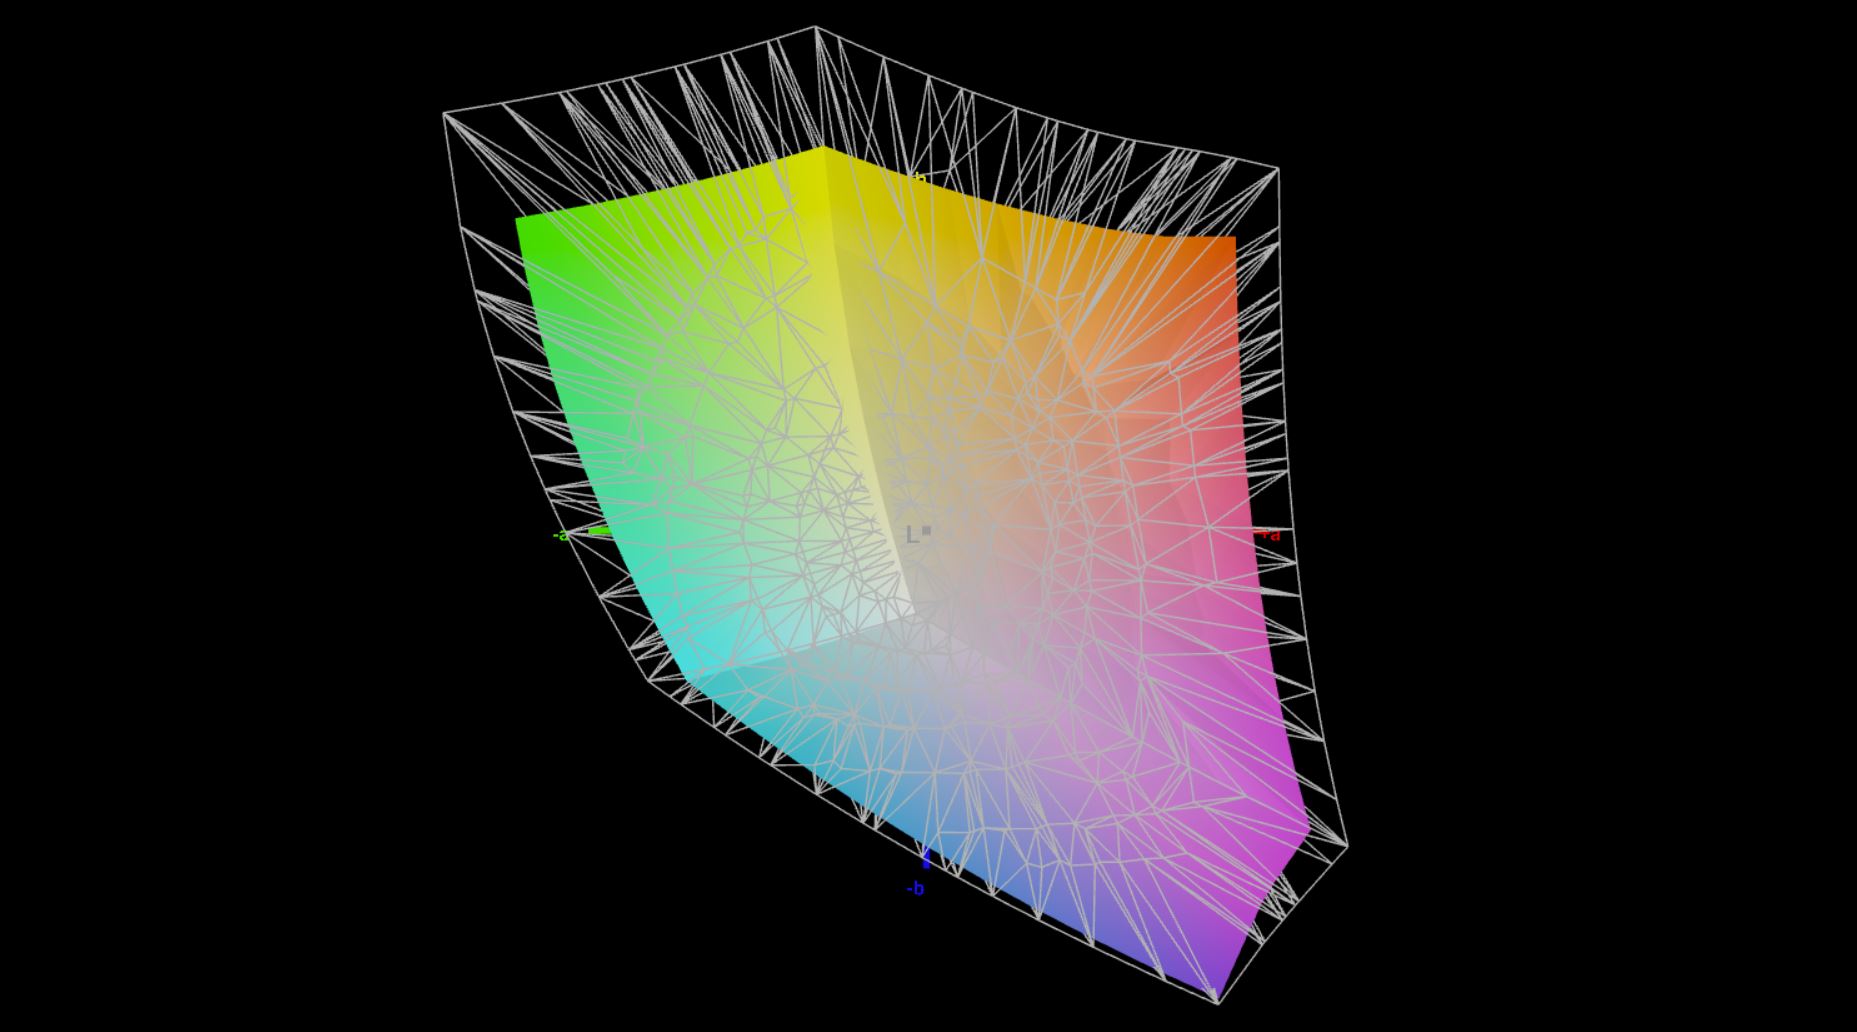
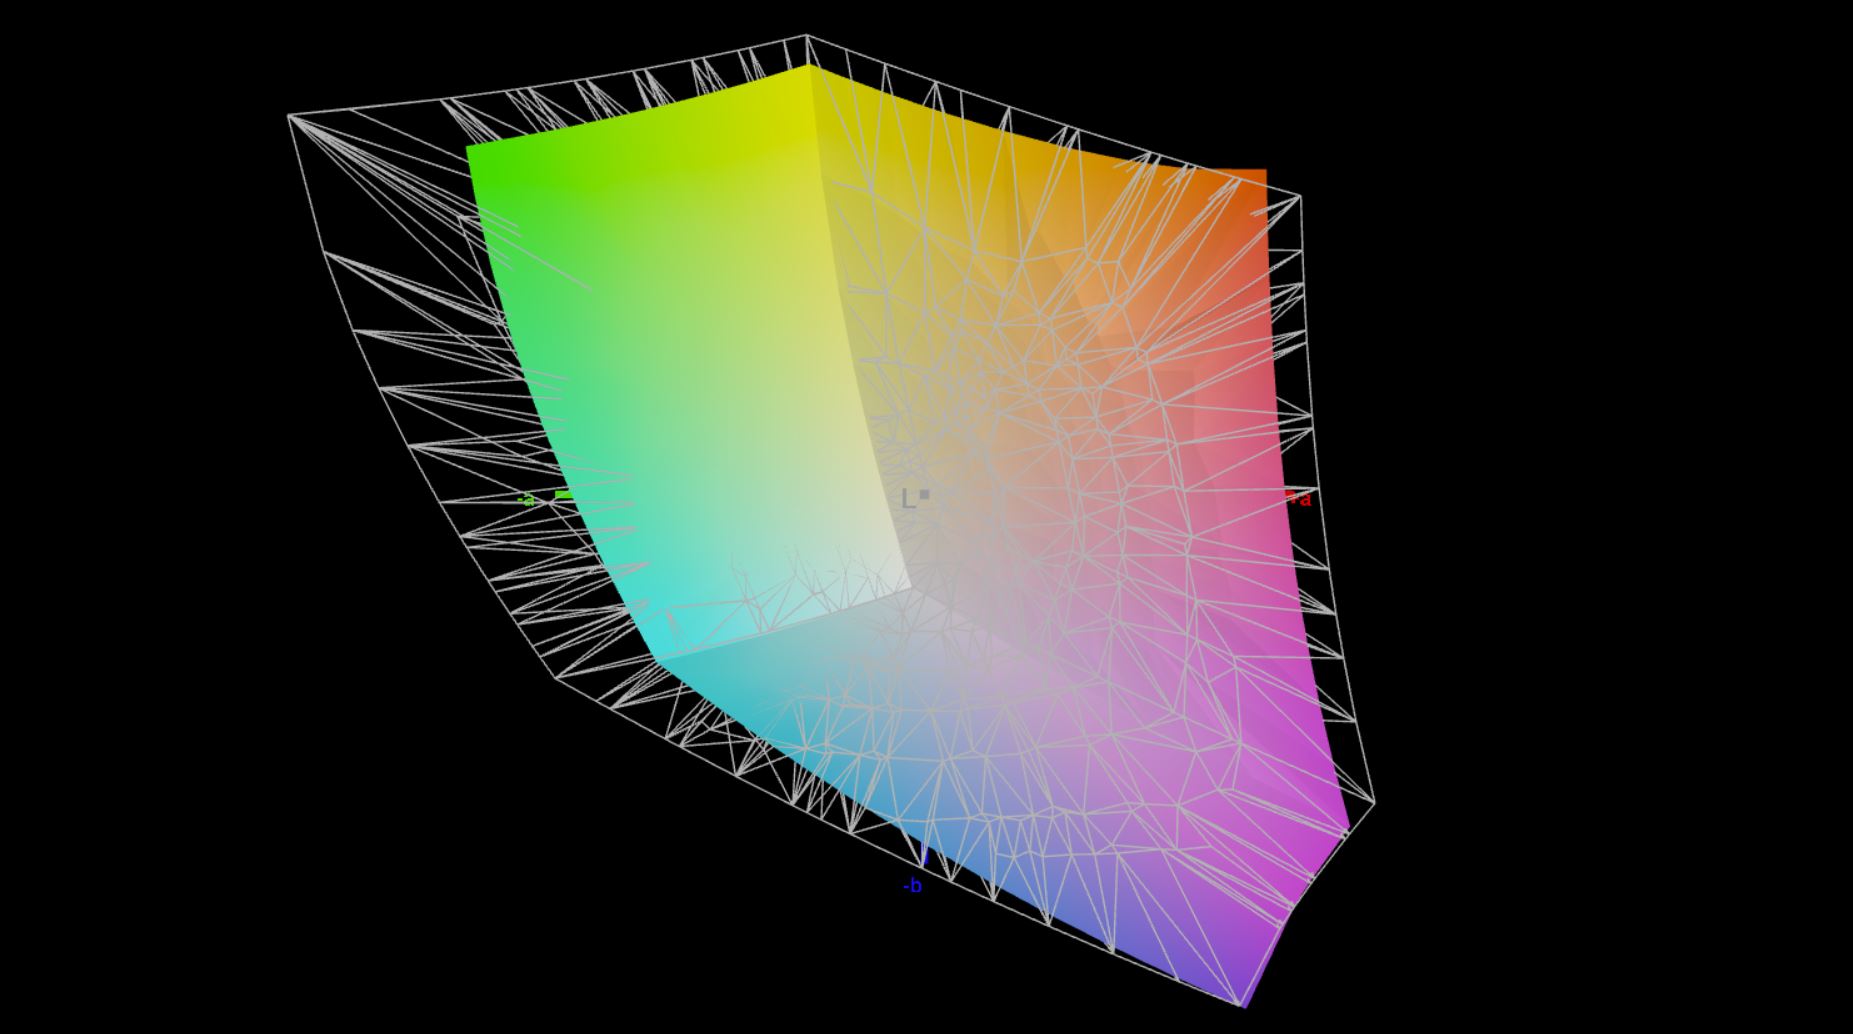
77.9% AdobeRGB 1998 (Argyll 3D)
100% sRGB (Argyll 3D)
76.3% Display P3 (Argyll 3D)
Gamma: 2.11
CCT: 6662 K
| Lenovo ThinkPad T14 G3-21AJS00400 B140UAN02.1, IPS, 1920x1200, 14" | Lenovo ThinkPad T14 G3-21CF004NGE LP140WU1-SPB2, IPS, 1920x1200, 14" | HP EliteBook 840 G9 Chi Mei CMN1435, IPS, 1920x1200, 14" | Schenker Vision 14 2022 RTX 3050 Ti MNE007ZA1-1, IPS, 2880x1800, 14" | Huawei MateBook X Pro 2022 TMX1422, IPS, 3120x2080, 14.2" | |
|---|---|---|---|---|---|
| Display | -7% | -8% | -3% | 12% | |
| Display P3 Coverage (%) | 76.3 | 69.2 -9% | 67.6 -11% | 74.1 -3% | 94.6 24% |
| sRGB Coverage (%) | 100 | 97.4 -3% | 98.7 -1% | 97.4 -3% | 99.5 0% |
| AdobeRGB 1998 Coverage (%) | 77.9 | 71.5 -8% | 69.7 -11% | 75.3 -3% | 86.5 11% |
| Response Times | 40% | -19% | 54% | 55% | |
| Response Time Grey 50% / Grey 80% * (ms) | 62.6 ? | 41.4 ? 34% | 66 ? -5% | 31.5 ? 50% | 25.4 ? 59% |
| Response Time Black / White * (ms) | 34.9 ? | 19.2 ? 45% | 46.4 ? -33% | 14.5 ? 58% | 17.1 ? 51% |
| PWM Frequency (Hz) | |||||
| Screen | 16% | 14% | -6% | 22% | |
| Brightness middle (cd/m²) | 400 | 451 13% | 391.3 -2% | 421 5% | 603 51% |
| Brightness (cd/m²) | 395 | 435 10% | 368 -7% | 416 5% | 586 48% |
| Brightness Distribution (%) | 91 | 94 3% | 86 -5% | 89 -2% | 91 0% |
| Black Level * (cd/m²) | 0.19 | 0.21 -11% | 0.32 -68% | 0.28 -47% | 0.39 -105% |
| Contrast (:1) | 2105 | 2148 2% | 1223 -42% | 1504 -29% | 1546 -27% |
| Colorchecker dE 2000 * | 3.5 | 2.4 31% | 1.49 57% | 3.2 9% | 1.1 69% |
| Colorchecker dE 2000 max. * | 7.2 | 4.1 43% | 3.29 54% | 5.5 24% | 2.2 69% |
| Colorchecker dE 2000 calibrated * | 1.6 | 1.3 19% | 0.44 73% | 2 -25% | 1.2 25% |
| Greyscale dE 2000 * | 4.8 | 3.3 31% | 1.7 65% | 4.4 8% | 1.5 69% |
| Gamma | 2.11 104% | 2.13 103% | 2.12 104% | 2.22 99% | 2.17 101% |
| CCT | 6662 98% | 6848 95% | 6488 100% | 6384 102% | 6549 99% |
| Média Total (Programa/Configurações) | 16% /
14% | -4% /
5% | 15% /
3% | 30% /
25% |
* ... menor é melhor
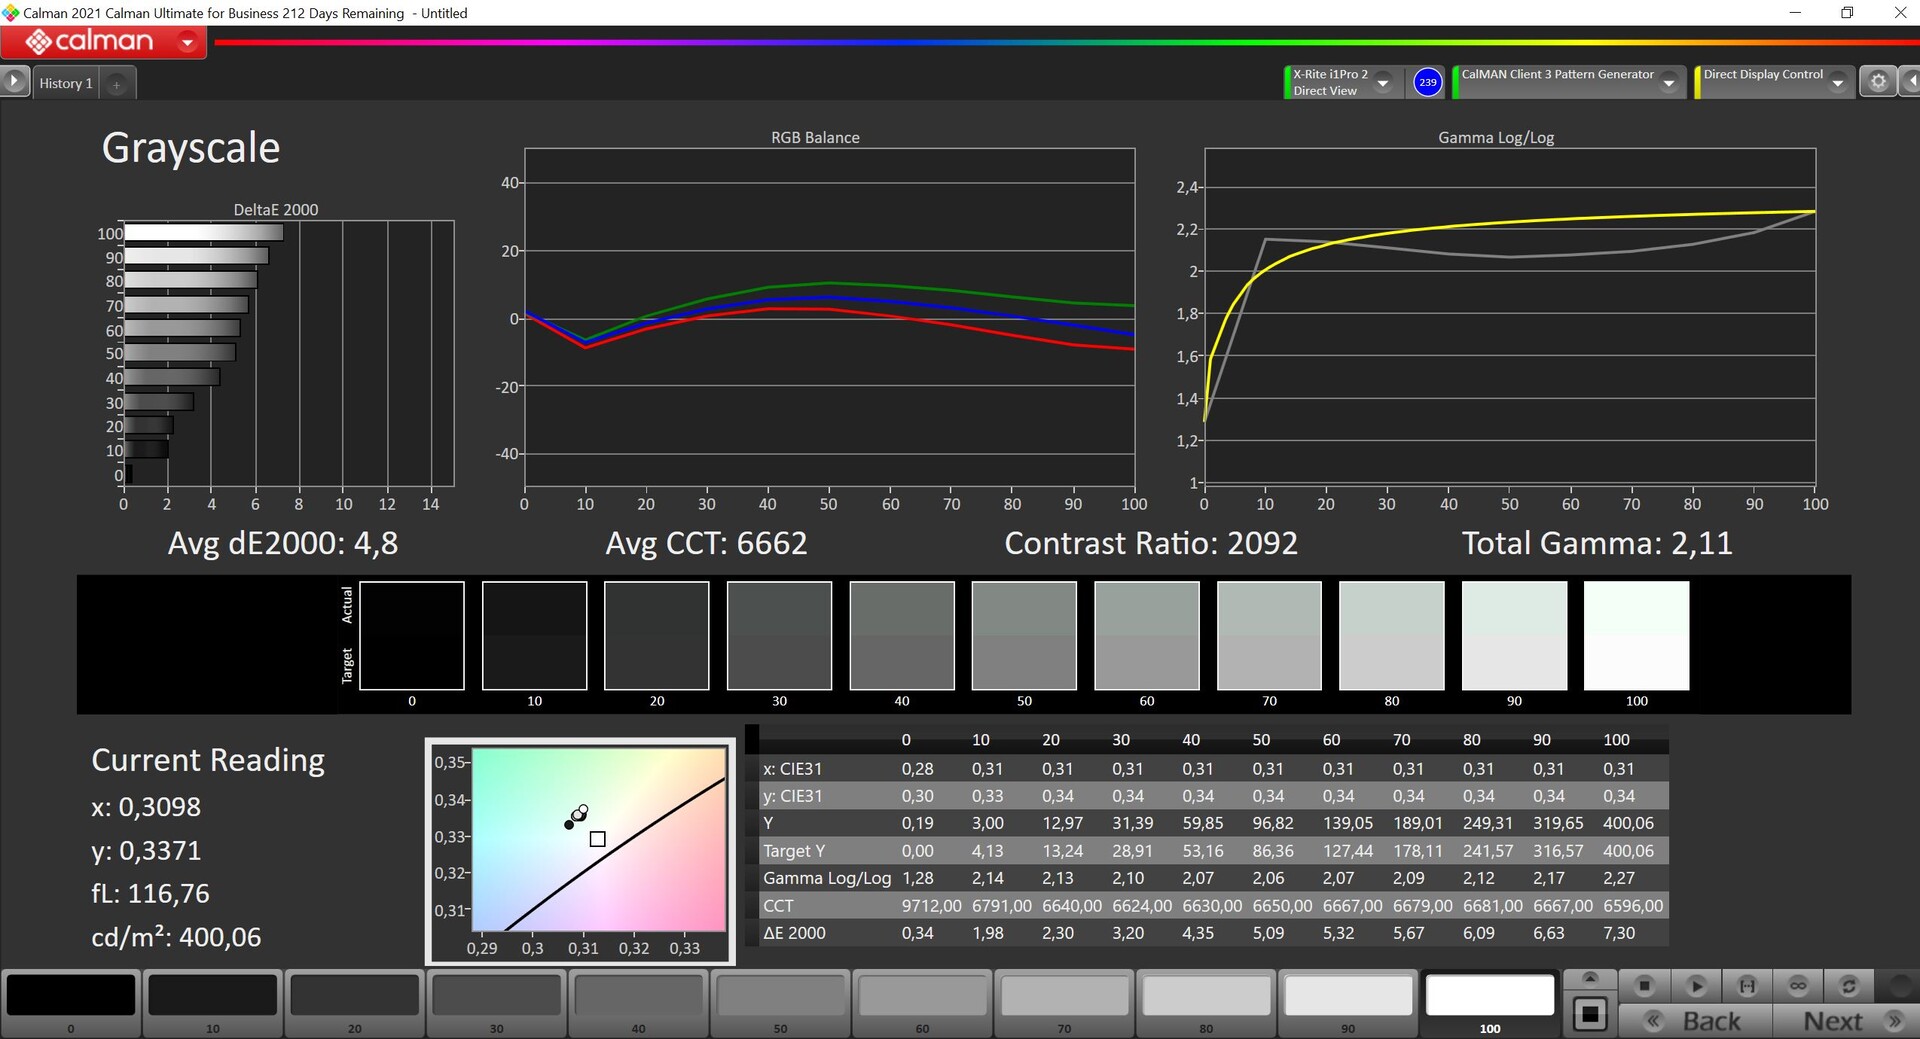
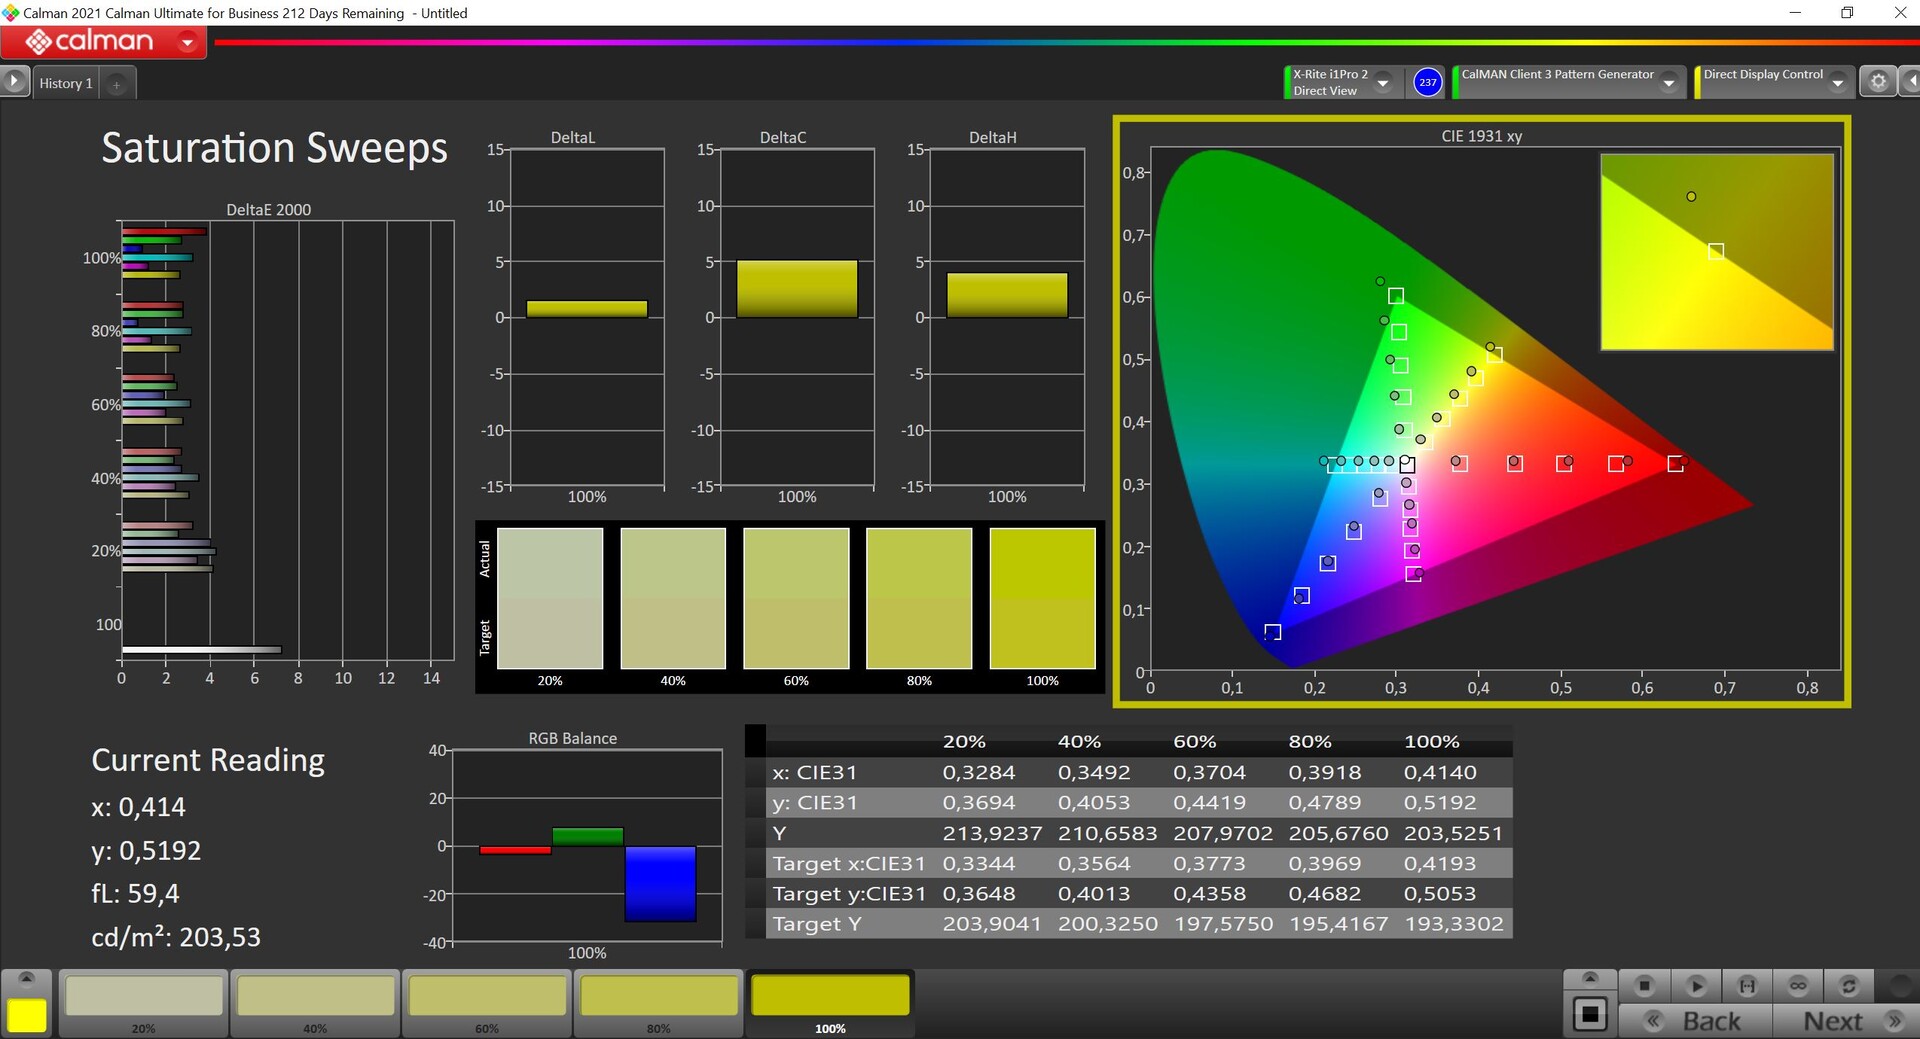
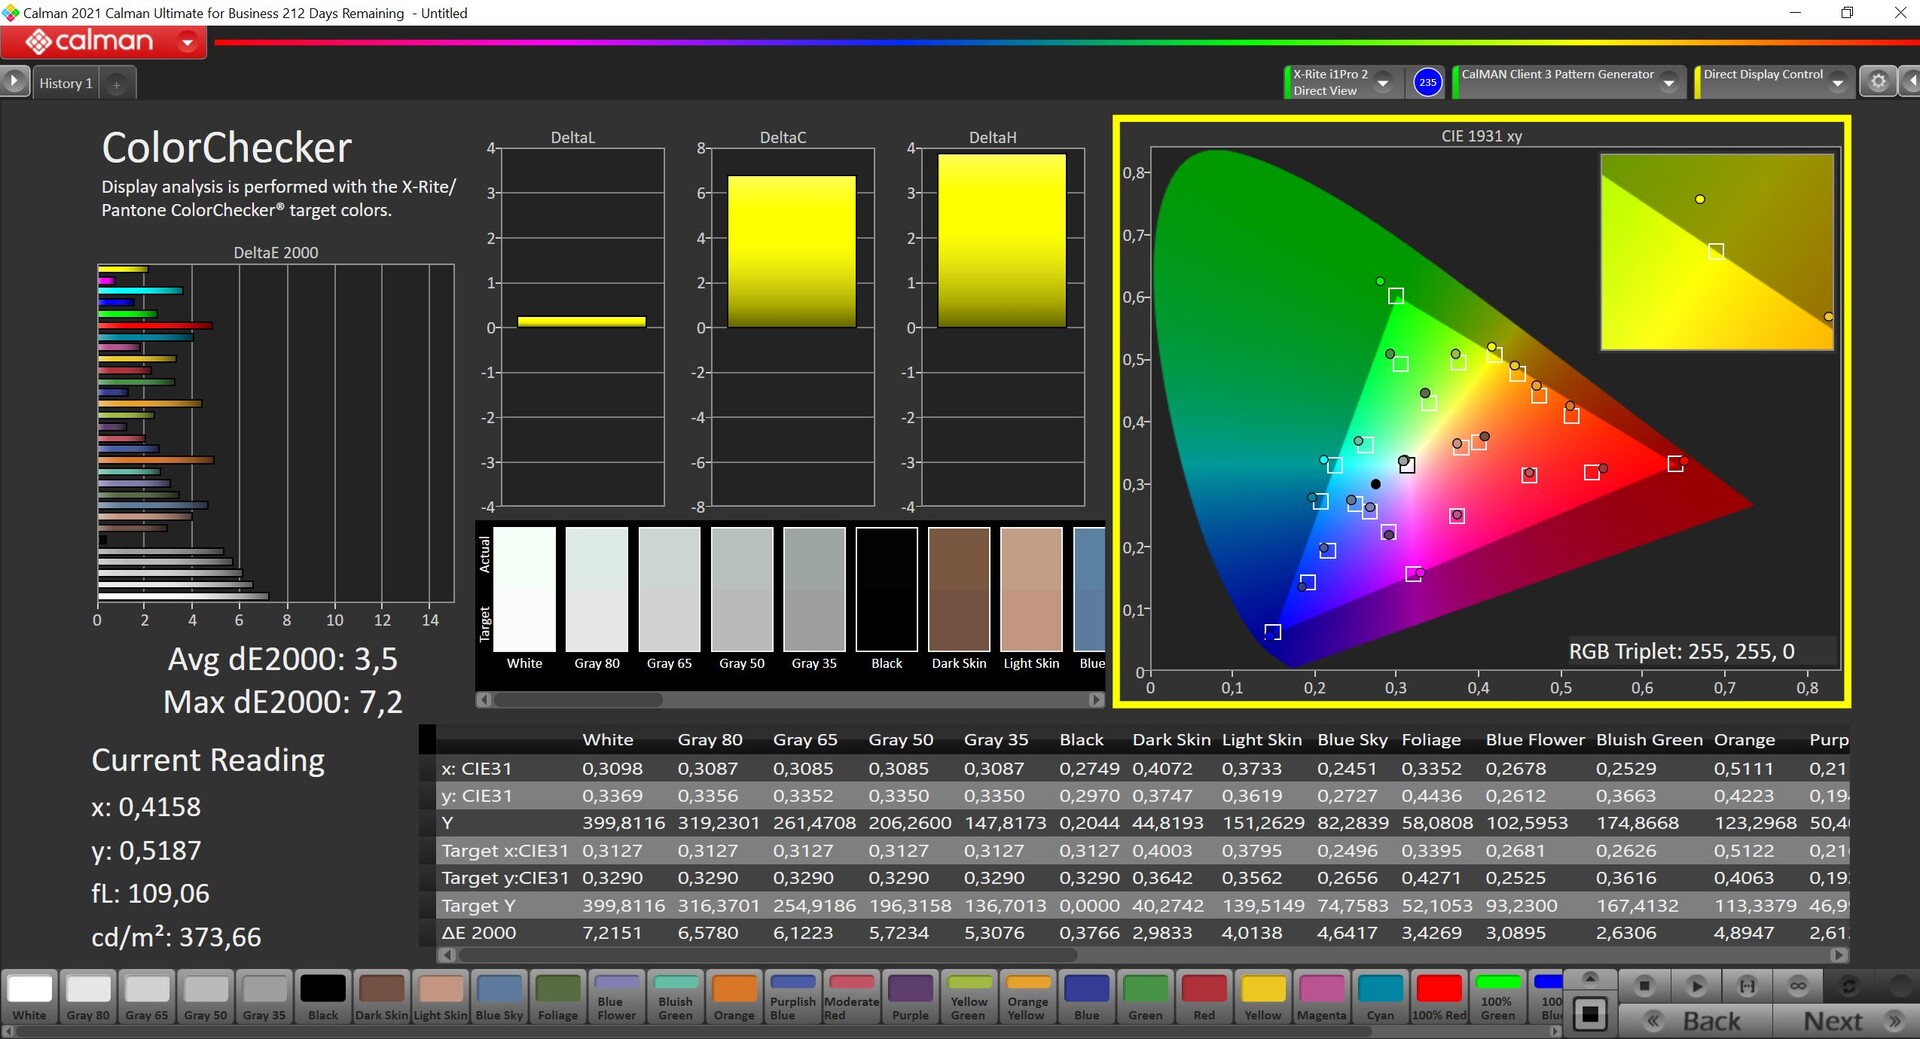
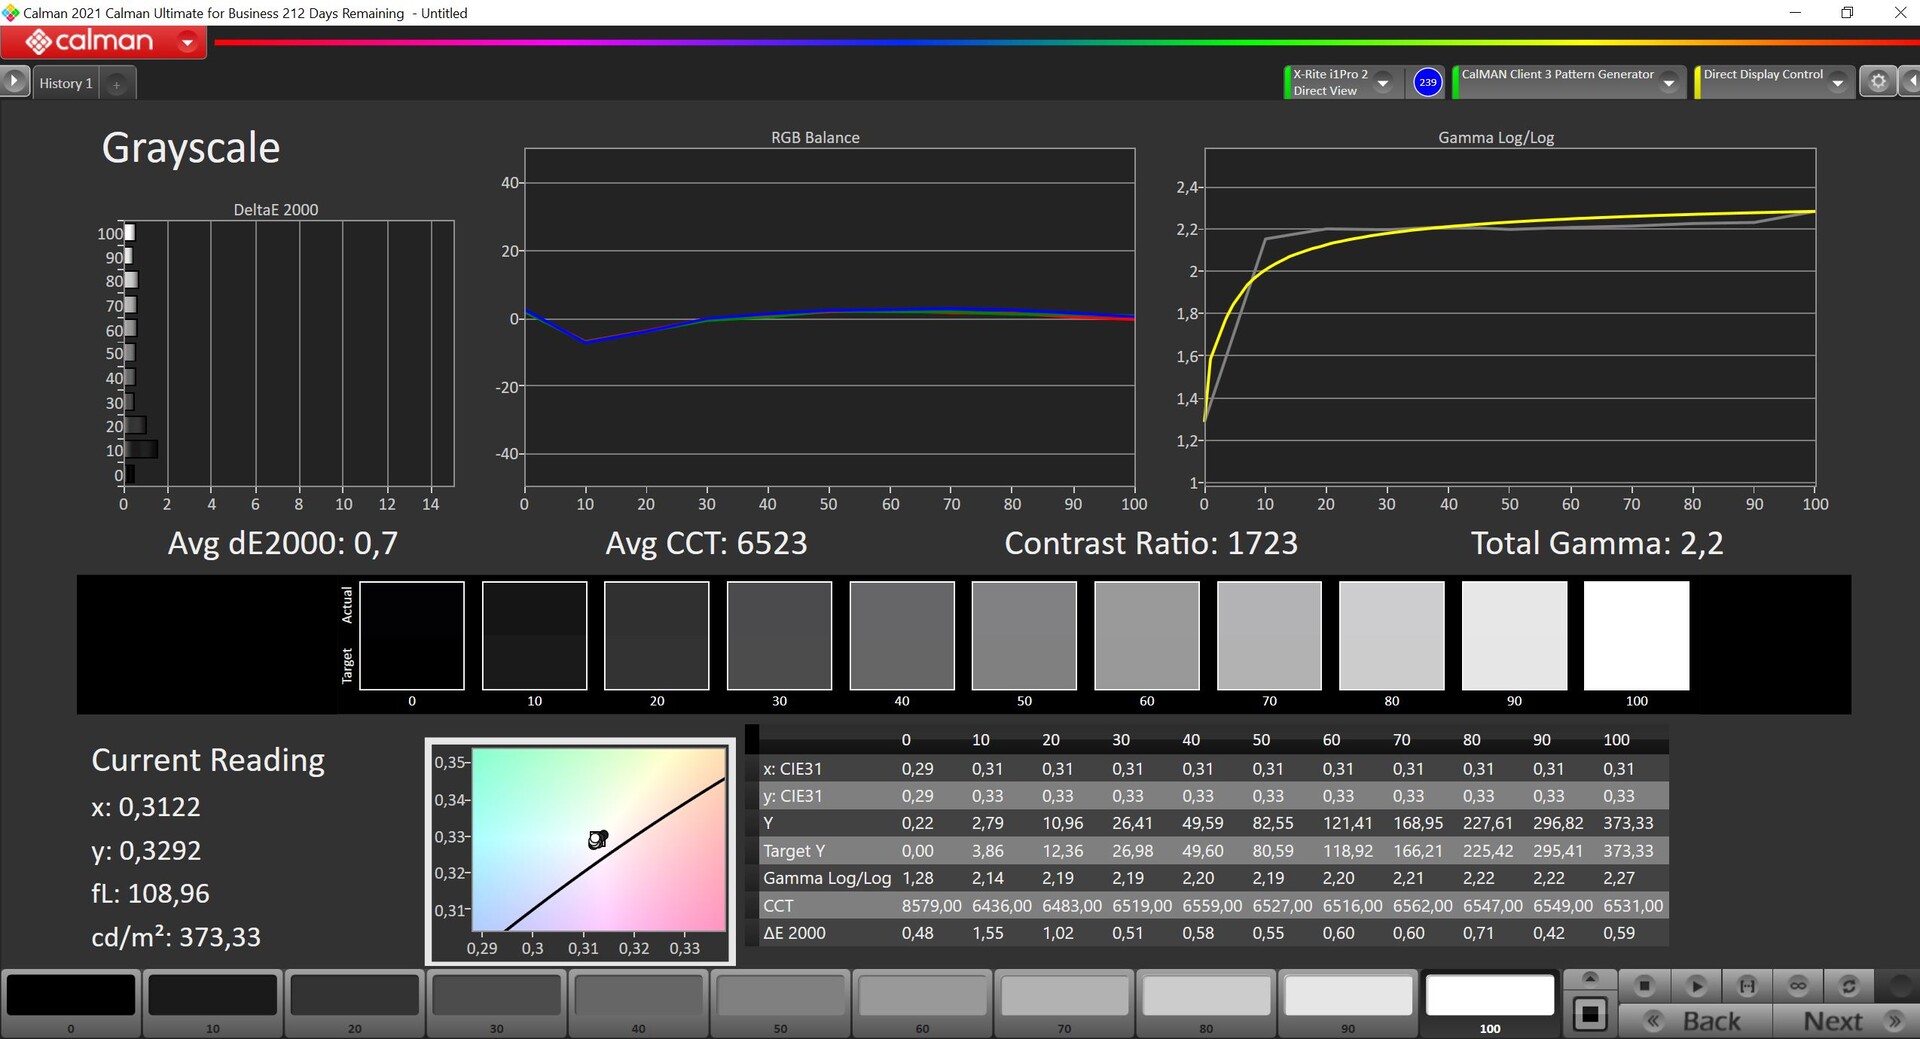
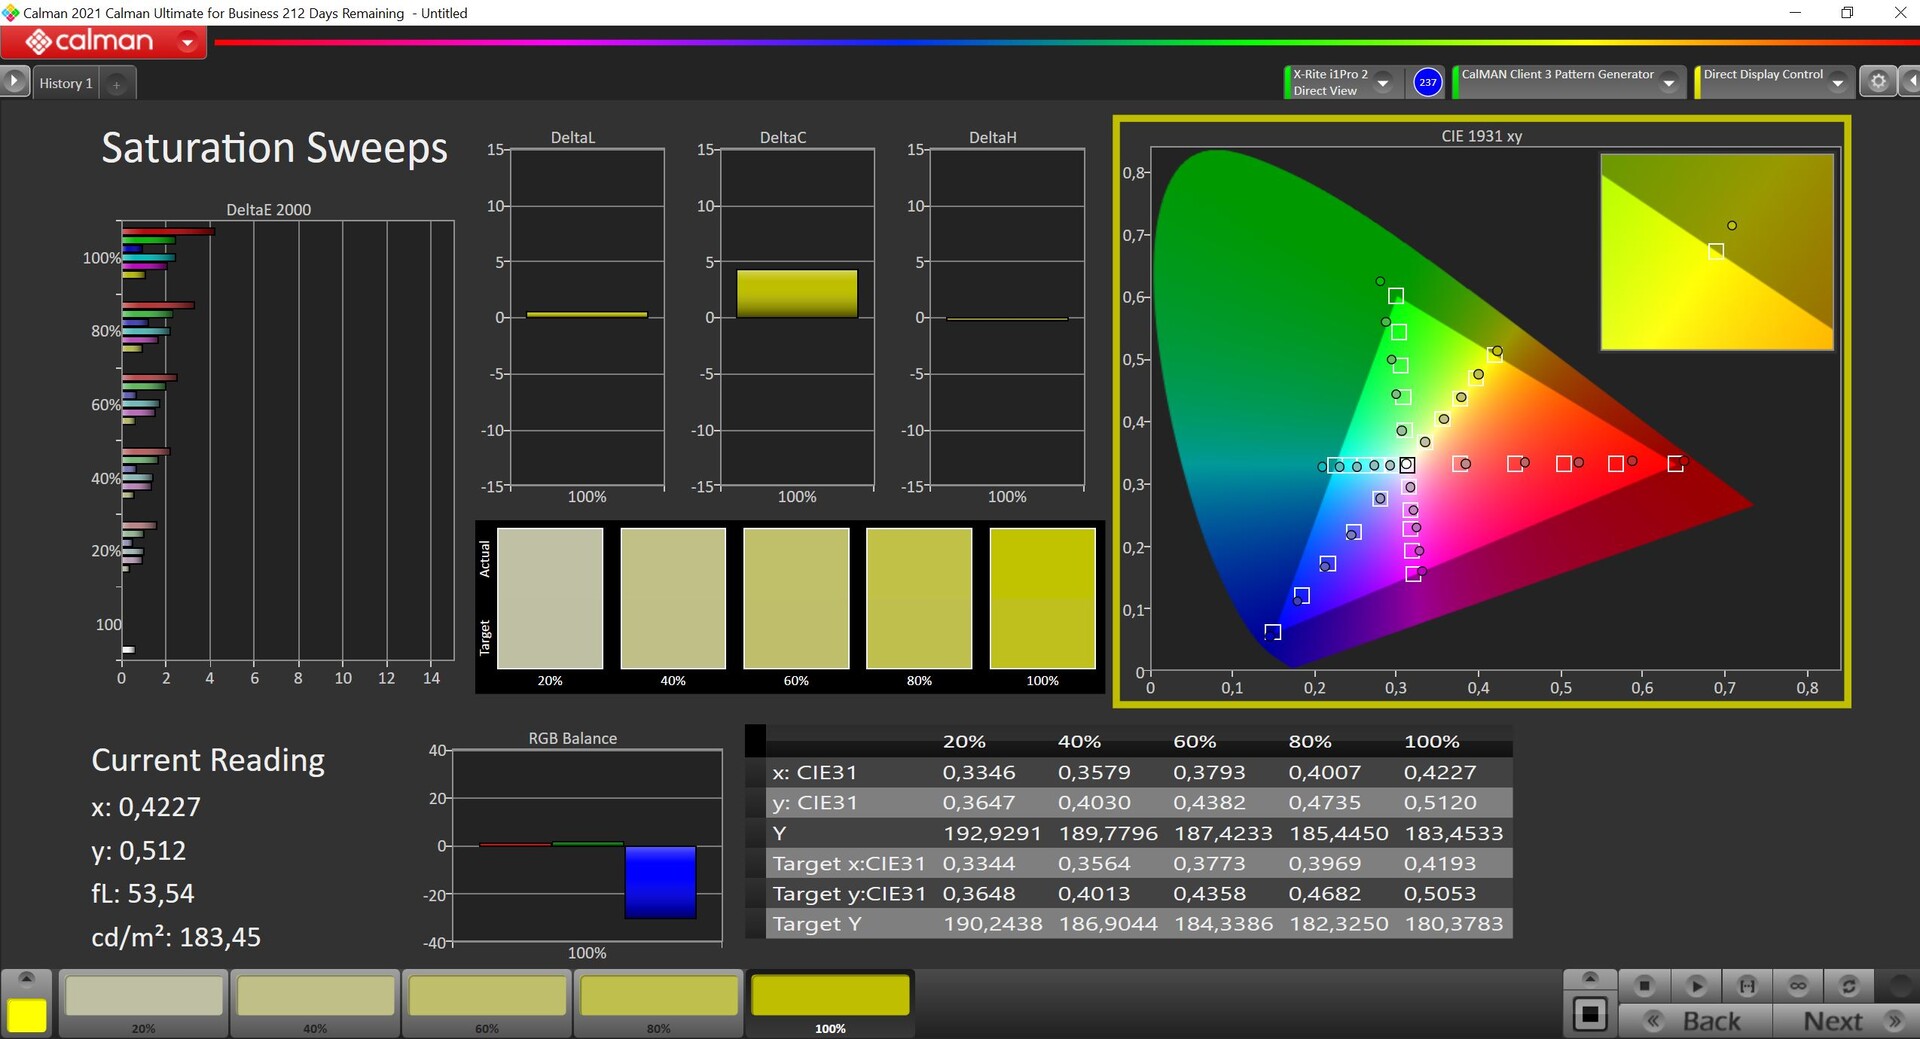
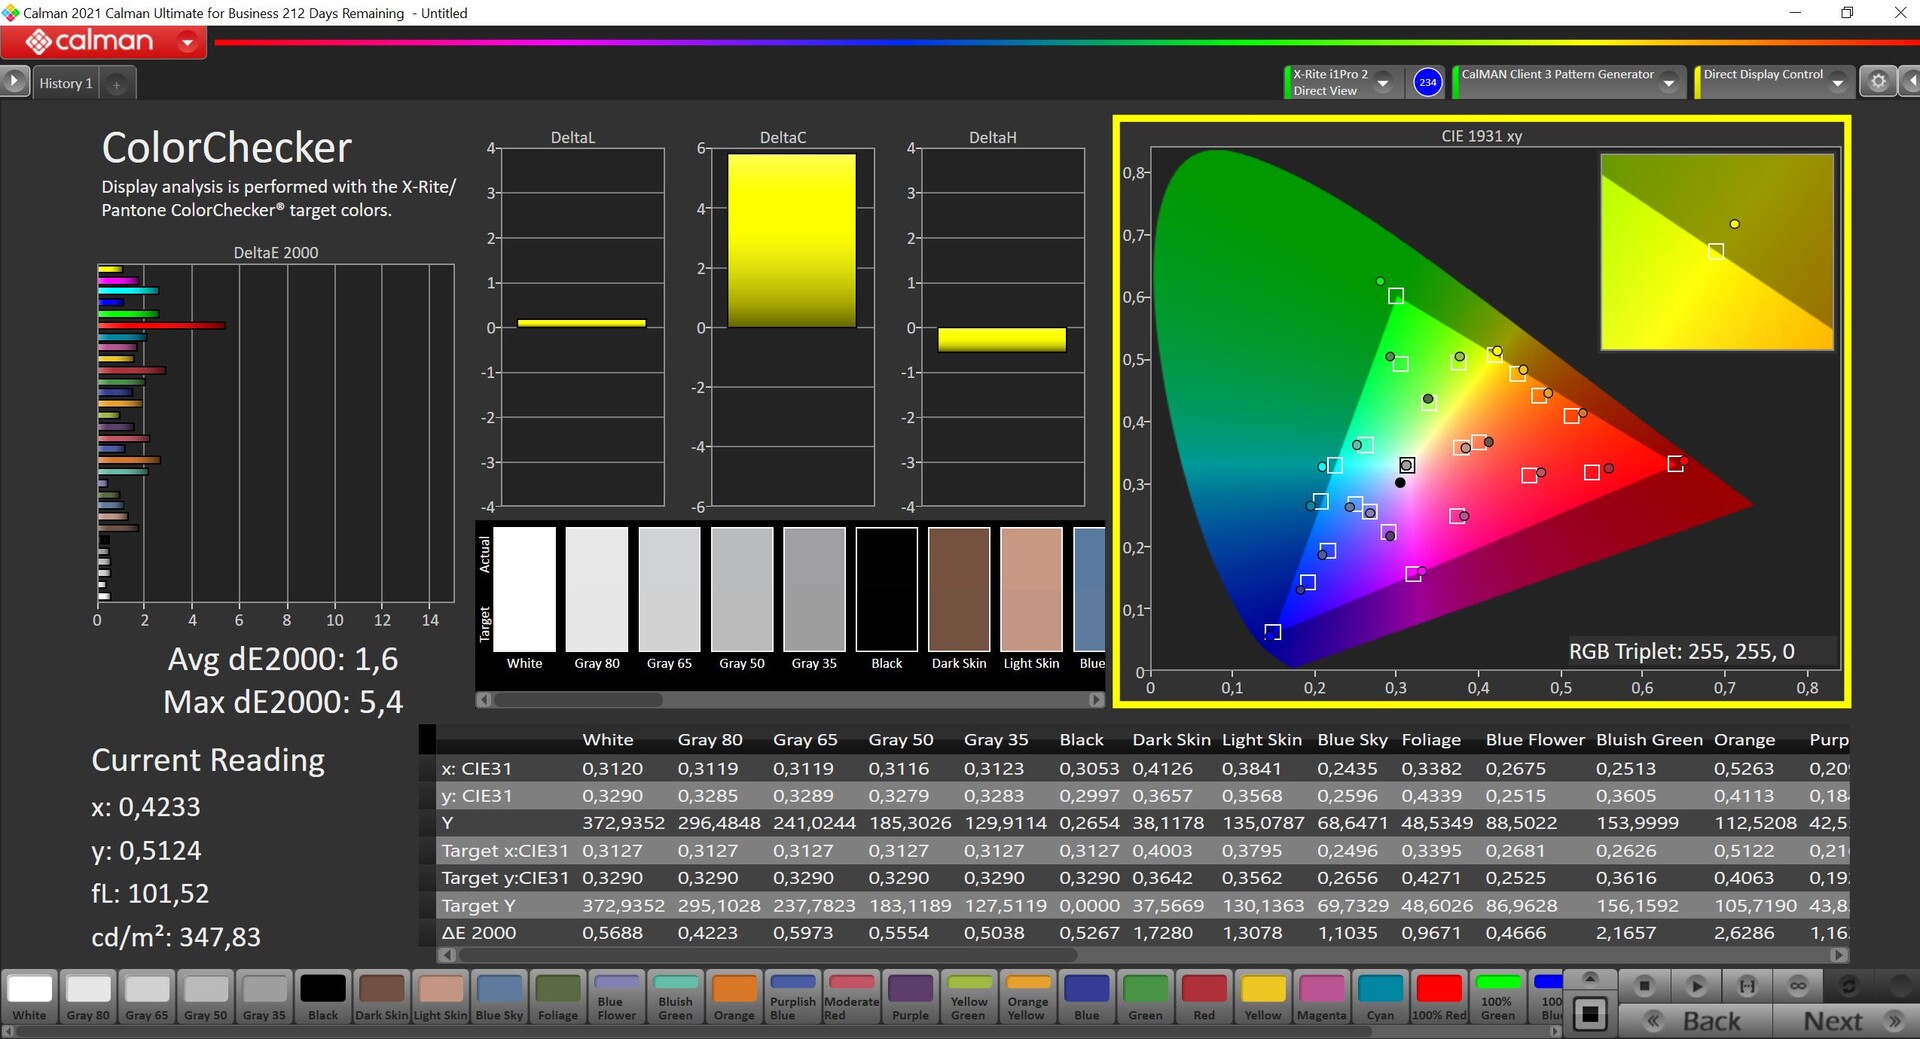
Medimos o painel com o software profissional CalMAN (X-Rite i1 Pro 2). Embora haja uma leve tonalidade de cor em direção ao verde/azul no estado de entrega, isto não é muito aparente no funcionamento diário, e os resultados já são decentes para um laptop comercial. Com nossa própria calibração (perfil de cor disponível para download gratuito no link acima), somos capazes de melhorar ainda mais a reprodução de cores. Em combinação com a cobertura completa do espaço de cores sRGB, o painel é bastante adequado para a tarefa ocasional de processamento de imagem ou vídeo.
Exibir tempos de resposta
| ↔ Tempo de resposta preto para branco | ||
|---|---|---|
| 34.9 ms ... ascensão ↗ e queda ↘ combinadas | ↗ 16.5 ms ascensão | 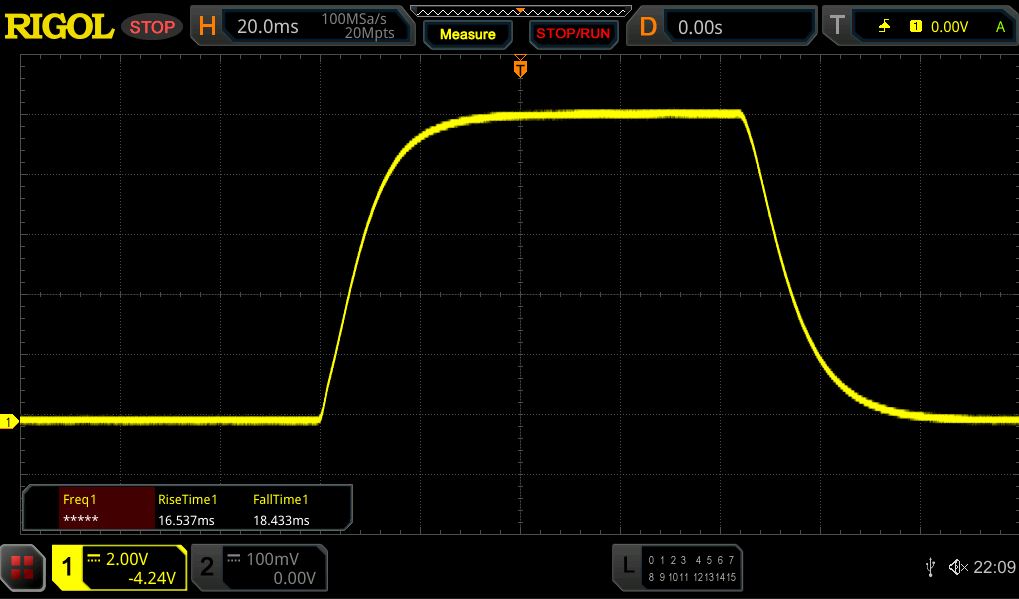 |
| ↘ 18.4 ms queda | ||
| A tela mostra taxas de resposta lentas em nossos testes e será insatisfatória para os jogadores. Em comparação, todos os dispositivos testados variam de 0.1 (mínimo) a 240 (máximo) ms. » 92 % de todos os dispositivos são melhores. Isso significa que o tempo de resposta medido é pior que a média de todos os dispositivos testados (19.8 ms). | ||
| ↔ Tempo de resposta 50% cinza a 80% cinza | ||
| 62.6 ms ... ascensão ↗ e queda ↘ combinadas | ↗ 28.2 ms ascensão | 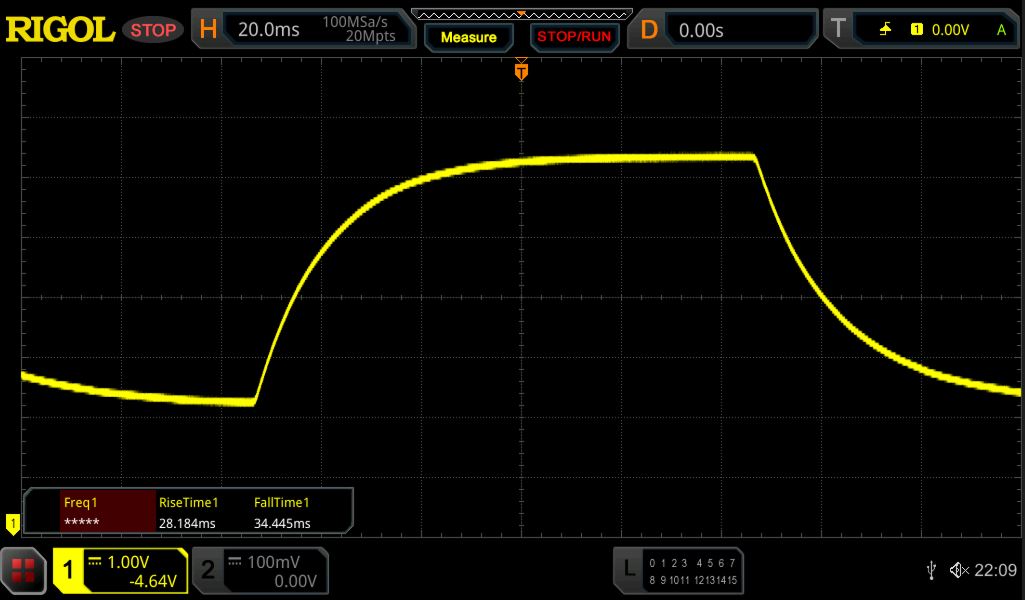 |
| ↘ 34.4 ms queda | ||
| A tela mostra taxas de resposta lentas em nossos testes e será insatisfatória para os jogadores. Em comparação, todos os dispositivos testados variam de 0.165 (mínimo) a 636 (máximo) ms. » 97 % de todos os dispositivos são melhores. Isso significa que o tempo de resposta medido é pior que a média de todos os dispositivos testados (30.9 ms). | ||
Cintilação da tela / PWM (modulação por largura de pulso)
| Tela tremeluzindo / PWM não detectado | 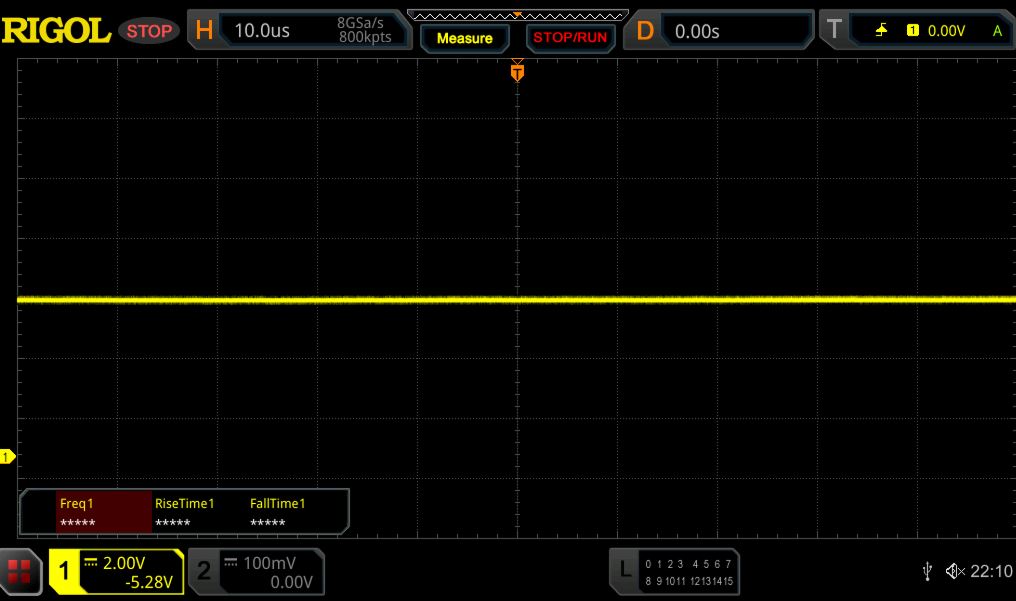 | ||
[pwm_comparison] Em comparação: 52 % de todos os dispositivos testados não usam PWM para escurecer a tela. Se PWM foi detectado, uma média de 7741 (mínimo: 5 - máximo: 343500) Hz foi medida. | |||
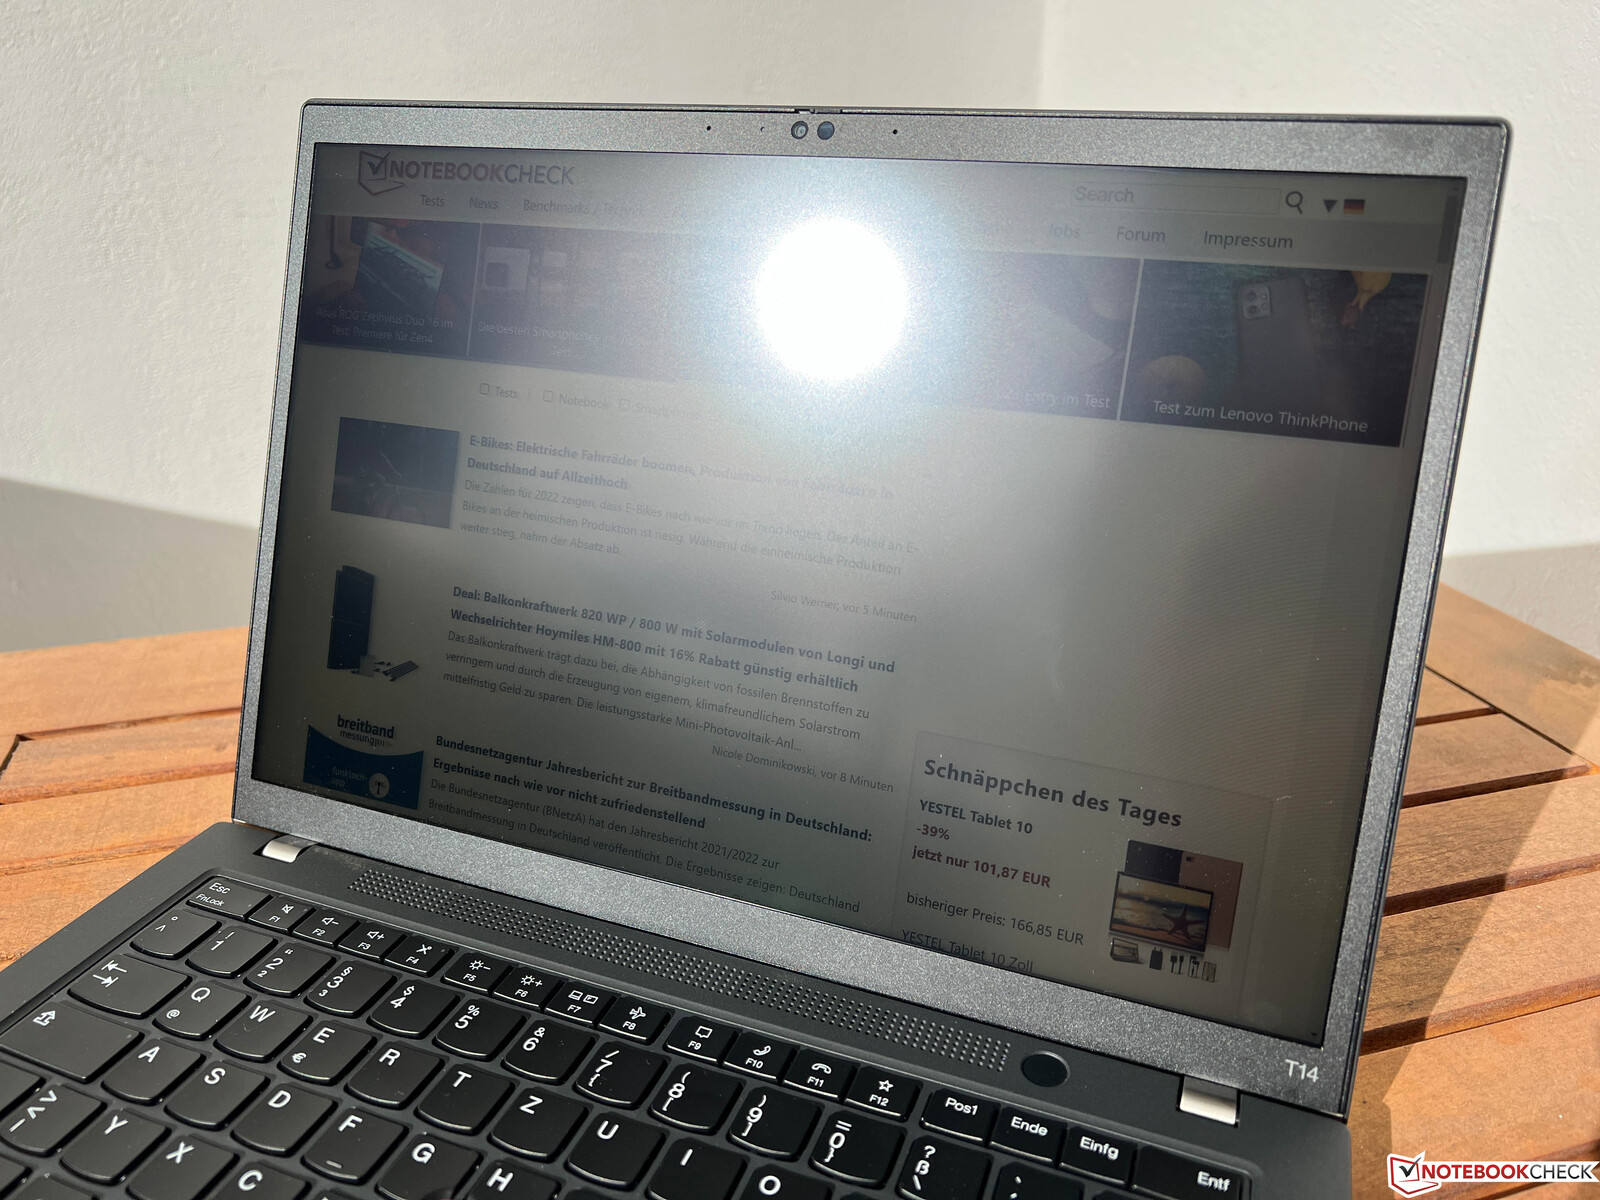
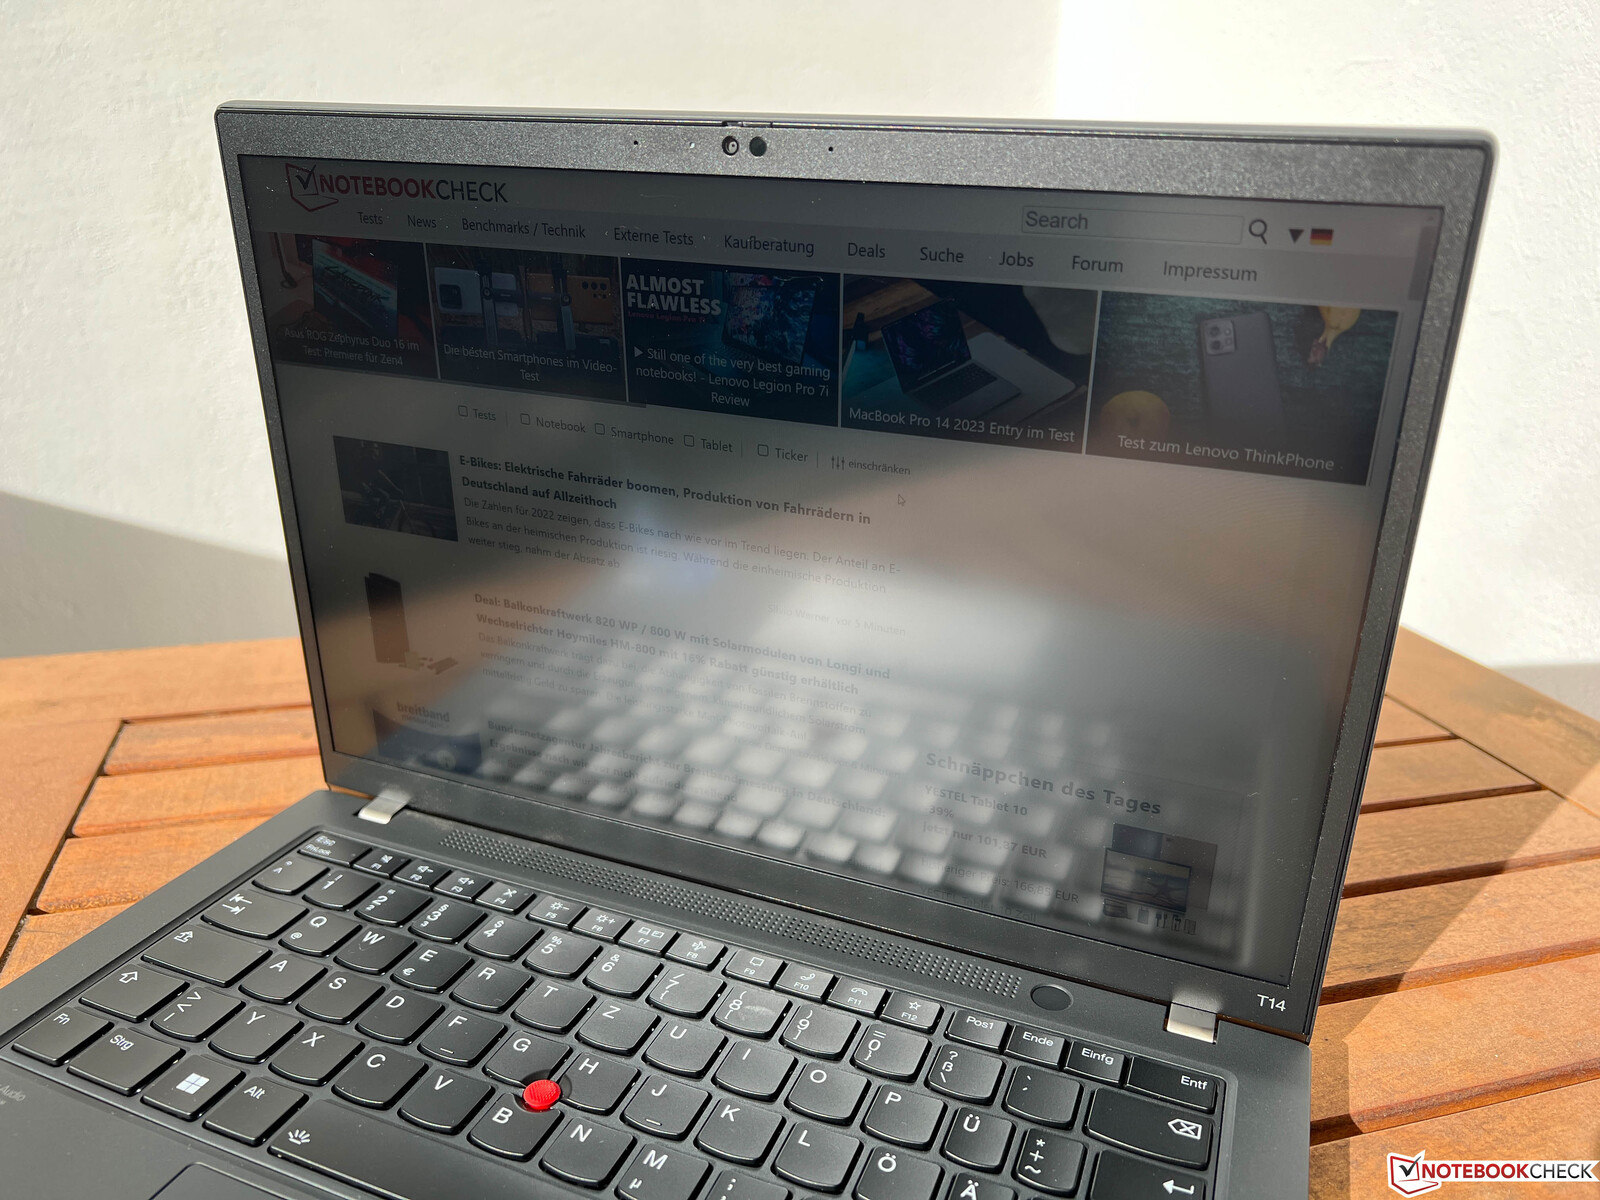
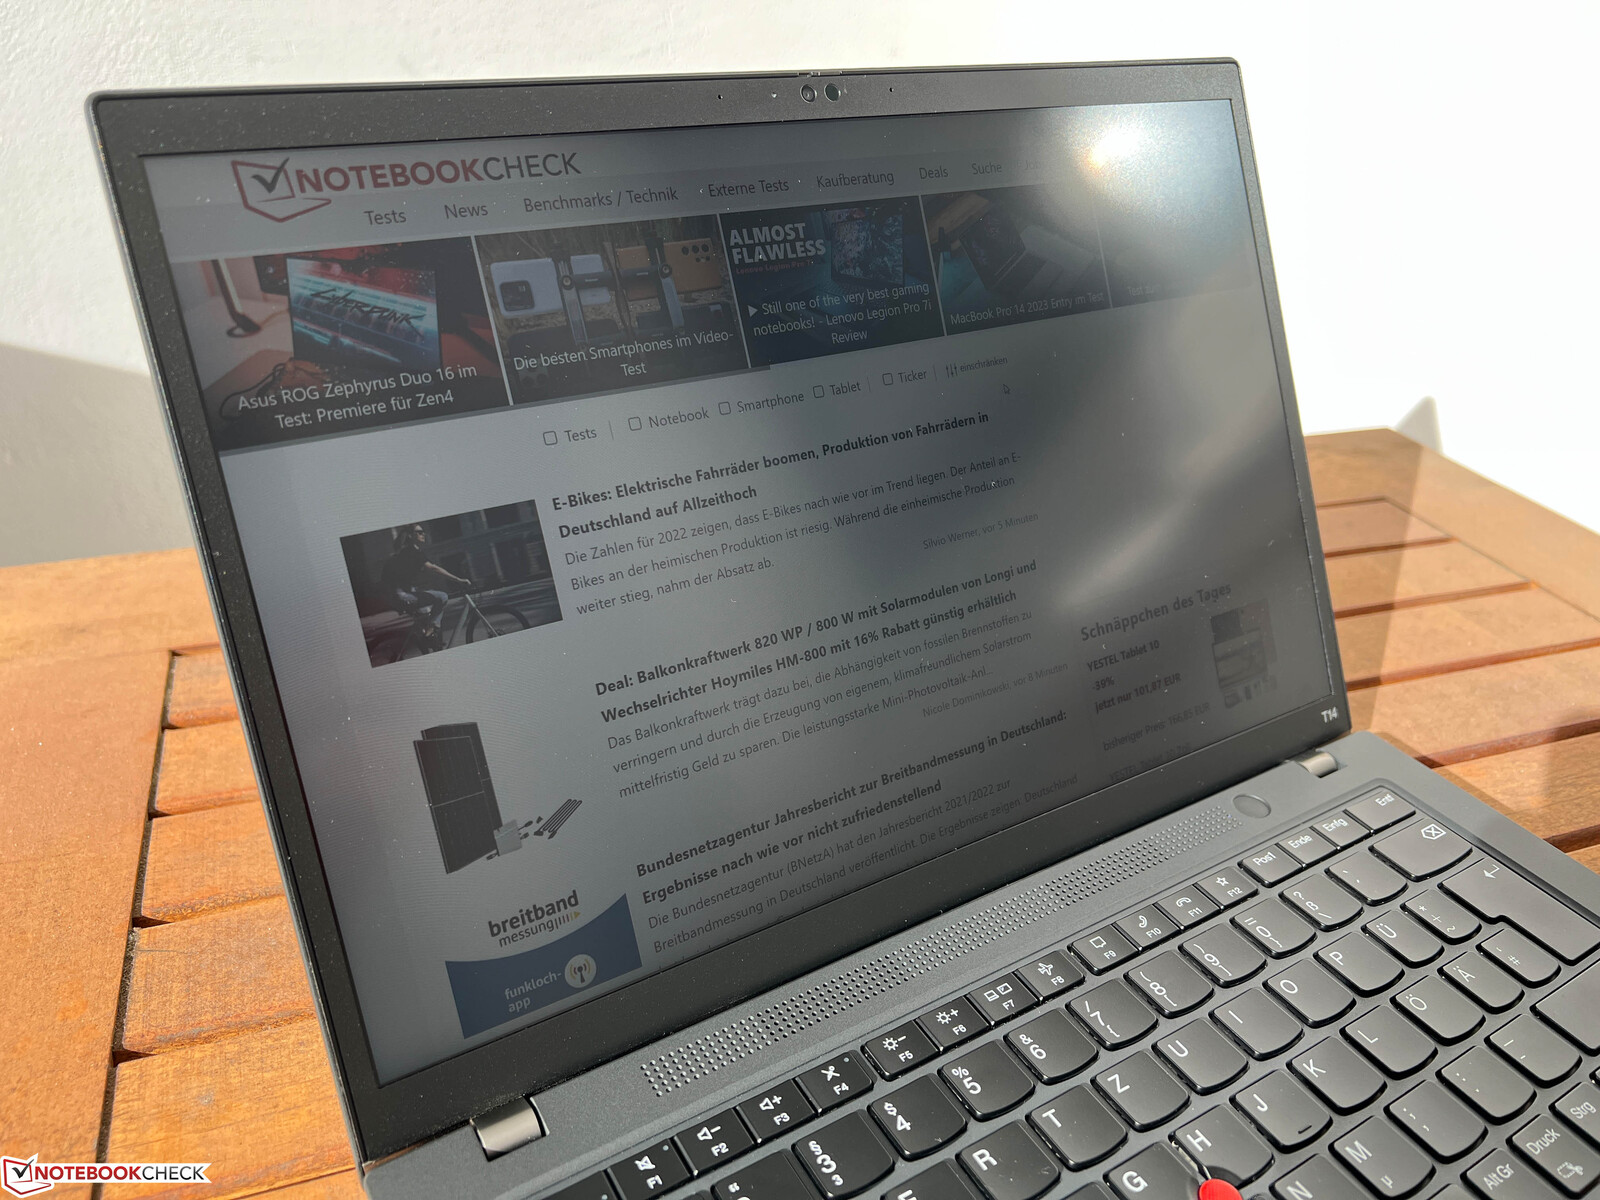
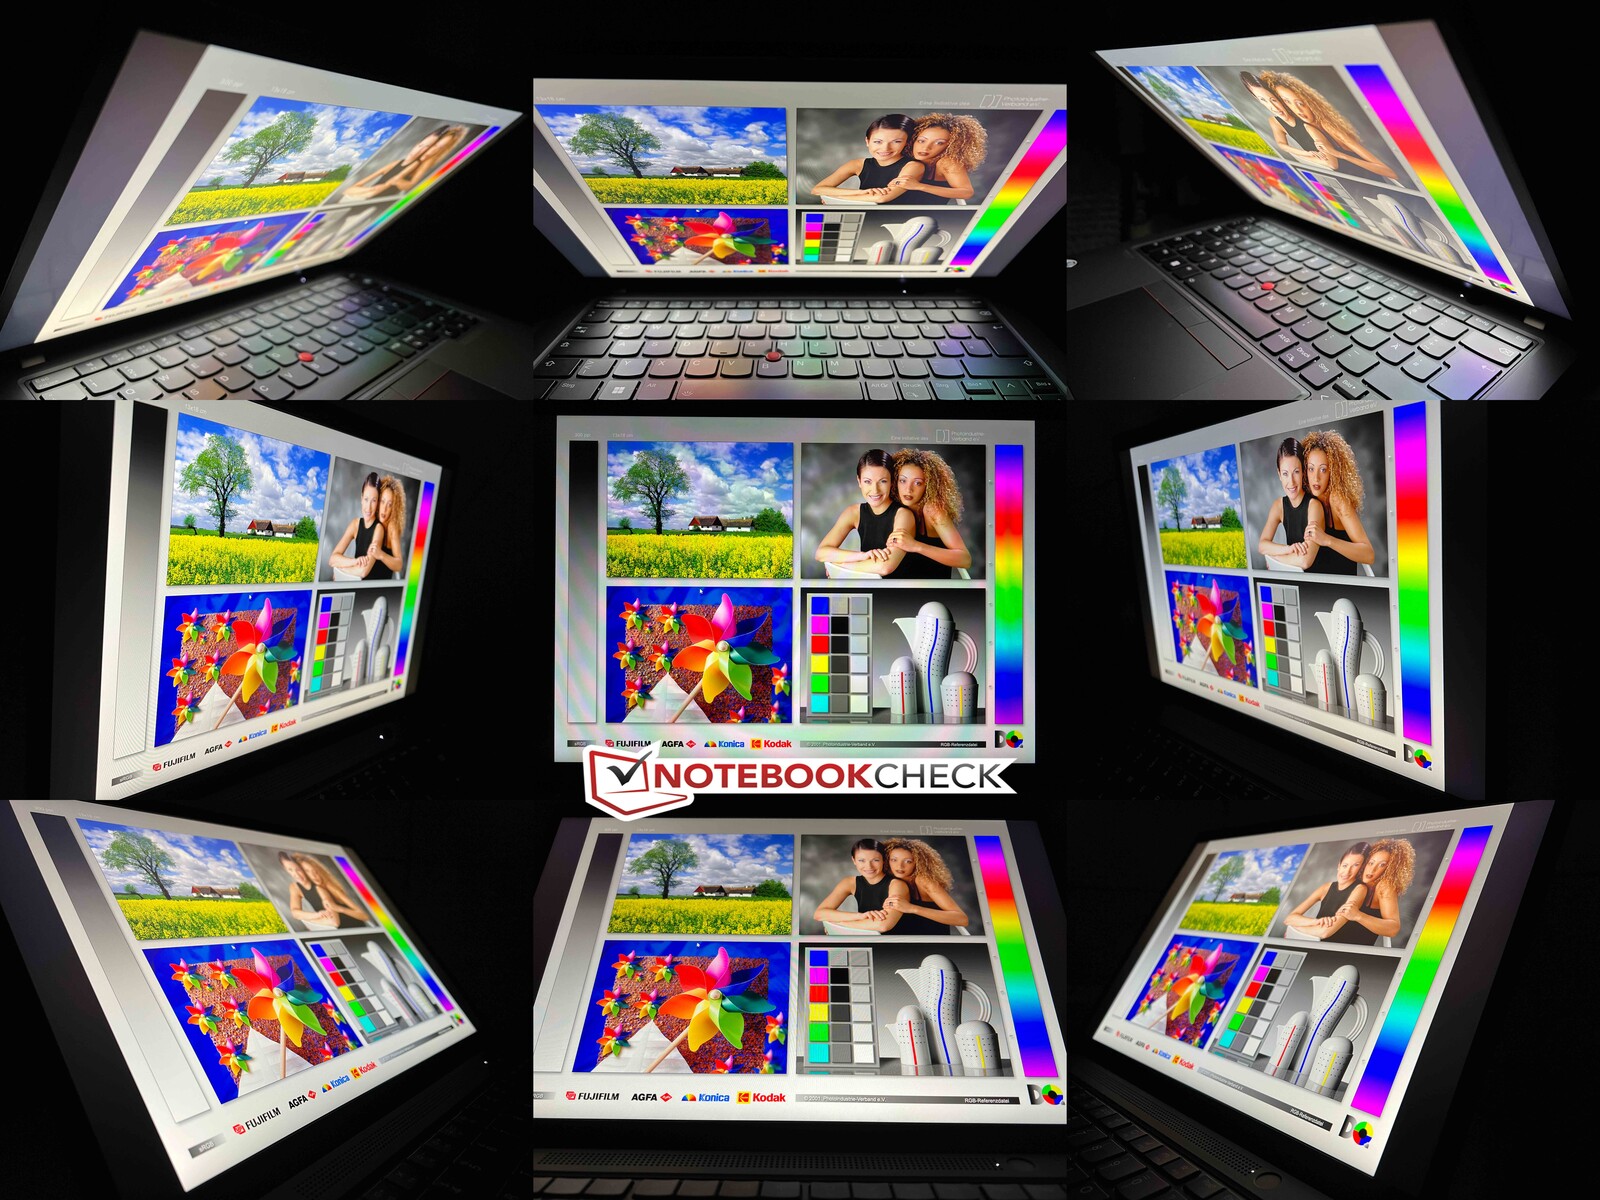
O painel se sai bem ao ar livre, mas você ainda deve evitar reflexos de fontes de luz direta. A estabilidade do ângulo de visão do painel IPS é muito boa.
Desempenho - Alder Lake e GeForce MX550
Condições de teste
O Lenovo Vantage App oferece um modo "Refrigeração Inteligente", mas em nosso teste isto teve um efeito negativo sobre o desempenho após um curto período de tempo. Portanto, desativamos este modo para nossos benchmarks e medidas (seja através do aplicativo ou usando a combinação de teclas Fn+T).
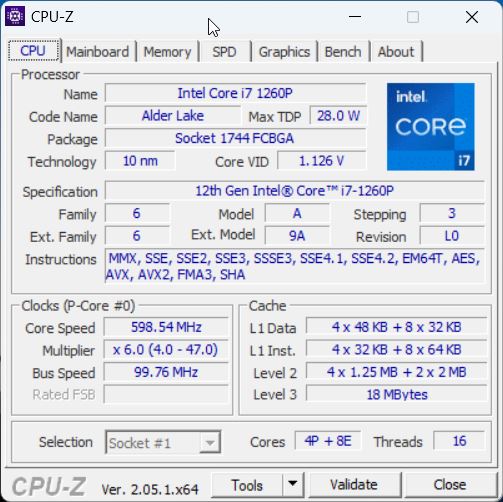
Processador - Core i7-1260P
Nós já conhecemos oNúcleo i7-1260Pda geração Alder Lake, e com seus 4 núcleos de desempenho rápido e 8 núcleos de eficiência, o desempenho é muito bom, mas o processador Intel também consome muita energia com isso. No ThinkPad T14 G3, o processador pode consumir um máximo de até 58 watts e constante 42 watts. O desempenho de núcleo único é melhor do que o do modelo AMD, enquanto o desempenho de múltiplos núcleos é comparável.
Cinebench R15 Multi Constant Load Test
O desempenho geral permanece relativamente estável no loop do Cinebench. O que também é interessante aqui é a comparação com o novo Raptor Lake Core i7-1360Palder Lake, que tem uma vantagem na primeira corrida, mas depois cai para o nível dos processadores mais antigos de Alder Lake. Apenas o desempenho de um só núcleo permanece ligeiramente melhor, mas, de modo geral, você também pode escolher o Core i7-1260P sem qualquer preocupação.
Na operação por bateria, o processador pode consumir um máximo de 32 watts, levando a uma redução de desempenho de ~30% nos testes multi-núcleo. Você pode encontrar referências adicionais em nossa seção técnica.
Cinebench R23: Multi Core | Single Core
Cinebench R20: CPU (Multi Core) | CPU (Single Core)
Cinebench R15: CPU Multi 64Bit | CPU Single 64Bit
Blender: v2.79 BMW27 CPU
7-Zip 18.03: 7z b 4 | 7z b 4 -mmt1
Geekbench 5.5: Multi-Core | Single-Core
HWBOT x265 Benchmark v2.2: 4k Preset
LibreOffice : 20 Documents To PDF
R Benchmark 2.5: Overall mean
| CPU Performance rating | |
| Schenker Vision 14 2022 RTX 3050 Ti | |
| Lenovo Yoga 9 14IRP G8 | |
| HP EliteBook 840 G9 | |
| Lenovo ThinkPad T14 G3-21AJS00400 | |
| Média da turma Office | |
| Huawei MateBook X Pro 2022 | |
| Lenovo ThinkPad T14 G3-21CF004NGE | |
| Média Intel Core i7-1260P | |
| Cinebench R23 / Multi Core | |
| Schenker Vision 14 2022 RTX 3050 Ti | |
| Lenovo ThinkPad T14 G3-21AJS00400 | |
| Lenovo Yoga 9 14IRP G8 | |
| Média da turma Office (1673 - 22808, n=77, últimos 2 anos) | |
| Lenovo ThinkPad T14 G3-21CF004NGE | |
| HP EliteBook 840 G9 | |
| Média Intel Core i7-1260P (3173 - 12150, n=27) | |
| Huawei MateBook X Pro 2022 | |
| Cinebench R23 / Single Core | |
| Lenovo Yoga 9 14IRP G8 | |
| Lenovo ThinkPad T14 G3-21AJS00400 | |
| HP EliteBook 840 G9 | |
| Média da turma Office (708 - 2130, n=77, últimos 2 anos) | |
| Schenker Vision 14 2022 RTX 3050 Ti | |
| Média Intel Core i7-1260P (1155 - 1812, n=25) | |
| Huawei MateBook X Pro 2022 | |
| Lenovo ThinkPad T14 G3-21CF004NGE | |
| Cinebench R20 / CPU (Multi Core) | |
| Schenker Vision 14 2022 RTX 3050 Ti | |
| Lenovo ThinkPad T14 G3-21AJS00400 | |
| Média da turma Office (648 - 8840, n=76, últimos 2 anos) | |
| Lenovo Yoga 9 14IRP G8 | |
| HP EliteBook 840 G9 | |
| Lenovo ThinkPad T14 G3-21CF004NGE | |
| Huawei MateBook X Pro 2022 | |
| Média Intel Core i7-1260P (1234 - 4748, n=25) | |
| Cinebench R20 / CPU (Single Core) | |
| Lenovo Yoga 9 14IRP G8 | |
| Schenker Vision 14 2022 RTX 3050 Ti | |
| Lenovo ThinkPad T14 G3-21AJS00400 | |
| Huawei MateBook X Pro 2022 | |
| Média da turma Office (345 - 816, n=76, últimos 2 anos) | |
| Média Intel Core i7-1260P (448 - 698, n=25) | |
| HP EliteBook 840 G9 | |
| Lenovo ThinkPad T14 G3-21CF004NGE | |
| Cinebench R15 / CPU Multi 64Bit | |
| Schenker Vision 14 2022 RTX 3050 Ti | |
| Lenovo Yoga 9 14IRP G8 | |
| HP EliteBook 840 G9 | |
| Huawei MateBook X Pro 2022 | |
| Huawei MateBook X Pro 2022 | |
| Lenovo ThinkPad T14 G3-21AJS00400 | |
| Média da turma Office (250 - 3380, n=78, últimos 2 anos) | |
| Lenovo ThinkPad T14 G3-21CF004NGE | |
| Média Intel Core i7-1260P (549 - 2034, n=29) | |
| Cinebench R15 / CPU Single 64Bit | |
| Lenovo Yoga 9 14IRP G8 | |
| Schenker Vision 14 2022 RTX 3050 Ti | |
| HP EliteBook 840 G9 | |
| Média da turma Office (99.5 - 316, n=78, últimos 2 anos) | |
| Huawei MateBook X Pro 2022 | |
| Lenovo ThinkPad T14 G3-21AJS00400 | |
| Lenovo ThinkPad T14 G3-21CF004NGE | |
| Média Intel Core i7-1260P (165.4 - 260, n=27) | |
| Blender / v2.79 BMW27 CPU | |
| Média Intel Core i7-1260P (264 - 906, n=26) | |
| Média da turma Office (158 - 1940, n=77, últimos 2 anos) | |
| Huawei MateBook X Pro 2022 | |
| Lenovo ThinkPad T14 G3-21AJS00400 | |
| Lenovo ThinkPad T14 G3-21CF004NGE | |
| Lenovo Yoga 9 14IRP G8 | |
| HP EliteBook 840 G9 | |
| Schenker Vision 14 2022 RTX 3050 Ti | |
| 7-Zip 18.03 / 7z b 4 | |
| Schenker Vision 14 2022 RTX 3050 Ti | |
| Lenovo ThinkPad T14 G3-21CF004NGE | |
| HP EliteBook 840 G9 | |
| Lenovo Yoga 9 14IRP G8 | |
| Média da turma Office (7098 - 76886, n=78, últimos 2 anos) | |
| Huawei MateBook X Pro 2022 | |
| Lenovo ThinkPad T14 G3-21AJS00400 | |
| Média Intel Core i7-1260P (16146 - 47064, n=25) | |
| 7-Zip 18.03 / 7z b 4 -mmt1 | |
| HP EliteBook 840 G9 | |
| Lenovo Yoga 9 14IRP G8 | |
| Schenker Vision 14 2022 RTX 3050 Ti | |
| Lenovo ThinkPad T14 G3-21AJS00400 | |
| Média da turma Office (3387 - 6469, n=78, últimos 2 anos) | |
| Huawei MateBook X Pro 2022 | |
| Lenovo ThinkPad T14 G3-21CF004NGE | |
| Média Intel Core i7-1260P (4064 - 5791, n=25) | |
| Geekbench 5.5 / Multi-Core | |
| HP EliteBook 840 G9 | |
| Schenker Vision 14 2022 RTX 3050 Ti | |
| Lenovo Yoga 9 14IRP G8 | |
| Huawei MateBook X Pro 2022 | |
| Média da turma Office (1483 - 16999, n=74, últimos 2 anos) | |
| Média Intel Core i7-1260P (3866 - 10570, n=25) | |
| Lenovo ThinkPad T14 G3-21CF004NGE | |
| Lenovo ThinkPad T14 G3-21AJS00400 | |
| Geekbench 5.5 / Single-Core | |
| Média da turma Office (811 - 2175, n=74, últimos 2 anos) | |
| Lenovo Yoga 9 14IRP G8 | |
| Schenker Vision 14 2022 RTX 3050 Ti | |
| HP EliteBook 840 G9 | |
| Huawei MateBook X Pro 2022 | |
| Média Intel Core i7-1260P (1436 - 1786, n=25) | |
| Lenovo ThinkPad T14 G3-21AJS00400 | |
| Lenovo ThinkPad T14 G3-21CF004NGE | |
| HWBOT x265 Benchmark v2.2 / 4k Preset | |
| Schenker Vision 14 2022 RTX 3050 Ti | |
| Lenovo ThinkPad T14 G3-21AJS00400 | |
| Média da turma Office (2.21 - 26, n=77, últimos 2 anos) | |
| Lenovo ThinkPad T14 G3-21CF004NGE | |
| Lenovo Yoga 9 14IRP G8 | |
| HP EliteBook 840 G9 | |
| Huawei MateBook X Pro 2022 | |
| Média Intel Core i7-1260P (3.45 - 13.6, n=26) | |
| LibreOffice / 20 Documents To PDF | |
| Média da turma Office (39.9 - 102.3, n=77, últimos 2 anos) | |
| Lenovo ThinkPad T14 G3-21CF004NGE | |
| Média Intel Core i7-1260P (40.2 - 65.7, n=25) | |
| Lenovo Yoga 9 14IRP G8 | |
| HP EliteBook 840 G9 | |
| Schenker Vision 14 2022 RTX 3050 Ti | |
| Lenovo ThinkPad T14 G3-21AJS00400 | |
| Huawei MateBook X Pro 2022 | |
| R Benchmark 2.5 / Overall mean | |
| Lenovo ThinkPad T14 G3-21CF004NGE | |
| Média da turma Office (0.393 - 0.888, n=77, últimos 2 anos) | |
| Média Intel Core i7-1260P (0.4559 - 0.727, n=25) | |
| Huawei MateBook X Pro 2022 | |
| Lenovo ThinkPad T14 G3-21AJS00400 | |
| HP EliteBook 840 G9 | |
| Lenovo Yoga 9 14IRP G8 | |
| Schenker Vision 14 2022 RTX 3050 Ti | |
* ... menor é melhor
AIDA64: FP32 Ray-Trace | FPU Julia | CPU SHA3 | CPU Queen | FPU SinJulia | FPU Mandel | CPU AES | CPU ZLib | FP64 Ray-Trace | CPU PhotoWorxx
| Performance rating | |
| Schenker Vision 14 2022 RTX 3050 Ti | |
| Lenovo ThinkPad T14 G3-21CF004NGE | |
| Média da turma Office | |
| HP EliteBook 840 G9 | |
| Lenovo ThinkPad T14 G3-21AJS00400 | |
| Huawei MateBook X Pro 2022 | |
| Média Intel Core i7-1260P | |
| AIDA64 / FP32 Ray-Trace | |
| Média da turma Office (2083 - 31245, n=85, últimos 2 anos) | |
| Schenker Vision 14 2022 RTX 3050 Ti | |
| Lenovo ThinkPad T14 G3-21CF004NGE | |
| Lenovo ThinkPad T14 G3-21AJS00400 | |
| HP EliteBook 840 G9 | |
| Média Intel Core i7-1260P (2176 - 10898, n=26) | |
| Huawei MateBook X Pro 2022 | |
| AIDA64 / FPU Julia | |
| Lenovo ThinkPad T14 G3-21CF004NGE | |
| Média da turma Office (8191 - 125394, n=85, últimos 2 anos) | |
| Schenker Vision 14 2022 RTX 3050 Ti | |
| Lenovo ThinkPad T14 G3-21AJS00400 | |
| HP EliteBook 840 G9 | |
| Média Intel Core i7-1260P (11015 - 56906, n=26) | |
| Huawei MateBook X Pro 2022 | |
| AIDA64 / CPU SHA3 | |
| Média da turma Office (433 - 5755, n=85, últimos 2 anos) | |
| Schenker Vision 14 2022 RTX 3050 Ti | |
| Lenovo ThinkPad T14 G3-21AJS00400 | |
| Lenovo ThinkPad T14 G3-21CF004NGE | |
| HP EliteBook 840 G9 | |
| Média Intel Core i7-1260P (669 - 2709, n=26) | |
| Huawei MateBook X Pro 2022 | |
| AIDA64 / CPU Queen | |
| HP EliteBook 840 G9 | |
| Schenker Vision 14 2022 RTX 3050 Ti | |
| Lenovo ThinkPad T14 G3-21CF004NGE | |
| Lenovo ThinkPad T14 G3-21AJS00400 | |
| Huawei MateBook X Pro 2022 | |
| Média Intel Core i7-1260P (42571 - 82493, n=26) | |
| Média da turma Office (22784 - 115197, n=68, últimos 2 anos) | |
| AIDA64 / FPU SinJulia | |
| Lenovo ThinkPad T14 G3-21CF004NGE | |
| Schenker Vision 14 2022 RTX 3050 Ti | |
| Média da turma Office (1378 - 18321, n=85, últimos 2 anos) | |
| HP EliteBook 840 G9 | |
| Lenovo ThinkPad T14 G3-21AJS00400 | |
| Huawei MateBook X Pro 2022 | |
| Média Intel Core i7-1260P (2901 - 6975, n=26) | |
| AIDA64 / FPU Mandel | |
| Lenovo ThinkPad T14 G3-21CF004NGE | |
| Média da turma Office (4601 - 66922, n=85, últimos 2 anos) | |
| Schenker Vision 14 2022 RTX 3050 Ti | |
| Lenovo ThinkPad T14 G3-21AJS00400 | |
| HP EliteBook 840 G9 | |
| Média Intel Core i7-1260P (5950 - 26376, n=26) | |
| Huawei MateBook X Pro 2022 | |
| AIDA64 / CPU AES | |
| Schenker Vision 14 2022 RTX 3050 Ti | |
| Huawei MateBook X Pro 2022 | |
| Lenovo ThinkPad T14 G3-21AJS00400 | |
| Média da turma Office (4854 - 155900, n=85, últimos 2 anos) | |
| HP EliteBook 840 G9 | |
| Lenovo ThinkPad T14 G3-21CF004NGE | |
| Média Intel Core i7-1260P (16041 - 92356, n=26) | |
| AIDA64 / CPU ZLib | |
| Schenker Vision 14 2022 RTX 3050 Ti | |
| Lenovo ThinkPad T14 G3-21AJS00400 | |
| Média da turma Office (114.6 - 1366, n=85, últimos 2 anos) | |
| HP EliteBook 840 G9 | |
| Lenovo ThinkPad T14 G3-21CF004NGE | |
| Huawei MateBook X Pro 2022 | |
| Média Intel Core i7-1260P (259 - 771, n=26) | |
| AIDA64 / FP64 Ray-Trace | |
| Média da turma Office (1109 - 17834, n=85, últimos 2 anos) | |
| Schenker Vision 14 2022 RTX 3050 Ti | |
| Lenovo ThinkPad T14 G3-21CF004NGE | |
| Lenovo ThinkPad T14 G3-21AJS00400 | |
| HP EliteBook 840 G9 | |
| Média Intel Core i7-1260P (1237 - 5858, n=26) | |
| Huawei MateBook X Pro 2022 | |
| AIDA64 / CPU PhotoWorxx | |
| Média da turma Office (11090 - 65229, n=85, últimos 2 anos) | |
| Huawei MateBook X Pro 2022 | |
| HP EliteBook 840 G9 | |
| Média Intel Core i7-1260P (13261 - 43652, n=26) | |
| Schenker Vision 14 2022 RTX 3050 Ti | |
| Lenovo ThinkPad T14 G3-21CF004NGE | |
| Lenovo ThinkPad T14 G3-21AJS00400 | |
Desempenho do sistema
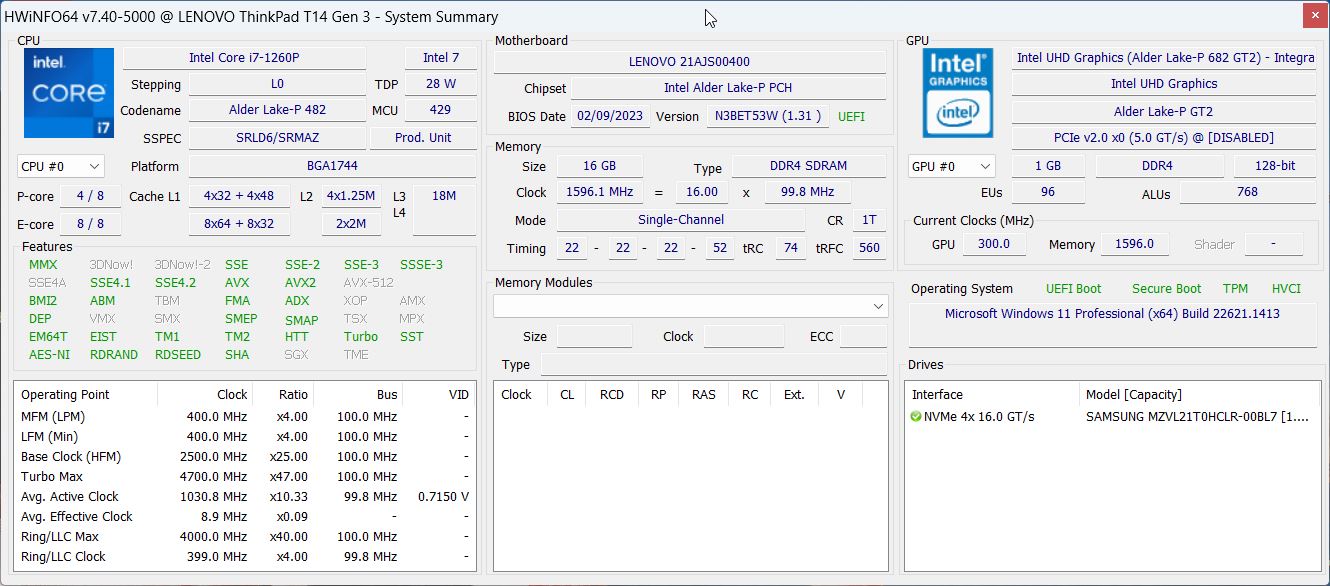
Na prática, a versão Intel do ThinkPad T14 G3 também é um laptop muito responsivo, e não fomos capazes de perceber nenhum problema. No entanto, nossa unidade de teste mostra apenas um desempenho médio nos benchmarks sintéticos. Isto se deve principalmente ao mau desempenho de armazenamento, uma vez que a memória de trabalho só funciona em uma configuração de canal único.
CrossMark: Overall | Productivity | Creativity | Responsiveness
| PCMark 10 / Score | |
| Média da turma Office (2601 - 9298, n=69, últimos 2 anos) | |
| Schenker Vision 14 2022 RTX 3050 Ti | |
| Huawei MateBook X Pro 2022 | |
| Lenovo ThinkPad T14 G3-21CF004NGE | |
| Média Intel Core i7-1260P, NVIDIA GeForce MX550 (5870 - 6235, n=2) | |
| HP EliteBook 840 G9 | |
| Lenovo ThinkPad T14 G3-21AJS00400 | |
| PCMark 10 / Essentials | |
| HP EliteBook 840 G9 | |
| Huawei MateBook X Pro 2022 | |
| Schenker Vision 14 2022 RTX 3050 Ti | |
| Média da turma Office (3245 - 11594, n=69, últimos 2 anos) | |
| Média Intel Core i7-1260P, NVIDIA GeForce MX550 (9729 - 10132, n=2) | |
| Lenovo ThinkPad T14 G3-21CF004NGE | |
| Lenovo ThinkPad T14 G3-21AJS00400 | |
| PCMark 10 / Productivity | |
| Média da turma Office (5336 - 17243, n=69, últimos 2 anos) | |
| Média Intel Core i7-1260P, NVIDIA GeForce MX550 (8189 - 9245, n=2) | |
| Huawei MateBook X Pro 2022 | |
| Schenker Vision 14 2022 RTX 3050 Ti | |
| Lenovo ThinkPad T14 G3-21CF004NGE | |
| Lenovo ThinkPad T14 G3-21AJS00400 | |
| HP EliteBook 840 G9 | |
| PCMark 10 / Digital Content Creation | |
| Schenker Vision 14 2022 RTX 3050 Ti | |
| Média da turma Office (2049 - 13541, n=69, últimos 2 anos) | |
| Lenovo ThinkPad T14 G3-21CF004NGE | |
| HP EliteBook 840 G9 | |
| Média Intel Core i7-1260P, NVIDIA GeForce MX550 (6891 - 7021, n=2) | |
| Lenovo ThinkPad T14 G3-21AJS00400 | |
| Huawei MateBook X Pro 2022 | |
| CrossMark / Overall | |
| Huawei MateBook X Pro 2022 | |
| HP EliteBook 840 G9 | |
| Schenker Vision 14 2022 RTX 3050 Ti | |
| Média da turma Office (381 - 2010, n=76, últimos 2 anos) | |
| Lenovo ThinkPad T14 G3-21AJS00400 | |
| Média Intel Core i7-1260P, NVIDIA GeForce MX550 (n=1) | |
| Lenovo ThinkPad T14 G3-21CF004NGE | |
| CrossMark / Productivity | |
| Huawei MateBook X Pro 2022 | |
| HP EliteBook 840 G9 | |
| Schenker Vision 14 2022 RTX 3050 Ti | |
| Lenovo ThinkPad T14 G3-21AJS00400 | |
| Média Intel Core i7-1260P, NVIDIA GeForce MX550 (n=1) | |
| Média da turma Office (464 - 1880, n=76, últimos 2 anos) | |
| Lenovo ThinkPad T14 G3-21CF004NGE | |
| CrossMark / Creativity | |
| Huawei MateBook X Pro 2022 | |
| HP EliteBook 840 G9 | |
| Schenker Vision 14 2022 RTX 3050 Ti | |
| Média da turma Office (319 - 2361, n=76, últimos 2 anos) | |
| Lenovo ThinkPad T14 G3-21AJS00400 | |
| Média Intel Core i7-1260P, NVIDIA GeForce MX550 (n=1) | |
| Lenovo ThinkPad T14 G3-21CF004NGE | |
| CrossMark / Responsiveness | |
| Huawei MateBook X Pro 2022 | |
| HP EliteBook 840 G9 | |
| Schenker Vision 14 2022 RTX 3050 Ti | |
| Lenovo ThinkPad T14 G3-21AJS00400 | |
| Média Intel Core i7-1260P, NVIDIA GeForce MX550 (n=1) | |
| Média da turma Office (360 - 1820, n=76, últimos 2 anos) | |
| Lenovo ThinkPad T14 G3-21CF004NGE | |
| PCMark 10 Score | 5870 pontos | |
Ajuda | ||
| AIDA64 / Memory Copy | |
| Média da turma Office (20075 - 110930, n=82, últimos 2 anos) | |
| Huawei MateBook X Pro 2022 | |
| HP EliteBook 840 G9 | |
| Média Intel Core i7-1260P (25125 - 71544, n=25) | |
| Lenovo ThinkPad T14 G3-21CF004NGE | |
| Schenker Vision 14 2022 RTX 3050 Ti | |
| Lenovo ThinkPad T14 G3-21AJS00400 | |
| AIDA64 / Memory Read | |
| Huawei MateBook X Pro 2022 | |
| Média da turma Office (10084 - 128030, n=83, últimos 2 anos) | |
| HP EliteBook 840 G9 | |
| Média Intel Core i7-1260P (24983 - 72065, n=25) | |
| Lenovo ThinkPad T14 G3-21CF004NGE | |
| Schenker Vision 14 2022 RTX 3050 Ti | |
| Lenovo ThinkPad T14 G3-21AJS00400 | |
| AIDA64 / Memory Write | |
| Média da turma Office (20073 - 119858, n=83, últimos 2 anos) | |
| Huawei MateBook X Pro 2022 | |
| HP EliteBook 840 G9 | |
| Média Intel Core i7-1260P (23512 - 66799, n=25) | |
| Lenovo ThinkPad T14 G3-21CF004NGE | |
| Schenker Vision 14 2022 RTX 3050 Ti | |
| Lenovo ThinkPad T14 G3-21AJS00400 | |
| AIDA64 / Memory Latency | |
| Lenovo ThinkPad T14 G3-21CF004NGE | |
| Huawei MateBook X Pro 2022 | |
| Média da turma Office (7.6 - 162.9, n=78, últimos 2 anos) | |
| HP EliteBook 840 G9 | |
| Lenovo ThinkPad T14 G3-21AJS00400 | |
| Schenker Vision 14 2022 RTX 3050 Ti | |
| Média Intel Core i7-1260P (77.9 - 118.4, n=21) | |
* ... menor é melhor
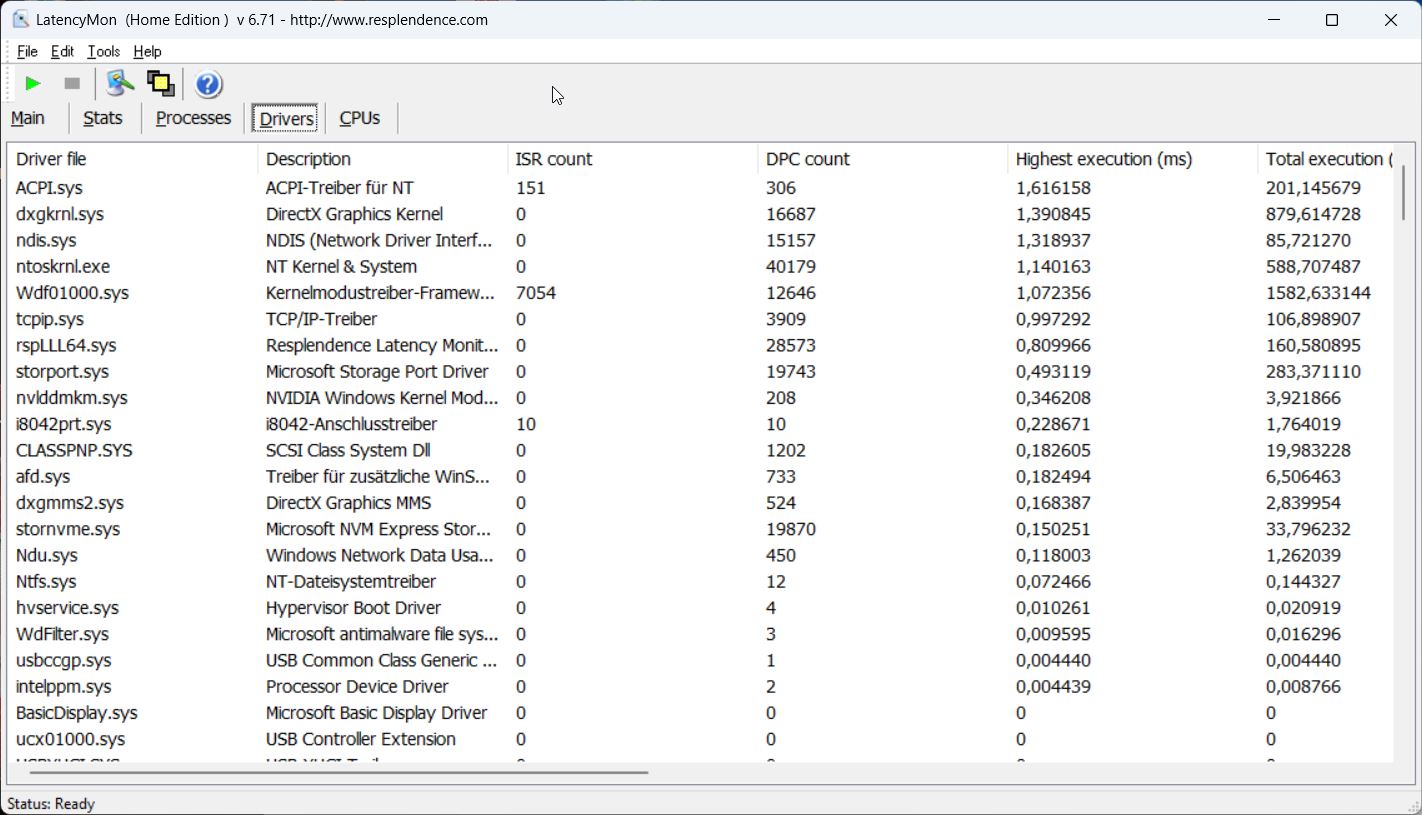
Latências DPC
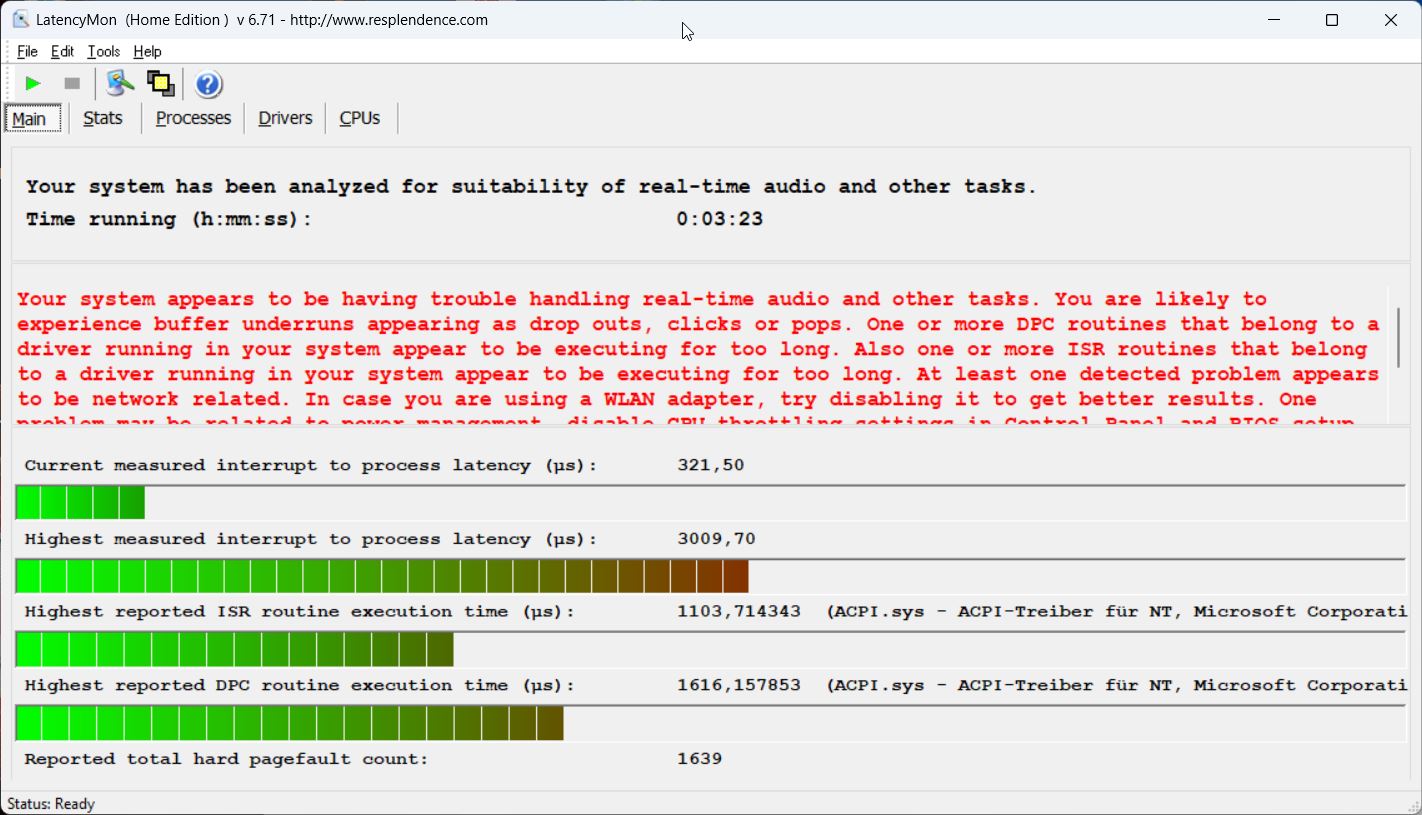
Em nosso teste de latência padronizado (navegação na Internet, reprodução de vídeo 4K YouTube e carga de CPU), a unidade de teste com sua versão atual BIOS mostra algumas limitações significativas para uso em aplicações de áudio em tempo real. Mas pode haver também algumas limitações criadas pelo driver Nvidia, uma vez que houve problemas a esse respeito para várias versões de driver. O Modelo AMD do T14 G3não teve nenhum problema aqui.
| DPC Latencies / LatencyMon - interrupt to process latency (max), Web, Youtube, Prime95 | |
| HP EliteBook 840 G9 | |
| Lenovo ThinkPad T14 G3-21AJS00400 | |
| Huawei MateBook X Pro 2022 | |
| Schenker Vision 14 2022 RTX 3050 Ti | |
| Lenovo ThinkPad T14 G3-21CF004NGE | |
* ... menor é melhor
Solução de armazenamento
Nossa unidade de teste utiliza a versão 1-TB do Samsung PM9A1, que é a variante OEM do 980 Pro. Enquanto o SSD PCIe 4.0 oferece taxas de transferência muito boas, as taxas caem após algum tempo sob carga constante. No entanto, isto não tem impacto na operação diária dos negócios. Após a primeira inicialização, há 904 GB de espaço de armazenamento disponível para o usuário. Você pode encontrar referências adicionais de SSD aqui.

* ... menor é melhor
Disk Throttling: DiskSpd Read Loop, Queue Depth 8
Placa Gráfica
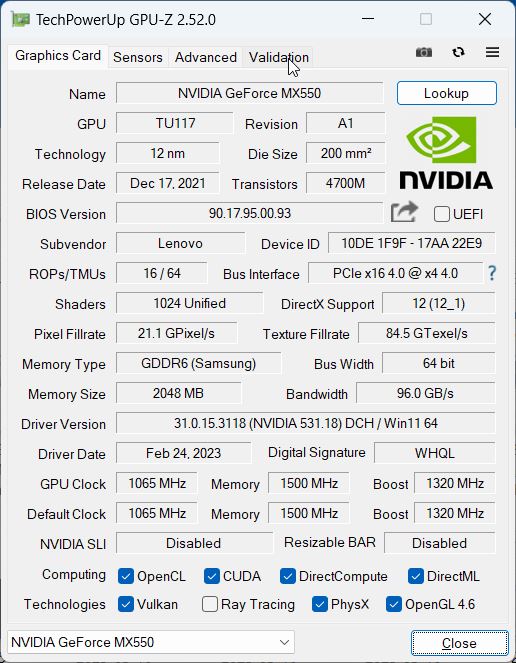
Além do G7 Iris Xe Graphicsdo processador, a Lenovo também equipou nossa configuração de teste com um GeForce MX550de Nvidia com 2 GB de VRAM. A placa gráfica pode consumir no máximo 30 watts e também oferece uma vantagem notável nos benchmarks em comparação com o iGPU ligeiramente ultrapassado da Intel. No entanto, a placa integrada Radeon 680M no modelo AMD tem o mesmo nível de desempenho, pelo menos nos testes sintéticos. Portanto, já devemos fazer a pergunta, por que você precisaria da placa gráfica adicional aqui.
Por outro lado, a GPU GeForce tem uma ligeira vantagem em comparação com a Radeon 680M integrada nos padrões reais de jogo, mas esta vantagem não é realmente enorme. Aqueles que gostam de jogar uma rodada de jogos em seu laptop de trabalho depois de terminar o trabalho são significativamente melhor servidos pelo Schenker Visão 14e der RTX 3050 Tipor exemplo.
Sob carga constante e em operação com bateria, o desempenho gráfico permanece estável. Você pode encontrar referências adicionais de GPU em nossa seção técnica.
| 3DMark 11 Performance | 10068 pontos | |
| 3DMark Fire Strike Score | 5764 pontos | |
| 3DMark Time Spy Score | 2695 pontos | |
Ajuda | ||
| Blender / v3.3 Classroom OPTIX/RTX | |
| Lenovo ThinkPad T14 G3-21AJS00400 | |
| Média NVIDIA GeForce MX550 (n=1) | |
| Média da turma Office (29 - 242, n=2, últimos 2 anos) | |
| Schenker Vision 14 2022 RTX 3050 Ti | |
| Blender / v3.3 Classroom CUDA | |
| Lenovo ThinkPad T14 G3-21AJS00400 | |
| Média NVIDIA GeForce MX550 (n=1) | |
| Média da turma Office (53 - 214, n=3, últimos 2 anos) | |
| Schenker Vision 14 2022 RTX 3050 Ti | |
| Blender / v3.3 Classroom CPU | |
| HP EliteBook 840 G9 | |
| Lenovo ThinkPad T14 G3-21AJS00400 | |
| Média NVIDIA GeForce MX550 (n=1) | |
| Huawei MateBook X Pro 2022 | |
| Média da turma Office (245 - 3219, n=76, últimos 2 anos) | |
| Lenovo ThinkPad T14 G3-21CF004NGE | |
| Schenker Vision 14 2022 RTX 3050 Ti | |
| Blender / v3.3 Classroom HIP/AMD | |
| Média da turma Office (296 - 507, n=5, últimos 2 anos) | |
| Lenovo ThinkPad T14 G3-21CF004NGE | |
* ... menor é melhor
| Performance rating - Percent | |
| Schenker Vision 14 2022 RTX 3050 Ti | |
| Lenovo ThinkPad T14 G3-21AJS00400 | |
| Lenovo ThinkPad T14 G3-21CF004NGE | |
| Média da turma Office | |
| HP EliteBook 840 G9 | |
| Huawei MateBook X Pro 2022 | |
| The Witcher 3 - 1920x1080 Ultra Graphics & Postprocessing (HBAO+) | |
| Schenker Vision 14 2022 RTX 3050 Ti | |
| Lenovo ThinkPad T14 G3-21AJS00400 | |
| Lenovo ThinkPad T14 G3-21CF004NGE | |
| Média da turma Office (14.7 - 28.1, n=4, últimos 2 anos) | |
| HP EliteBook 840 G9 | |
| Huawei MateBook X Pro 2022 | |
| GTA V - 1920x1080 Highest AA:4xMSAA + FX AF:16x | |
| Schenker Vision 14 2022 RTX 3050 Ti | |
| Lenovo ThinkPad T14 G3-21AJS00400 | |
| Lenovo ThinkPad T14 G3-21CF004NGE | |
| Média da turma Office (5.77 - 45.3, n=70, últimos 2 anos) | |
| Huawei MateBook X Pro 2022 | |
| HP EliteBook 840 G9 | |
| Final Fantasy XV Benchmark - 1920x1080 High Quality | |
| Schenker Vision 14 2022 RTX 3050 Ti | |
| Lenovo ThinkPad T14 G3-21CF004NGE | |
| Média da turma Office (8.09 - 79.5, n=72, últimos 2 anos) | |
| Lenovo ThinkPad T14 G3-21AJS00400 | |
| Huawei MateBook X Pro 2022 | |
| HP EliteBook 840 G9 | |
| Strange Brigade - 1920x1080 ultra AA:ultra AF:16 | |
| Schenker Vision 14 2022 RTX 3050 Ti | |
| Lenovo ThinkPad T14 G3-21AJS00400 | |
| Lenovo ThinkPad T14 G3-21CF004NGE | |
| Média da turma Office (12.9 - 142.1, n=54, últimos 2 anos) | |
| Huawei MateBook X Pro 2022 | |
| HP EliteBook 840 G9 | |
| Dota 2 Reborn - 1920x1080 ultra (3/3) best looking | |
| Schenker Vision 14 2022 RTX 3050 Ti | |
| Lenovo ThinkPad T14 G3-21AJS00400 | |
| Lenovo ThinkPad T14 G3-21CF004NGE | |
| HP EliteBook 840 G9 | |
| Huawei MateBook X Pro 2022 | |
| Média da turma Office (14.6 - 135, n=78, últimos 2 anos) | |
The Witcher 3 FPS Chart
| baixo | média | alto | ultra | 4K | |
|---|---|---|---|---|---|
| GTA V (2015) | 159.9 | 152.3 | 73.4 | 33.7 | |
| The Witcher 3 (2015) | 149 | 89 | 48 | 24 | |
| Dota 2 Reborn (2015) | 142.1 | 127 | 110.4 | 101.1 | |
| Final Fantasy XV Benchmark (2018) | 69.2 | 34.3 | 20.8 | ||
| X-Plane 11.11 (2018) | 109.9 | 95.2 | 73.4 | ||
| Far Cry 5 (2018) | 95 | 40 | 32 | 30 | |
| Strange Brigade (2018) | 147 | 59 | 51 | 45 | |
| F1 2021 (2021) | 152.7 | 53.5 | 47.4 | 25.7 | |
| F1 22 (2022) | 59.4 | 51.3 | 41.2 | 28.1 |
Emissões e gerenciamento de energia
Níveis de ruídos
O modelo Intel do ThinkPad T14 G3 é um companheiro muito silencioso sob carga baixa, mas a alta velocidade de rotação do ventilador é um pouco irritante. Mesmo que a velocidade seja reduzida rapidamente, o ventilador inicialmente faz uma rotação muito perceptível. Sob carga mais pesada, o dispositivo então também se torna ligeiramente mais alto em geral do que a versão AMD, e medimos um máximo de quase 40 dB(A) enquanto jogamos e durante o teste de estresse. Nossa unidade de teste não produz nenhum outro ruído eletrônico.
Barulho
| Ocioso |
| 23.6 / 23.6 / 23.6 dB |
| Carga |
| 35.1 / 39.6 dB |
 | ||
30 dB silencioso 40 dB(A) audível 50 dB(A) ruidosamente alto |
||
min: | ||
| Lenovo ThinkPad T14 G3-21AJS00400 GeForce MX550, i7-1260P, Samsung PM9A1 MZVL21T0HCLR | Lenovo ThinkPad T14 G3-21CF004NGE Radeon 680M, R7 PRO 6850U, Kioxia BG5 KBG5AZNV512G | HP EliteBook 840 G9 Iris Xe G7 96EUs, i7-1280P, SK hynix PC801 HFS512GEJ9X101N BF | Schenker Vision 14 2022 RTX 3050 Ti GeForce RTX 3050 Ti Laptop GPU, i7-12700H, Samsung SSD 980 Pro 1TB MZ-V8P1T0BW | Huawei MateBook X Pro 2022 Iris Xe G7 96EUs, i7-1260P, Silicon Motion PCIe-8 SSD 1TB | |
|---|---|---|---|---|---|
| Noise | 1% | -3% | -14% | 0% | |
| desligado / ambiente * (dB) | 23.6 | 24.2 -3% | 24.3 -3% | 24.4 -3% | 23.5 -0% |
| Idle Minimum * (dB) | 23.6 | 24.2 -3% | 24.5 -4% | 24.4 -3% | 23.5 -0% |
| Idle Average * (dB) | 23.6 | 24.2 -3% | 24.5 -4% | 24.4 -3% | 23.5 -0% |
| Idle Maximum * (dB) | 23.6 | 25.8 -9% | 26 -10% | 27.8 -18% | 25.9 -10% |
| Load Average * (dB) | 35.1 | 32.2 8% | 32.3 8% | 43.3 -23% | 33.8 4% |
| Witcher 3 ultra * (dB) | 39.6 | 34.1 14% | 39 2% | 48.2 -22% | 35.4 11% |
| Load Maximum * (dB) | 39.6 | 38.8 2% | 44.7 -13% | 48.8 -23% | 40.6 -3% |
* ... menor é melhor
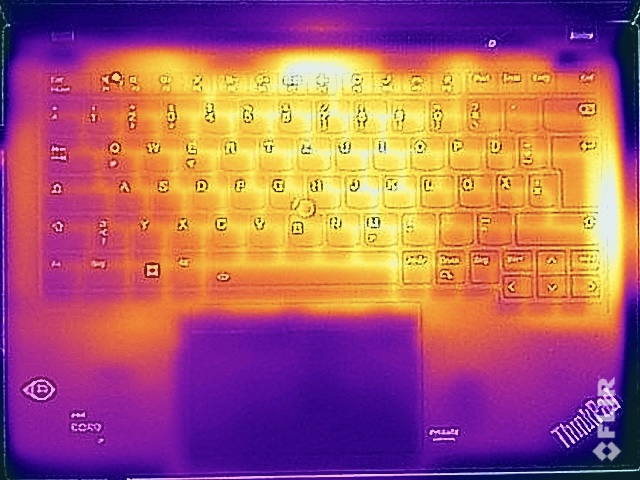
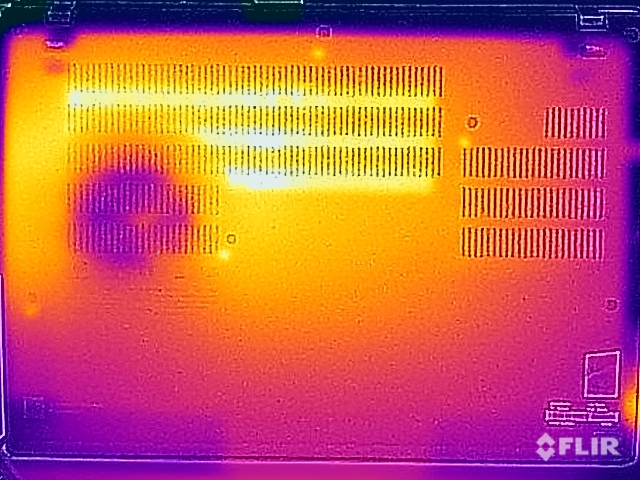
Temperaturas
A Lenovo tem um bom controle sobre as temperaturas de superfície do ThinkPad T14 G3 em geral, mas sob carga baixa, o dispositivo infelizmente já fica ligeiramente mais quente do que o modelo AMD. Sob carga mais pesada, medimos uma temperatura máxima ligeiramente superior a 40 °C (104 °F), de modo que isto não resulta em nenhuma limitação aqui, e você ainda pode digitar confortavelmente e também manter o dispositivo em seu colo.
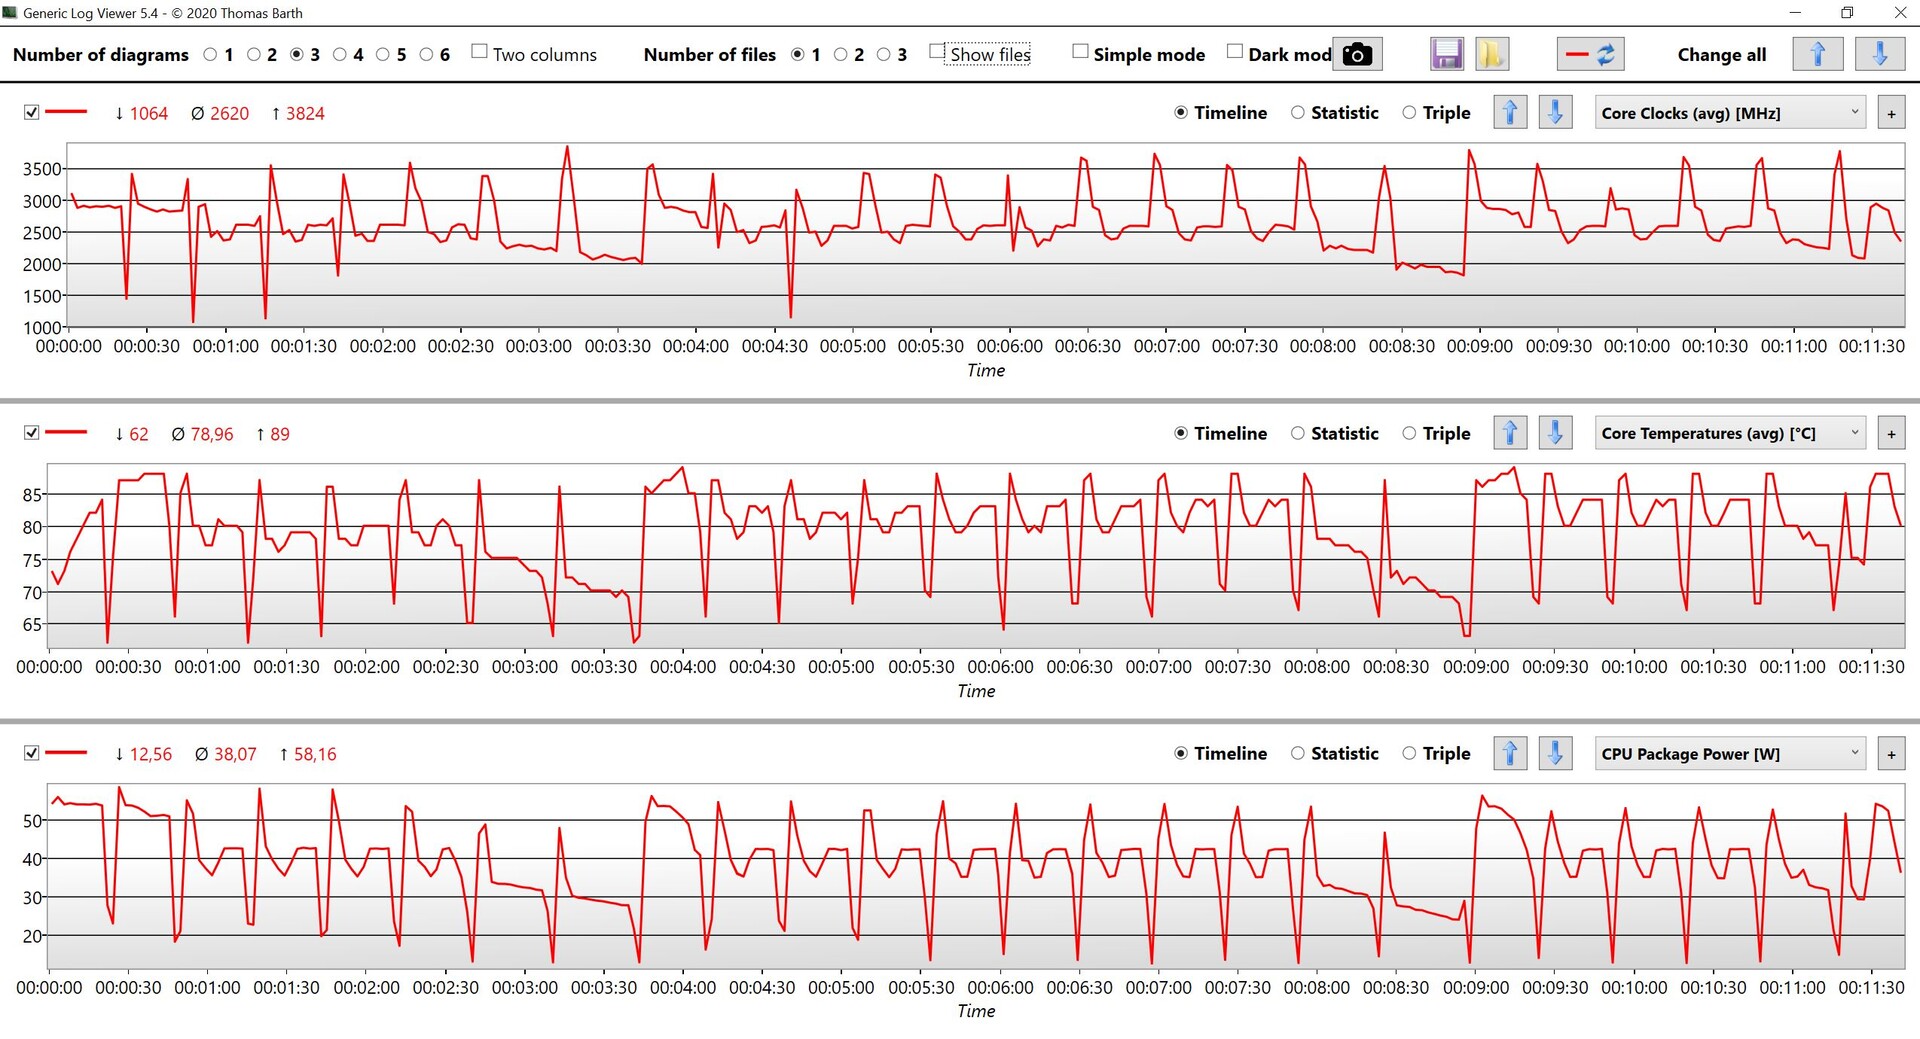
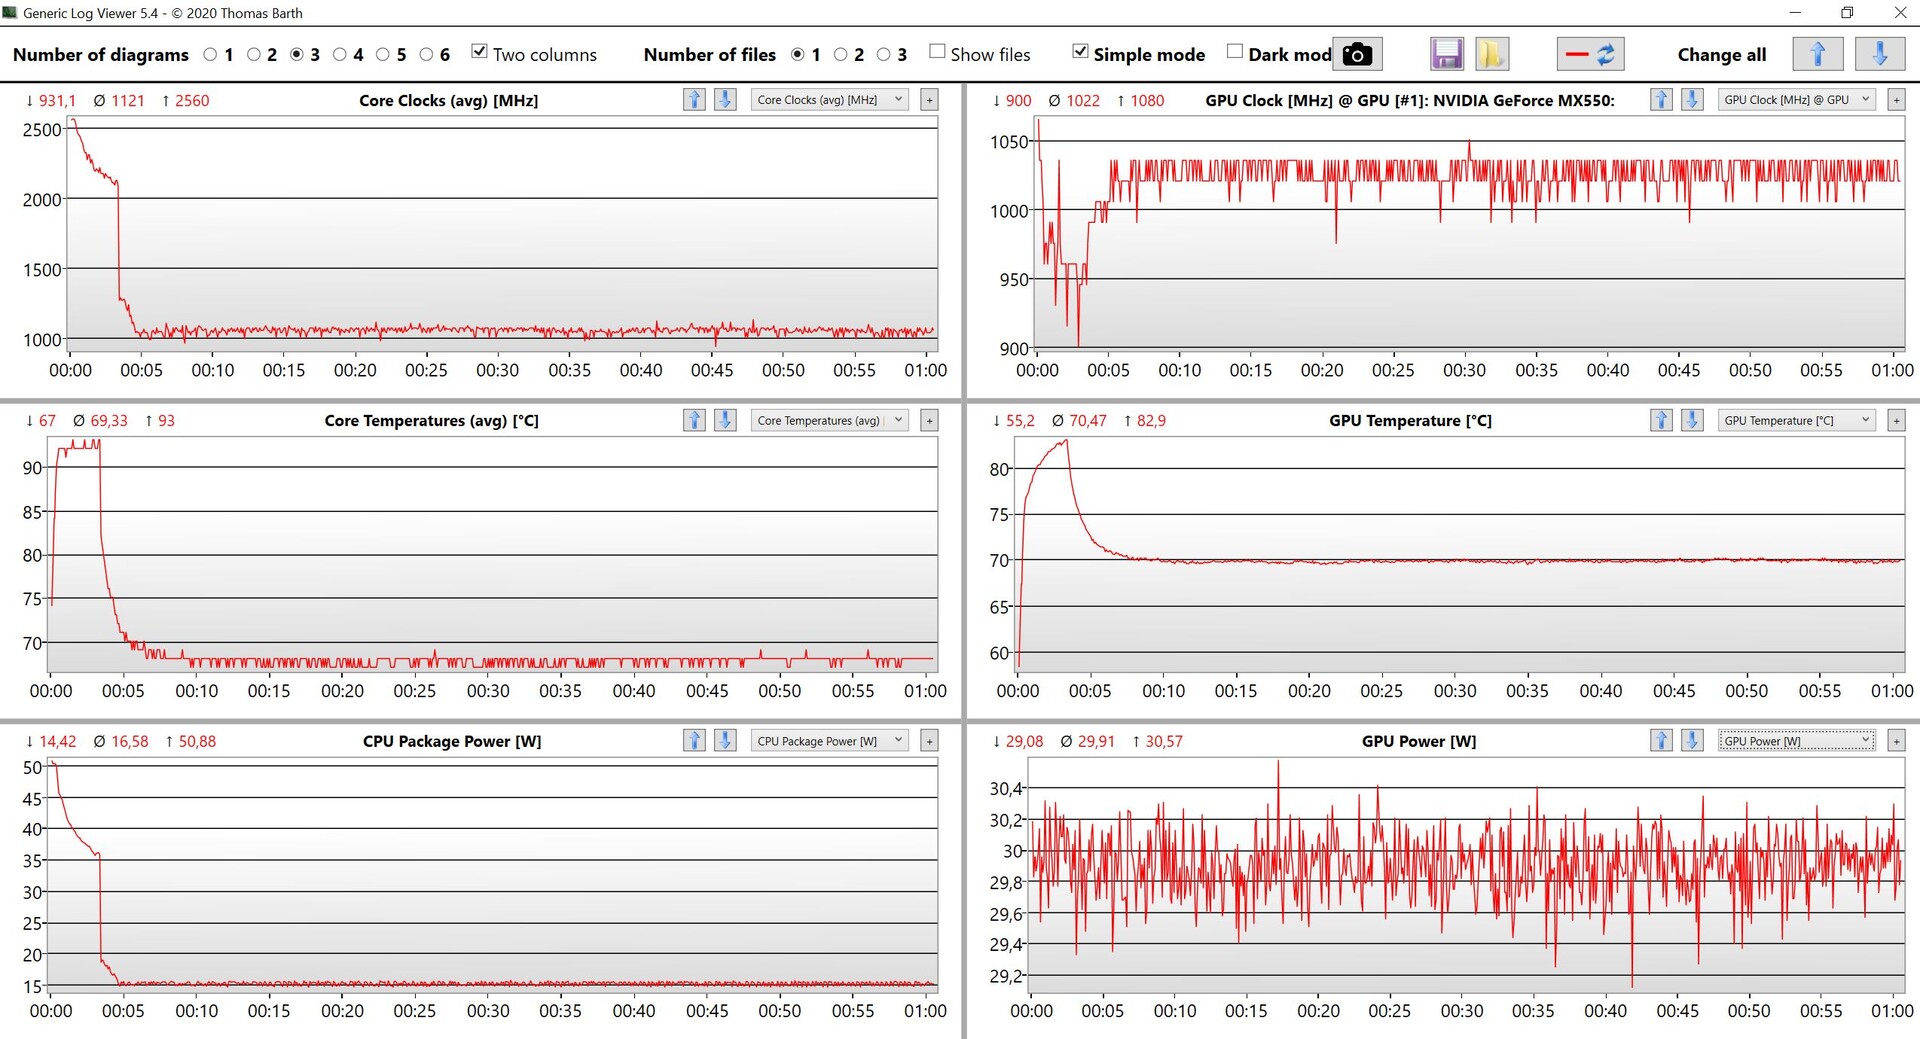
Durante o teste de estresse, o desempenho da GPU permanece estável em torno de 30 watts, mas o processador tem que estrangular seu desempenho maciçamente após alguns minutos, caindo de um máximo de 50 watts para apenas 15 watts. Se você olhar para o consumo, você também pode ver imediatamente que a fonte de alimentação de 65 watts nunca será capaz de fornecer energia suficiente aqui, mas mais sobre isso mais tarde.
(-) A temperatura máxima no lado superior é 46.4 °C / 116 F, em comparação com a média de 34.3 °C / 94 F , variando de 21.2 a 62.5 °C para a classe Office.
(±) A parte inferior aquece até um máximo de 43.1 °C / 110 F, em comparação com a média de 36.8 °C / 98 F
(+) Em uso inativo, a temperatura média para o lado superior é 29.9 °C / 86 F, em comparação com a média do dispositivo de 29.5 °C / ### class_avg_f### F.
(±) Jogando The Witcher 3, a temperatura média para o lado superior é 37.5 °C / 100 F, em comparação com a média do dispositivo de 29.5 °C / ## #class_avg_f### F.
(+) Os apoios para as mãos e o touchpad estão atingindo a temperatura máxima da pele (34.5 °C / 94.1 F) e, portanto, não estão quentes.
(-) A temperatura média da área do apoio para as mãos de dispositivos semelhantes foi 27.6 °C / 81.7 F (-6.9 °C / -12.4 F).
| Lenovo ThinkPad T14 G3-21AJS00400 Intel Core i7-1260P, NVIDIA GeForce MX550 | Lenovo ThinkPad T14 G3-21CF004NGE AMD Ryzen 7 PRO 6850U, AMD Radeon 680M | HP EliteBook 840 G9 Intel Core i7-1280P, Intel Iris Xe Graphics G7 96EUs | Schenker Vision 14 2022 RTX 3050 Ti Intel Core i7-12700H, NVIDIA GeForce RTX 3050 Ti Laptop GPU | Huawei MateBook X Pro 2022 Intel Core i7-1260P, Intel Iris Xe Graphics G7 96EUs | |
|---|---|---|---|---|---|
| Heat | 6% | 27% | -3% | 7% | |
| Maximum Upper Side * (°C) | 46.4 | 48.2 -4% | 32.8 29% | 48.4 -4% | 43.1 7% |
| Maximum Bottom * (°C) | 43.1 | 52.8 -23% | 36.6 15% | 57.1 -32% | 42 3% |
| Idle Upper Side * (°C) | 33.9 | 24.4 28% | 21.6 36% | 28.1 17% | 29.4 13% |
| Idle Bottom * (°C) | 31.4 | 24.5 22% | 22.2 29% | 29 8% | 29.4 6% |
* ... menor é melhor
Oradores
Lenovo ThinkPad T14 G3-21AJS00400 análise de áudio
(±) | o volume do alto-falante é médio, mas bom (###valor### dB)
Graves 100 - 315Hz
(-) | quase nenhum baixo - em média 24.9% menor que a mediana
(±) | a linearidade dos graves é média (11.7% delta para a frequência anterior)
Médios 400 - 2.000 Hz
(+) | médios equilibrados - apenas 2.4% longe da mediana
(+) | médios são lineares (4% delta para frequência anterior)
Altos 2 - 16 kHz
(+) | agudos equilibrados - apenas 2.5% longe da mediana
(+) | os máximos são lineares (3.8% delta da frequência anterior)
Geral 100 - 16.000 Hz
(±) | a linearidade do som geral é média (18% diferença em relação à mediana)
Comparado com a mesma classe
» 30% de todos os dispositivos testados nesta classe foram melhores, 7% semelhantes, 62% piores
» O melhor teve um delta de 7%, a média foi 21%, o pior foi 53%
Comparado com todos os dispositivos testados
» 38% de todos os dispositivos testados foram melhores, 8% semelhantes, 54% piores
» O melhor teve um delta de 4%, a média foi 23%, o pior foi 134%
Huawei MateBook X Pro 2022 análise de áudio
(+) | os alto-falantes podem tocar relativamente alto (###valor### dB)
Graves 100 - 315Hz
(±) | graves reduzidos - em média 5% menor que a mediana
(+) | o baixo é linear (5.3% delta para a frequência anterior)
Médios 400 - 2.000 Hz
(+) | médios equilibrados - apenas 1.5% longe da mediana
(+) | médios são lineares (2.5% delta para frequência anterior)
Altos 2 - 16 kHz
(+) | agudos equilibrados - apenas 2.1% longe da mediana
(+) | os máximos são lineares (5.3% delta da frequência anterior)
Geral 100 - 16.000 Hz
(+) | o som geral é linear (5% diferença em relação à mediana)
Comparado com a mesma classe
» 0% de todos os dispositivos testados nesta classe foram melhores, 0% semelhantes, 100% piores
» O melhor teve um delta de 5%, a média foi 18%, o pior foi 53%
Comparado com todos os dispositivos testados
» 0% de todos os dispositivos testados foram melhores, 0% semelhantes, 100% piores
» O melhor teve um delta de 4%, a média foi 23%, o pior foi 134%
Consumo de energia

O modelo Intel consome mais energia do que o Versão AMDem todos os cenários, mesmo durante a operação ociosa (mas os diferentes painéis também podem desempenhar um papel aqui). Além disso, a fonte de alimentação de 65 watts não é suficientemente dimensionada sob carga, uma vez que o dispositivo tem que retirar energia da bateria nos primeiros três minutos aqui, com a capacidade da bateria também caindo para ~95%. Somente depois que o processador se desnível a 15 watts (ver acima) é que a fonte de alimentação é capaz de fornecer energia suficiente durante o teste de estresse.
Temos que dizer que a Lenovo limita claramente o desempenho neste cenário. Utilizando uma fonte de alimentação de 100 watts, conseguimos medir um consumo máximo de 101 watts no início do teste de estresse, antes de nivelá-lo em ~85 watts. Com isso, o desempenho da CPU também seria melhor, mas por outro lado, isso também teria um efeito sobre o ruído do ventilador e as temperaturas de superfície.
| desligado | |
| Ocioso | |
| Carga |
|
Key:
min: | |
| Lenovo ThinkPad T14 G3-21AJS00400 GeForce MX550, i7-1260P, Samsung PM9A1 MZVL21T0HCLR | Lenovo ThinkPad T14 G3-21CF004NGE Radeon 680M, R7 PRO 6850U, Kioxia BG5 KBG5AZNV512G | HP EliteBook 840 G9 Iris Xe G7 96EUs, i7-1280P, SK hynix PC801 HFS512GEJ9X101N BF | Schenker Vision 14 2022 RTX 3050 Ti GeForce RTX 3050 Ti Laptop GPU, i7-12700H, Samsung SSD 980 Pro 1TB MZ-V8P1T0BW | Huawei MateBook X Pro 2022 Iris Xe G7 96EUs, i7-1260P, Silicon Motion PCIe-8 SSD 1TB | |
|---|---|---|---|---|---|
| Power Consumption | 26% | 10% | -63% | -55% | |
| Idle Minimum * (Watt) | 4.3 | 2.4 44% | 2.2 49% | 7.5 -74% | 6.5 -51% |
| Idle Average * (Watt) | 6.2 | 5.3 15% | 5.3 15% | 10.4 -68% | 13.7 -121% |
| Idle Maximum * (Watt) | 7 | 5.6 20% | 8.5 -21% | 11.4 -63% | 14.4 -106% |
| Load Average * (Watt) | 63.5 | 39.7 37% | 54.3 14% | 83.3 -31% | 64.6 -2% |
| Witcher 3 ultra * (Watt) | 52.5 | 42.8 18% | 51 3% | 92.7 -77% | 57.2 -9% |
| Load Maximum * (Watt) | 66.1 | 50.6 23% | 67.3 -2% | 110.3 -67% | 90.9 -38% |
* ... menor é melhor
Power Consumption The Witcher 3 / Stress Test
Power Consumption with External Monitor
Vida útil da bateria
O mesmo comportamento continua nos testes de bateria, e o modelo Intel é claramente superado pela versão AMD em nossos dois testes WLAN (uma vez em pleno brilho e depois em 150 cd/m²). Medimos entre 7-8 horas quando navegamos, enquanto o modelo AMD durou ~9,5-13 horas.
Pro
Contra
Veredicto - O ThinkPad T14 G3 é melhor com a AMD

Olhando o ThinkPad T14 G3 por si só, ele é um bom laptop comercial também com a combinação Intel/Nvidia com um desempenho gráfico ligeiramente maior do que o antigo iGPU da Intel. Em comparação com o Versão AMDhá algumas vantagens, tais como o maior desempenho do processador Intel com um único núcleo e o desempenho ligeiramente melhor do dedicado GeForce MX550. Além disso, o modelo Intel também oferece Thunderbolt 4 e há um slot SO-DIMM, permitindo expandir a memória de trabalho.
Por outro lado, há também desvantagens como o consumo significativamente maior de energia sob carga, com a fonte de alimentação de 65 watts incluída sendo muito fraca, resultando em estrangulamento artificial do desempenho sob carga combinada CPU/GPU. O ventilador também fica mais alto, e a vida útil da bateria se torna mais curta. Ao mesmo tempo, o processador AMD executa no mesmo nível nos testes de múltiplos núcleos, ao mesmo tempo em que consome menos energia.
Devido à placa gráfica adicional, o ThinkPad T14 G3 também consome mais energia, enquanto o desempenho adicional em comparação com a versão AMD é muito pequeno. Portanto, o módulo adicional dificilmente vale a pena, e aqueles que podem se contentar sem o Thunderbolt 4 terão o melhor laptop comercial com uma bateria de maior duração se escolherem a versão AMD do ThinkPad T14 G3.
Outro problema é a situação do painel, mas isso também vale para todos os modelos do ThinkPad T14 G3. Por exemplo, o painel LG deixou uma impressão melhor no teste do que o modelo da AU Optronics, embora tenha sido a tela de 14 polegadas de baixa potência em ambos os casos. Já vimos esta loteria de painéis em modelos anteriores, e infelizmente nunca se sabe com antecedência qual painel é usado.
Embora o T14 G3 já esteja no mercado há algum tempo, as novas CPUs móveis Raptor Lake da Intel são uma atualização bastante decepcionante no geral e, neste ponto, não sabemos quando os novos modelos AMD chegarão. Pelo menos, não esperamos uma atualização dentro dos próximos meses.
Preço e Disponibilidade
A versão Intel do Lenovo ThinkPad T14 G3 está disponível na Lenovo a partir de US$ 1012,32, com a configuração Nvidia a partir de US$1067,52.
Lenovo ThinkPad T14 G3-21AJS00400
- 03/21/2023 v7 (old)
Andreas Osthoff
Transparência
A seleção dos dispositivos a serem analisados é feita pela nossa equipe editorial. A amostra de teste foi fornecida ao autor como empréstimo pelo fabricante ou varejista para fins desta revisão. O credor não teve influência nesta revisão, nem o fabricante recebeu uma cópia desta revisão antes da publicação. Não houve obrigação de publicar esta revisão. Como empresa de mídia independente, a Notebookcheck não está sujeita à autoridade de fabricantes, varejistas ou editores.
É assim que o Notebookcheck está testando
Todos os anos, o Notebookcheck analisa de forma independente centenas de laptops e smartphones usando procedimentos padronizados para garantir que todos os resultados sejam comparáveis. Desenvolvemos continuamente nossos métodos de teste há cerca de 20 anos e definimos padrões da indústria no processo. Em nossos laboratórios de teste, equipamentos de medição de alta qualidade são utilizados por técnicos e editores experientes. Esses testes envolvem um processo de validação em vários estágios. Nosso complexo sistema de classificação é baseado em centenas de medições e benchmarks bem fundamentados, o que mantém a objetividade.Price comparison

