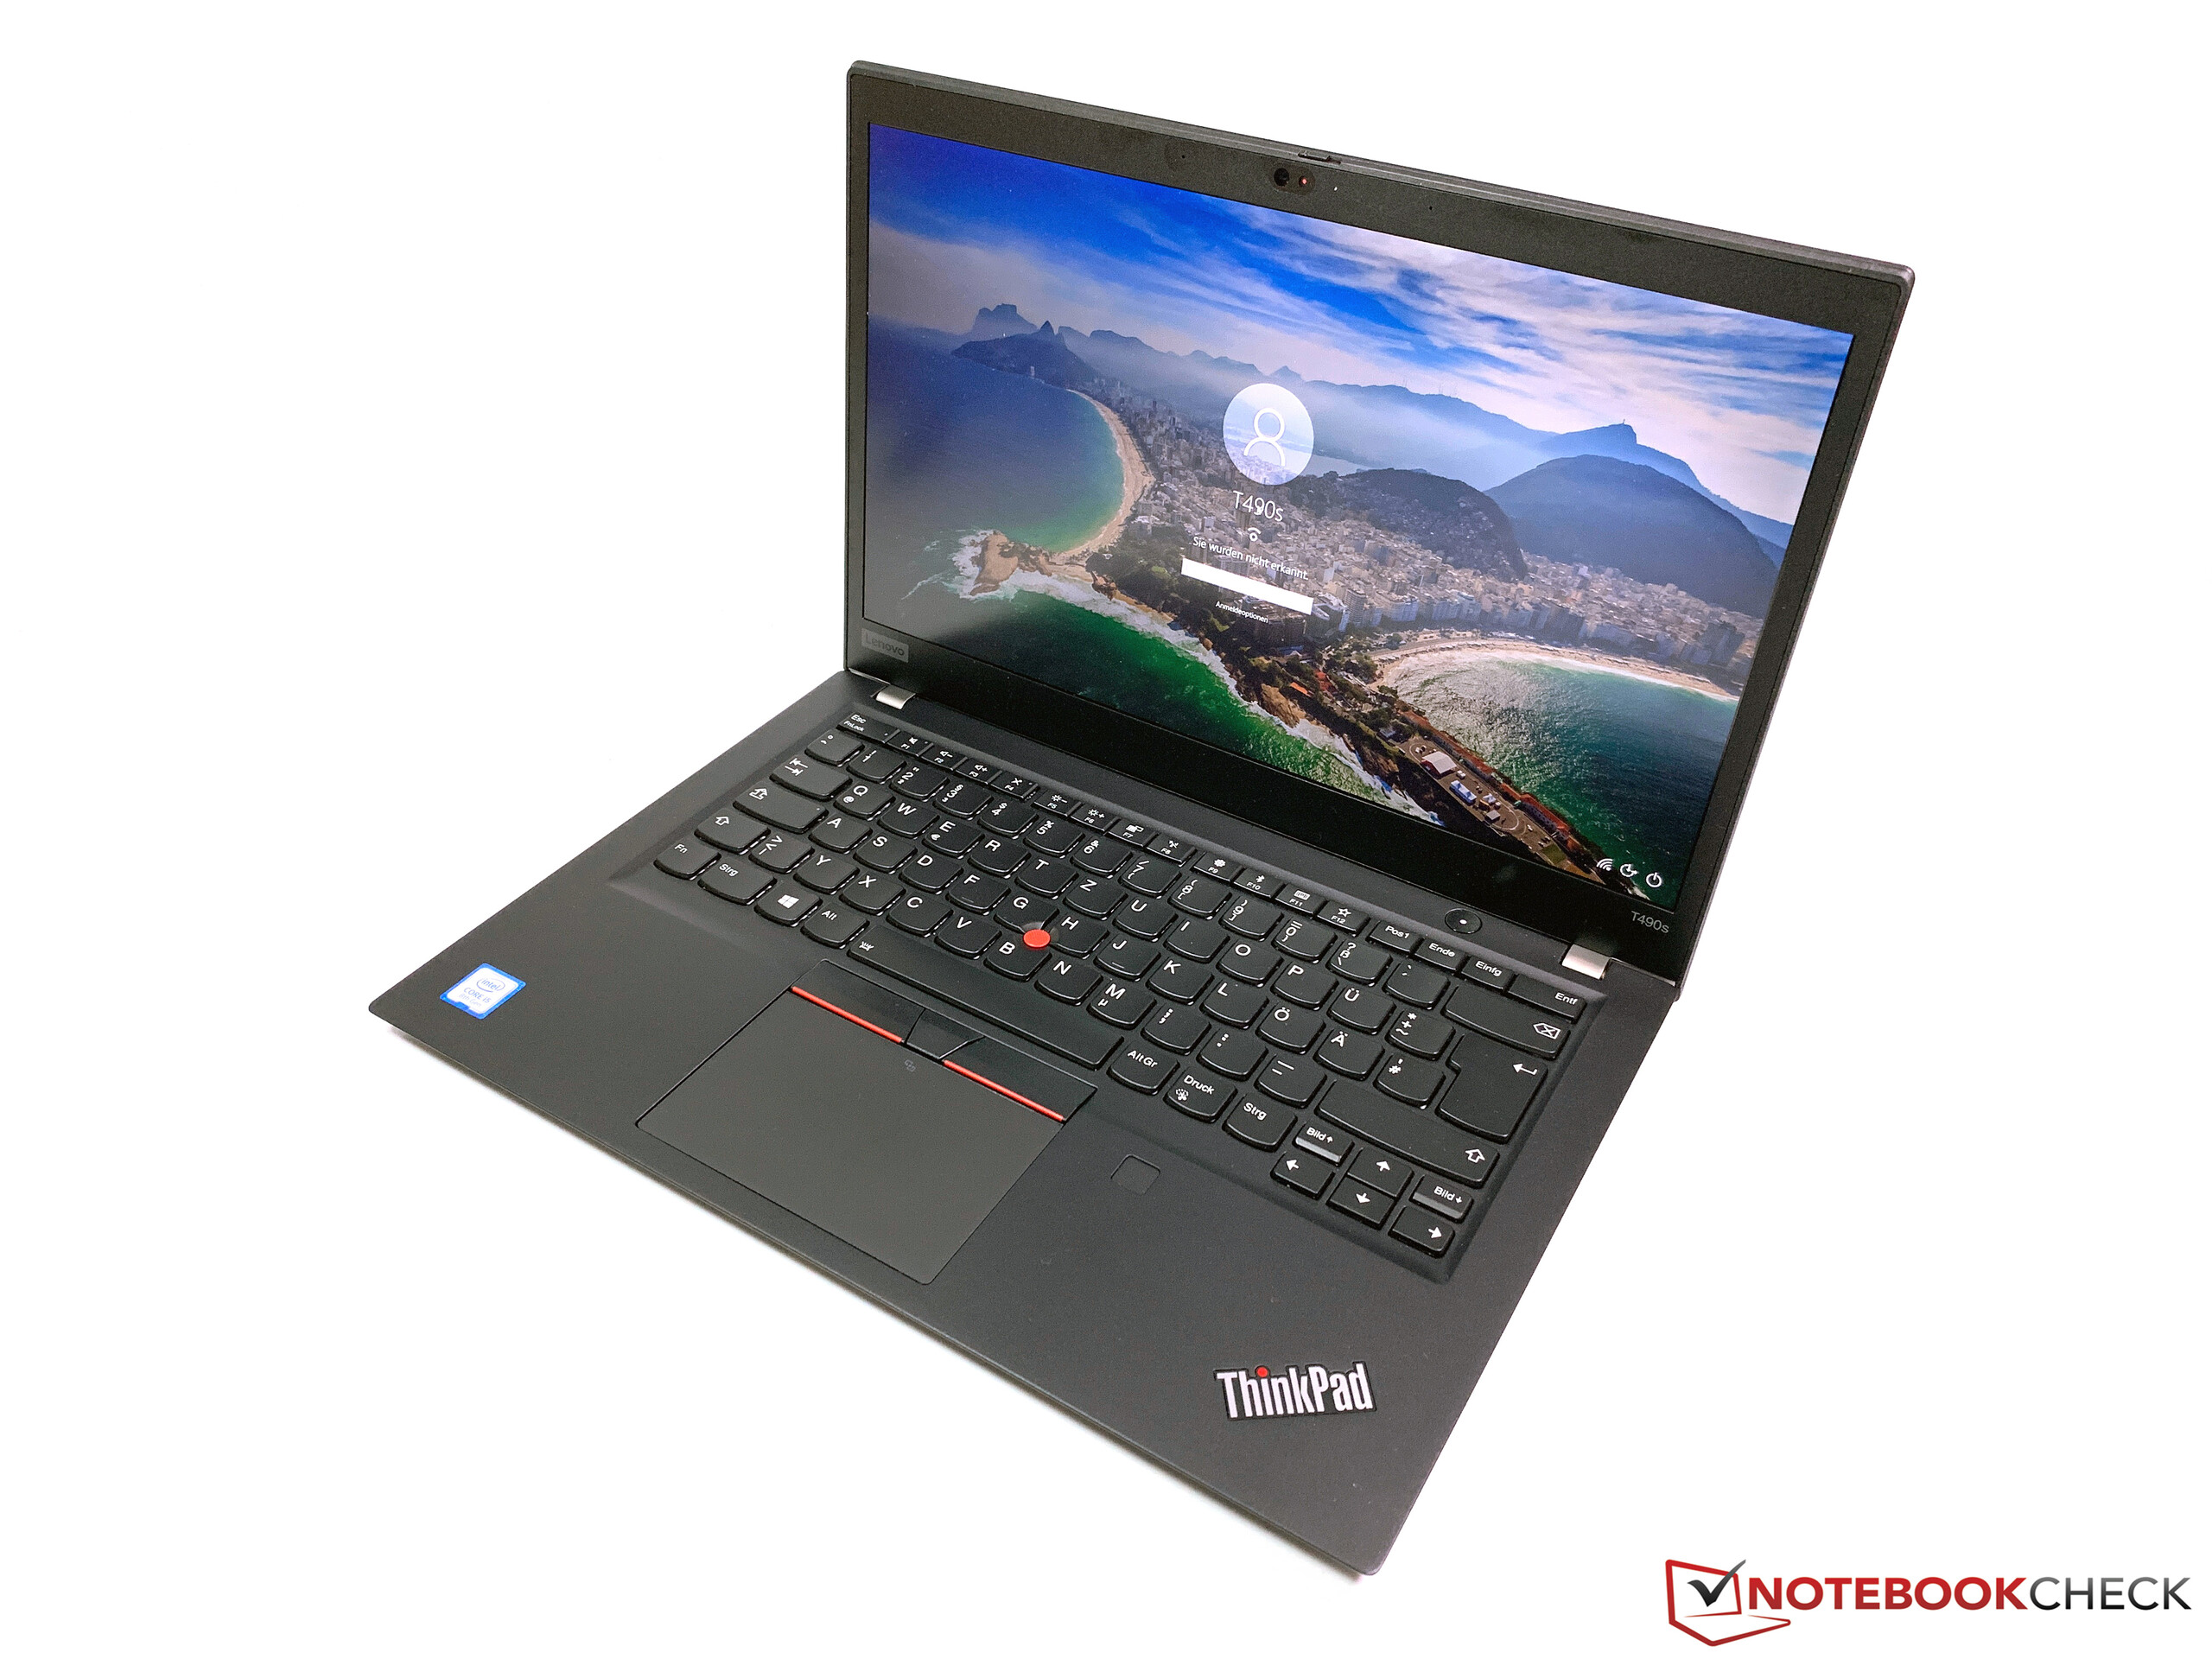
Breve Análise do Portátil Lenovo ThinkPad T490s (i5, Low Power FHD)

| SD Card Reader | |
| average JPG Copy Test (av. of 3 runs) | |
| Dell Latitude 7490 (Toshiba Exceria Pro M501 UHS-II) | |
| Lenovo ThinkPad T480s-20L7002AUS (Toshiba Exceria Pro SDXC 64 GB UHS-II) | |
| Fujitsu LifeBook U748 (Toshiba Exceria Pro SDXC 64 GB UHS-II) | |
| Lenovo ThinkPad T490s-20NYS02A00 (Toshiba Exceria Pro M501) | |
| Média da turma Office (22.4 - 198.5, n=21, últimos 2 anos) | |
| maximum AS SSD Seq Read Test (1GB) | |
| Dell Latitude 7490 (Toshiba Exceria Pro M501 UHS-II) | |
| Lenovo ThinkPad T490s-20NYS02A00 (Toshiba Exceria Pro M501) | |
| Lenovo ThinkPad T480s-20L7002AUS (Toshiba Exceria Pro SDXC 64 GB UHS-II) | |
| Fujitsu LifeBook U748 (Toshiba Exceria Pro SDXC 64 GB UHS-II) | |
| Média da turma Office (27.4 - 249, n=20, últimos 2 anos) | |
| |||||||||||||||||||||||||
iluminação: 87 %
iluminação com acumulador: 391 cd/m²
Contraste: 1700:1 (Preto: 0.23 cd/m²)
ΔE ColorChecker Calman: 3.4 | ∀{0.5-29.43 Ø4.73}
calibrated: 1.1
ΔE Greyscale Calman: 4 | ∀{0.09-98 Ø4.97}
97.4% sRGB (Argyll 1.6.3 3D)
62.4% AdobeRGB 1998 (Argyll 1.6.3 3D)
68.5% AdobeRGB 1998 (Argyll 3D)
97.6% sRGB (Argyll 3D)
67.1% Display P3 (Argyll 3D)
Gamma: 2.49
CCT: 6809 K
| Lenovo ThinkPad T490s-20NYS02A00 B140HAN05.7, , 1920x1080, 14" | Lenovo ThinkPad T480s-20L7002AUS NV140FHM-N46, , 1920x1080, 14" | Lenovo ThinkPad T490-20N3S02L00 NE140FHM-N61, , 1920x1080, 14" | Lenovo ThinkPad X1 Carbon G6-20KG0025UK Lenovo LEN40A9 / AUO B140HAK02.3, , 1920x1080, 14" | Fujitsu LifeBook U748 LG, LP140WF6-SPF1, , 1920x1080, 14" | HP EliteBook 840 G5-3JX66EA AUO3B3D, , 1920x1080, 14" | Dell Latitude 7490 AUO503D (D04YD_B140HAN), , 1920x1080, 14" | |
|---|---|---|---|---|---|---|---|
| Display | -40% | -2% | 0% | -10% | -1% | ||
| Display P3 Coverage (%) | 67.1 | 39.69 -41% | 69.3 3% | 68.3 2% | 60.2 -10% | 66.6 -1% | |
| sRGB Coverage (%) | 97.6 | 59.2 -39% | 92.2 -6% | 94.9 -3% | 88.2 -10% | 96.8 -1% | |
| AdobeRGB 1998 Coverage (%) | 68.5 | 41 -40% | 67.4 -2% | 69.3 1% | 61.3 -11% | 67.9 -1% | |
| Response Times | 21% | -19% | 36% | 37% | 25% | 25% | |
| Response Time Grey 50% / Grey 80% * (ms) | 61.6 ? | 44 ? 29% | 74 ? -20% | 40 ? 35% | 39.2 ? 36% | 42.4 ? 31% | 41.6 ? 32% |
| Response Time Black / White * (ms) | 38.8 ? | 34 ? 12% | 45.6 ? -18% | 25 ? 36% | 24.4 ? 37% | 31.6 ? 19% | 32 ? 18% |
| PWM Frequency (Hz) | 990 | 2451 ? | |||||
| Screen | -82% | -24% | -0% | -12% | -33% | -37% | |
| Brightness middle (cd/m²) | 391 | 288.3 -26% | 418 7% | 298 -24% | 334 -15% | 414 6% | 308.6 -21% |
| Brightness (cd/m²) | 389 | 281 -28% | 400 3% | 287 -26% | 313 -20% | 387 -1% | 294 -24% |
| Brightness Distribution (%) | 87 | 86 -1% | 88 1% | 91 5% | 89 2% | 87 0% | 89 2% |
| Black Level * (cd/m²) | 0.23 | 0.21 9% | 0.24 -4% | 0.2 13% | 0.41 -78% | 0.25 -9% | 0.23 -0% |
| Contrast (:1) | 1700 | 1373 -19% | 1742 2% | 1490 -12% | 815 -52% | 1656 -3% | 1342 -21% |
| Colorchecker dE 2000 * | 3.4 | 6.16 -81% | 4.7 -38% | 2.19 36% | 2.2 35% | 5.5 -62% | 6.07 -79% |
| Colorchecker dE 2000 max. * | 4.7 | 18.99 -304% | 8.7 -85% | 4.39 7% | 5.7 -21% | 9.9 -111% | 10.58 -125% |
| Colorchecker dE 2000 calibrated * | 1.1 | 4.51 -310% | 2.1 -91% | 1.67 -52% | 2.3 -109% | 1.67 -52% | |
| Greyscale dE 2000 * | 4 | 6.3 -58% | 5.9 -48% | 1.97 51% | 2.9 27% | 6.4 -60% | 7.3 -83% |
| Gamma | 2.49 88% | 2.517 87% | 2.06 107% | 2.43 91% | 2.34 94% | 2.31 95% | 2.061 107% |
| CCT | 6809 95% | 6886 94% | 7350 88% | 6571 99% | 6855 95% | 7811 83% | 7269 89% |
| Color Space (Percent of AdobeRGB 1998) (%) | 62.4 | 37.67 -40% | 59.9 -4% | 62 -1% | 65.3 5% | 56.9 -9% | 62 -1% |
| Color Space (Percent of sRGB) (%) | 97.4 | 58.9 -40% | 92.1 -5% | 95 -2% | 91.8 -6% | 88.1 -10% | 97 0% |
| Média Total (Programa/Configurações) | -34% /
-61% | -15% /
-19% | 12% /
4% | 13% /
-4% | -6% /
-22% | -4% /
-22% |
* ... menor é melhor
Exibir tempos de resposta
| ↔ Tempo de resposta preto para branco | ||
|---|---|---|
| 38.8 ms ... ascensão ↗ e queda ↘ combinadas | ↗ 21.2 ms ascensão | 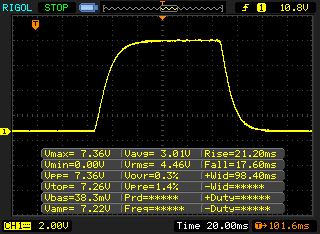 |
| ↘ 17.6 ms queda | ||
| A tela mostra taxas de resposta lentas em nossos testes e será insatisfatória para os jogadores. Em comparação, todos os dispositivos testados variam de 0.1 (mínimo) a 240 (máximo) ms. » 96 % de todos os dispositivos são melhores. Isso significa que o tempo de resposta medido é pior que a média de todos os dispositivos testados (19.9 ms). | ||
| ↔ Tempo de resposta 50% cinza a 80% cinza | ||
| 61.6 ms ... ascensão ↗ e queda ↘ combinadas | ↗ 30.8 ms ascensão | 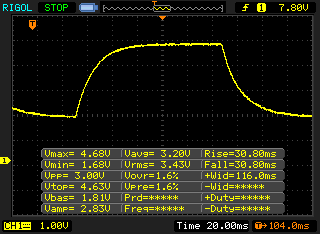 |
| ↘ 30.8 ms queda | ||
| A tela mostra taxas de resposta lentas em nossos testes e será insatisfatória para os jogadores. Em comparação, todos os dispositivos testados variam de 0.165 (mínimo) a 636 (máximo) ms. » 97 % de todos os dispositivos são melhores. Isso significa que o tempo de resposta medido é pior que a média de todos os dispositivos testados (31.1 ms). | ||
Cintilação da tela / PWM (modulação por largura de pulso)
| Tela tremeluzindo / PWM não detectado |  | ||
[pwm_comparison] Em comparação: 52 % de todos os dispositivos testados não usam PWM para escurecer a tela. Se PWM foi detectado, uma média de 7794 (mínimo: 5 - máximo: 343500) Hz foi medida. | |||

| PCMark 8 Home Score Accelerated v2 | 4244 pontos | |
| PCMark 8 Creative Score Accelerated v2 | 5323 pontos | |
| PCMark 8 Work Score Accelerated v2 | 4927 pontos | |
| PCMark 10 Score | 3985 pontos | |
Ajuda | ||
| Lenovo ThinkPad T490s-20NYS02A00 Intel SSD Pro 7600p SSDPEKKF512G8L | Lenovo ThinkPad T480s-20L7002AUS Samsung PM961 MZVLW256HEHP | Lenovo ThinkPad X1 Carbon G6-20KG0025UK Lenovo LENSE20256GMSP34MEAT2TA | Fujitsu LifeBook U748 Samsung PM961 MZVLW256HEHP | HP EliteBook 840 G5-3JX66EA Toshiba XG5 KXG50ZNV256G | Dell Latitude 7490 Toshiba KSG60ZMV256G | Média Intel SSD Pro 7600p SSDPEKKF512G8L | |
|---|---|---|---|---|---|---|---|
| CrystalDiskMark 5.2 / 6 | -15% | -15% | 18% | -27% | -56% | 12% | |
| Write 4K (MB/s) | 122 | 105.8 -13% | 116.4 -5% | 135.5 11% | 92.8 -24% | 79.4 -35% | 133.9 ? 10% |
| Read 4K (MB/s) | 45.56 | 40.79 -10% | 45.75 0% | 43.76 -4% | 30.67 -33% | 27.37 -40% | 59.1 ? 30% |
| Write Seq (MB/s) | 1497 | 1204 -20% | 455.1 -70% | 1006 -33% | 353.2 -76% | 343.9 -77% | 1378 ? -8% |
| Read Seq (MB/s) | 2385 | 1065 -55% | 1818 -24% | 1761 -26% | 1937 -19% | 472.7 -80% | 2341 ? -2% |
| Write 4K Q32T1 (MB/s) | 240.9 | 219.2 -9% | 248.9 3% | 660 174% | 358 49% | 206 -14% | 355 ? 47% |
| Read 4K Q32T1 (MB/s) | 338 | 304.3 -10% | 358 6% | 432.6 28% | 253.1 -25% | 188.3 -44% | 429 ? 27% |
| Write Seq Q32T1 (MB/s) | 1528 | 1267 -17% | 1191 -22% | 1231 -19% | 359.6 -76% | 343.3 -78% | 1514 ? -1% |
| Read Seq Q32T1 (MB/s) | 2915 | 3303 13% | 2755 -5% | 3220 10% | 2613 -10% | 533 -82% | 2677 ? -8% |
| AS SSD | -12% | -80% | -13% | -128% | -81% | -2% | |
| Seq Read (MB/s) | 2654 | 2094 -21% | 2365 -11% | 1569 -41% | 1611 -39% | 486.2 -82% | 2408 ? -9% |
| Seq Write (MB/s) | 1341 | 1172 -13% | 1220 -9% | 805 -40% | 339 -75% | 294.9 -78% | 1318 ? -2% |
| 4K Read (MB/s) | 65.6 | 42.09 -36% | 35.67 -46% | 45.42 -31% | 29.01 -56% | 26.66 -59% | 60.9 ? -7% |
| 4K Write (MB/s) | 164.4 | 97.8 -41% | 87.6 -47% | 144.3 -12% | 93.6 -43% | 79.2 -52% | 153.3 ? -7% |
| 4K-64 Read (MB/s) | 761 | 1183 55% | 446.1 -41% | 1203 58% | 413.3 -46% | 316.1 -58% | 811 ? 7% |
| 4K-64 Write (MB/s) | 927 | 706 -24% | 195.8 -79% | 516 -44% | 248.3 -73% | 248.1 -73% | 895 ? -3% |
| Access Time Read * (ms) | 0.033 | 0.055 -67% | 0.108 -227% | 0.052 -58% | 0.321 -873% | 0.112 -239% | 0.0376 ? -14% |
| Access Time Write * (ms) | 0.039 | 0.038 3% | 0.144 -269% | 0.025 36% | 0.053 -36% | 0.056 -44% | 0.0352 ? 10% |
| Score Read (Points) | 1092 | 1435 31% | 718 -34% | 1405 29% | 603 -45% | 391 -64% | 1113 ? 2% |
| Score Write (Points) | 1226 | 921 -25% | 405 -67% | 741 -40% | 376 -69% | 357 -71% | 1180 ? -4% |
| Score Total (Points) | 2831 | 3048 8% | 1443 -49% | 2833 0% | 1232 -56% | 947 -67% | 2825 ? 0% |
| Copy ISO MB/s (MB/s) | 733 | 319.2 | 1474 ? | ||||
| Copy Program MB/s (MB/s) | 210.9 | 168.2 | 460 ? | ||||
| Copy Game MB/s (MB/s) | 549 | 309.3 | 964 ? | ||||
| Média Total (Programa/Configurações) | -14% /
-13% | -48% /
-52% | 3% /
-0% | -78% /
-86% | -69% /
-70% | 5% /
4% |
* ... menor é melhor

| 3DMark | |
| 1280x720 Cloud Gate Standard Graphics | |
| Média da turma Office (11640 - 118515, n=37, últimos 2 anos) | |
| Lenovo ThinkPad T480s-20L8S02E00 | |
| Lenovo ThinkPad E485-20KU000NGE | |
| Lenovo ThinkPad T490s-20NYS02A00 | |
| Lenovo ThinkPad X1 Carbon G6-20KG0025UK | |
| Média Intel UHD Graphics 620 (6205 - 16400, n=225) | |
| HP EliteBook 840 G5-3JX66EA | |
| Fujitsu LifeBook U748 | |
| Dell Latitude 7490 | |
| 1920x1080 Fire Strike Graphics | |
| Média da turma Office (736 - 21871, n=72, últimos 2 anos) | |
| Lenovo ThinkPad T480s-20L8S02E00 | |
| Lenovo ThinkPad E485-20KU000NGE | |
| Lenovo ThinkPad T490s-20NYS02A00 | |
| Lenovo ThinkPad X1 Carbon G6-20KG0025UK | |
| Média Intel UHD Graphics 620 (557 - 2608, n=213) | |
| HP EliteBook 840 G5-3JX66EA | |
| Dell Latitude 7490 | |
| Fujitsu LifeBook U748 | |
| 2560x1440 Time Spy Graphics | |
| Média da turma Office (493 - 6679, n=67, últimos 2 anos) | |
| Lenovo ThinkPad E485-20KU000NGE | |
| Média Intel UHD Graphics 620 (299 - 797, n=88) | |
| Fujitsu LifeBook U748 | |
| HP EliteBook 840 G5-3JX66EA | |
| 3DMark 11 Performance | 2079 pontos | |
| 3DMark Cloud Gate Standard Score | 10155 pontos | |
| 3DMark Fire Strike Score | 1217 pontos | |
Ajuda | ||
| baixo | média | alto | ultra | |
|---|---|---|---|---|
| BioShock Infinite (2013) | 58.7 | 35.3 | 30.5 | 10.3 |
| The Witcher 3 (2015) | 17 | |||
| Dota 2 Reborn (2015) | 86 | 53.3 | 22 | 19.5 |
| Rocket League (2017) | 90.5 | 37.5 | 24.7 | |
| X-Plane 11.11 (2018) | 31.1 | 19.3 | 17.4 |
Barulho
| Ocioso |
| 29.4 / 29.4 / 30.9 dB |
| Carga |
| 33.3 / 33.3 dB |
 | ||
30 dB silencioso 40 dB(A) audível 50 dB(A) ruidosamente alto |
||
min: | ||
| Lenovo ThinkPad T490s-20NYS02A00 UHD Graphics 620, i5-8265U, Intel SSD Pro 7600p SSDPEKKF512G8L | Lenovo ThinkPad T480s-20L7002AUS UHD Graphics 620, i5-8250U, Samsung PM961 MZVLW256HEHP | Lenovo ThinkPad X1 Carbon G6-20KG0025UK UHD Graphics 620, i5-8350U, Lenovo LENSE20256GMSP34MEAT2TA | Fujitsu LifeBook U748 UHD Graphics 620, i5-8250U, Samsung PM961 MZVLW256HEHP | HP EliteBook 840 G5-3JX66EA UHD Graphics 620, i5-8250U, Toshiba XG5 KXG50ZNV256G | Dell Latitude 7490 UHD Graphics 620, i5-8350U, Toshiba KSG60ZMV256G | |
|---|---|---|---|---|---|---|
| Noise | -2% | 1% | -1% | -2% | 1% | |
| desligado / ambiente * (dB) | 29.4 | 28.1 4% | 30.25 -3% | 29.3 -0% | 28.8 2% | 28.2 4% |
| Idle Minimum * (dB) | 29.4 | 28.1 4% | 30.25 -3% | 29.3 -0% | 28.8 2% | 28.2 4% |
| Idle Average * (dB) | 29.4 | 28.1 4% | 30.25 -3% | 29.3 -0% | 28.8 2% | 28.2 4% |
| Idle Maximum * (dB) | 30.9 | 28.1 9% | 30.25 2% | 29.9 3% | 33.1 -7% | 28.7 7% |
| Load Average * (dB) | 33.3 | 35.5 -7% | 31.3 6% | 32.5 2% | 35.2 -6% | 29.9 10% |
| Load Maximum * (dB) | 33.3 | 41.5 -25% | 31.3 6% | 36.6 -10% | 35.2 -6% | 40.2 -21% |
* ... menor é melhor
(±) A temperatura máxima no lado superior é 43.3 °C / 110 F, em comparação com a média de 34.3 °C / 94 F , variando de 21.2 a 62.5 °C para a classe Office.
(-) A parte inferior aquece até um máximo de 45.1 °C / 113 F, em comparação com a média de 36.8 °C / 98 F
(+) Em uso inativo, a temperatura média para o lado superior é 24.4 °C / 76 F, em comparação com a média do dispositivo de 29.5 °C / ### class_avg_f### F.
(+) Os apoios para as mãos e o touchpad são mais frios que a temperatura da pele, com um máximo de 27.8 °C / 82 F e, portanto, são frios ao toque.
(±) A temperatura média da área do apoio para as mãos de dispositivos semelhantes foi 27.5 °C / 81.5 F (-0.3 °C / -0.5 F).
Lenovo ThinkPad T490s-20NYS02A00 análise de áudio
(-) | alto-falantes não muito altos (###valor### dB)
Graves 100 - 315Hz
(-) | quase nenhum baixo - em média 19.1% menor que a mediana
(±) | a linearidade dos graves é média (10% delta para a frequência anterior)
Médios 400 - 2.000 Hz
(±) | médios mais altos - em média 5.2% maior que a mediana
(+) | médios são lineares (6.5% delta para frequência anterior)
Altos 2 - 16 kHz
(+) | agudos equilibrados - apenas 2.5% longe da mediana
(+) | os máximos são lineares (6.3% delta da frequência anterior)
Geral 100 - 16.000 Hz
(±) | a linearidade do som geral é média (27% diferença em relação à mediana)
Comparado com a mesma classe
» 83% de todos os dispositivos testados nesta classe foram melhores, 6% semelhantes, 11% piores
» O melhor teve um delta de 7%, a média foi 21%, o pior foi 53%
Comparado com todos os dispositivos testados
» 83% de todos os dispositivos testados foram melhores, 4% semelhantes, 14% piores
» O melhor teve um delta de 4%, a média foi 24%, o pior foi 134%
HP EliteBook 840 G5-3JX66EA análise de áudio
(+) | os alto-falantes podem tocar relativamente alto (###valor### dB)
Graves 100 - 315Hz
(-) | quase nenhum baixo - em média 24.7% menor que a mediana
(±) | a linearidade dos graves é média (10.1% delta para a frequência anterior)
Médios 400 - 2.000 Hz
(+) | médios equilibrados - apenas 3.3% longe da mediana
(+) | médios são lineares (4.9% delta para frequência anterior)
Altos 2 - 16 kHz
(±) | máximos mais altos - em média 7.1% maior que a mediana
(+) | os máximos são lineares (4.3% delta da frequência anterior)
Geral 100 - 16.000 Hz
(±) | a linearidade do som geral é média (20.6% diferença em relação à mediana)
Comparado com a mesma classe
» 47% de todos os dispositivos testados nesta classe foram melhores, 9% semelhantes, 44% piores
» O melhor teve um delta de 7%, a média foi 21%, o pior foi 53%
Comparado com todos os dispositivos testados
» 55% de todos os dispositivos testados foram melhores, 8% semelhantes, 37% piores
» O melhor teve um delta de 4%, a média foi 24%, o pior foi 134%
Dell Latitude 7490 análise de áudio
(±) | o volume do alto-falante é médio, mas bom (###valor### dB)
Graves 100 - 315Hz
(±) | graves reduzidos - em média 13.6% menor que a mediana
(±) | a linearidade dos graves é média (10.5% delta para a frequência anterior)
Médios 400 - 2.000 Hz
(+) | médios equilibrados - apenas 3.9% longe da mediana
(±) | a linearidade dos médios é média (7.3% delta para frequência anterior)
Altos 2 - 16 kHz
(+) | agudos equilibrados - apenas 3.4% longe da mediana
(±) | a linearidade dos máximos é média (8.8% delta para frequência anterior)
Geral 100 - 16.000 Hz
(±) | a linearidade do som geral é média (18.8% diferença em relação à mediana)
Comparado com a mesma classe
» 34% de todos os dispositivos testados nesta classe foram melhores, 7% semelhantes, 58% piores
» O melhor teve um delta de 7%, a média foi 21%, o pior foi 53%
Comparado com todos os dispositivos testados
» 43% de todos os dispositivos testados foram melhores, 8% semelhantes, 49% piores
» O melhor teve um delta de 4%, a média foi 24%, o pior foi 134%
| desligado | |
| Ocioso | |
| Carga |
|
Key:
min: | |
| Lenovo ThinkPad T490s-20NYS02A00 i5-8265U, UHD Graphics 620, Intel SSD Pro 7600p SSDPEKKF512G8L, IPS, 1920x1080, 14" | Lenovo ThinkPad T480s-20L7002AUS i5-8250U, UHD Graphics 620, Samsung PM961 MZVLW256HEHP, TFT-LCD, 1920x1080, 14" | Lenovo ThinkPad X1 Carbon G6-20KG0025UK i5-8350U, UHD Graphics 620, Lenovo LENSE20256GMSP34MEAT2TA, IPS, 1920x1080, 14" | Fujitsu LifeBook U748 i5-8250U, UHD Graphics 620, Samsung PM961 MZVLW256HEHP, IPS, 1920x1080, 14" | HP EliteBook 840 G5-3JX66EA i5-8250U, UHD Graphics 620, Toshiba XG5 KXG50ZNV256G, IPS, 1920x1080, 14" | Dell Latitude 7490 i5-8350U, UHD Graphics 620, Toshiba KSG60ZMV256G, IPS, 1920x1080, 14" | Média Intel UHD Graphics 620 | Média da turma Office | |
|---|---|---|---|---|---|---|---|---|
| Power Consumption | 5% | -8% | 1% | -10% | 22% | -8% | -24% | |
| Idle Minimum * (Watt) | 2.62 | 3.1 -18% | 4.7 -79% | 3.33 -27% | 3.2 -22% | 2 24% | 3.81 ? -45% | 4.44 ? -69% |
| Idle Average * (Watt) | 5.16 | 6.4 -24% | 7.3 -41% | 6.9 -34% | 6.6 -28% | 4.7 9% | 6.94 ? -34% | 7.38 ? -43% |
| Idle Maximum * (Watt) | 8.7 | 9.4 -8% | 9.4 -8% | 8.2 6% | 9.5 -9% | 5.7 34% | 8.75 ? -1% | 8.59 ? 1% |
| Load Average * (Watt) | 40 | 29.8 25% | 28 30% | 29.4 26% | 36.2 9% | 38.4 4% | 35 ? 12% | 43 ? -8% |
| Load Maximum * (Watt) | 64 | 31.2 51% | 28.2 56% | 43.4 32% | 65.6 -2% | 38.9 39% | 47.5 ? 26% | 64.5 ? -1% |
* ... menor é melhor
| Lenovo ThinkPad T490s-20NYS02A00 i5-8265U, UHD Graphics 620, 57 Wh | Lenovo ThinkPad T480s-20L7002AUS i5-8250U, UHD Graphics 620, 57 Wh | Lenovo ThinkPad X1 Carbon G6-20KG0025UK i5-8350U, UHD Graphics 620, 57 Wh | Fujitsu LifeBook U748 i5-8250U, UHD Graphics 620, 50 Wh | HP EliteBook 840 G5-3JX66EA i5-8250U, UHD Graphics 620, 50 Wh | Dell Latitude 7490 i5-8350U, UHD Graphics 620, 60 Wh | Média da turma Office | |
|---|---|---|---|---|---|---|---|
| Duração da bateria | -11% | -2% | -28% | -8% | -10% | 14% | |
| H.264 (h) | 13.9 | 11 -21% | 6.6 -53% | 6.7 -52% | 15 ? 8% | ||
| WiFi v1.3 (h) | 10.1 | 9 -11% | 10.4 3% | 6.5 -36% | 7.5 -26% | 9.1 -10% | 12.9 ? 28% |
| Load (h) | 1.7 | 1.9 12% | 1.8 6% | 2.6 53% | 1.807 ? 6% | ||
| Reader / Idle (h) | 24.5 | 15.6 | 19 | 23.7 ? |
Pro
Contra

Podemos mantê-lo breve desta vez: O ThinkPad T490s é um portátil de negócios muito bom e um dos melhores pacotes agora com o novo monitor. O SKU Campus por apenas 1.259 Euros também é uma verdadeira barganha.
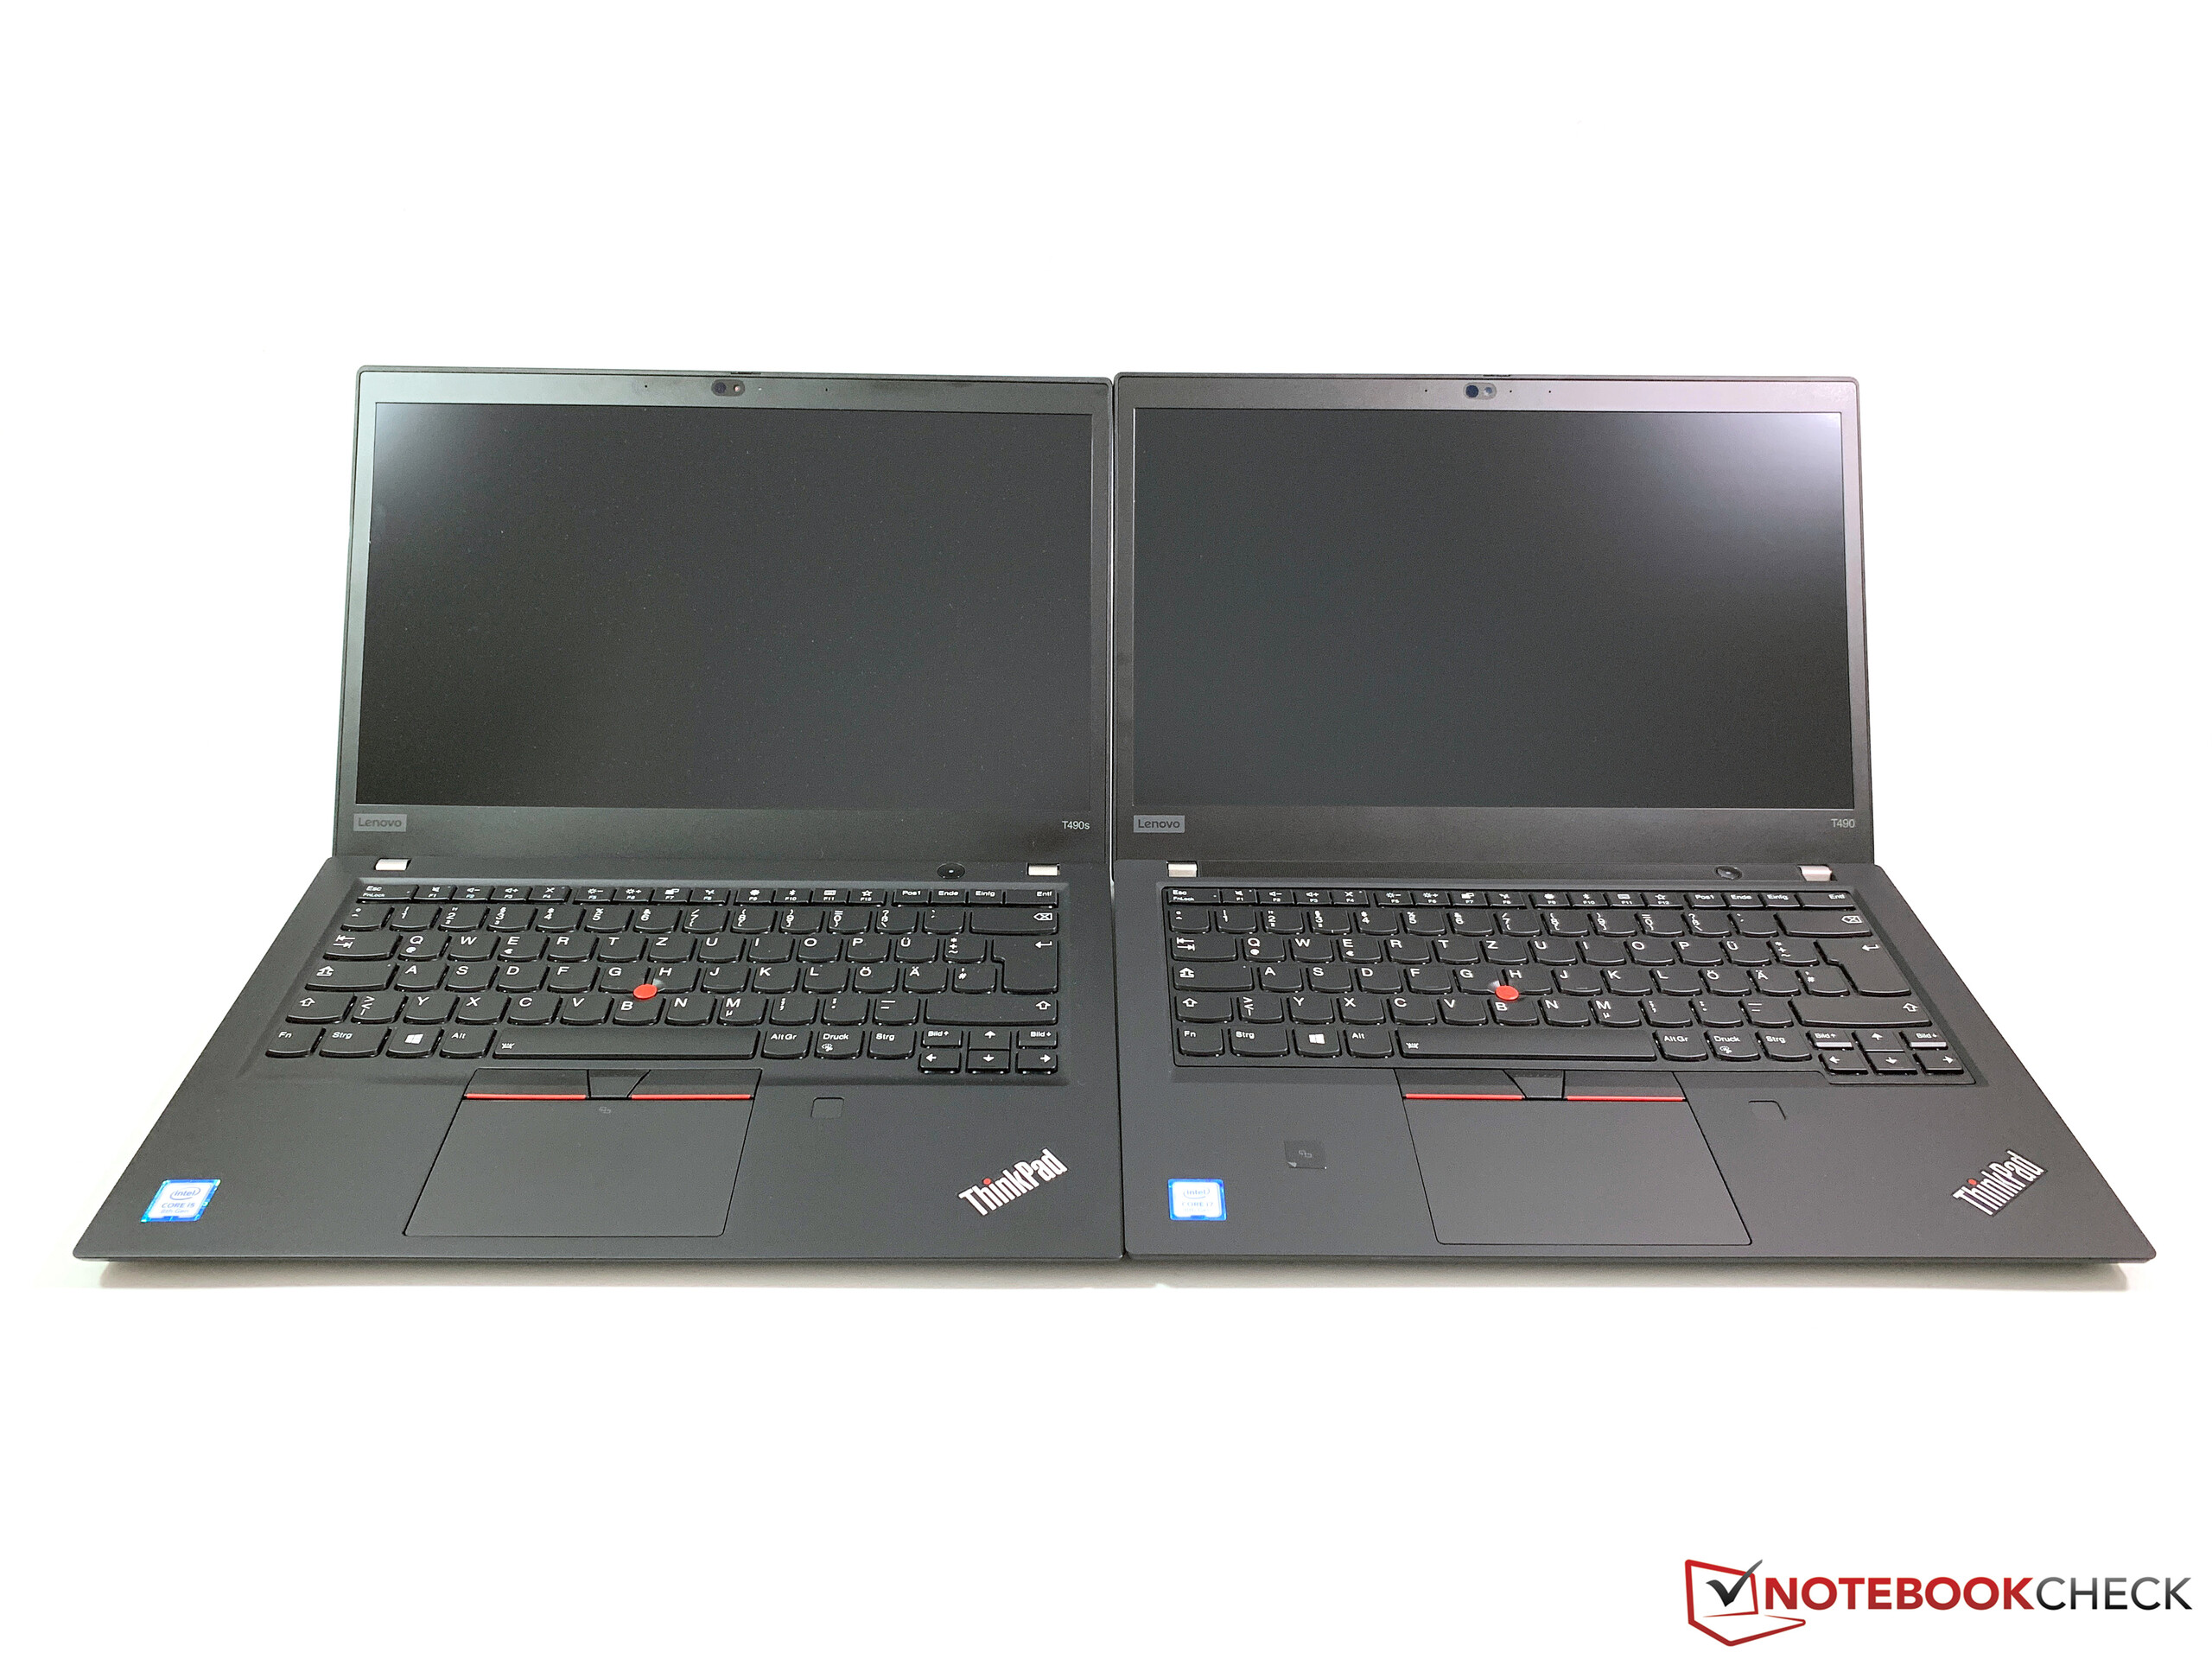
Poderíamos terminar nosso veredicto neste momento, mas a situação é um pouco mais complexa quando você compara o ThinkPad T490s com seu antecessor e outros portáteis de 14 polegadas da Lenovo. Uma olhada no portfólio atual de dispositivos de negócios de alta qualidade mostra que todas as séries são mais semelhantes do que nunca. Isso inclui a T490, a T490s, a X1 Carbon, bem como a nova X390, que inclusive compartilha a placa-mãe com a T490s. Obviamente, existem algumas diferenças, mas os clientes obtêm praticamente quatro sistemas quase idênticos quando você examina SKUs equipados de maneira semelhante, e nem sequer incluímos os concorrentes de outros fabricantes.
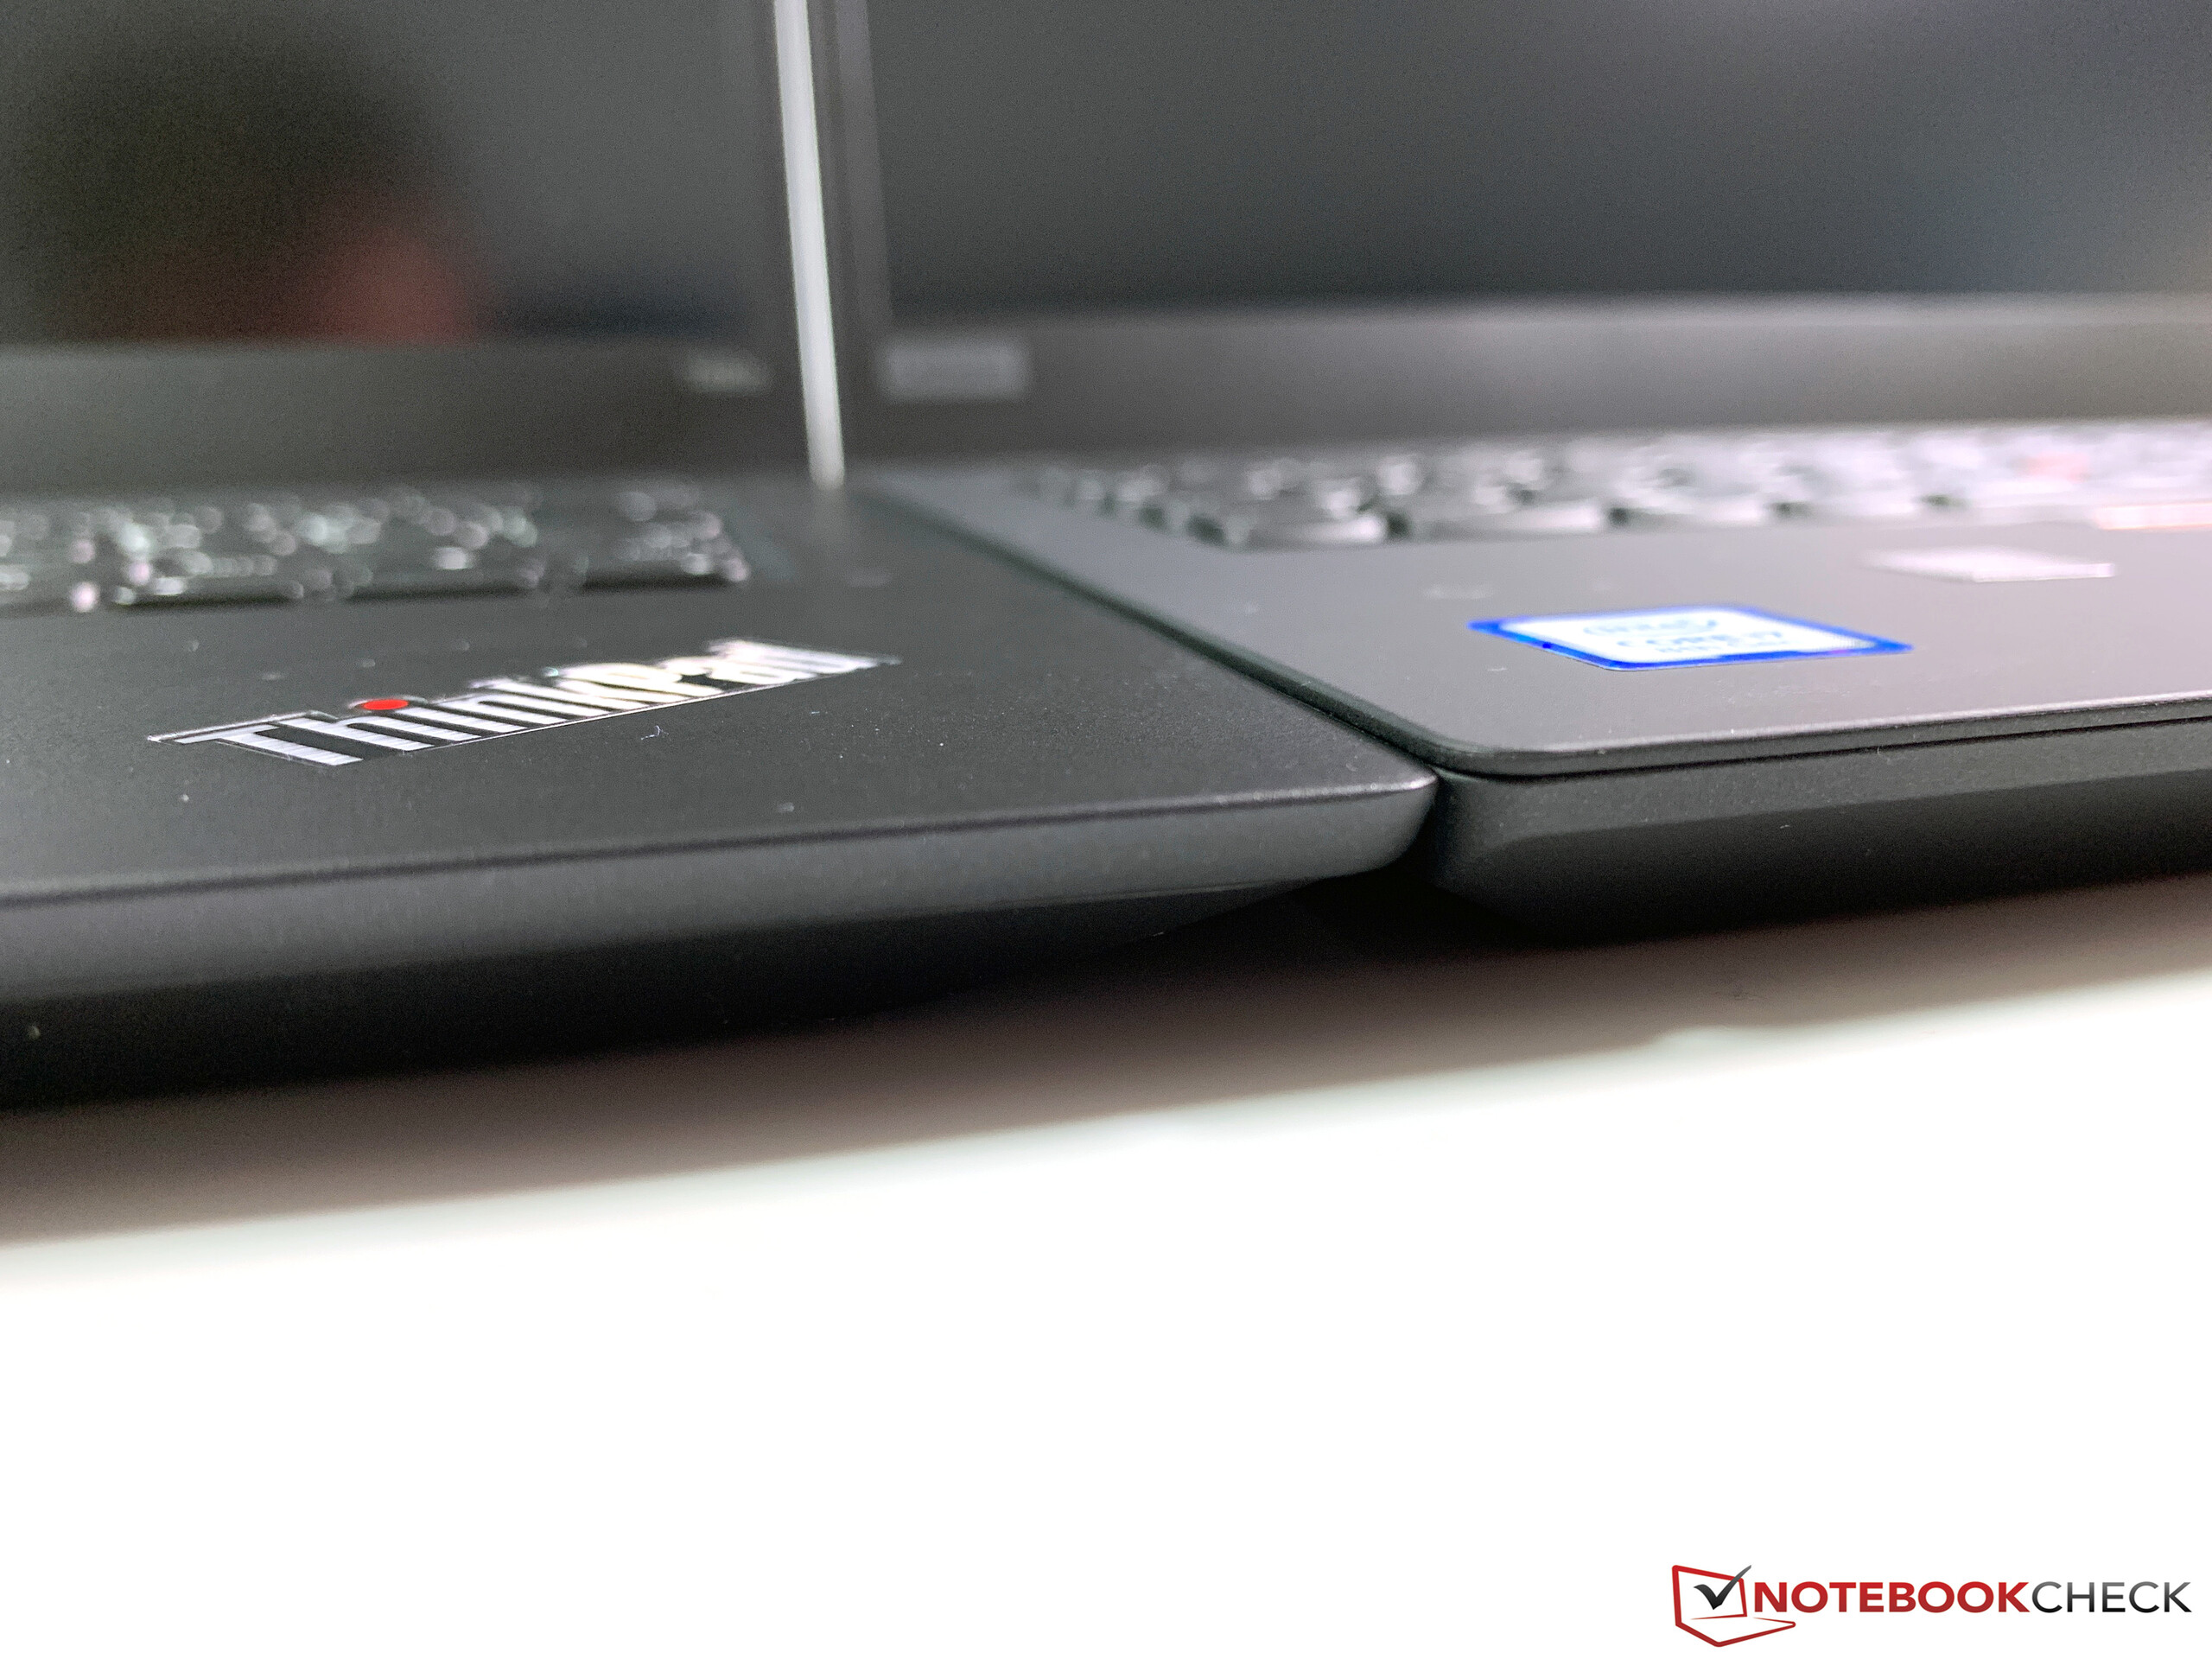
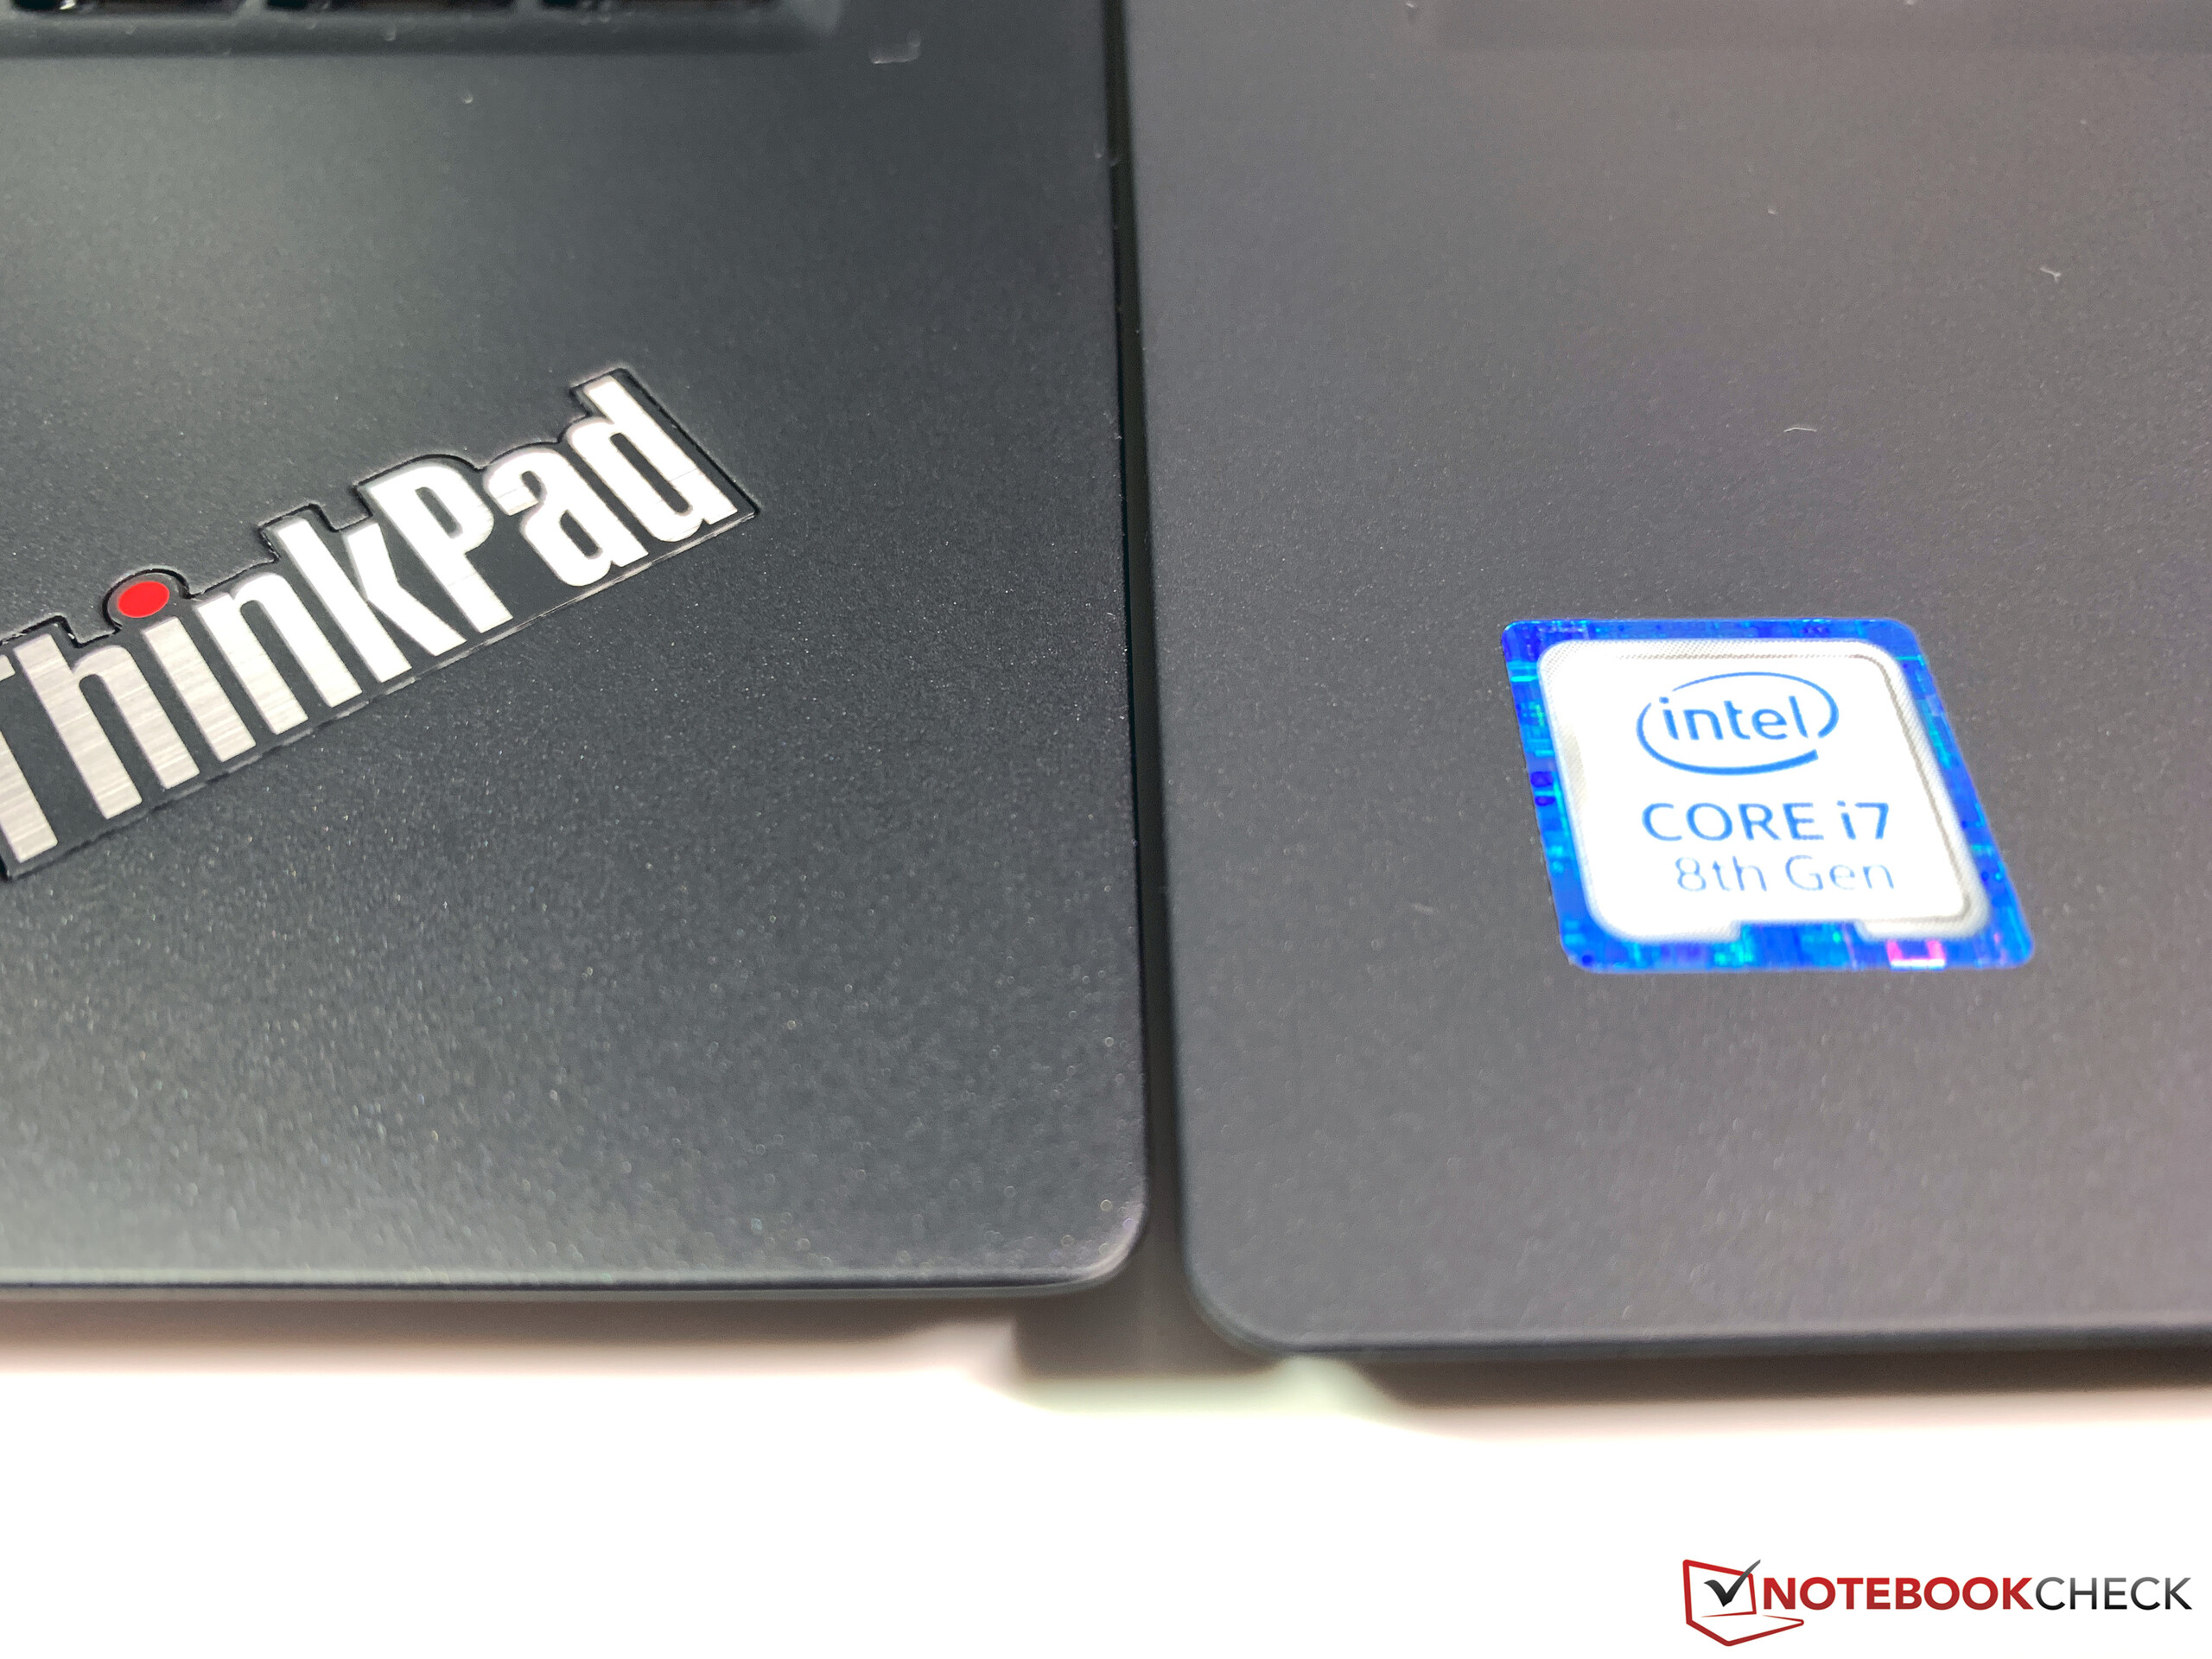
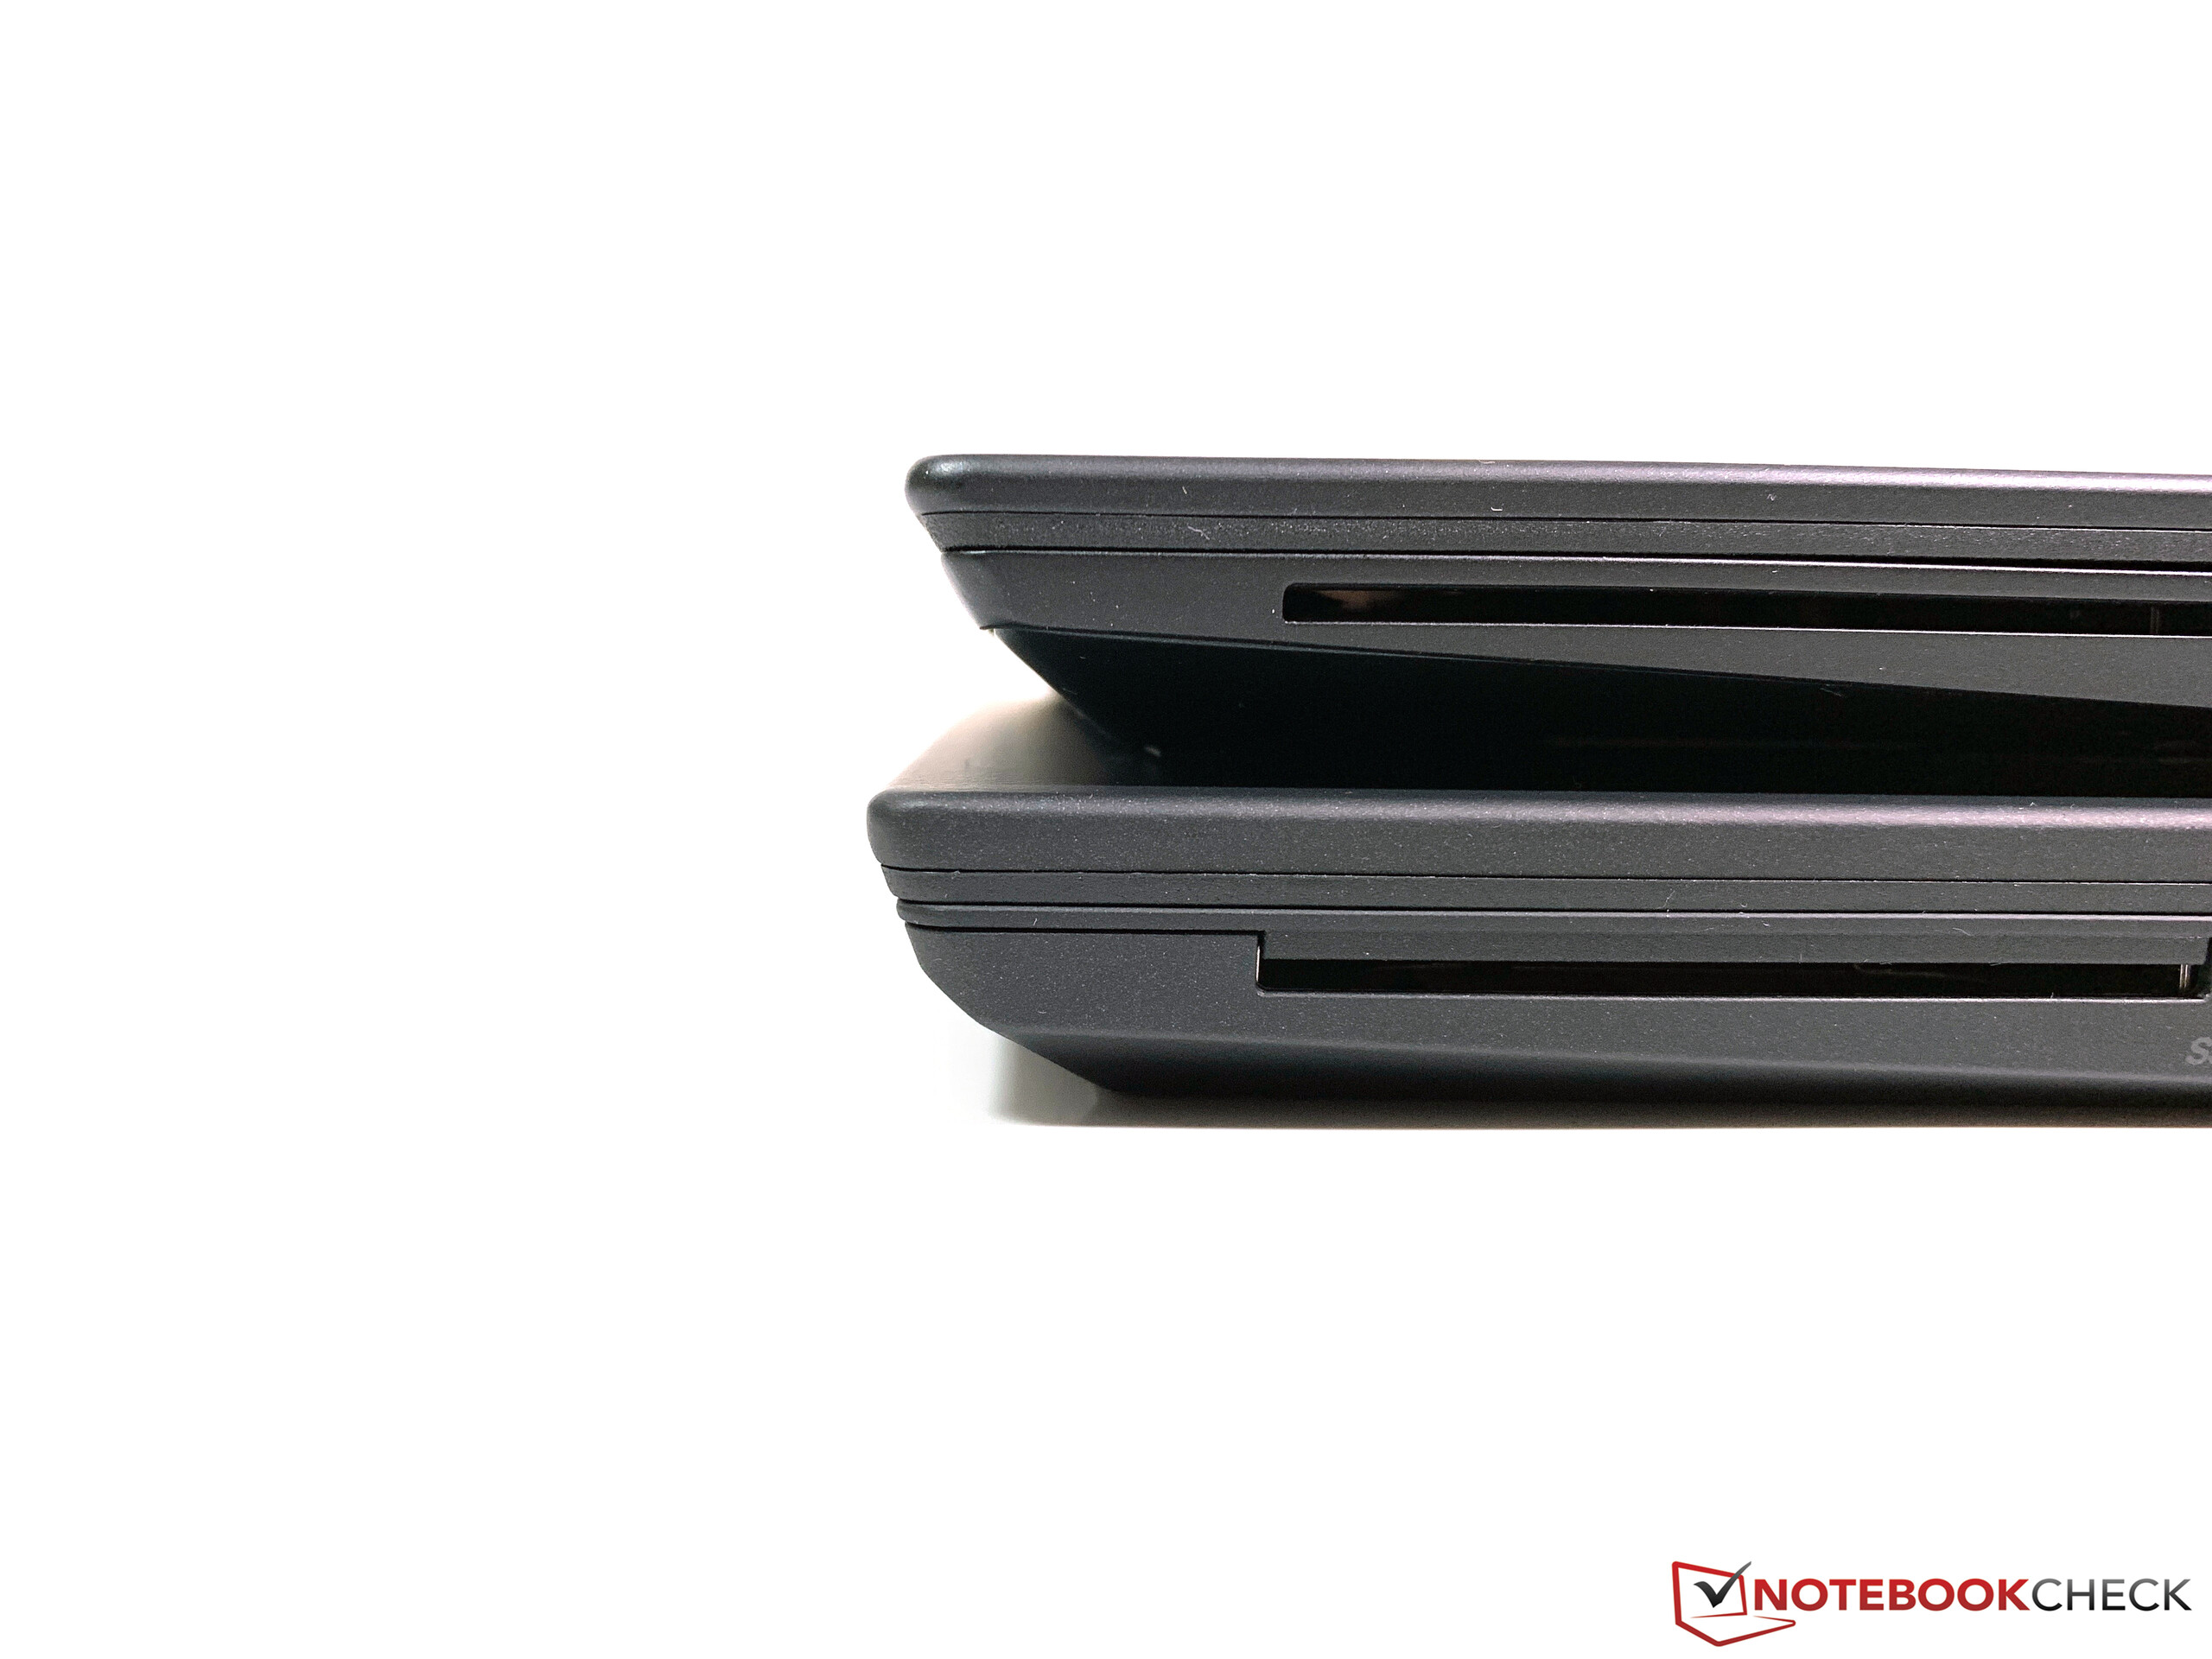
No passado, o modelo T4x0s era geralmente uma versão mais fina do T4x0 regular, que muitas vezes era equipado com componentes melhores e não ficava para trás em termos de desempenho. Isto muda com o novo T490s. Sim, o novo chassis é um sucesso e a qualidade também está um passo acima do T490 normal, mas o T490 fica para trás no departamento de desempenho. Isso obviamente inclui o adaptador gráfico, porque não há mais dGPU, mas também o desempenho do processador. Este último sofre com a solução de resfriamento menos potente e até mesmo o antecessor era um pouco mais rápido.
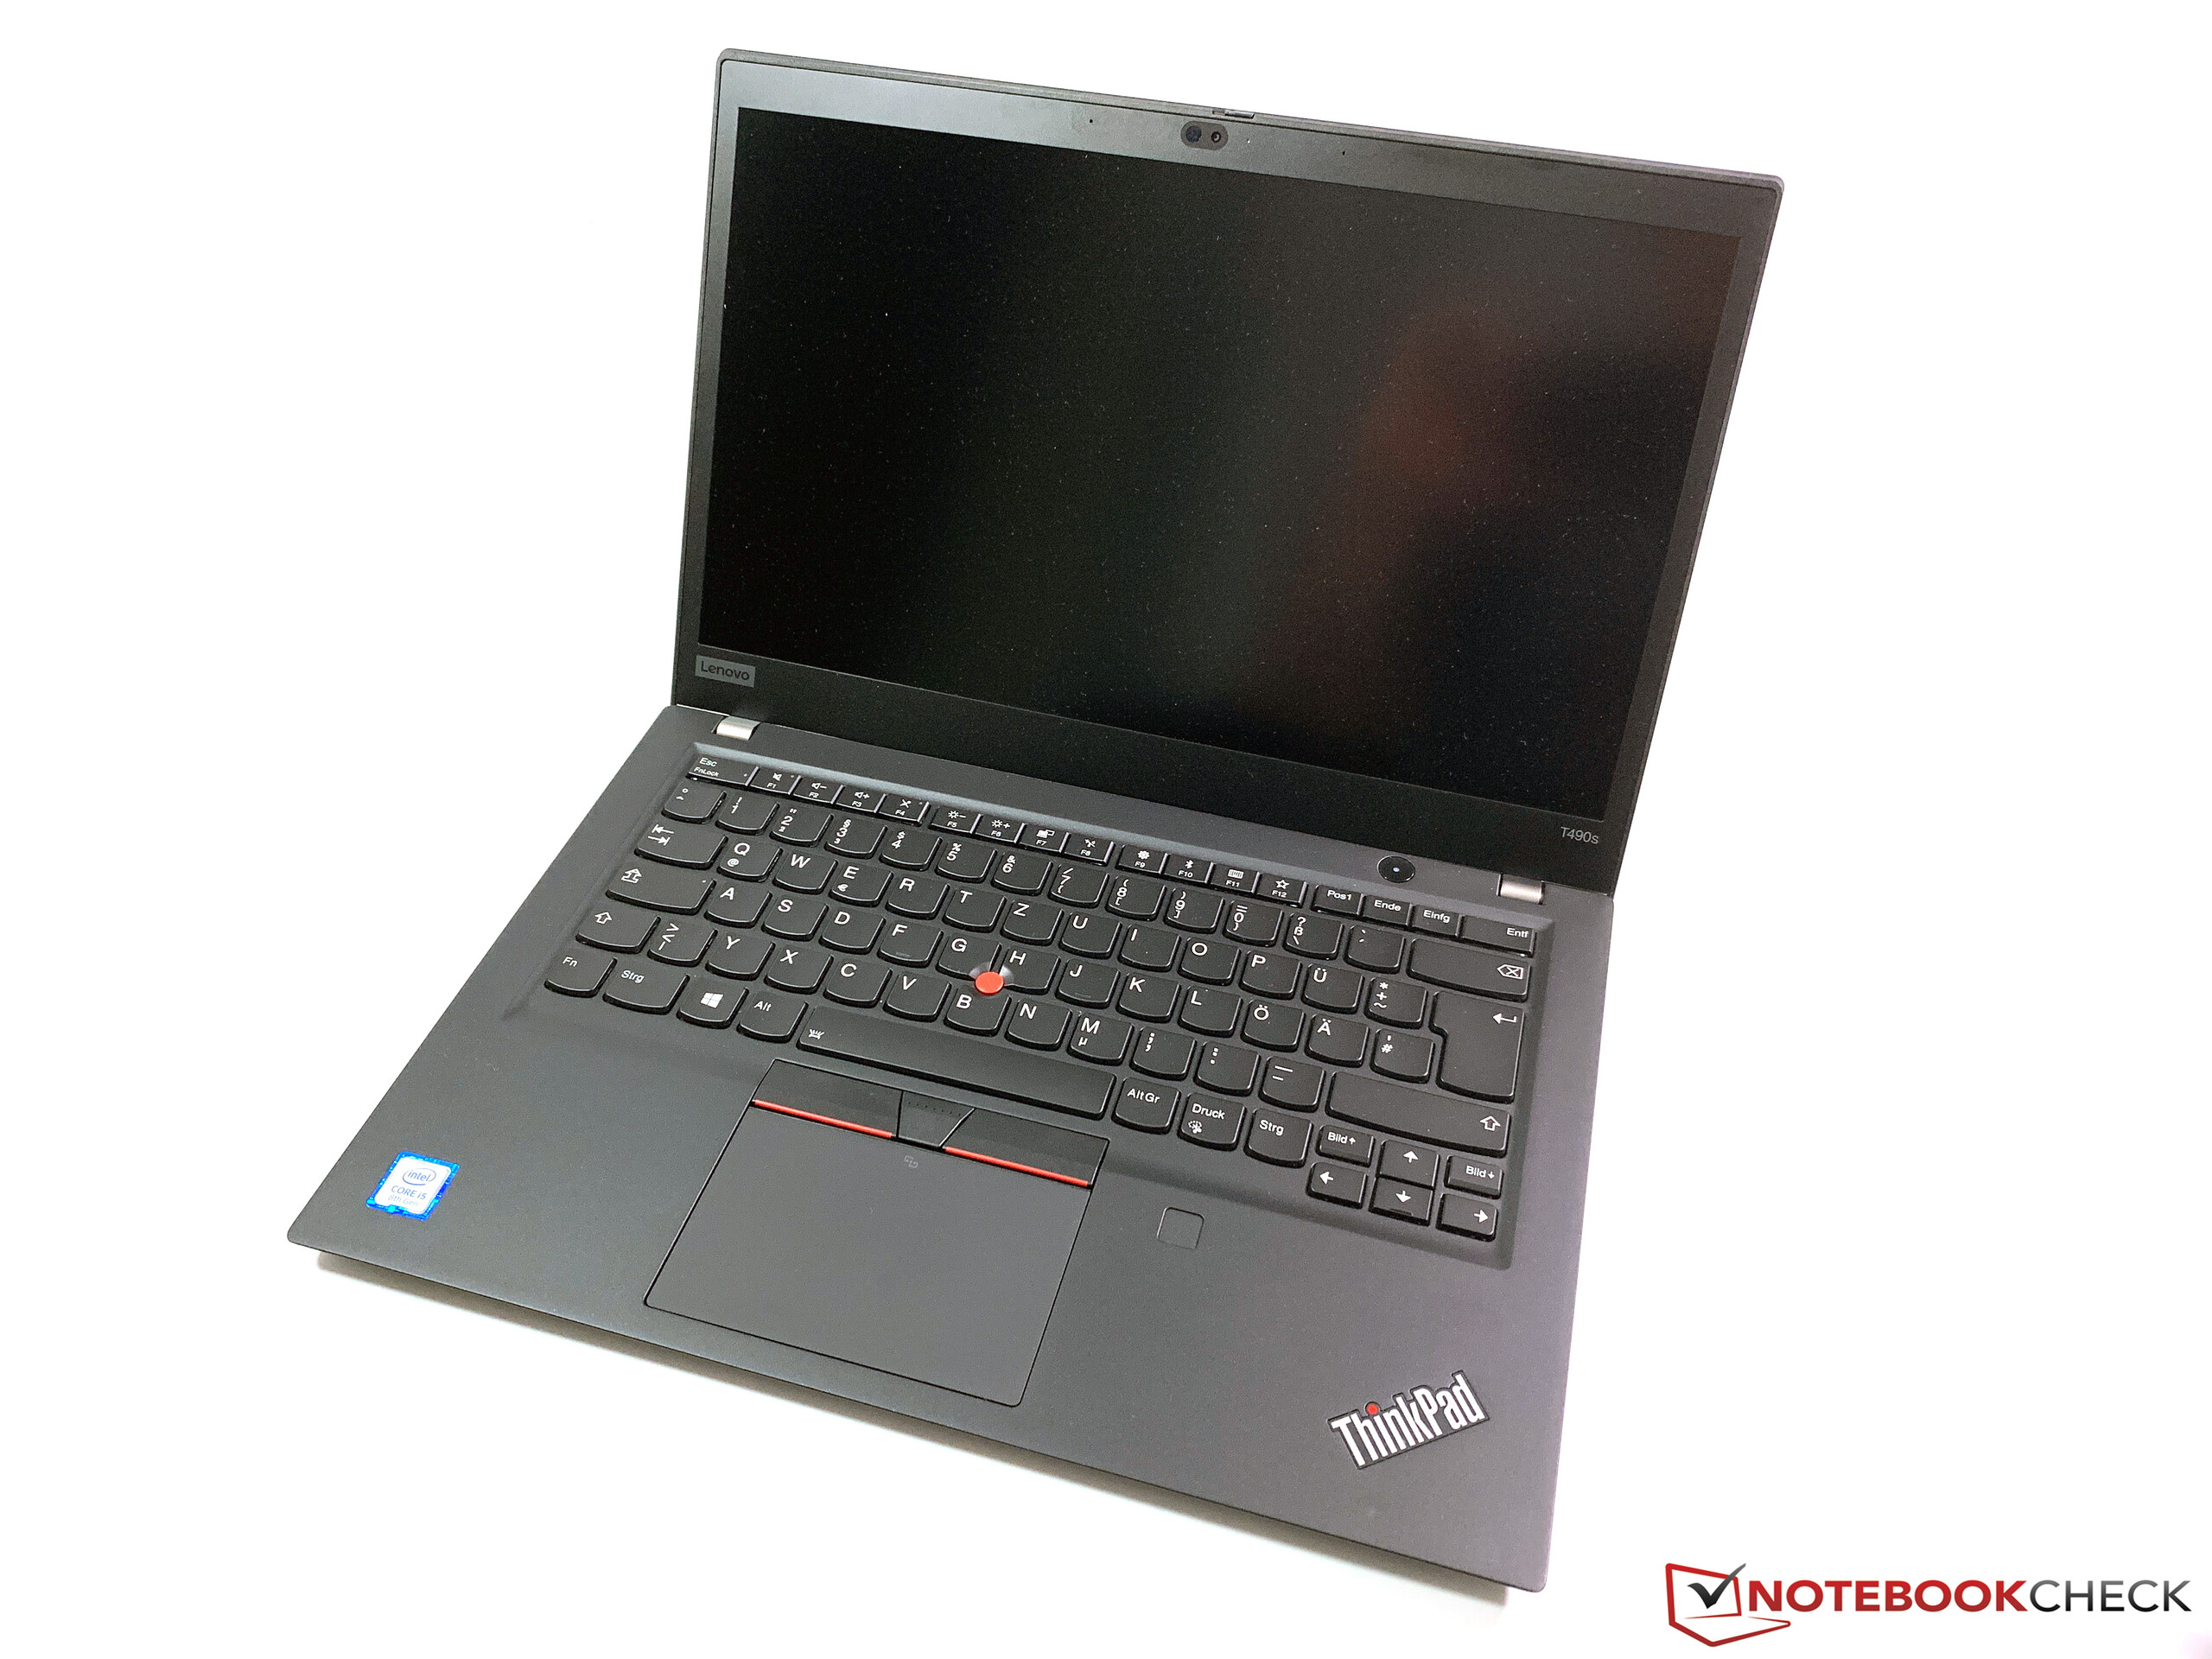
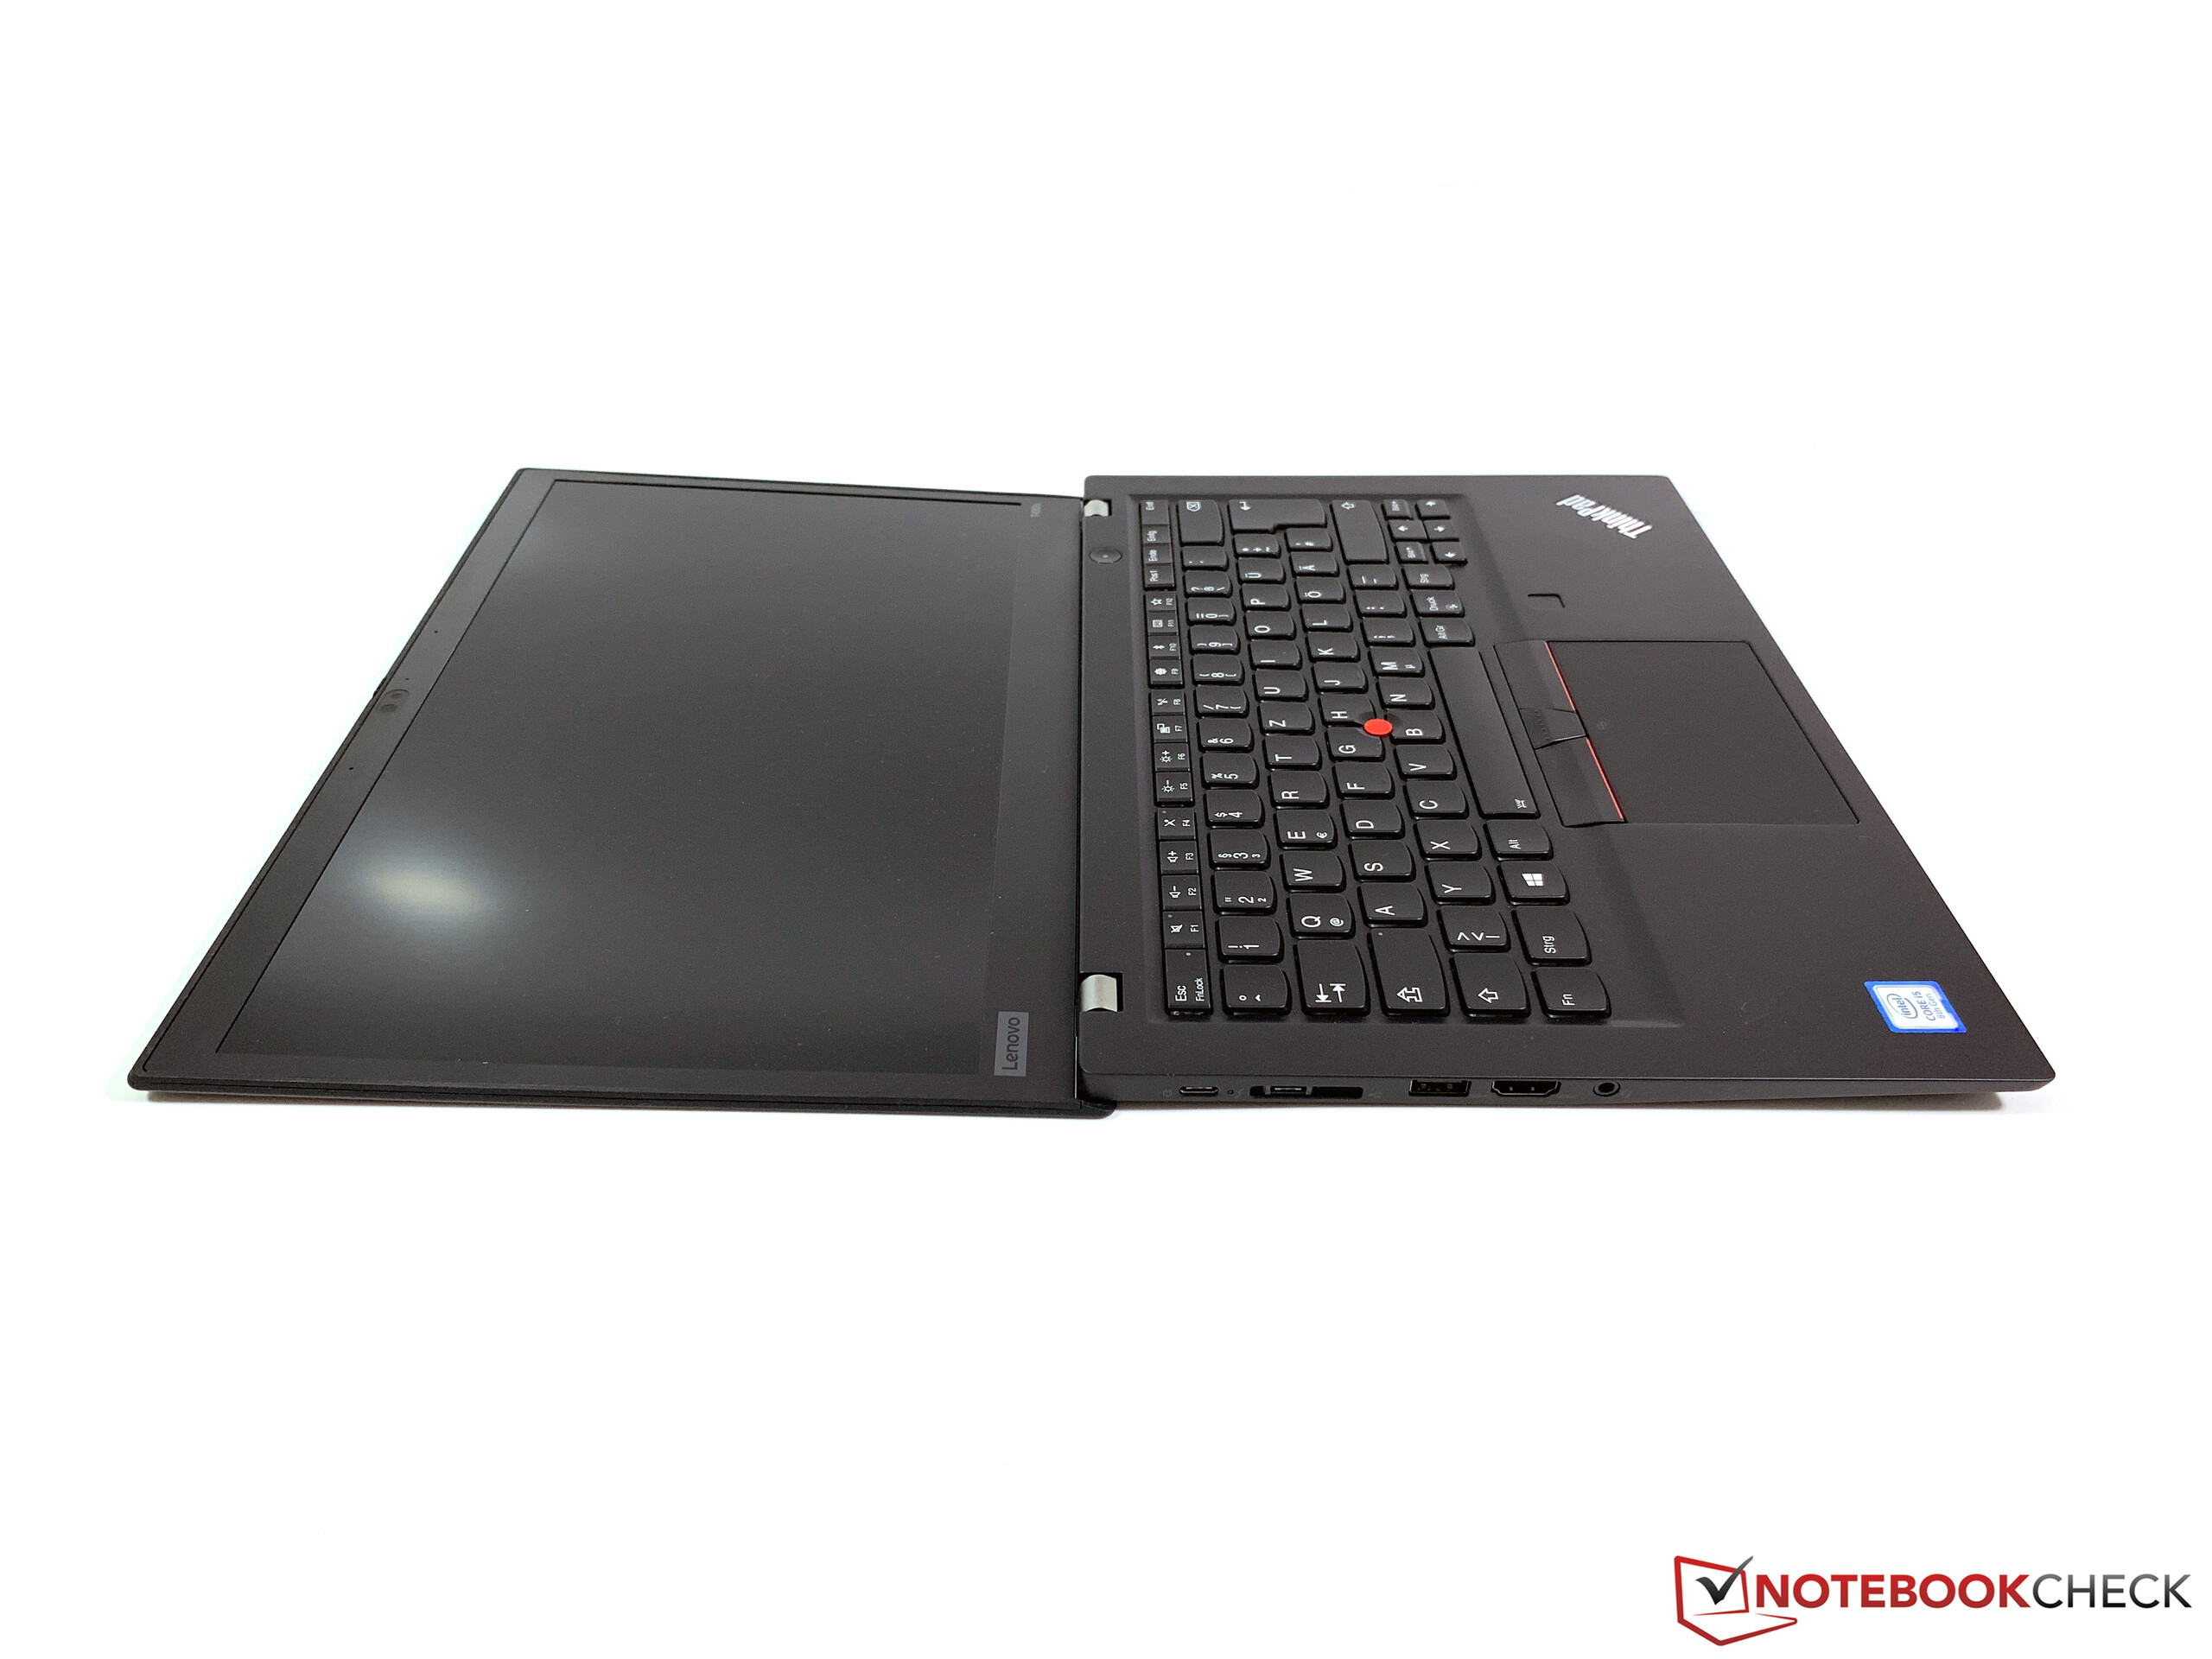
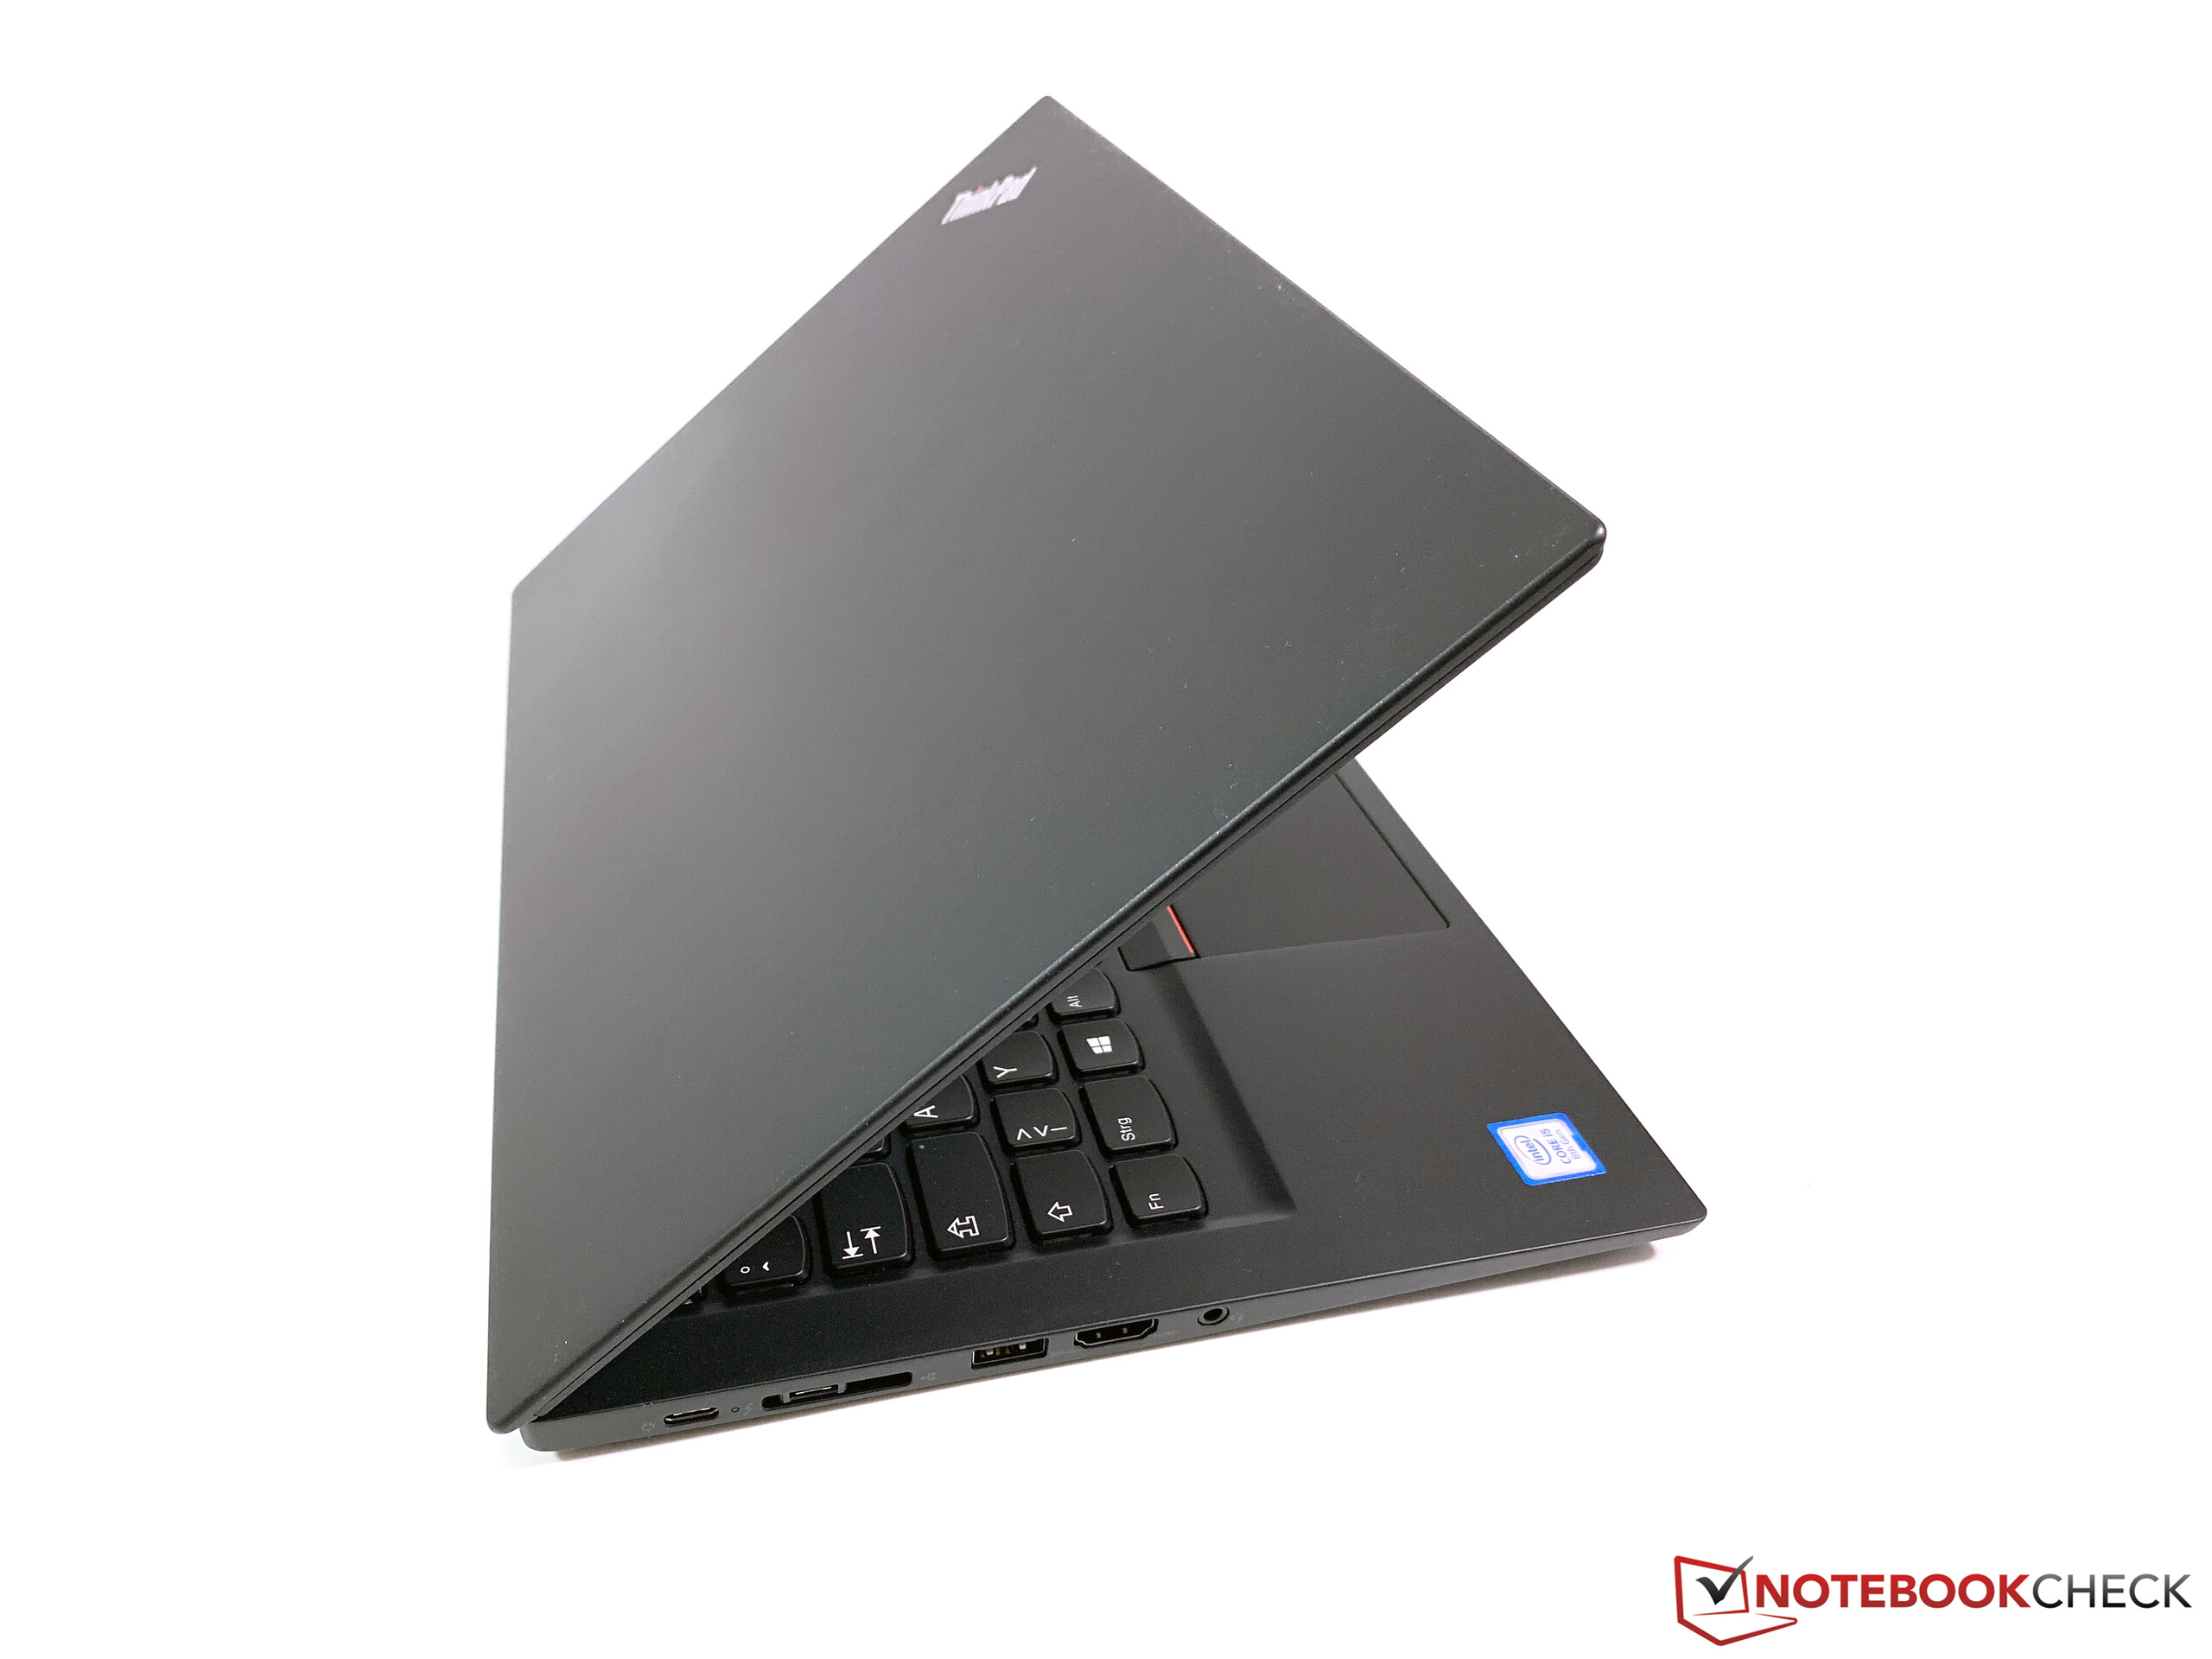
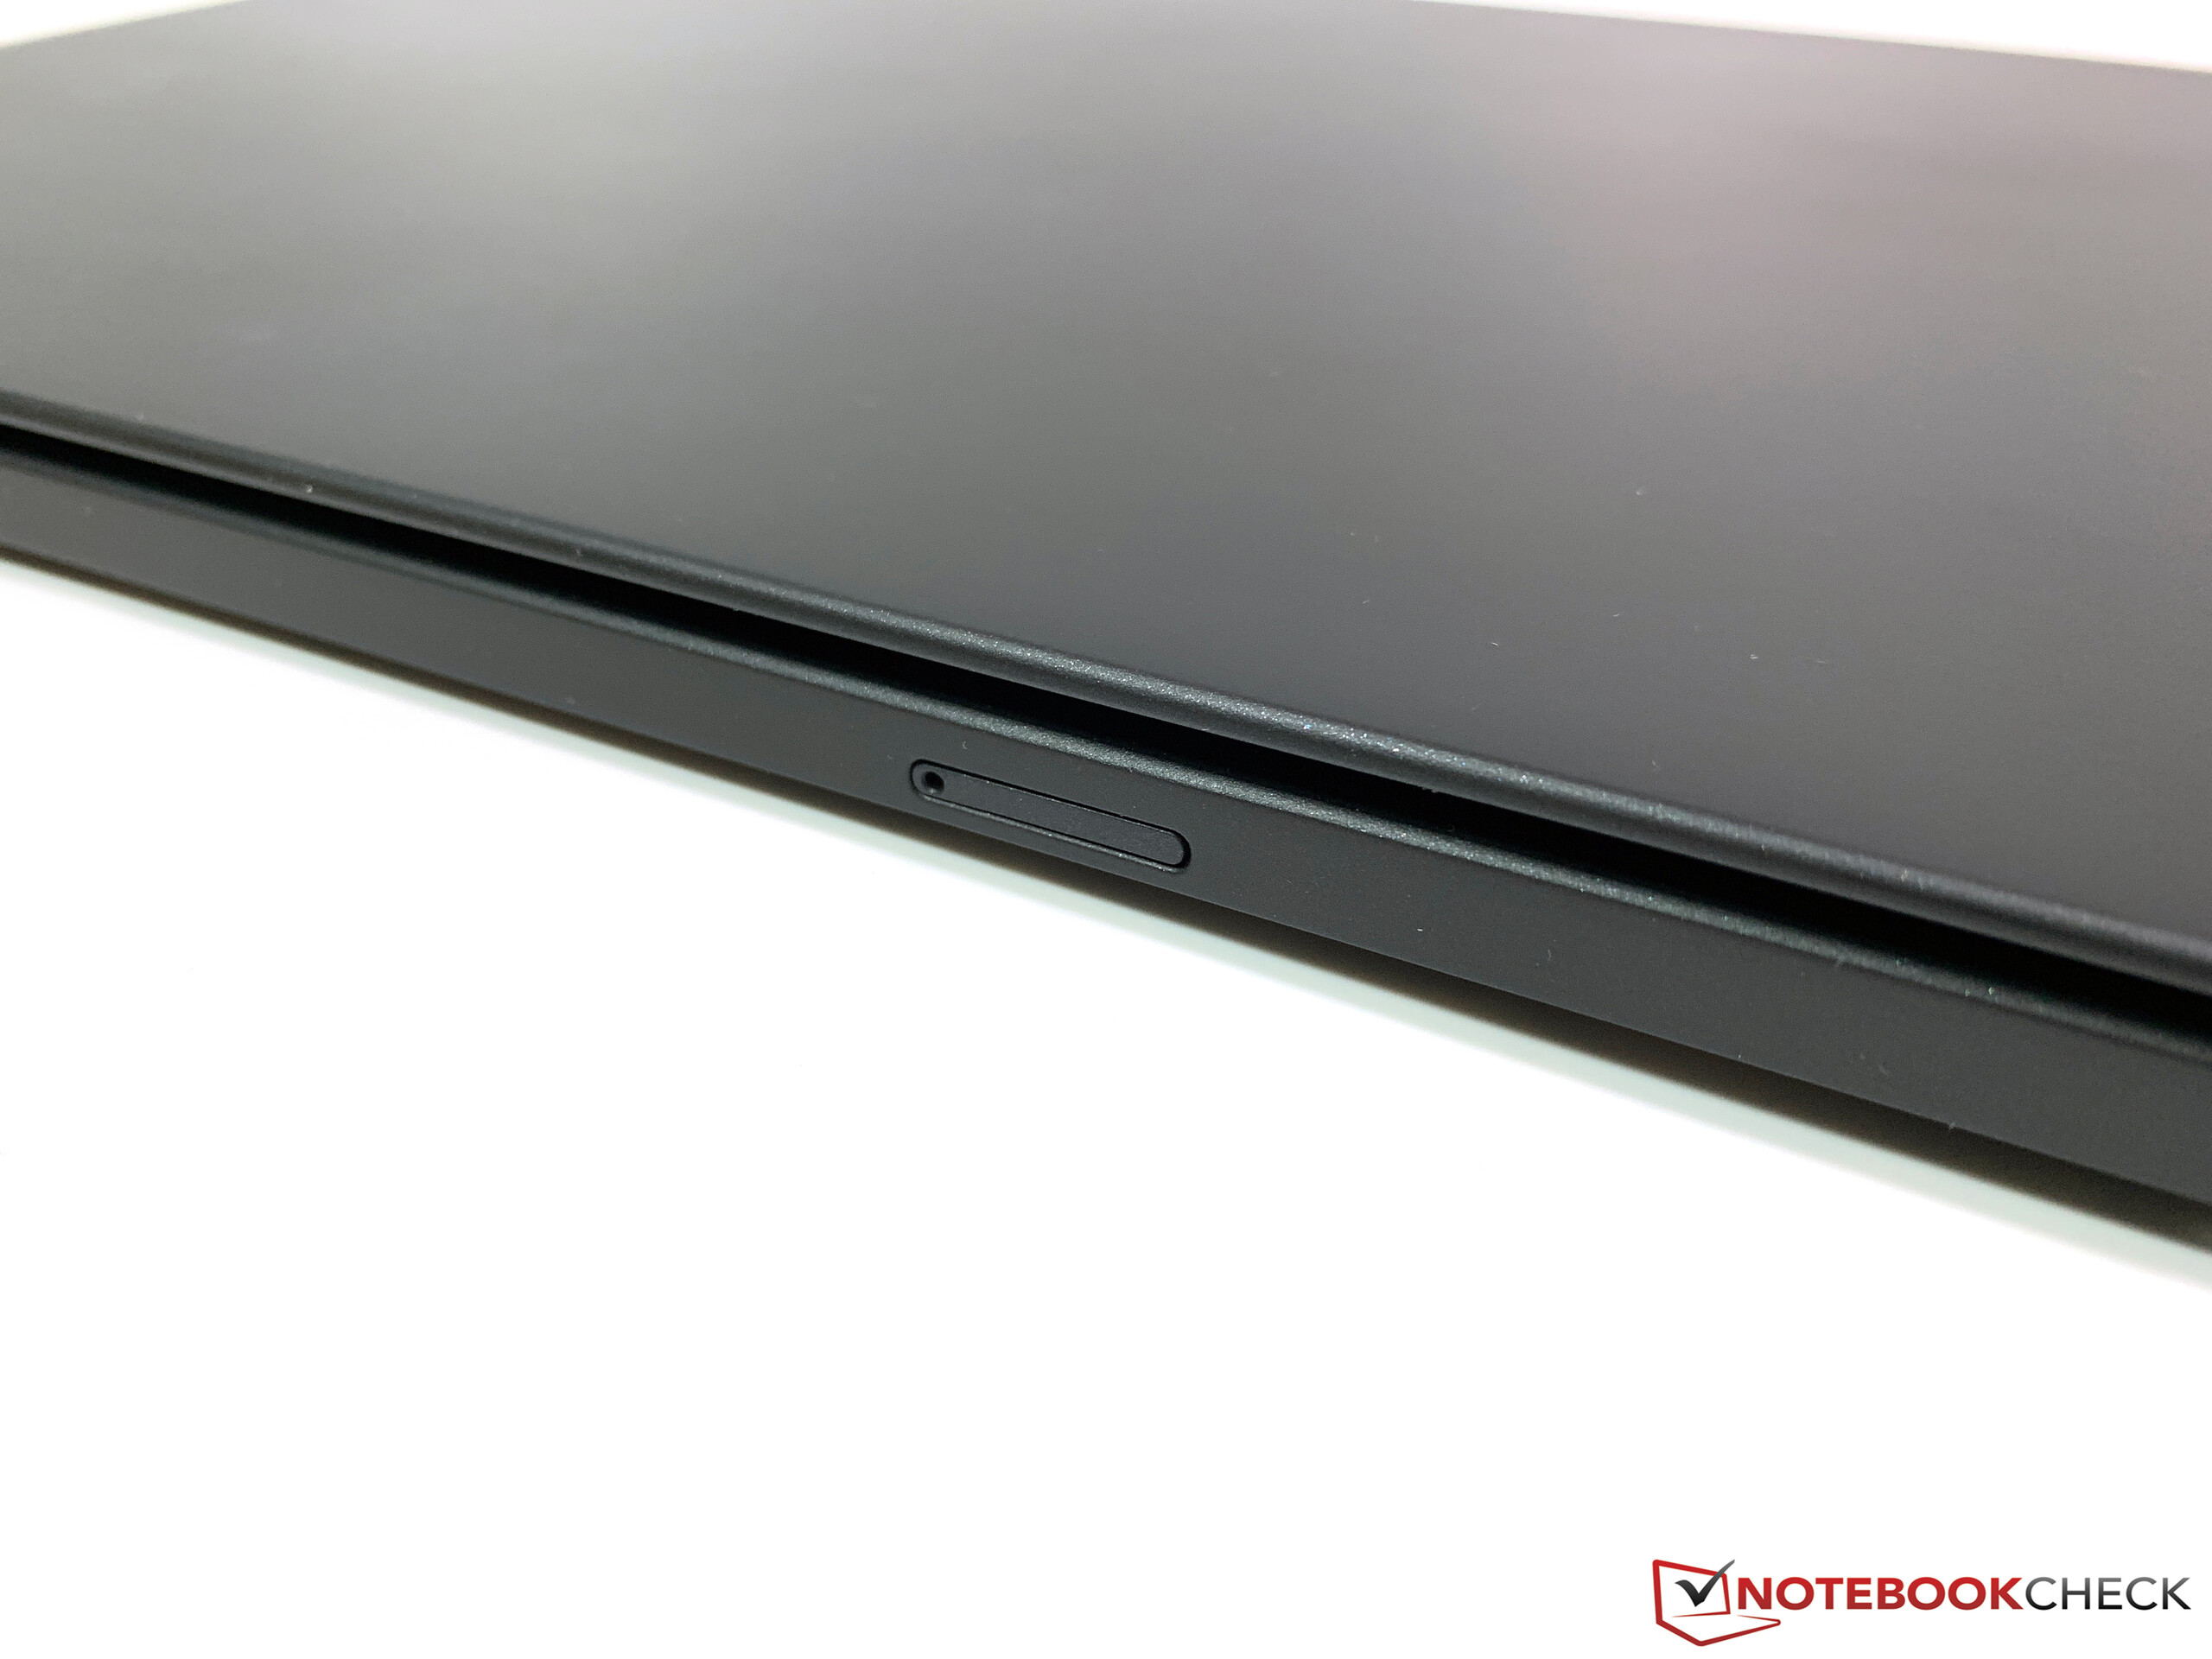
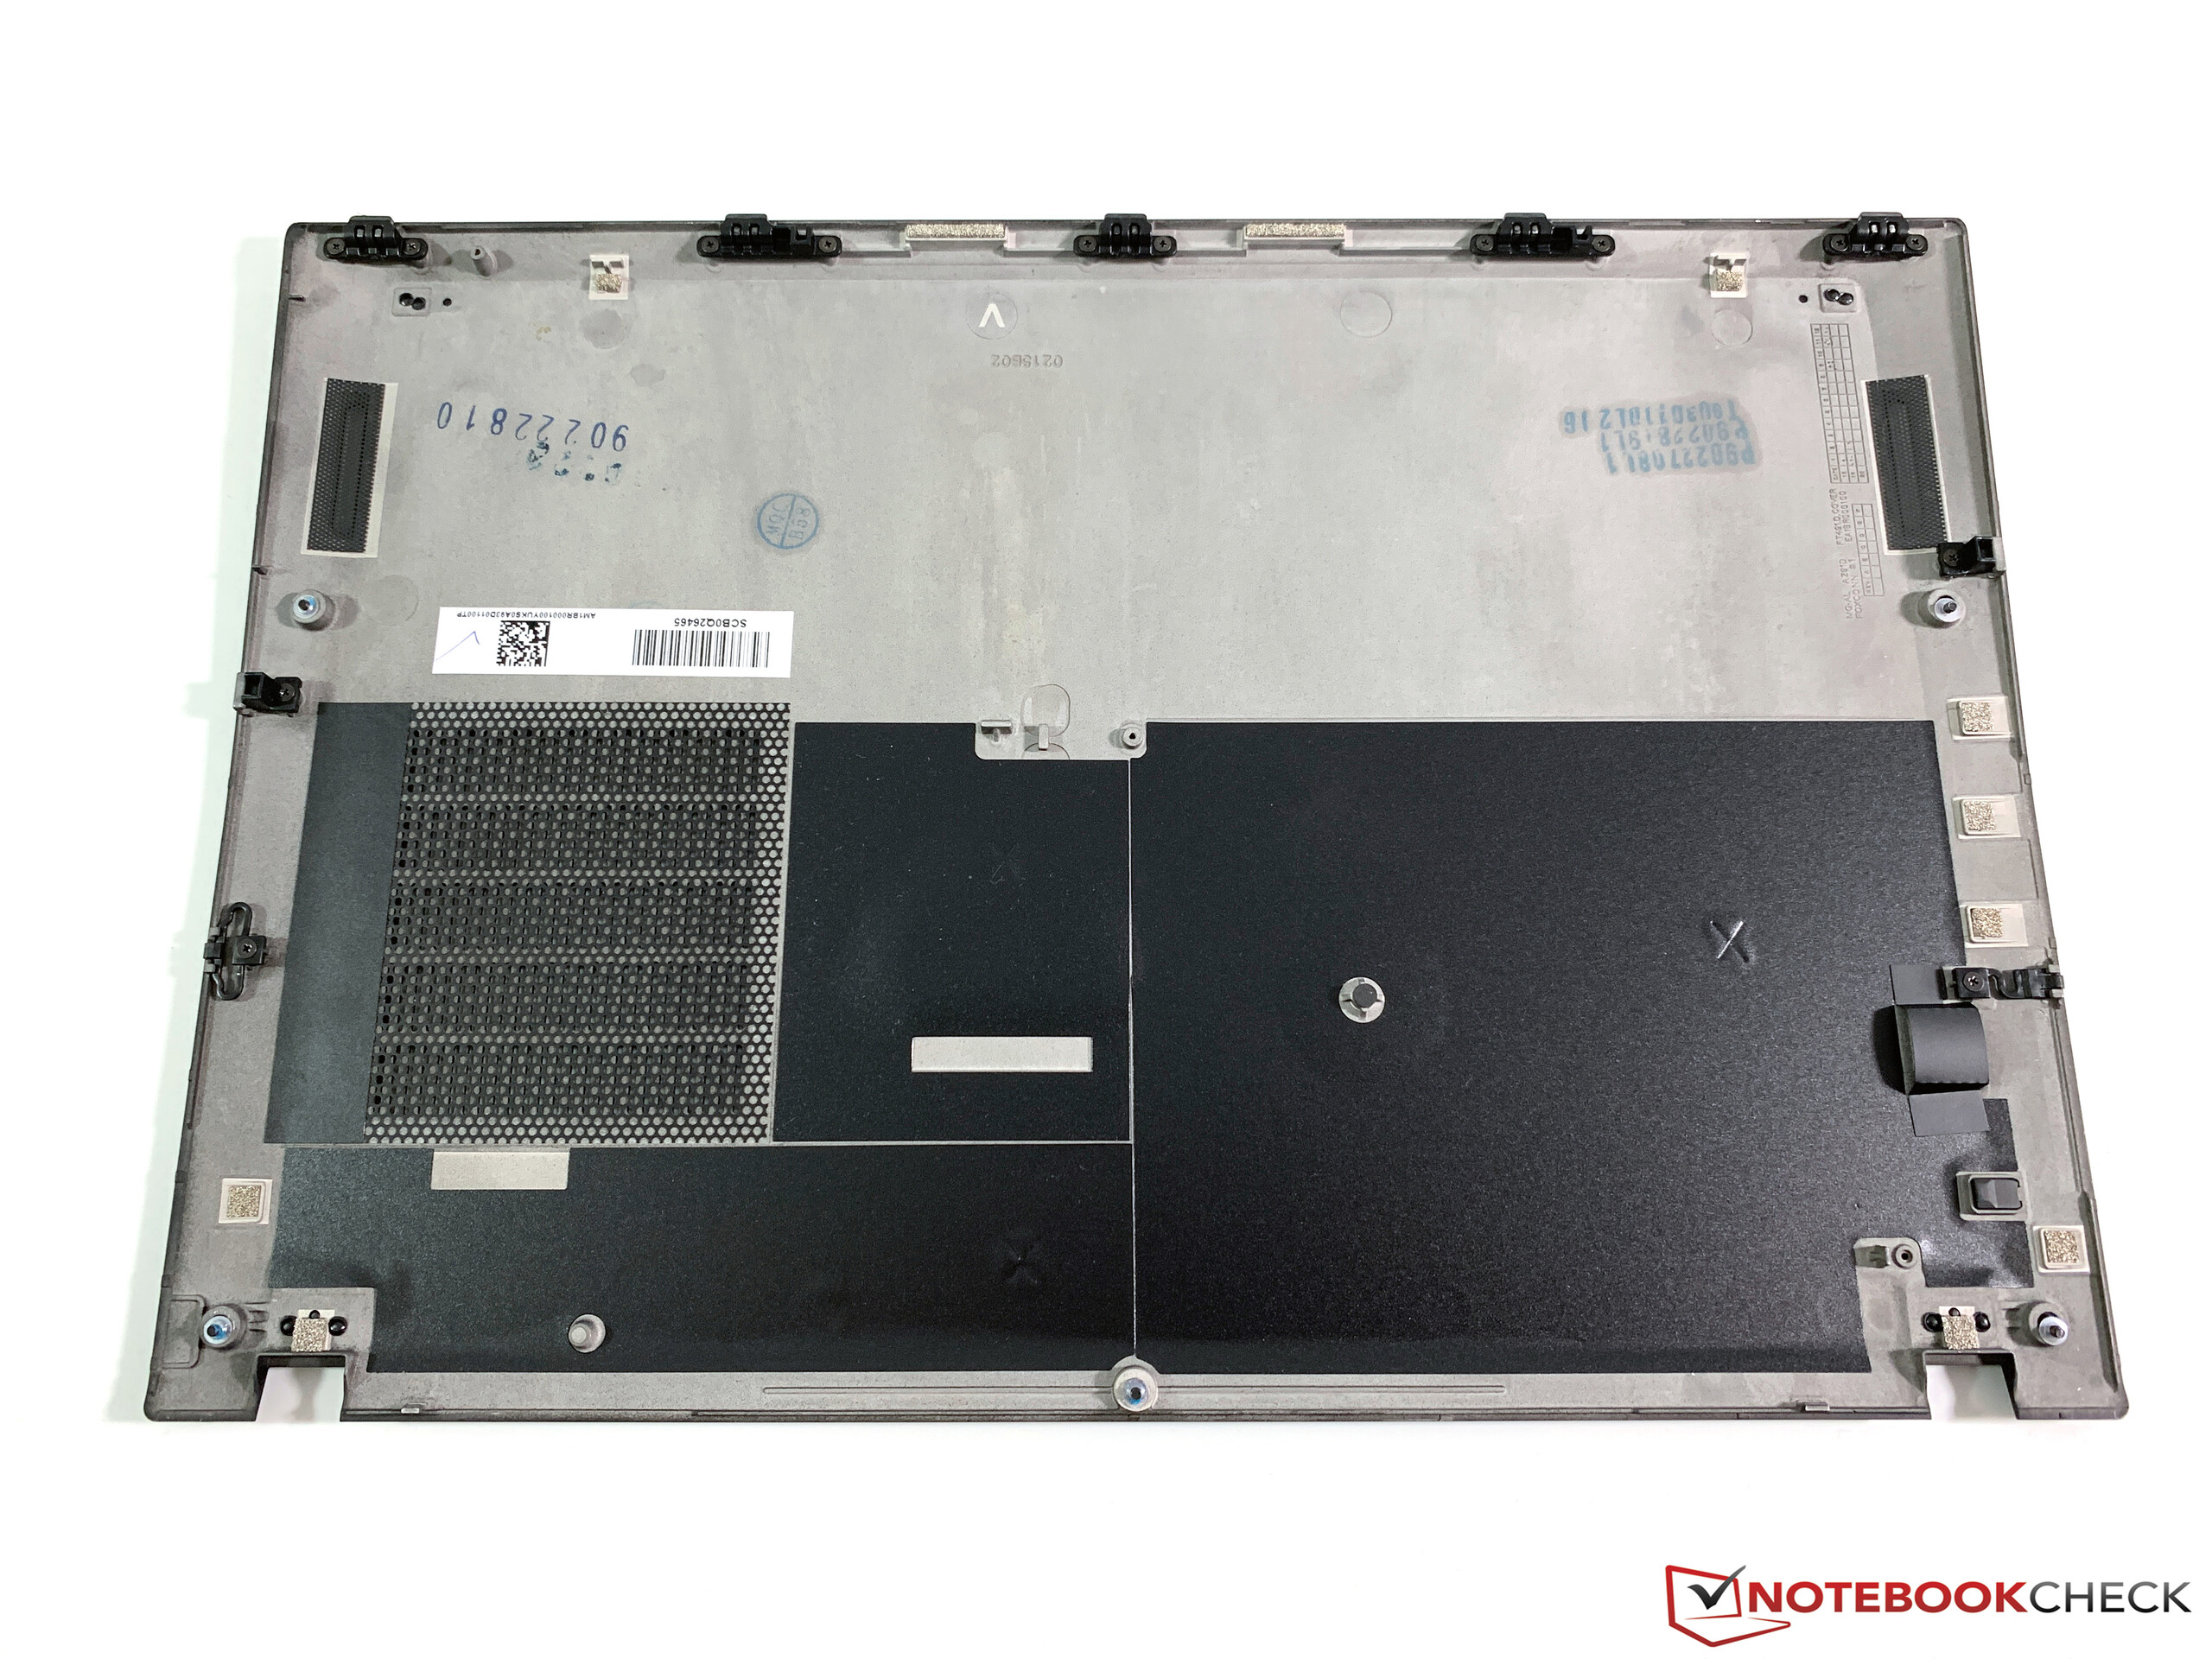
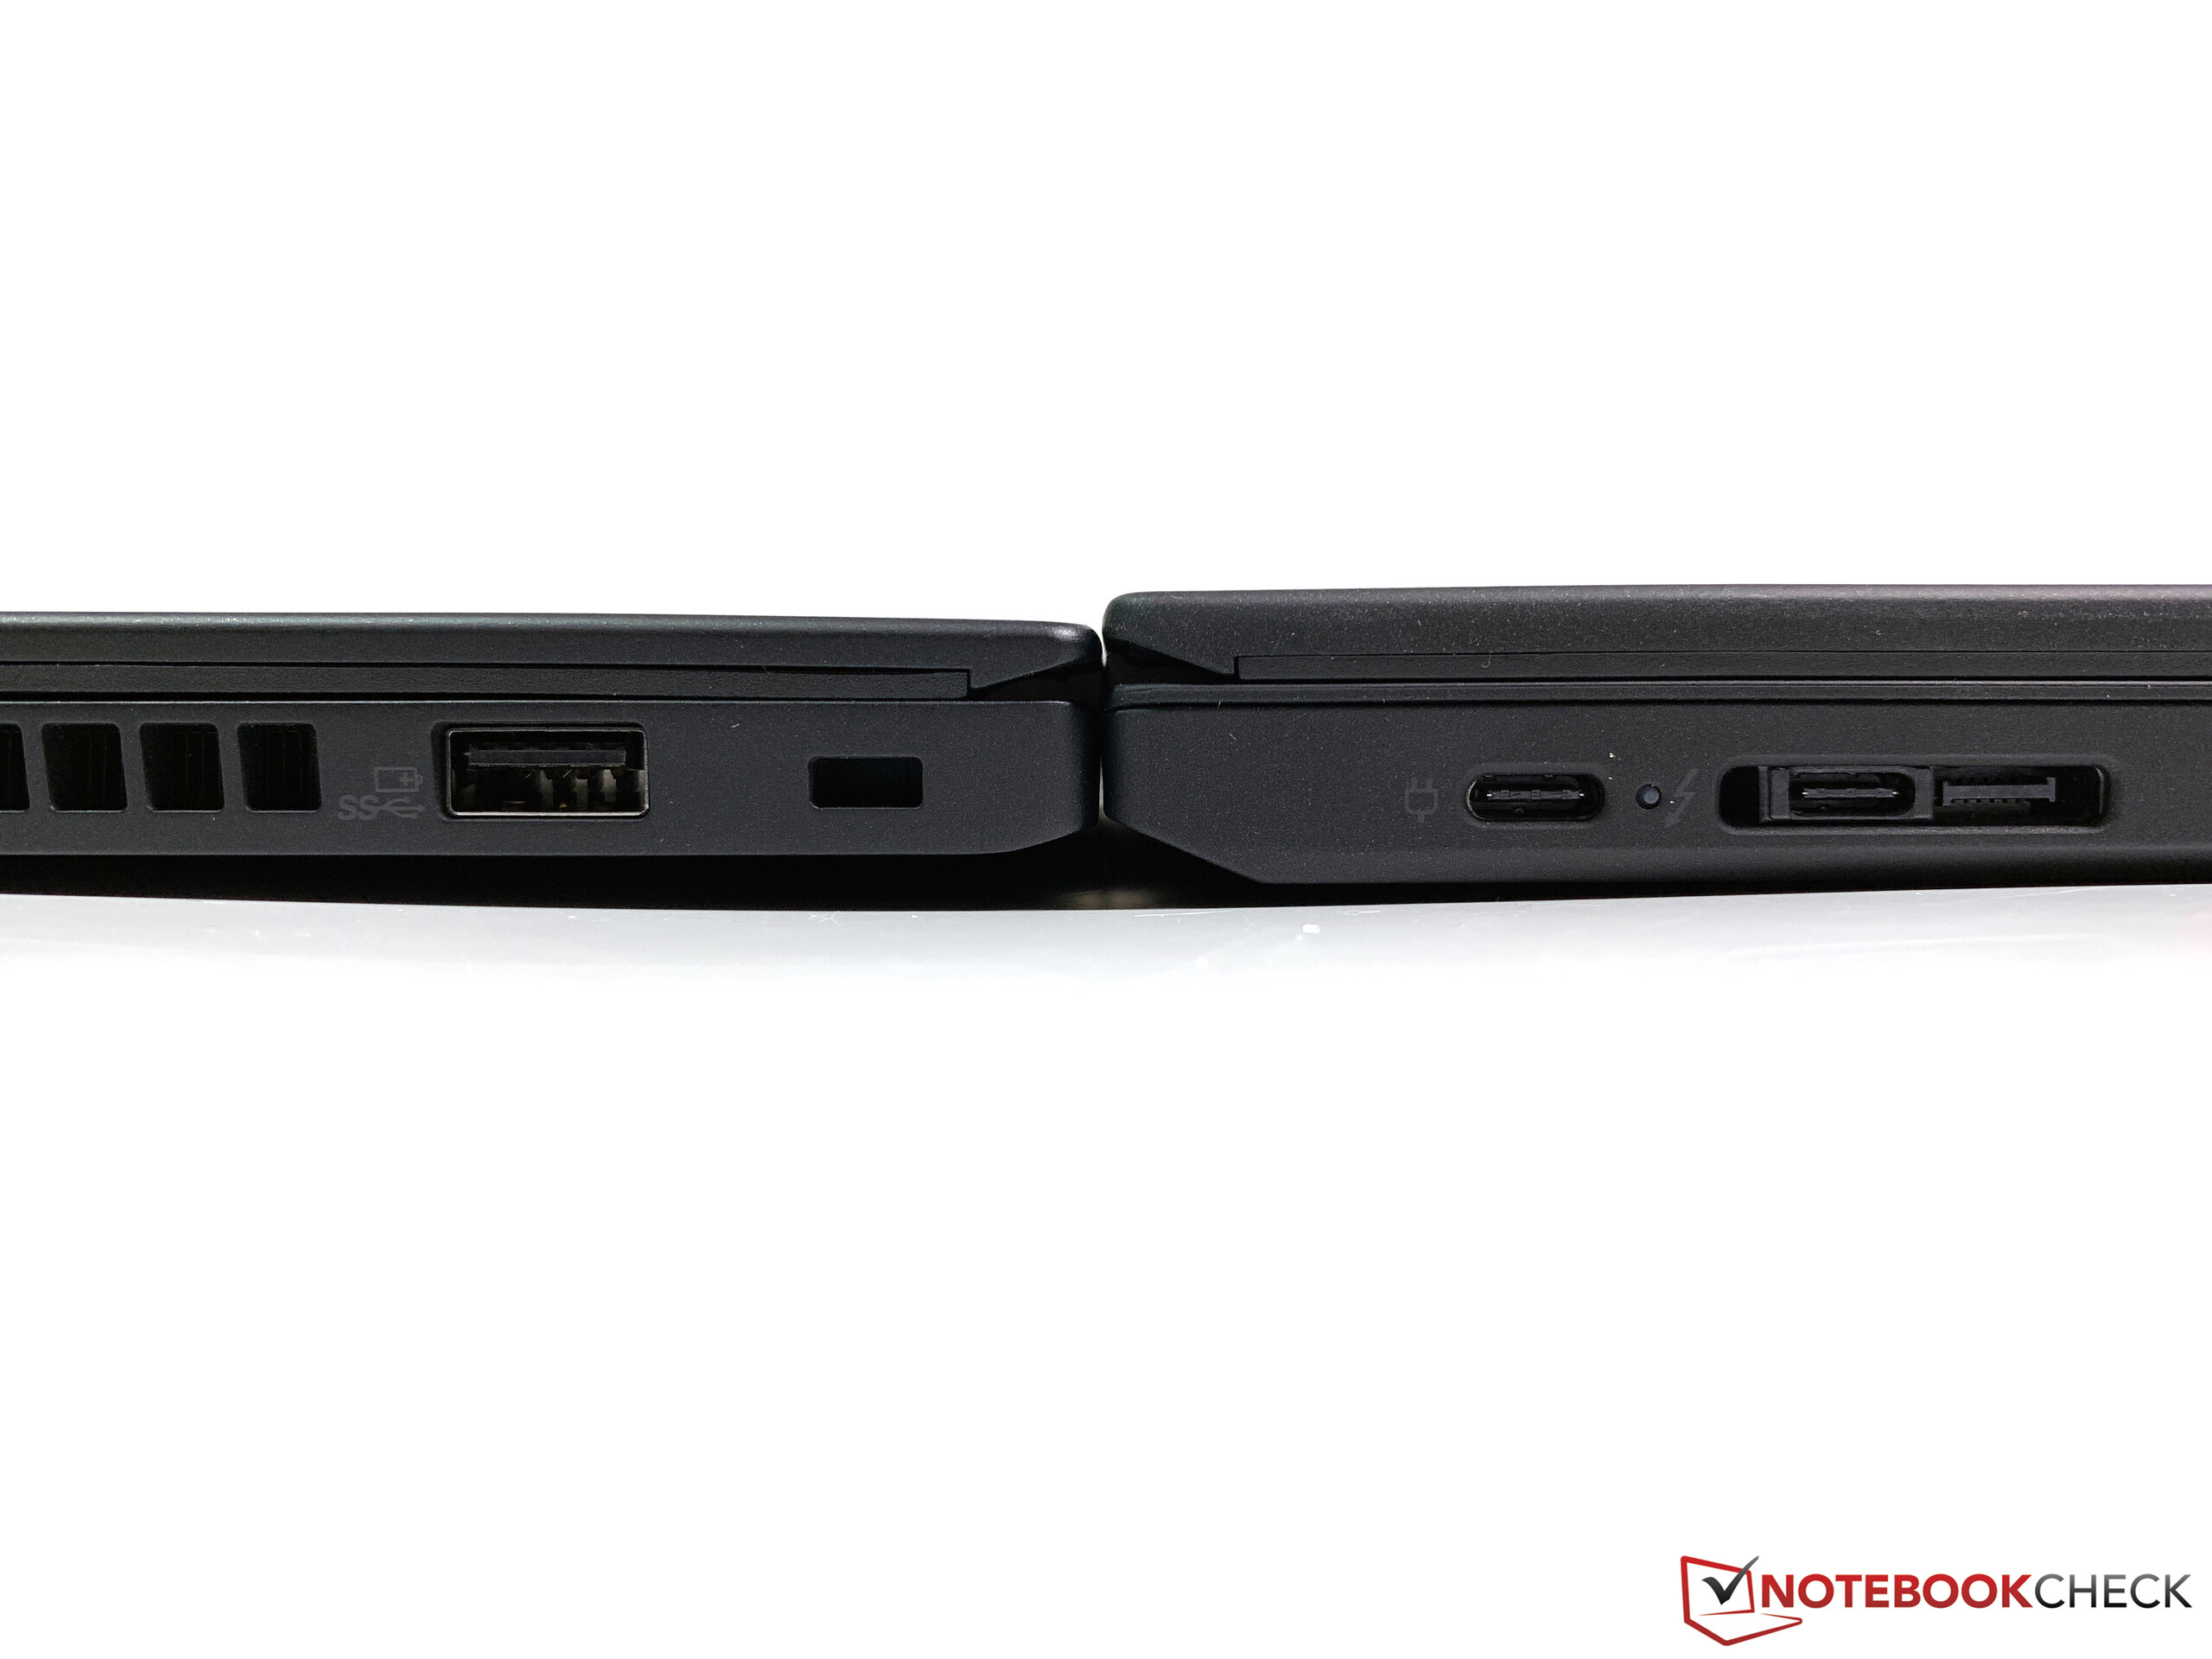
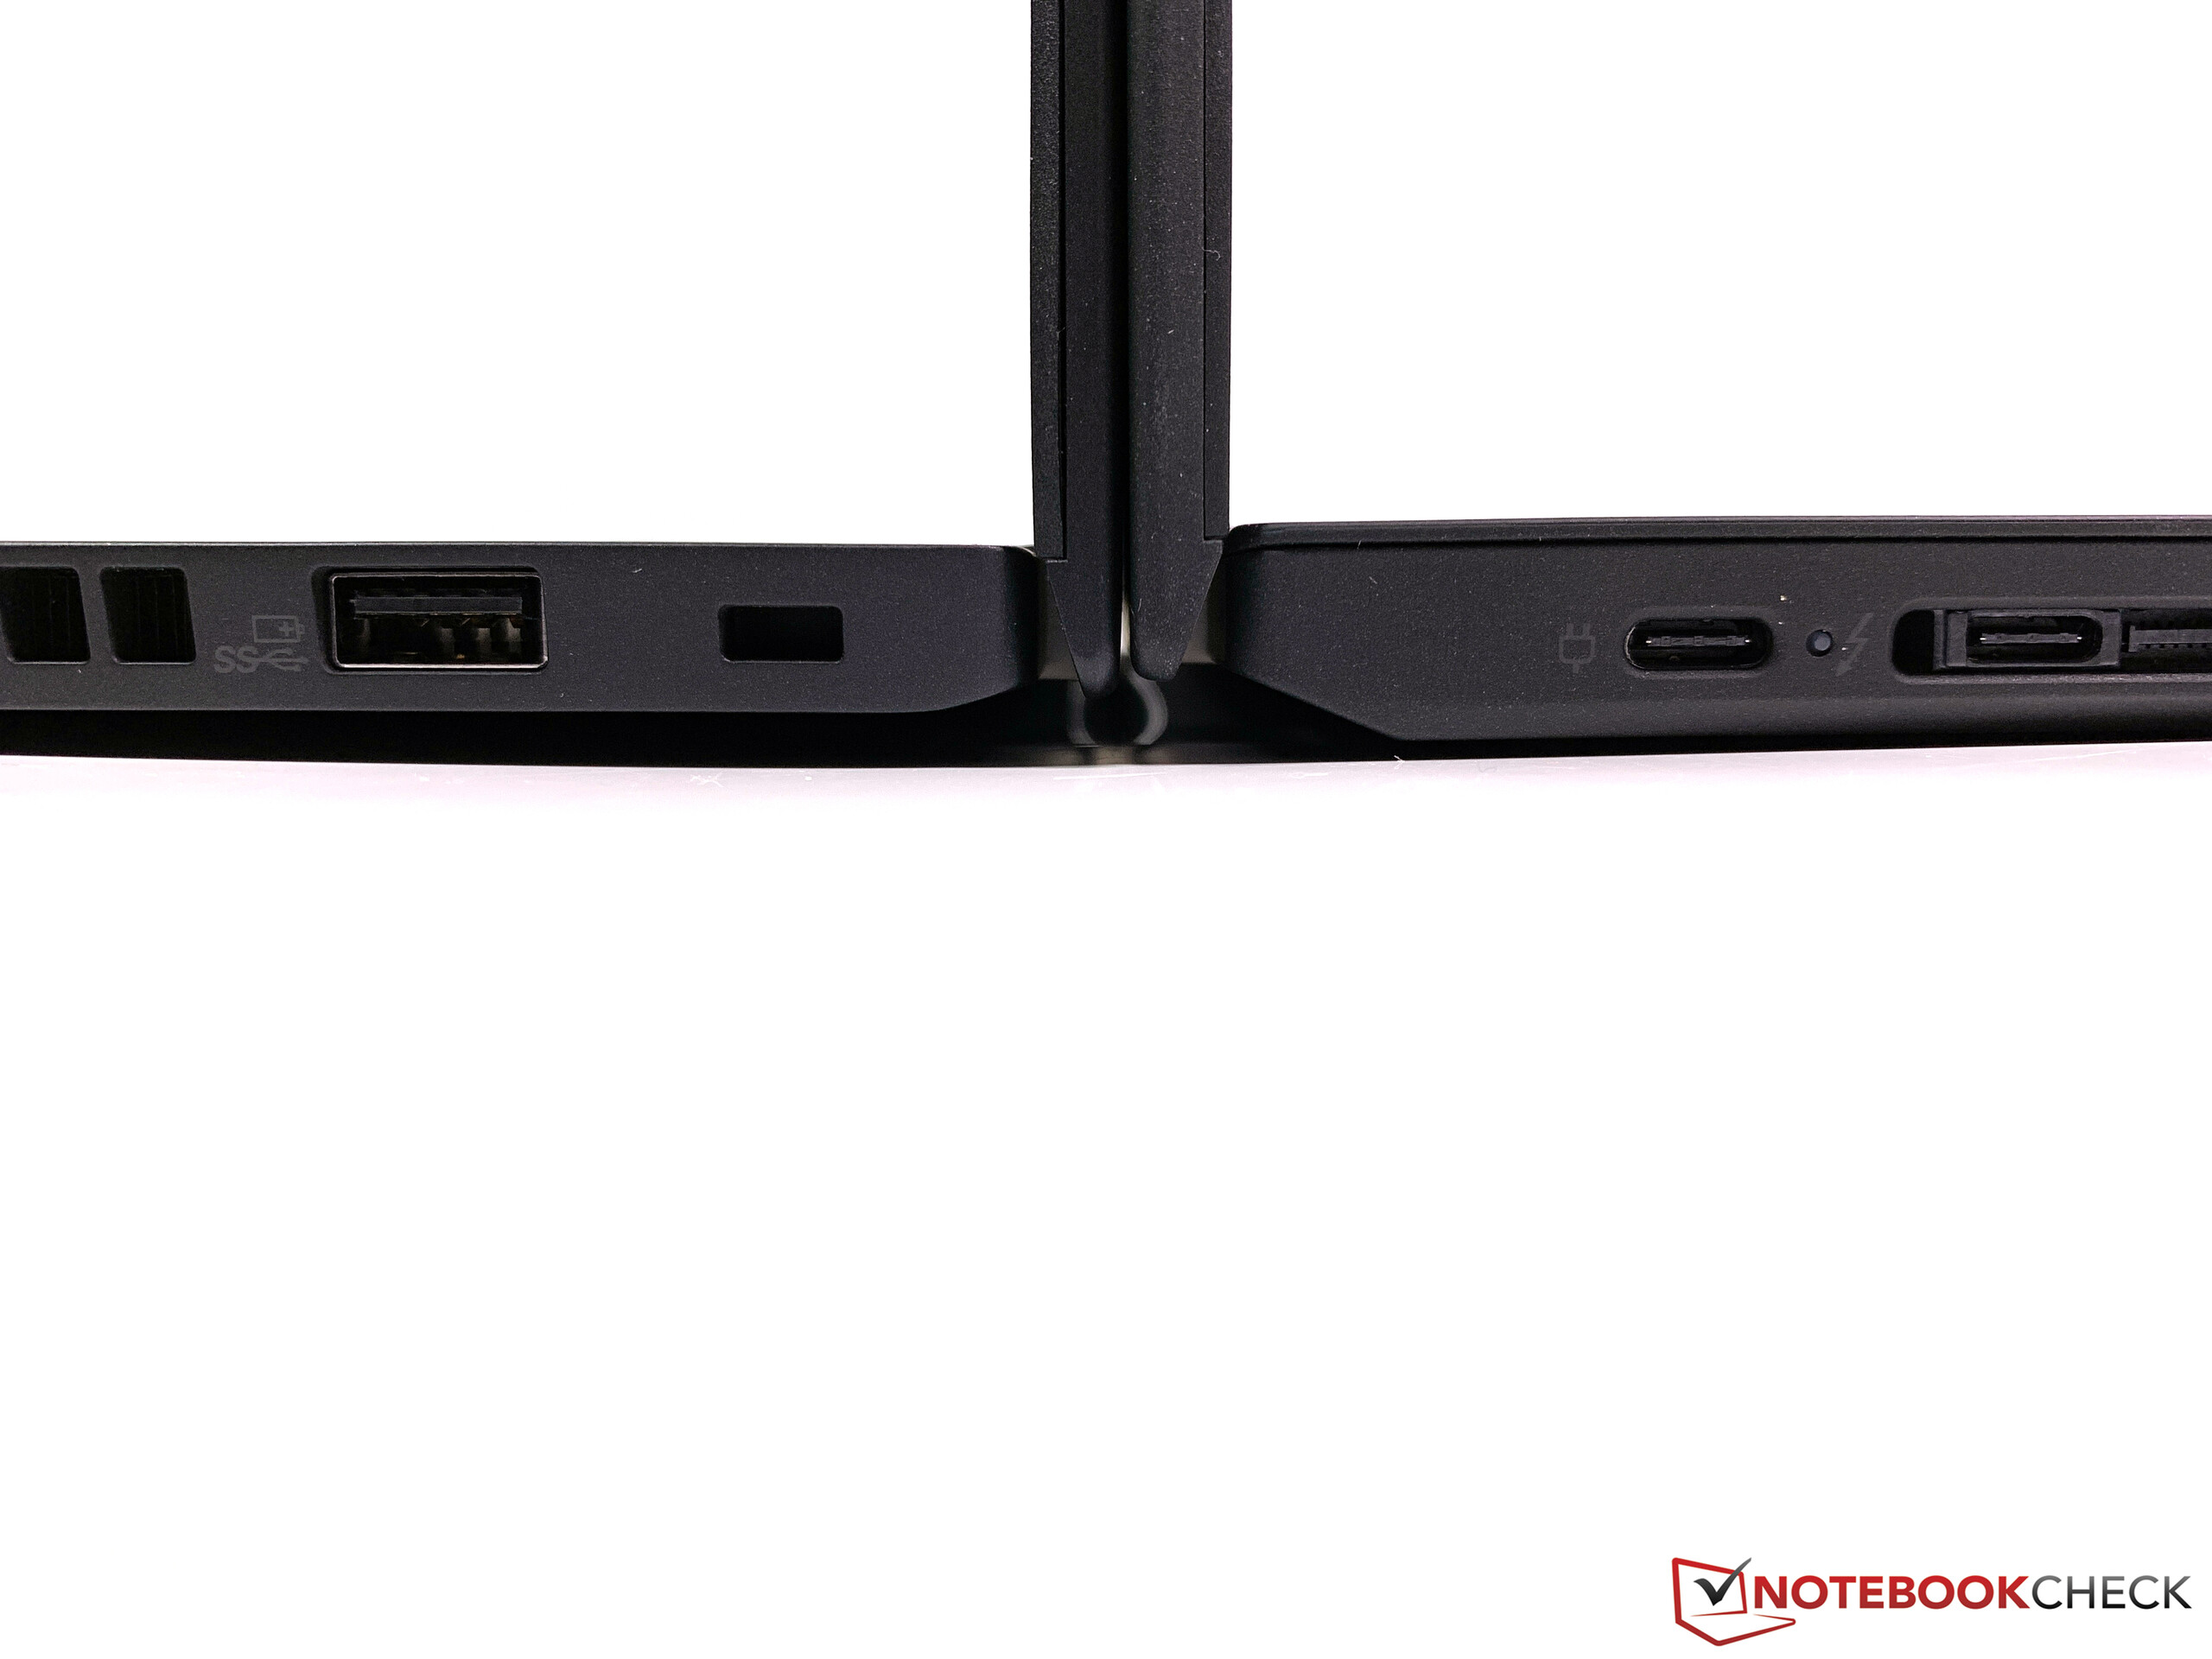
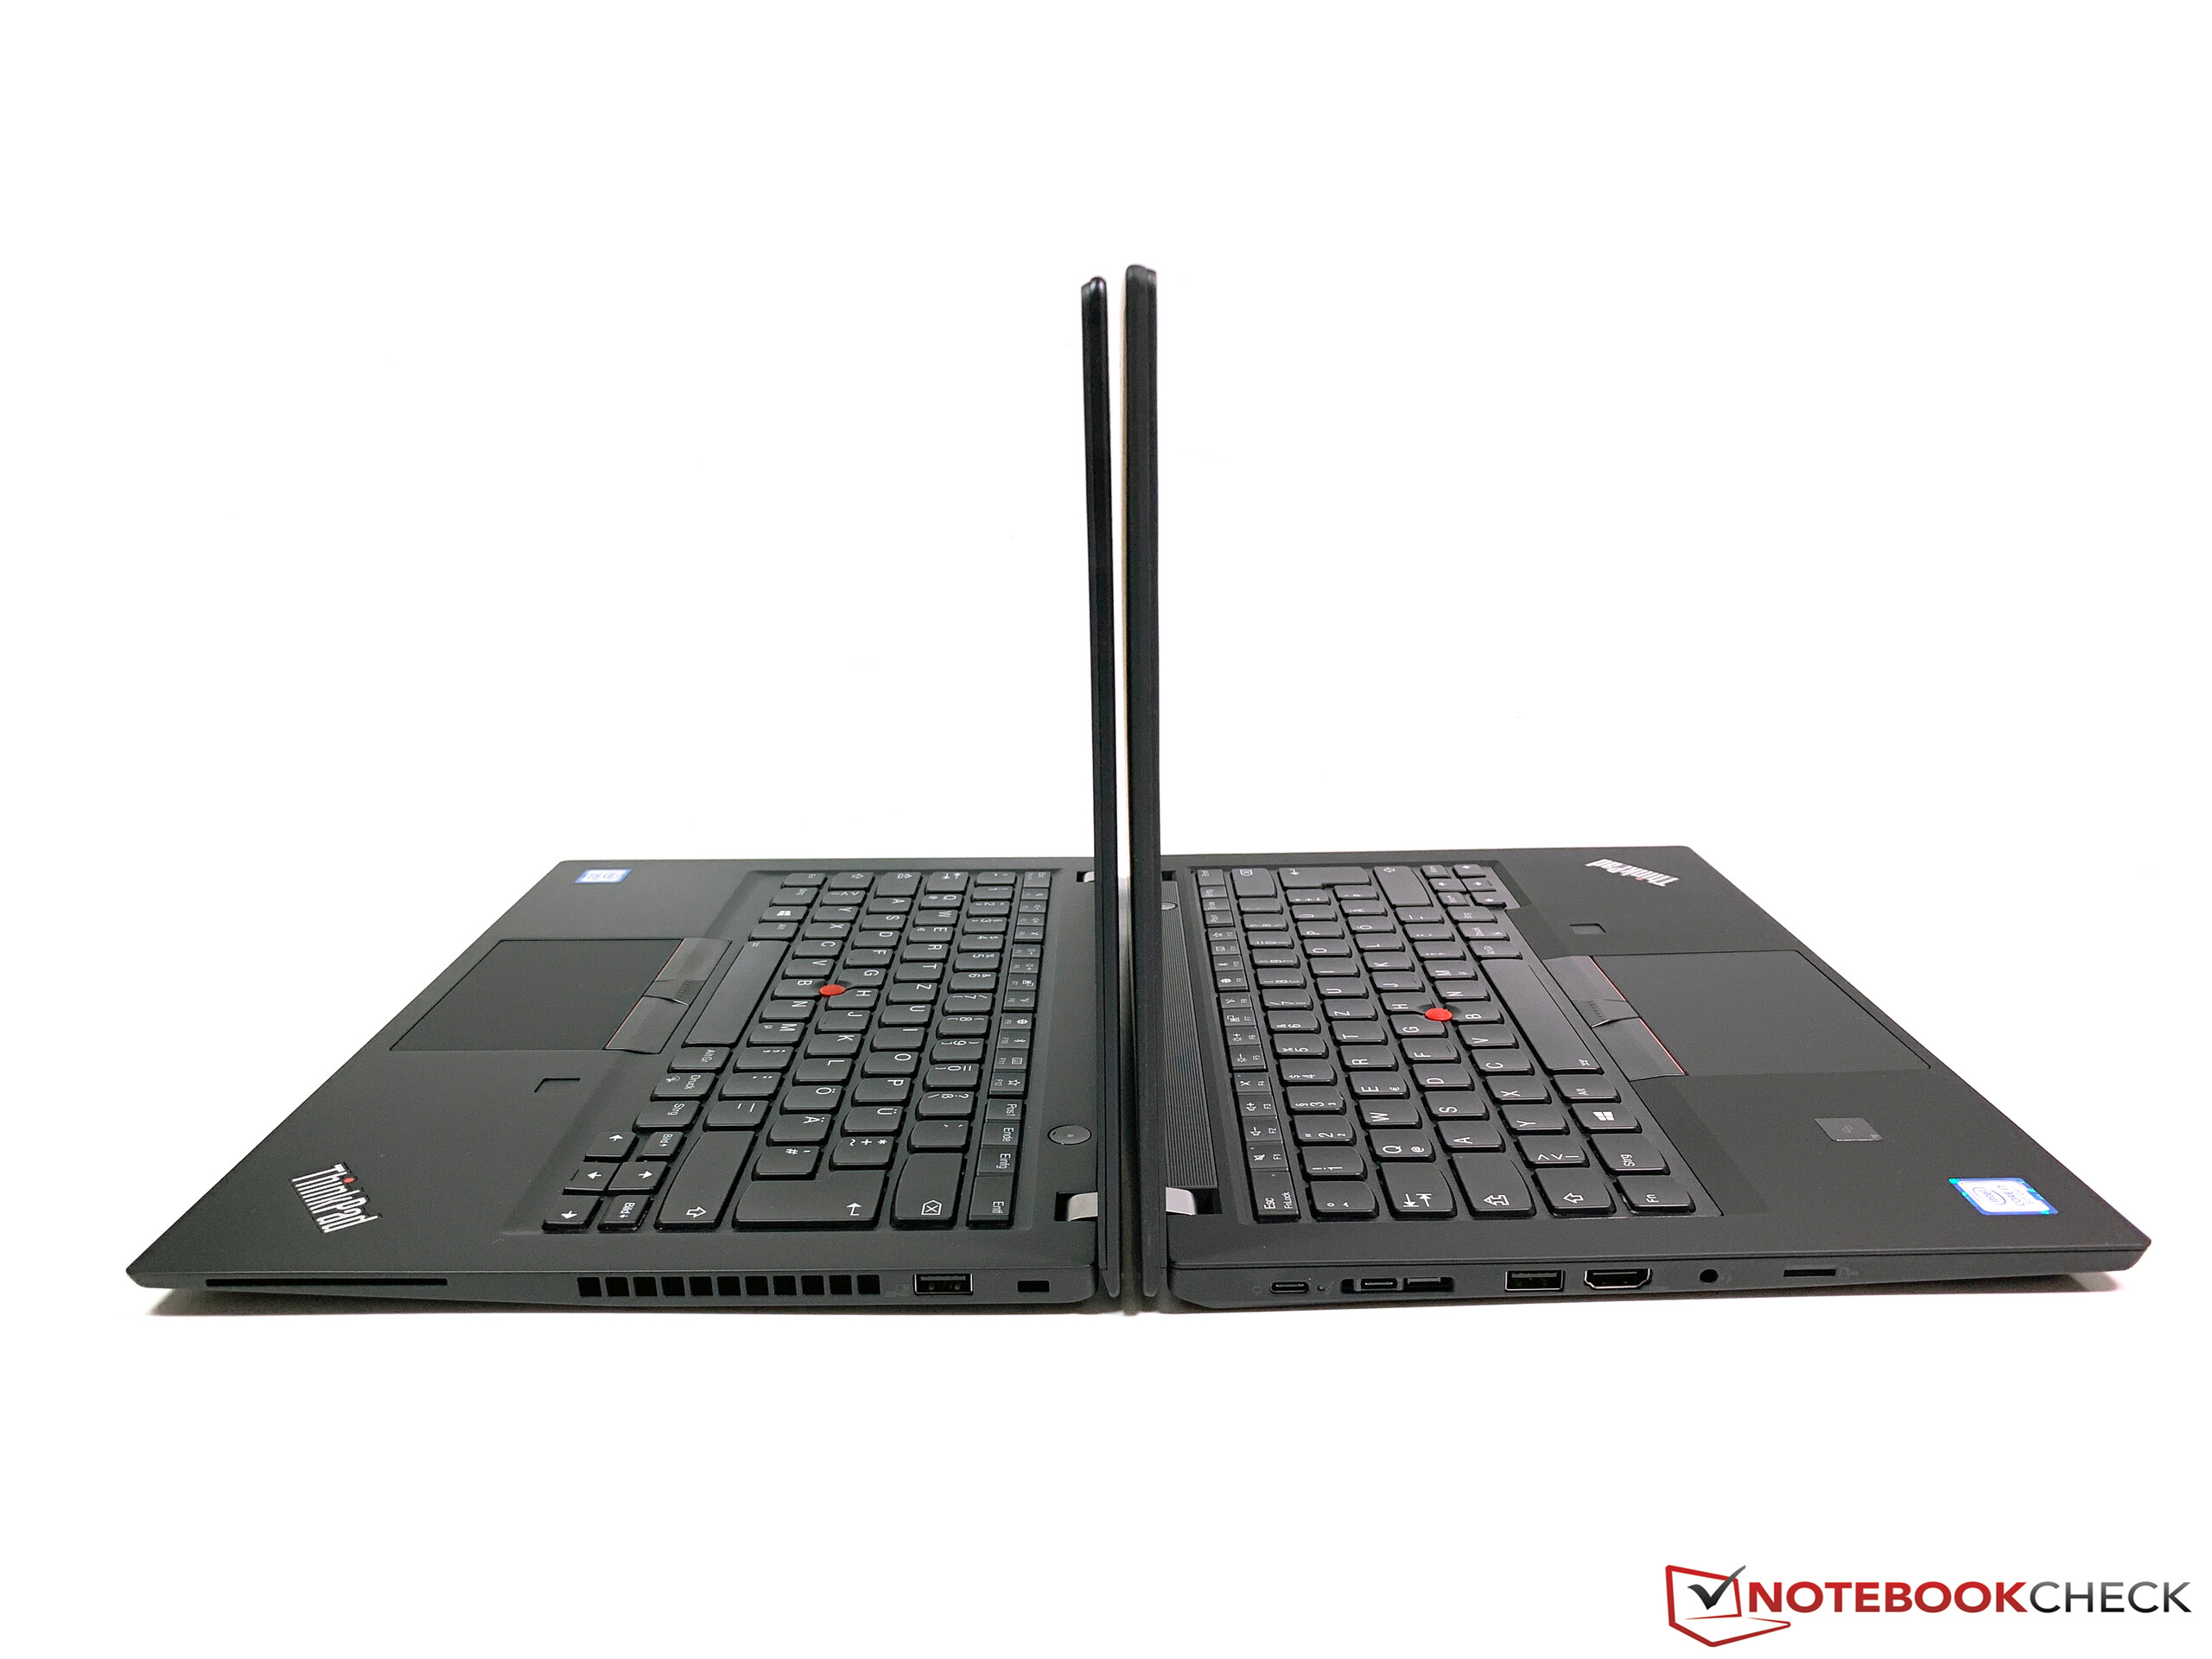
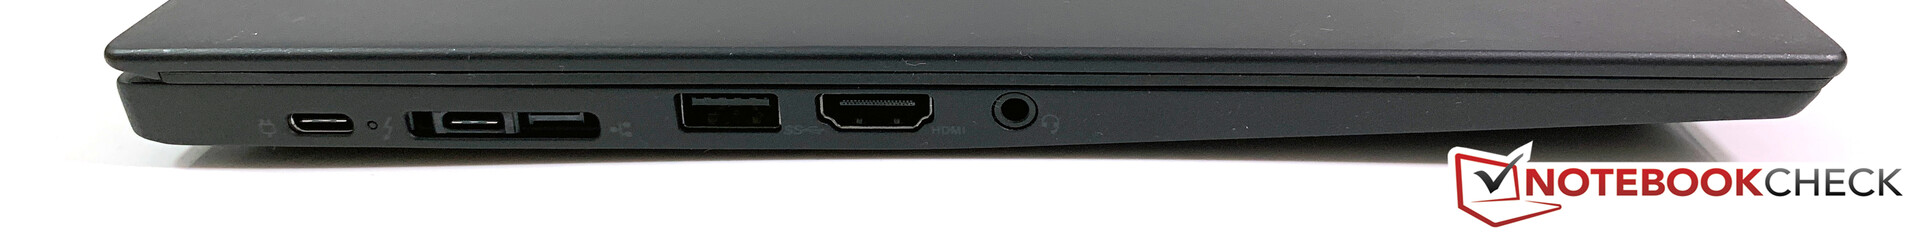
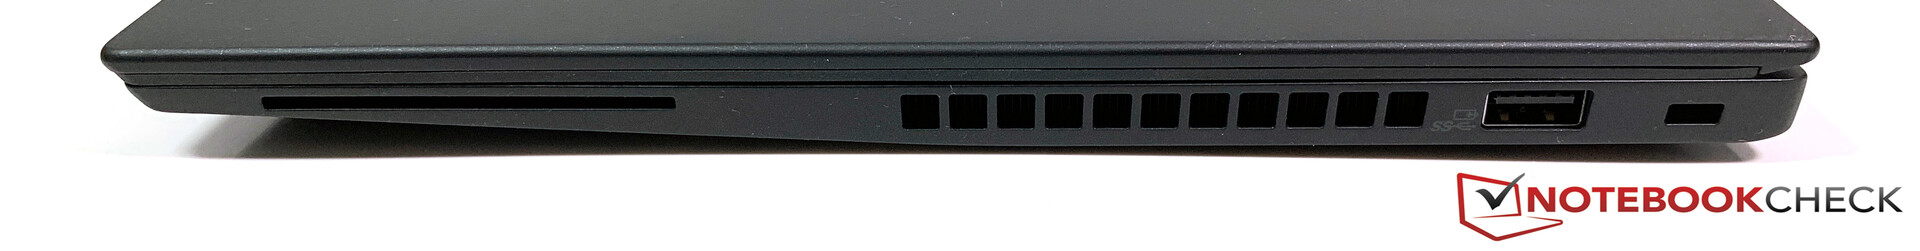
O ThinkPad T490s parece ser mais como um X1 Carbon barato (ou X1 Carbon Lite) em nossa opinião. É um pouco maior e mais pesado, mas oferece desempenho semelhante, bem como o design de teclado idêntico. A propósito, a qualidade do teclado está no nível do mais caro X1 Carbon e subjetivamente um passo acima do T490 e a concorrência da Dell, Fujitsu ou HP. A situação das portas dos T490s também nos lembra à do X1 Carbon, incluindo a localização inacessível do leitor de microSD.
Apreciamos as opções de tela adicionais, e a tela mate de 1080p de baixa potência analisada deixa uma ótima impressão, exceto pelos tempos de resposta lentos. Esperamos que seja a opção de tela mais popular tanto para o T490s quanto para o T490 comum. O brilho é muito bom, a qualidade da imagem se beneficia da alta taxa de contraste e o conteúdo não é granulado, apesar da superfície mate. O painel também cobre a gama sRGB menor e os desvios de cor são muito baixos, especialmente após a calibração. Isso significa que a tela também pode lidar com um pouco de edição de imagem - os T490s podem até ser uma opção interessante para os fotógrafos se tivessem um leitor SD de tamanho completo.
Chassi mais fino, melhor tela, melhor teclado, maior duração de bateria - menor desempenho da CPU, sem GPU dedicada, comprometimento das portas e opções de manutenção muito mais limitadas. Dependendo de suas expectativas, o novo T490s será ótimo ou uma grande decepção.
O T490s é atualmente melhor do que os rivais, porque é apenas um pacote muito completo no segmento de portáteis de escritório/negócios. Existem algumas desvantagens, mas algumas delas estão relacionadas ao modelo anterior e os concorrentes também não são perfeitos. Por isso, outorgamos ao T490s nosso Prêmio de Escolha dos Editores. A competição atualizará suas linhas nas próximas semanas, portanto a classificação pode mudar em breve. A Lenovo provavelmente oferecerá concorrentes sérios com os futuros concorrentes da AMD.
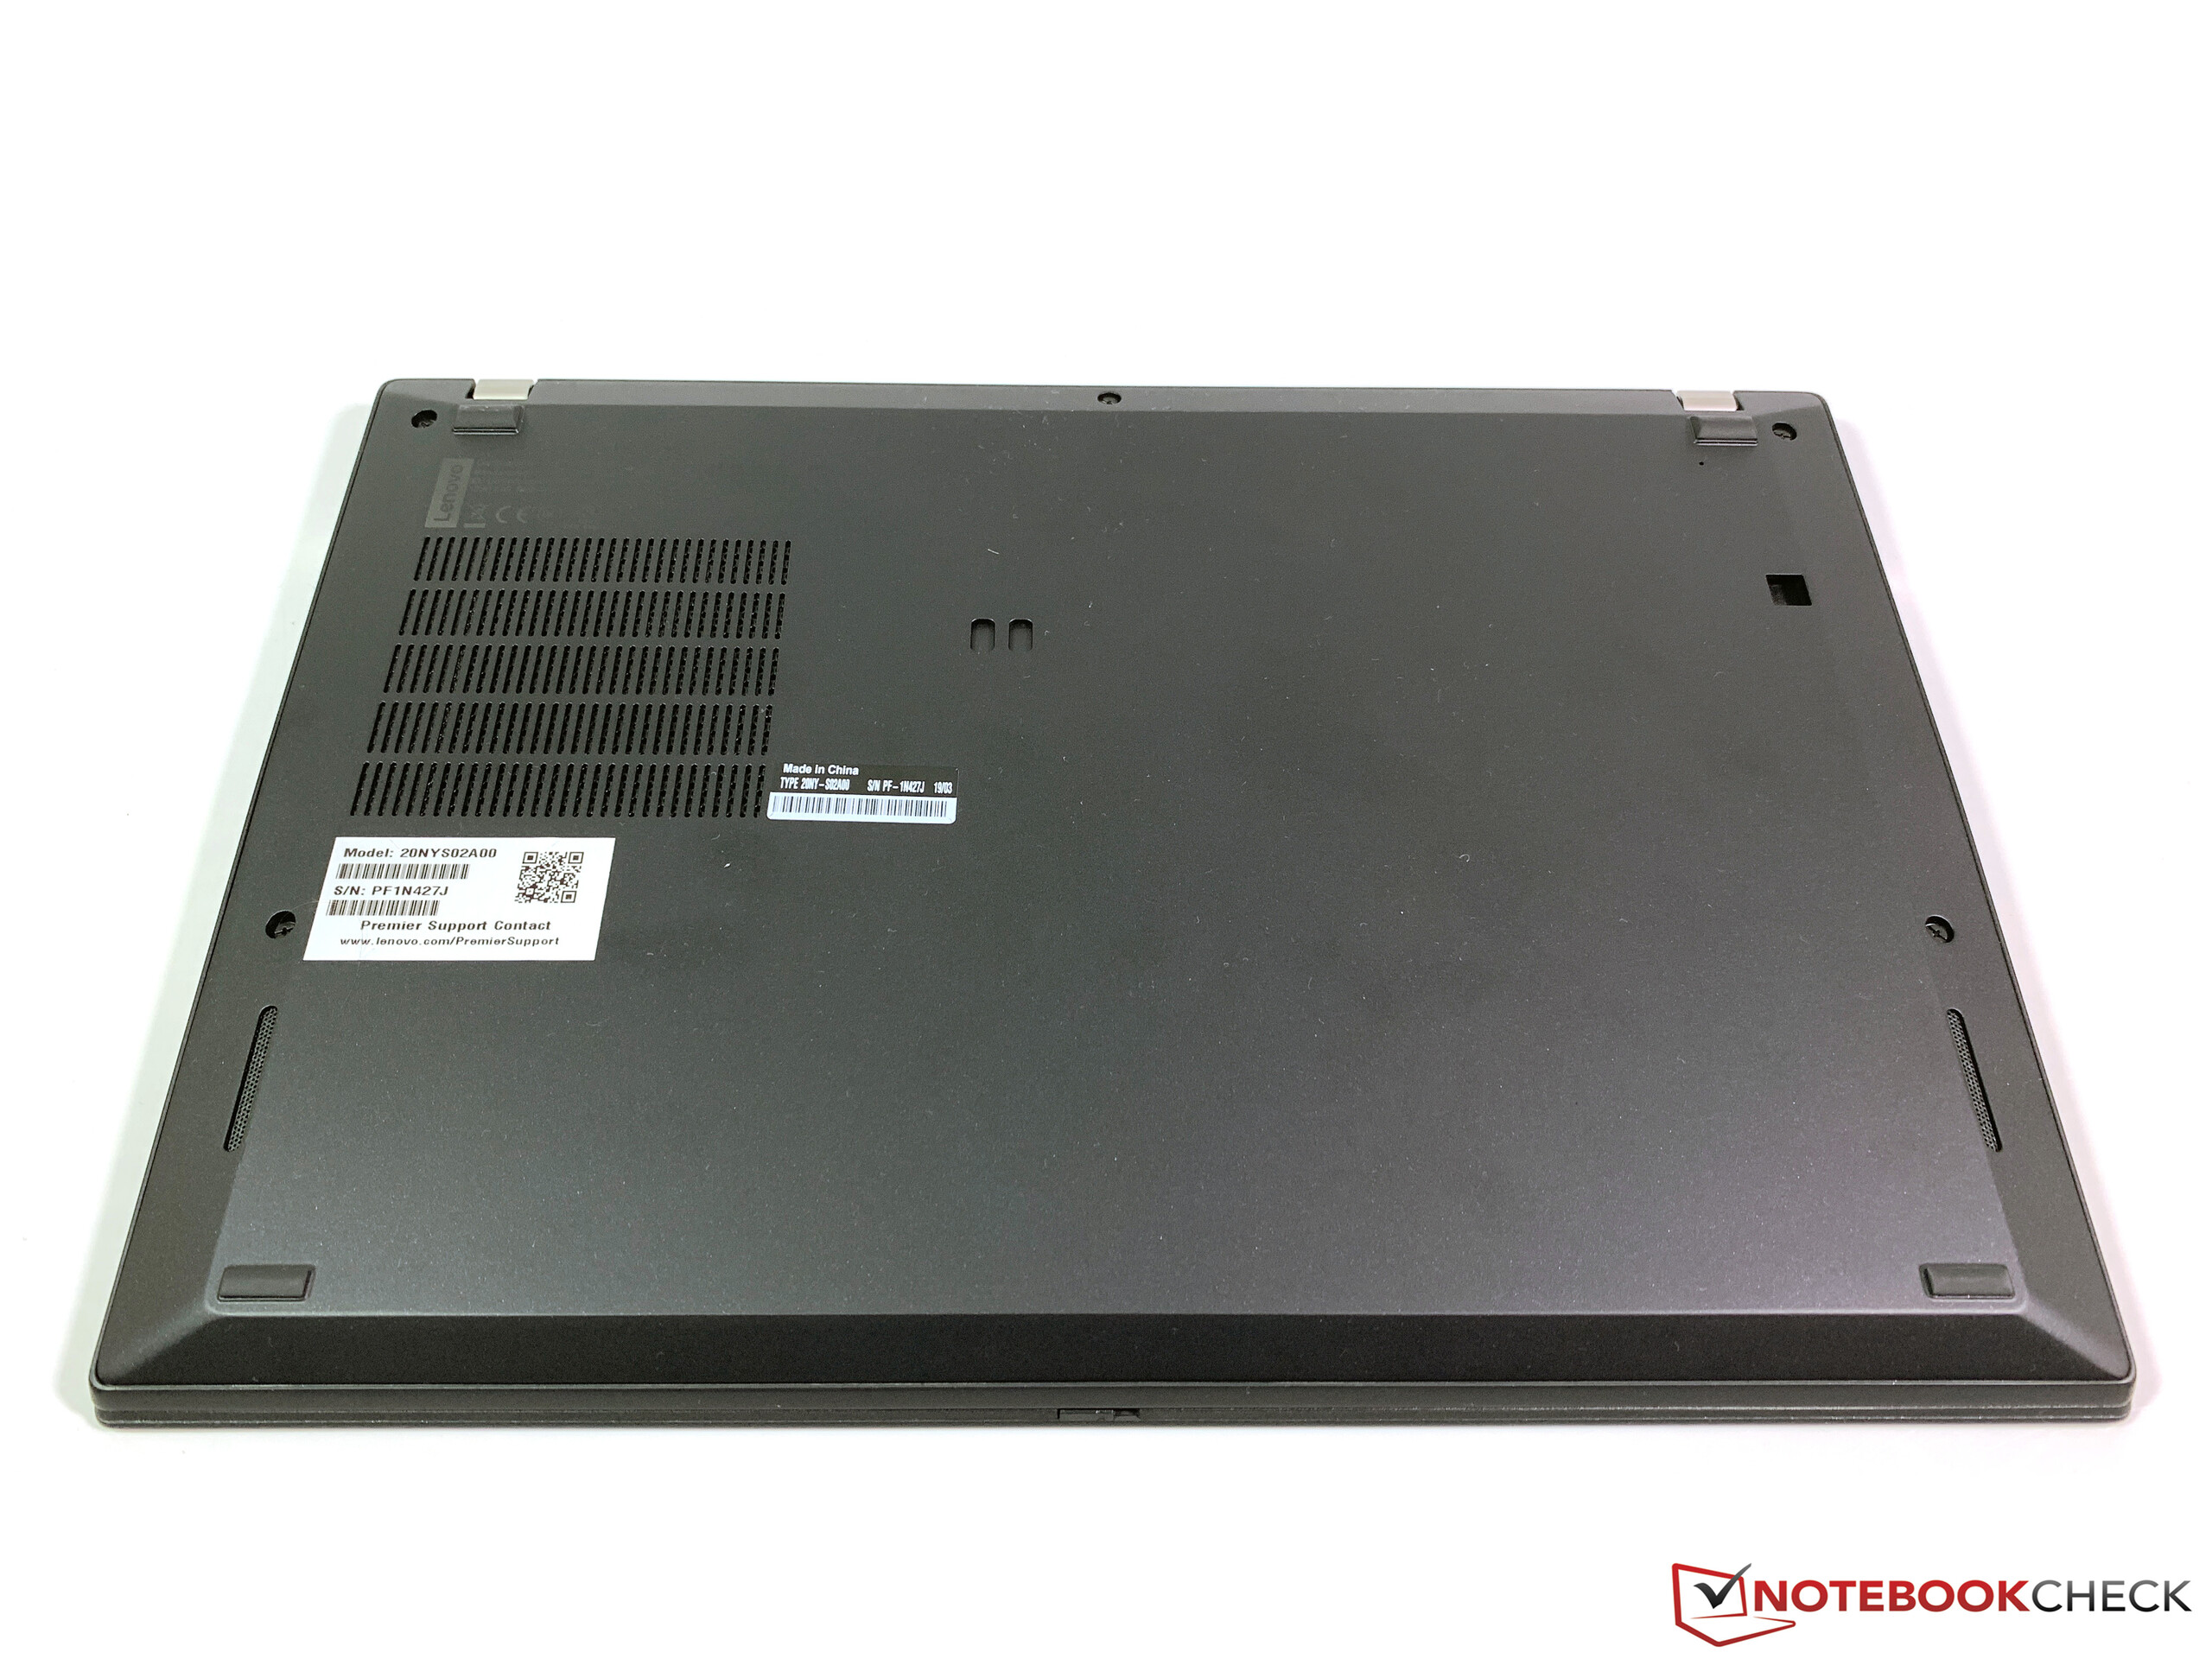
Lenovo ThinkPad T490s-20NYS02A00
- 09/24/2019 v7 (old)
Andreas Osthoff
Price comparison
