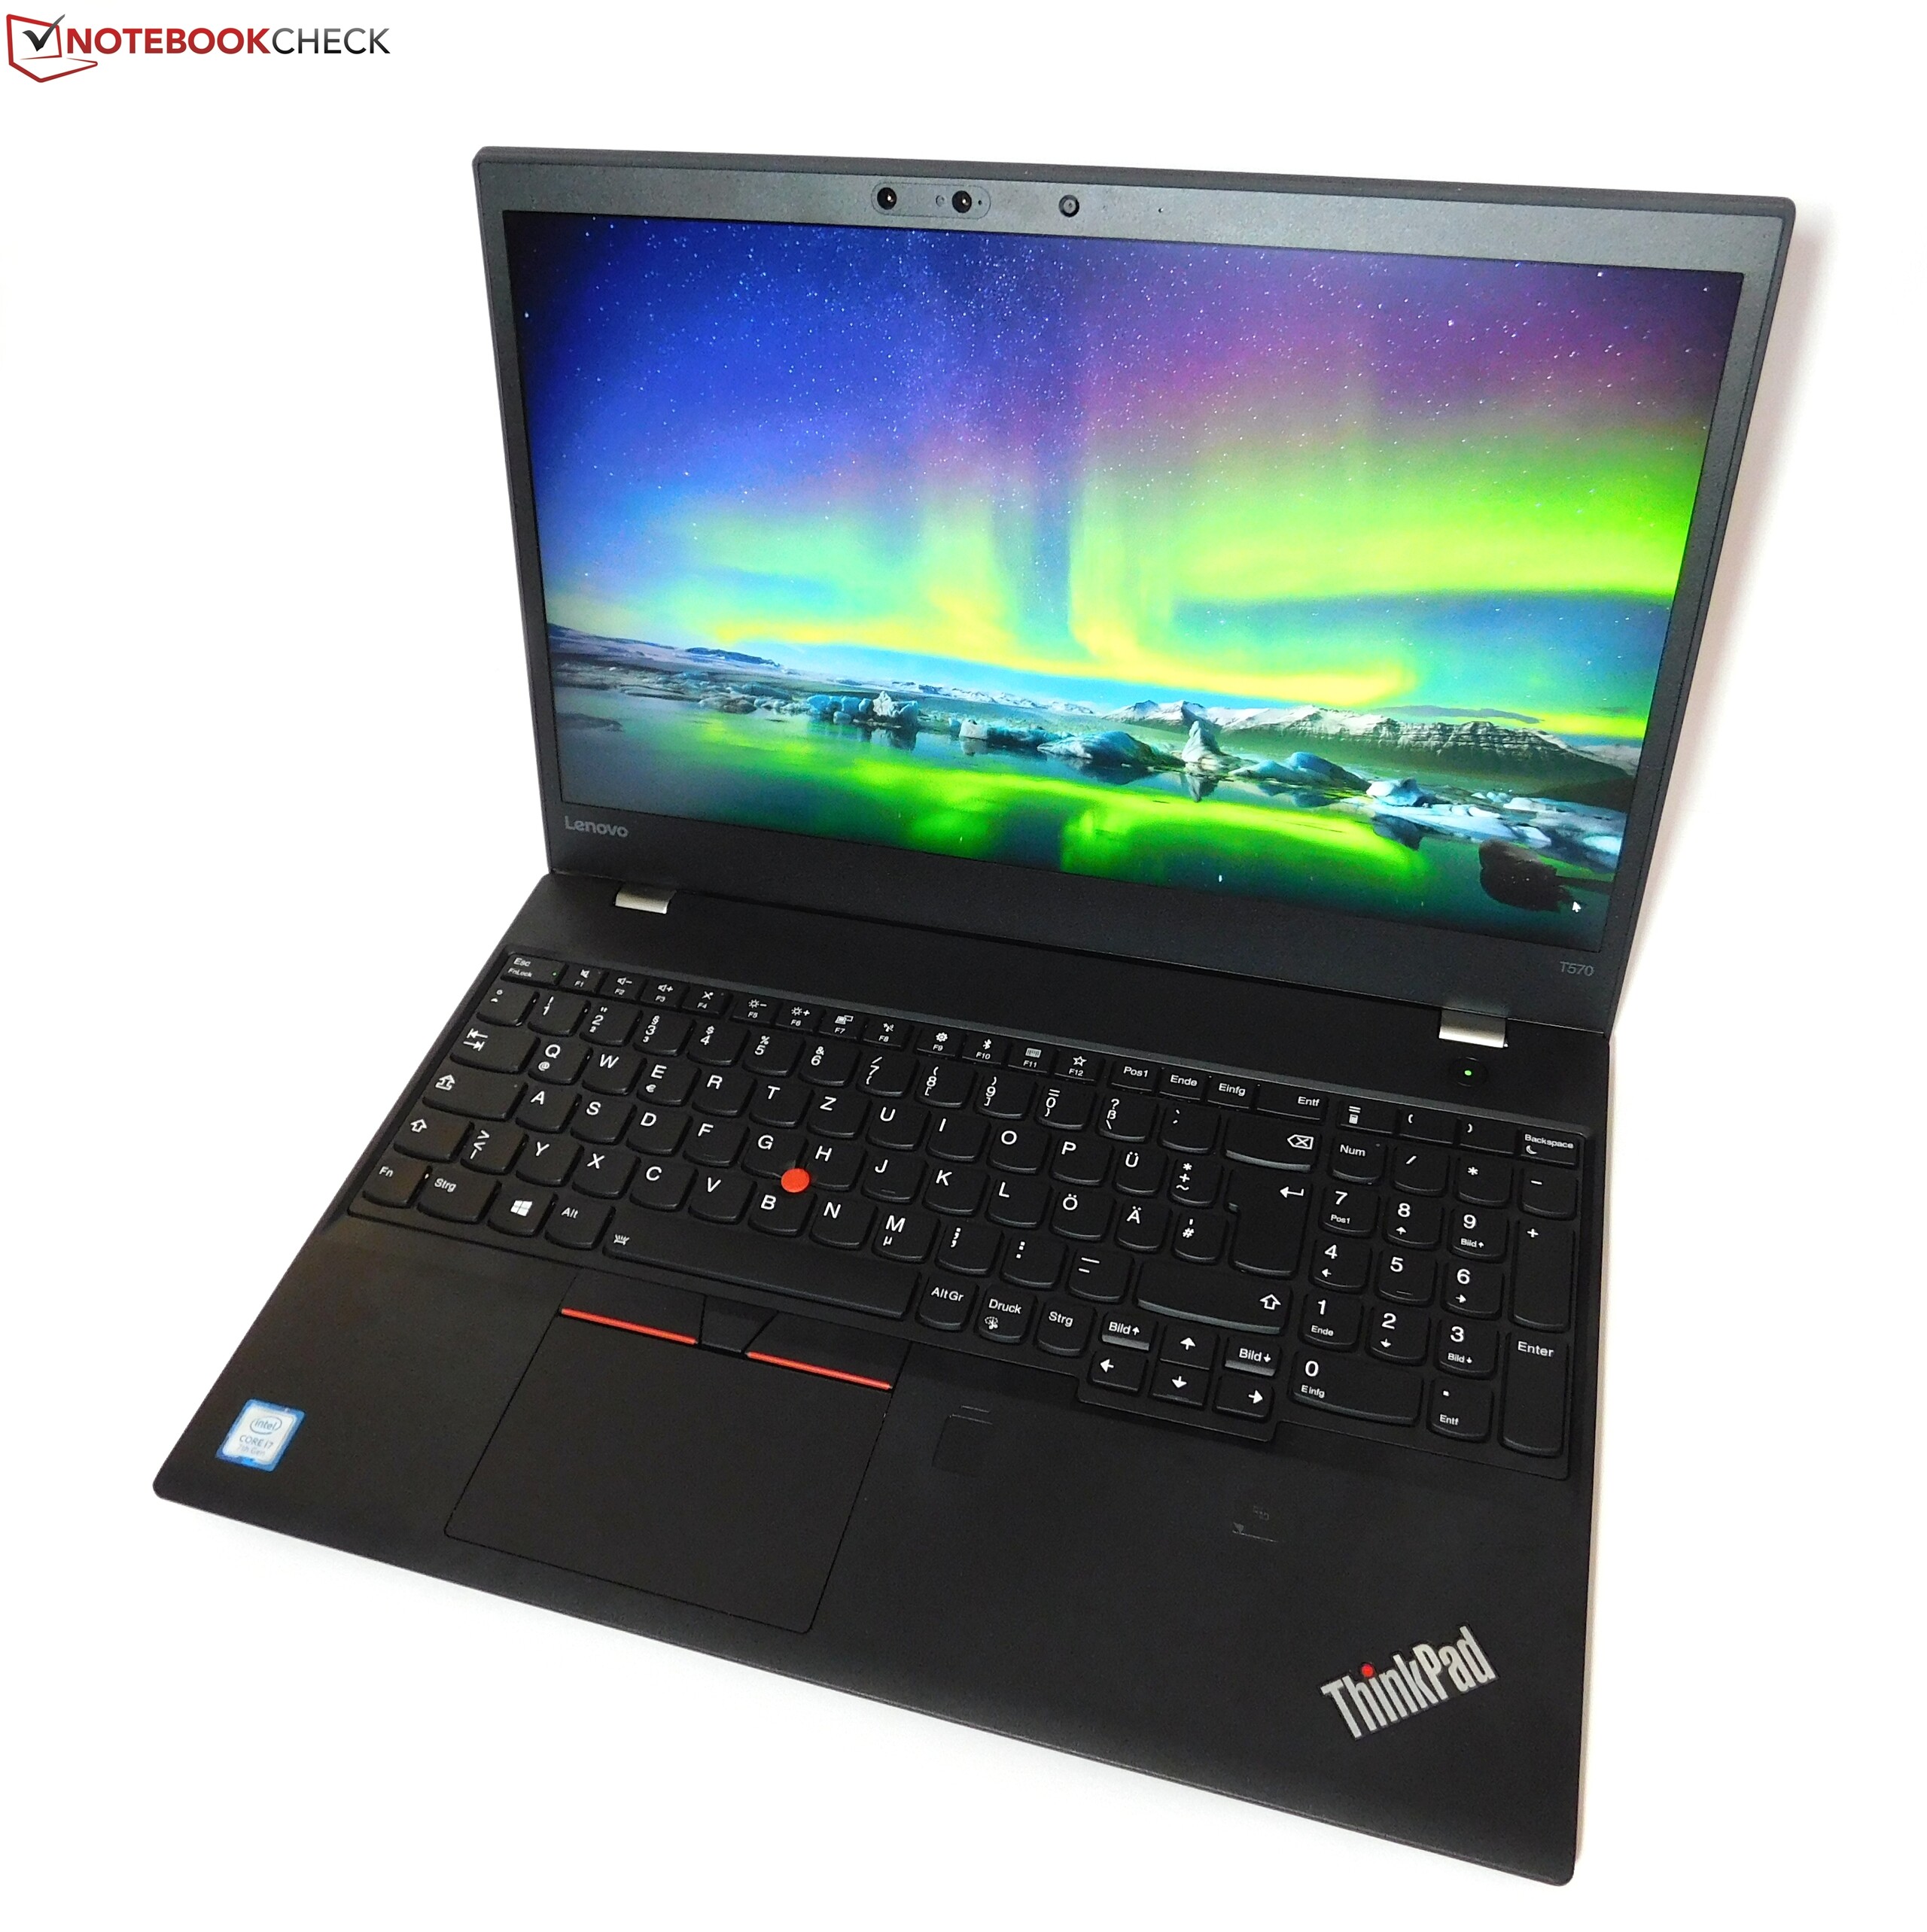
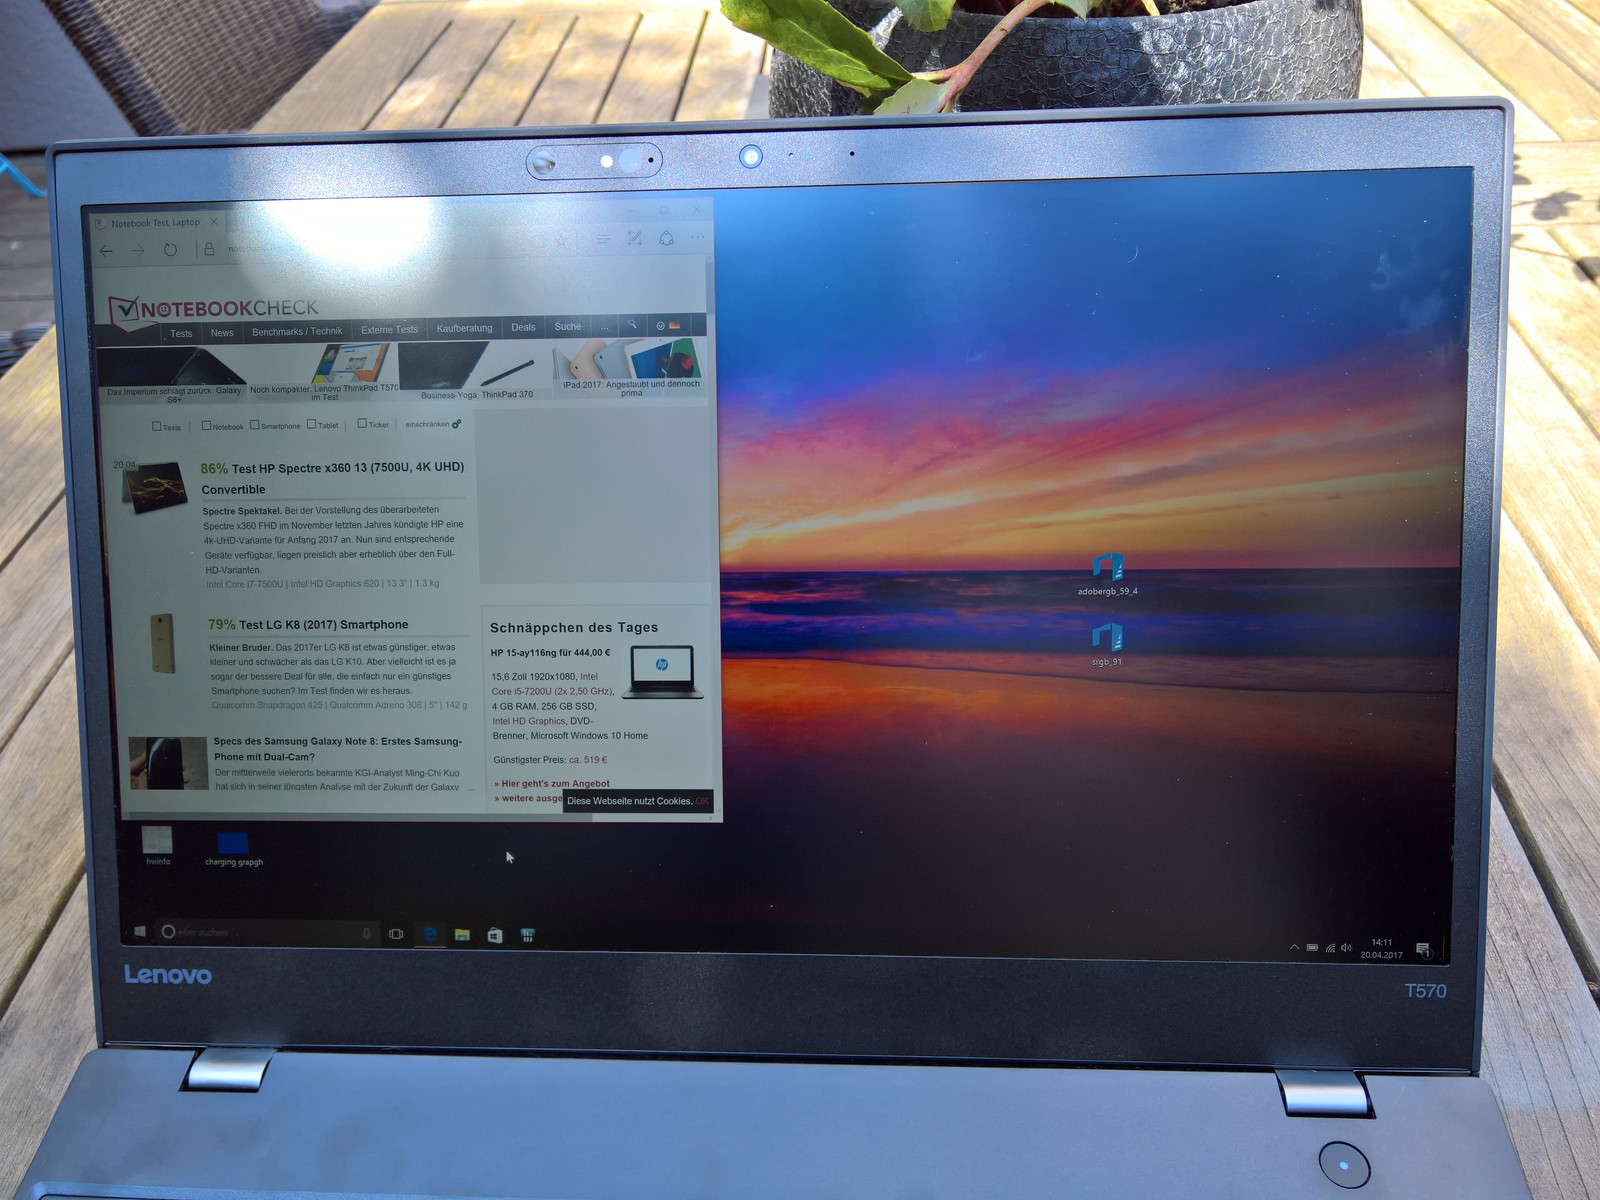
Breve Análise do Portátil Lenovo ThinkPad T570 (Core i7, 4K, 940MX)
| SD Card Reader | |
| average JPG Copy Test (av. of 3 runs) | |
| Lenovo ThinkPad T570-20HAS01E00 | |
| Fujitsu LifeBook U757 | |
| HP EliteBook 850 G4-Z2W86ET | |
| Dell XPS 15 2017 9560 (7300HQ, Full-HD) | |
| maximum AS SSD Seq Read Test (1GB) | |
| Dell XPS 15 2017 9560 (7300HQ, Full-HD) | |
| Lenovo ThinkPad T570-20HAS01E00 | |
| HP EliteBook 850 G4-Z2W86ET | |
| Fujitsu LifeBook U757 | |
| |||||||||||||||||||||||||
iluminação: 89 %
iluminação com acumulador: 339 cd/m²
Contraste: 942:1 (Preto: 0.36 cd/m²)
ΔE ColorChecker Calman: 4.2 | ∀{0.5-29.43 Ø4.71}
ΔE Greyscale Calman: 5.1 | ∀{0.09-98 Ø4.96}
91% sRGB (Argyll 1.6.3 3D)
59.4% AdobeRGB 1998 (Argyll 1.6.3 3D)
66.7% AdobeRGB 1998 (Argyll 3D)
91.1% sRGB (Argyll 3D)
70% Display P3 (Argyll 3D)
Gamma: 2.16
CCT: 6569 K
Cintilação da tela / PWM (modulação por largura de pulso)
| Tela tremeluzindo/PWM detectado | 926 Hz | ≤ 90 % configuração de brilho | 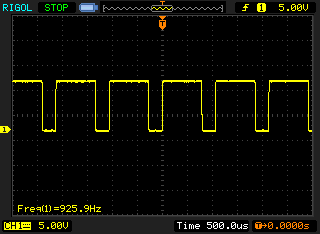 |
A luz de fundo da tela pisca em 926 Hz (pior caso, por exemplo, utilizando PWM) Cintilação detectada em uma configuração de brilho de 90 % e abaixo. Não deve haver cintilação ou PWM acima desta configuração de brilho. A frequência de 926 Hz é bastante alta, então a maioria dos usuários sensíveis ao PWM não deve notar nenhuma oscilação. [pwm_comparison] Em comparação: 52 % de todos os dispositivos testados não usam PWM para escurecer a tela. Se PWM foi detectado, uma média de 7757 (mínimo: 5 - máximo: 343500) Hz foi medida. | |||
| Lenovo ThinkPad T570-20HAS01E00 BOE NV156QUM-N44, , 3840x2160, 15.6" | Lenovo ThinkPad T570-20H90002GE N156HCA-EAA, , 1920x1080, 15.6" | Lenovo ThinkPad T560-20FH002RGE Panasonic VVX16T028J00, , 2880x1620, 15.6" | HP EliteBook 850 G4-Z2W86ET AUO35ED, , 1920x1080, 15.6" | Fujitsu LifeBook U757 LP156WF6-SPP1, , 1920x1080, 15.6" | Apple MacBook Pro 15 2016 (2.6 GHz, 450) 2880x1800, 15.4" | Dell XPS 15 9560 (i7-7700HQ, UHD) 3840x2160, 15.6" | |
|---|---|---|---|---|---|---|---|
| Display | -32% | -5% | -13% | -7% | 29% | ||
| Display P3 Coverage (%) | 70 | 44.08 -37% | 64.4 -8% | 56.8 -19% | 65.8 -6% | 89.7 28% | |
| sRGB Coverage (%) | 91.1 | 65.6 -28% | 87.8 -4% | 83.7 -8% | 84.8 -7% | 100 10% | |
| AdobeRGB 1998 Coverage (%) | 66.7 | 45.66 -32% | 64.1 -4% | 58.7 -12% | 62 -7% | 100 50% | |
| Response Times | -19% | -13% | -7% | -31% | -60% | -98% | |
| Response Time Grey 50% / Grey 80% * (ms) | 41.6 ? | 41.6 ? -0% | 32.8 ? 21% | 47.2 ? -13% | 36 ? 13% | 47.3 ? -14% | 57.2 ? -38% |
| Response Time Black / White * (ms) | 15.2 ? | 20.8 ? -37% | 22.4 ? -47% | 15.2 ? -0% | 26.4 ? -74% | 31.2 ? -105% | 39.2 ? -158% |
| PWM Frequency (Hz) | 926 ? | 26040 ? | 220 ? | 199.2 ? | 117000 ? | 962 | |
| Screen | -6% | -11% | -65% | -1% | 45% | 4% | |
| Brightness middle (cd/m²) | 339 | 262 -23% | 339 0% | 338 0% | 313 -8% | 483 42% | 370.1 9% |
| Brightness (cd/m²) | 314 | 245 -22% | 322 3% | 341 9% | 294 -6% | 465 48% | 356 13% |
| Brightness Distribution (%) | 89 | 89 0% | 88 -1% | 90 1% | 84 -6% | 92 3% | 87 -2% |
| Black Level * (cd/m²) | 0.36 | 0.24 33% | 0.32 11% | 0.81 -125% | 0.27 25% | 0.33 8% | 0.37 -3% |
| Contrast (:1) | 942 | 1092 16% | 1059 12% | 417 -56% | 1159 23% | 1464 55% | 1000 6% |
| Colorchecker dE 2000 * | 4.2 | 4.5 -7% | 5.88 -40% | 10.9 -160% | 4.5 -7% | 1.4 67% | 5.3 -26% |
| Colorchecker dE 2000 max. * | 7.8 | 10.5 -35% | 11.08 -42% | 18.7 -140% | 10.5 -35% | 3 62% | 9.9 -27% |
| Greyscale dE 2000 * | 5.1 | 3.5 31% | 7.41 -45% | 13.3 -161% | 4 22% | 1.5 71% | 4.6 10% |
| Gamma | 2.16 102% | 2.32 95% | 2.36 93% | 2.11 104% | 2.24 98% | 2.34 94% | 2.31 95% |
| CCT | 6569 99% | 6524 100% | 6036 108% | 16030 41% | 6387 102% | 6650 98% | 6284 103% |
| Color Space (Percent of AdobeRGB 1998) (%) | 59.4 | 42.04 -29% | 57.14 -4% | 53.8 -9% | 55.3 -7% | 88.3 49% | |
| Color Space (Percent of sRGB) (%) | 91 | 65.4 -28% | 87.68 -4% | 83.4 -8% | 84.74 -7% | 100 10% | |
| Média Total (Programa/Configurações) | -19% /
-13% | -10% /
-10% | -28% /
-47% | -13% /
-6% | -8% /
24% | -22% /
-5% |
* ... menor é melhor
Exibir tempos de resposta
| ↔ Tempo de resposta preto para branco | ||
|---|---|---|
| 15.2 ms ... ascensão ↗ e queda ↘ combinadas | ↗ 2 ms ascensão | 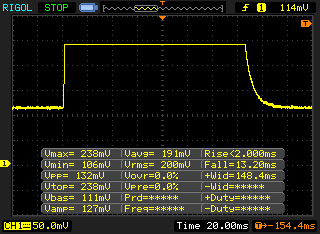 |
| ↘ 13.2 ms queda | ||
| A tela mostra boas taxas de resposta em nossos testes, mas pode ser muito lenta para jogadores competitivos. Em comparação, todos os dispositivos testados variam de 0.1 (mínimo) a 240 (máximo) ms. » 37 % de todos os dispositivos são melhores. Isso significa que o tempo de resposta medido é melhor que a média de todos os dispositivos testados (19.8 ms). | ||
| ↔ Tempo de resposta 50% cinza a 80% cinza | ||
| 41.6 ms ... ascensão ↗ e queda ↘ combinadas | ↗ 13.2 ms ascensão | 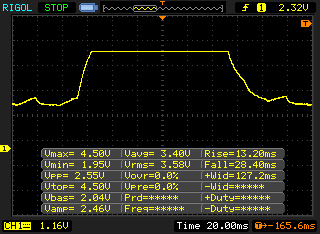 |
| ↘ 28.4 ms queda | ||
| A tela mostra taxas de resposta lentas em nossos testes e será insatisfatória para os jogadores. Em comparação, todos os dispositivos testados variam de 0.165 (mínimo) a 636 (máximo) ms. » 67 % de todos os dispositivos são melhores. Isso significa que o tempo de resposta medido é pior que a média de todos os dispositivos testados (31 ms). | ||
| PCMark 8 Home Score Accelerated v2 | 3049 pontos | |
| PCMark 8 Work Score Accelerated v2 | 3892 pontos | |
Ajuda | ||
| Lenovo ThinkPad T570-20HAS01E00 Samsung PM961 NVMe MZVLW512HMJP | Lenovo ThinkPad T560-20FH002RGE Samsung SSD PM871 MZ7LN256HCHP | HP EliteBook 850 G4-Z2W86ET Samsung PM951 NVMe MZVLV256 | Fujitsu LifeBook U757 Samsung CM871a MZNTY256HDHP | Apple MacBook Pro 15 2016 (2.6 GHz, 450) Apple SSD SM0256L | Dell XPS 15 9560 (i7-7700HQ, UHD) Lite-On CX2-8B512-Q11 | Lenovo ThinkPad T470s-20HGS00V00 Samsung SSD PM961 1TB M.2 PCIe 3.0 x4 NVMe (MZVLW1T0) | |
|---|---|---|---|---|---|---|---|
| CrystalDiskMark 3.0 | -50% | -29% | -47% | -16% | 4% | 18% | |
| Read Seq (MB/s) | 1210 | 513 -58% | 1245 3% | 509 -58% | 1298 7% | 1684 39% | 1760 45% |
| Write Seq (MB/s) | 1134 | 306.1 -73% | 298.6 -74% | 488.4 -57% | 1343 18% | 1106 -2% | 1666 47% |
| Read 512 (MB/s) | 789 | 450.6 -43% | 673 -15% | 414.3 -47% | 842 7% | 977 24% | 832 5% |
| Write 512 (MB/s) | 903 | 305.5 -66% | 298.8 -67% | 321.7 -64% | 945 5% | 1119 24% | 1064 18% |
| Read 4k (MB/s) | 58.4 | 33.4 -43% | 41.79 -28% | 36.43 -38% | 9.8 -83% | 45.14 -23% | 53.2 -9% |
| Write 4k (MB/s) | 144.1 | 85.6 -41% | 138.4 -4% | 88.4 -39% | 13 -91% | 134.1 -7% | 167.4 16% |
| Read 4k QD32 (MB/s) | 559 | 346.9 -38% | 495 -11% | 402.8 -28% | 630 13% | 509 -9% | 630 13% |
| Write 4k QD32 (MB/s) | 474.4 | 278.9 -41% | 297.5 -37% | 256.7 -46% | 443 -7% | 398.1 -16% | 533 12% |

| 3DMark 11 Performance | 2931 pontos | |
| 3DMark Cloud Gate Standard Score | 8308 pontos | |
| 3DMark Fire Strike Score | 2098 pontos | |
Ajuda | ||
| BioShock Infinite - 1366x768 High Preset | |
| Dell XPS 15 9560 (i7-7700HQ, UHD) | |
| Lenovo ThinkPad T570-20HAS01E00 | |
| Lenovo ThinkPad T560-20FH002RGE | |
| HP EliteBook 850 G4-Z2W86ET | |
| Lenovo ThinkPad T570-20H90002GE | |
| baixo | média | alto | ultra | 4K | |
|---|---|---|---|---|---|
| BioShock Infinite (2013) | 137.9 | 72.4 | 64.3 | 21.5 | |
| The Witcher 3 (2015) | 42.5 | 25.7 | 11.5 | ||
| Civilization 6 (2016) | 52.1 | 30.7 | 16.4 | 12.6 | 10.1 |
Barulho
| Ocioso |
| 29.3 / 29.3 / 31.1 dB |
| Carga |
| 35.2 / 41.3 dB |
 | ||
30 dB silencioso 40 dB(A) audível 50 dB(A) ruidosamente alto |
||
min: | ||
(±) A temperatura máxima no lado superior é 43.1 °C / 110 F, em comparação com a média de 34.3 °C / 94 F , variando de 21.2 a 62.5 °C para a classe Office.
(-) A parte inferior aquece até um máximo de 55.4 °C / 132 F, em comparação com a média de 36.8 °C / 98 F
(+) Em uso inativo, a temperatura média para o lado superior é 24 °C / 75 F, em comparação com a média do dispositivo de 29.5 °C / ### class_avg_f### F.
(±) Os apoios para as mãos e o touchpad podem ficar muito quentes ao toque, com um máximo de 39.6 °C / 103.3 F.
(-) A temperatura média da área do apoio para as mãos de dispositivos semelhantes foi 27.5 °C / 81.5 F (-12.1 °C / -21.8 F).
| desligado | |
| Ocioso | |
| Carga |
|
Key:
min: | |
| Lenovo ThinkPad T570-20HAS01E00 i7-7500U, GeForce 940MX, Samsung PM961 NVMe MZVLW512HMJP, IPS, 3840x2160, 15.6" | Lenovo ThinkPad T570-20H90002GE i5-7200U, HD Graphics 620, Samsung PM961 MZVLW256HEHP, IPS, 1920x1080, 15.6" | HP EliteBook 850 G4-Z2W86ET i5-7200U, HD Graphics 620, Samsung PM951 NVMe MZVLV256, TN LED, 1920x1080, 15.6" | Fujitsu LifeBook U757 i5-7200U, HD Graphics 620, Samsung CM871a MZNTY256HDHP, IPS LED, 1920x1080, 15.6" | Apple MacBook Pro 15 2016 (2.6 GHz, 450) 6700HQ, Radeon Pro 450, Apple SSD SM0256L, IPS, 2880x1800, 15.4" | Dell XPS 15 9560 (i7-7700HQ, UHD) i7-7700HQ, GeForce GTX 1050 Mobile, Lite-On CX2-8B512-Q11, IGZO IPS, 3840x2160, 15.6" | |
|---|---|---|---|---|---|---|
| Power Consumption | 31% | 39% | 33% | 2% | -83% | |
| Idle Minimum * (Watt) | 4.7 | 3.6 23% | 3.58 24% | 3.96 16% | 2.9 38% | 11.9 -153% |
| Idle Average * (Watt) | 9.9 | 7.7 22% | 5.97 40% | 7.74 22% | 9.7 2% | 17.1 -73% |
| Idle Maximum * (Watt) | 10.9 | 8.2 25% | 6.81 38% | 8.64 21% | 10.1 7% | 17.3 -59% |
| Load Average * (Watt) | 56.1 | 30.8 45% | 29.4 48% | 28.8 49% | 65 -16% | 94.7 -69% |
| Load Maximum * (Watt) | 75 | 46.1 39% | 39.7 47% | 32 57% | 89.5 -19% | 122 -63% |
| Witcher 3 ultra * (Watt) | 104.8 |
* ... menor é melhor
| Lenovo ThinkPad T570-20HAS01E00 i7-7500U, GeForce 940MX, 56 Wh | Lenovo ThinkPad T570-20H90002GE i5-7200U, HD Graphics 620, 56 Wh | HP EliteBook 850 G4-Z2W86ET i5-7200U, HD Graphics 620, 51 Wh | Fujitsu LifeBook U757 i5-7200U, HD Graphics 620, 50 Wh | Apple MacBook Pro 15 2016 (2.6 GHz, 450) 6700HQ, Radeon Pro 450, 76 Wh | Dell XPS 15 9560 (i7-7700HQ, UHD) i7-7700HQ, GeForce GTX 1050 Mobile, 97 Wh | |
|---|---|---|---|---|---|---|
| Duração da bateria | 24% | 22% | 6% | -6% | -11% | |
| Reader / Idle (h) | 13.3 | 19.5 47% | 18 35% | 13.9 5% | ||
| H.264 (h) | 8.1 | 9.8 21% | 10.6 31% | 8.6 6% | ||
| WiFi v1.3 (h) | 6.9 | 7.6 10% | 8.8 28% | 7.3 6% | 10 45% | 7.2 4% |
| Load (h) | 2.9 | 3.4 17% | 2.7 -7% | 0.9 -69% | 1.7 -41% |
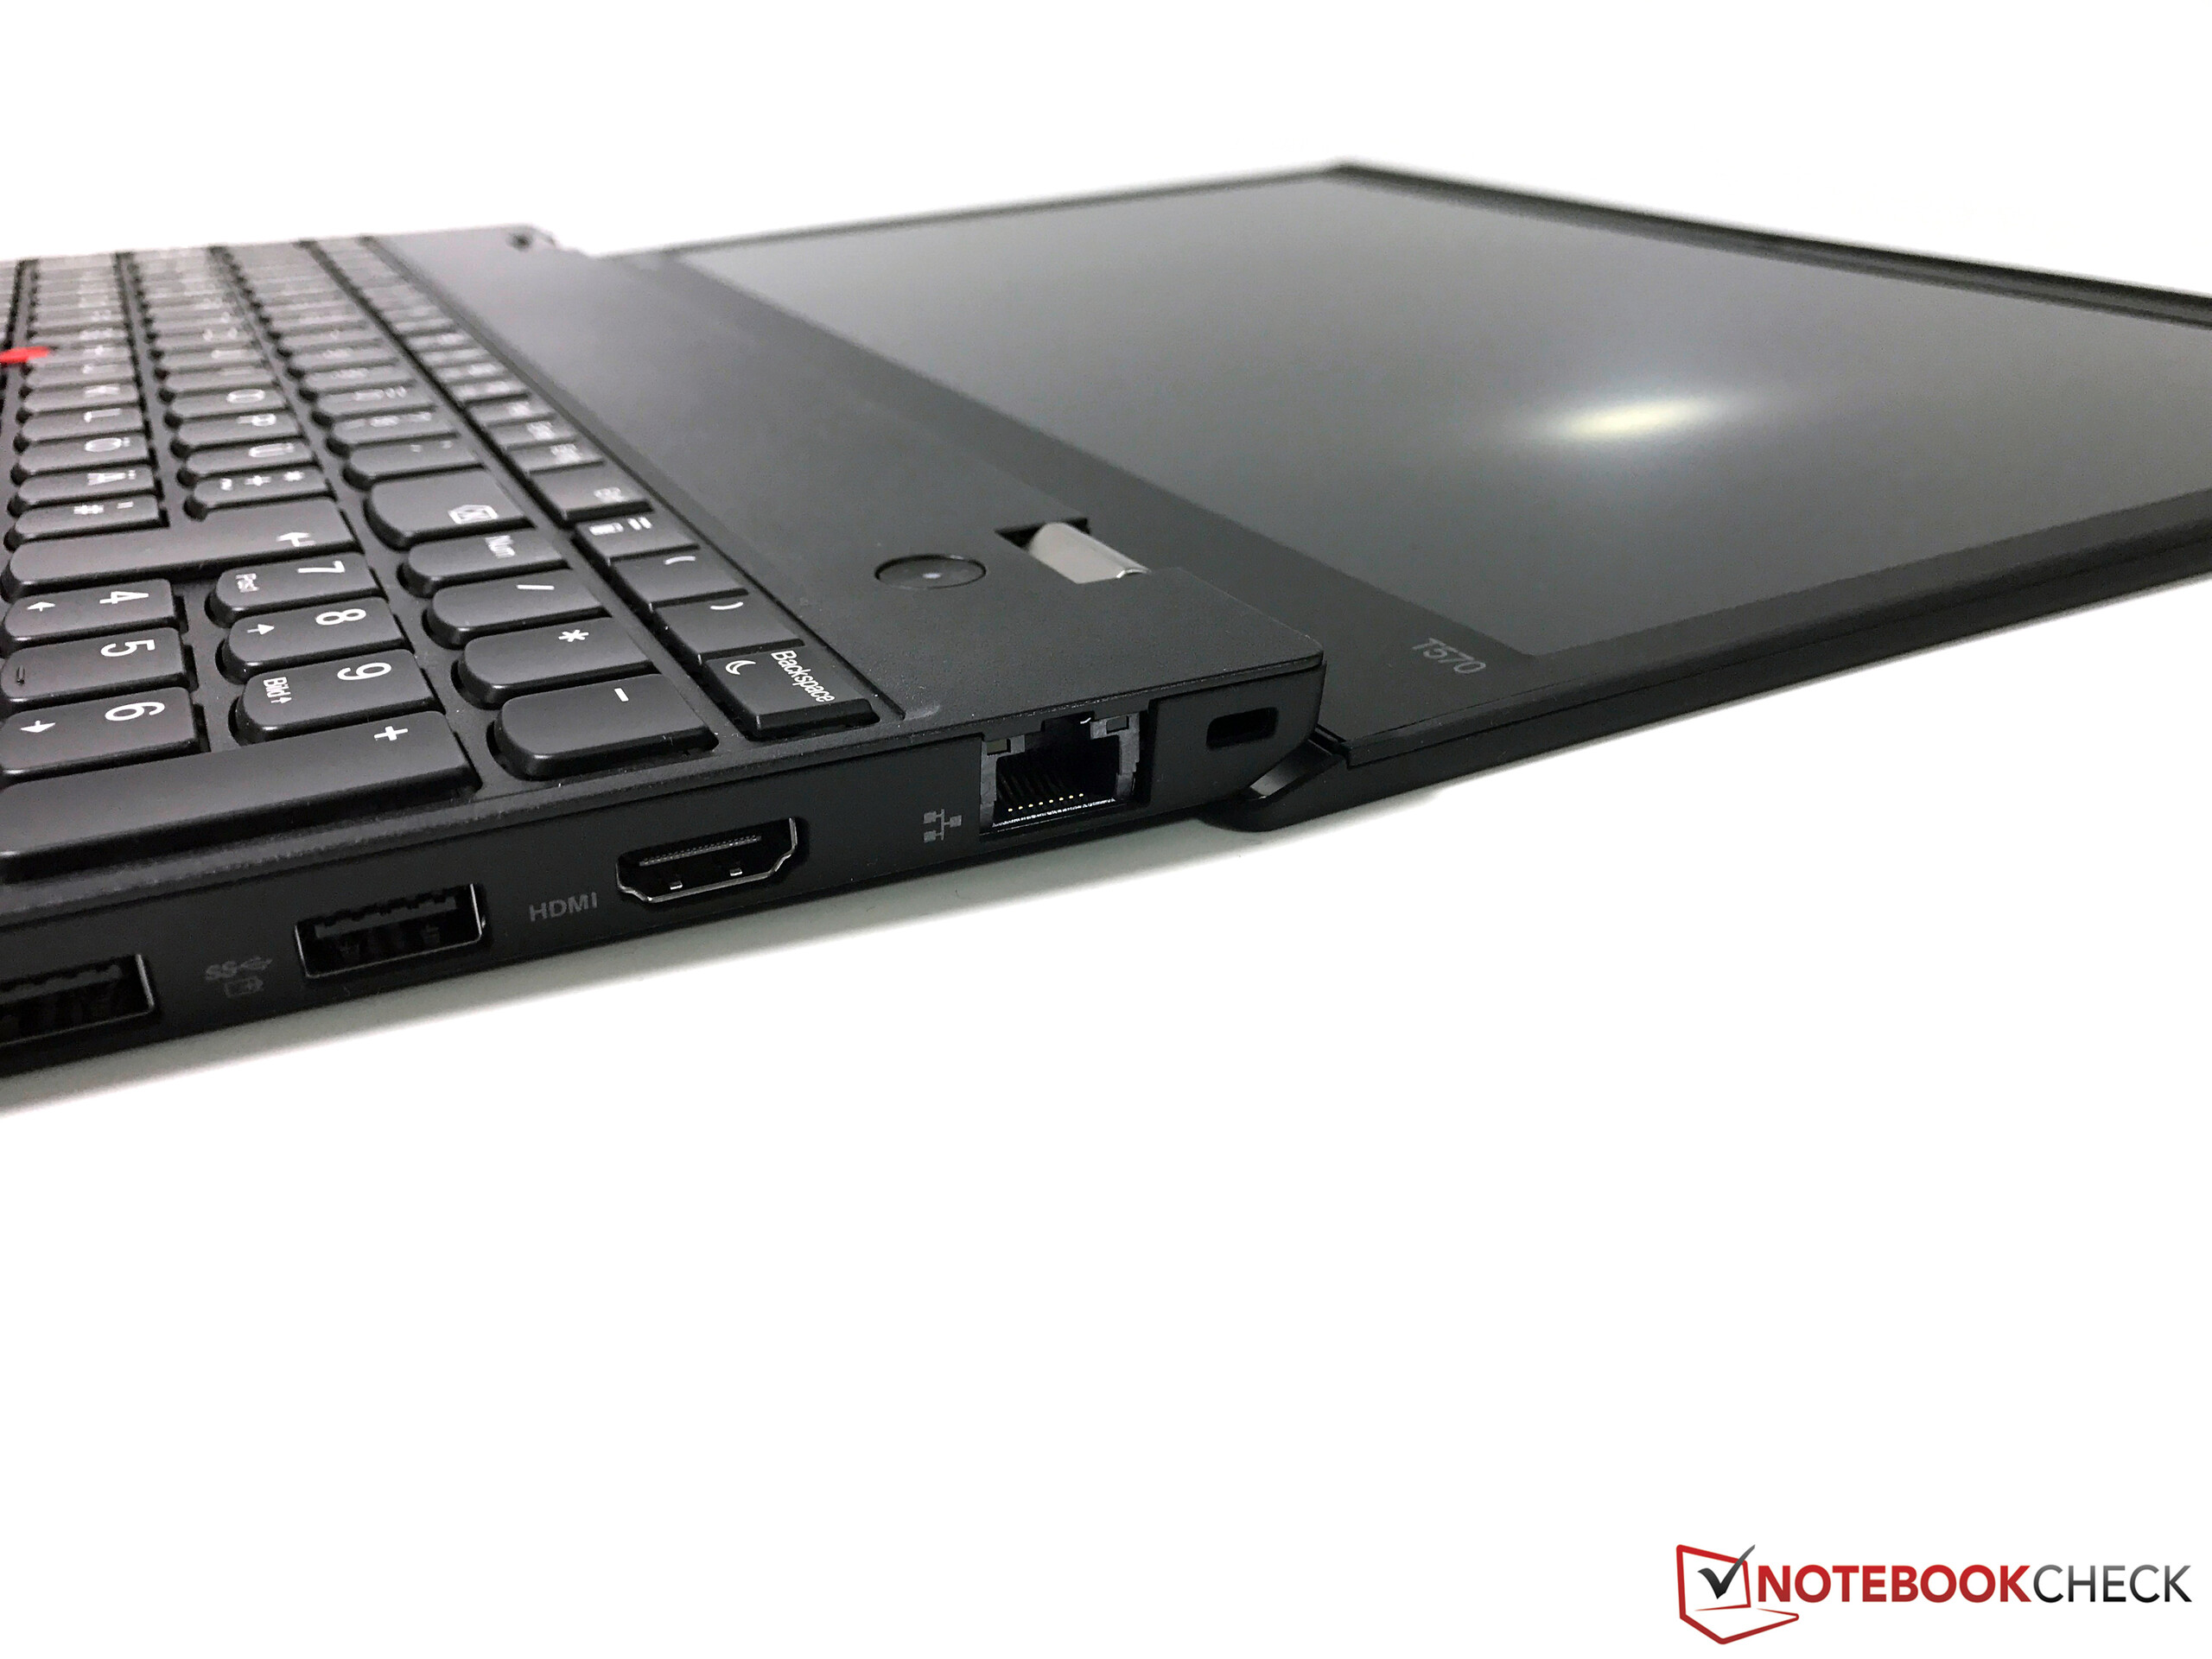
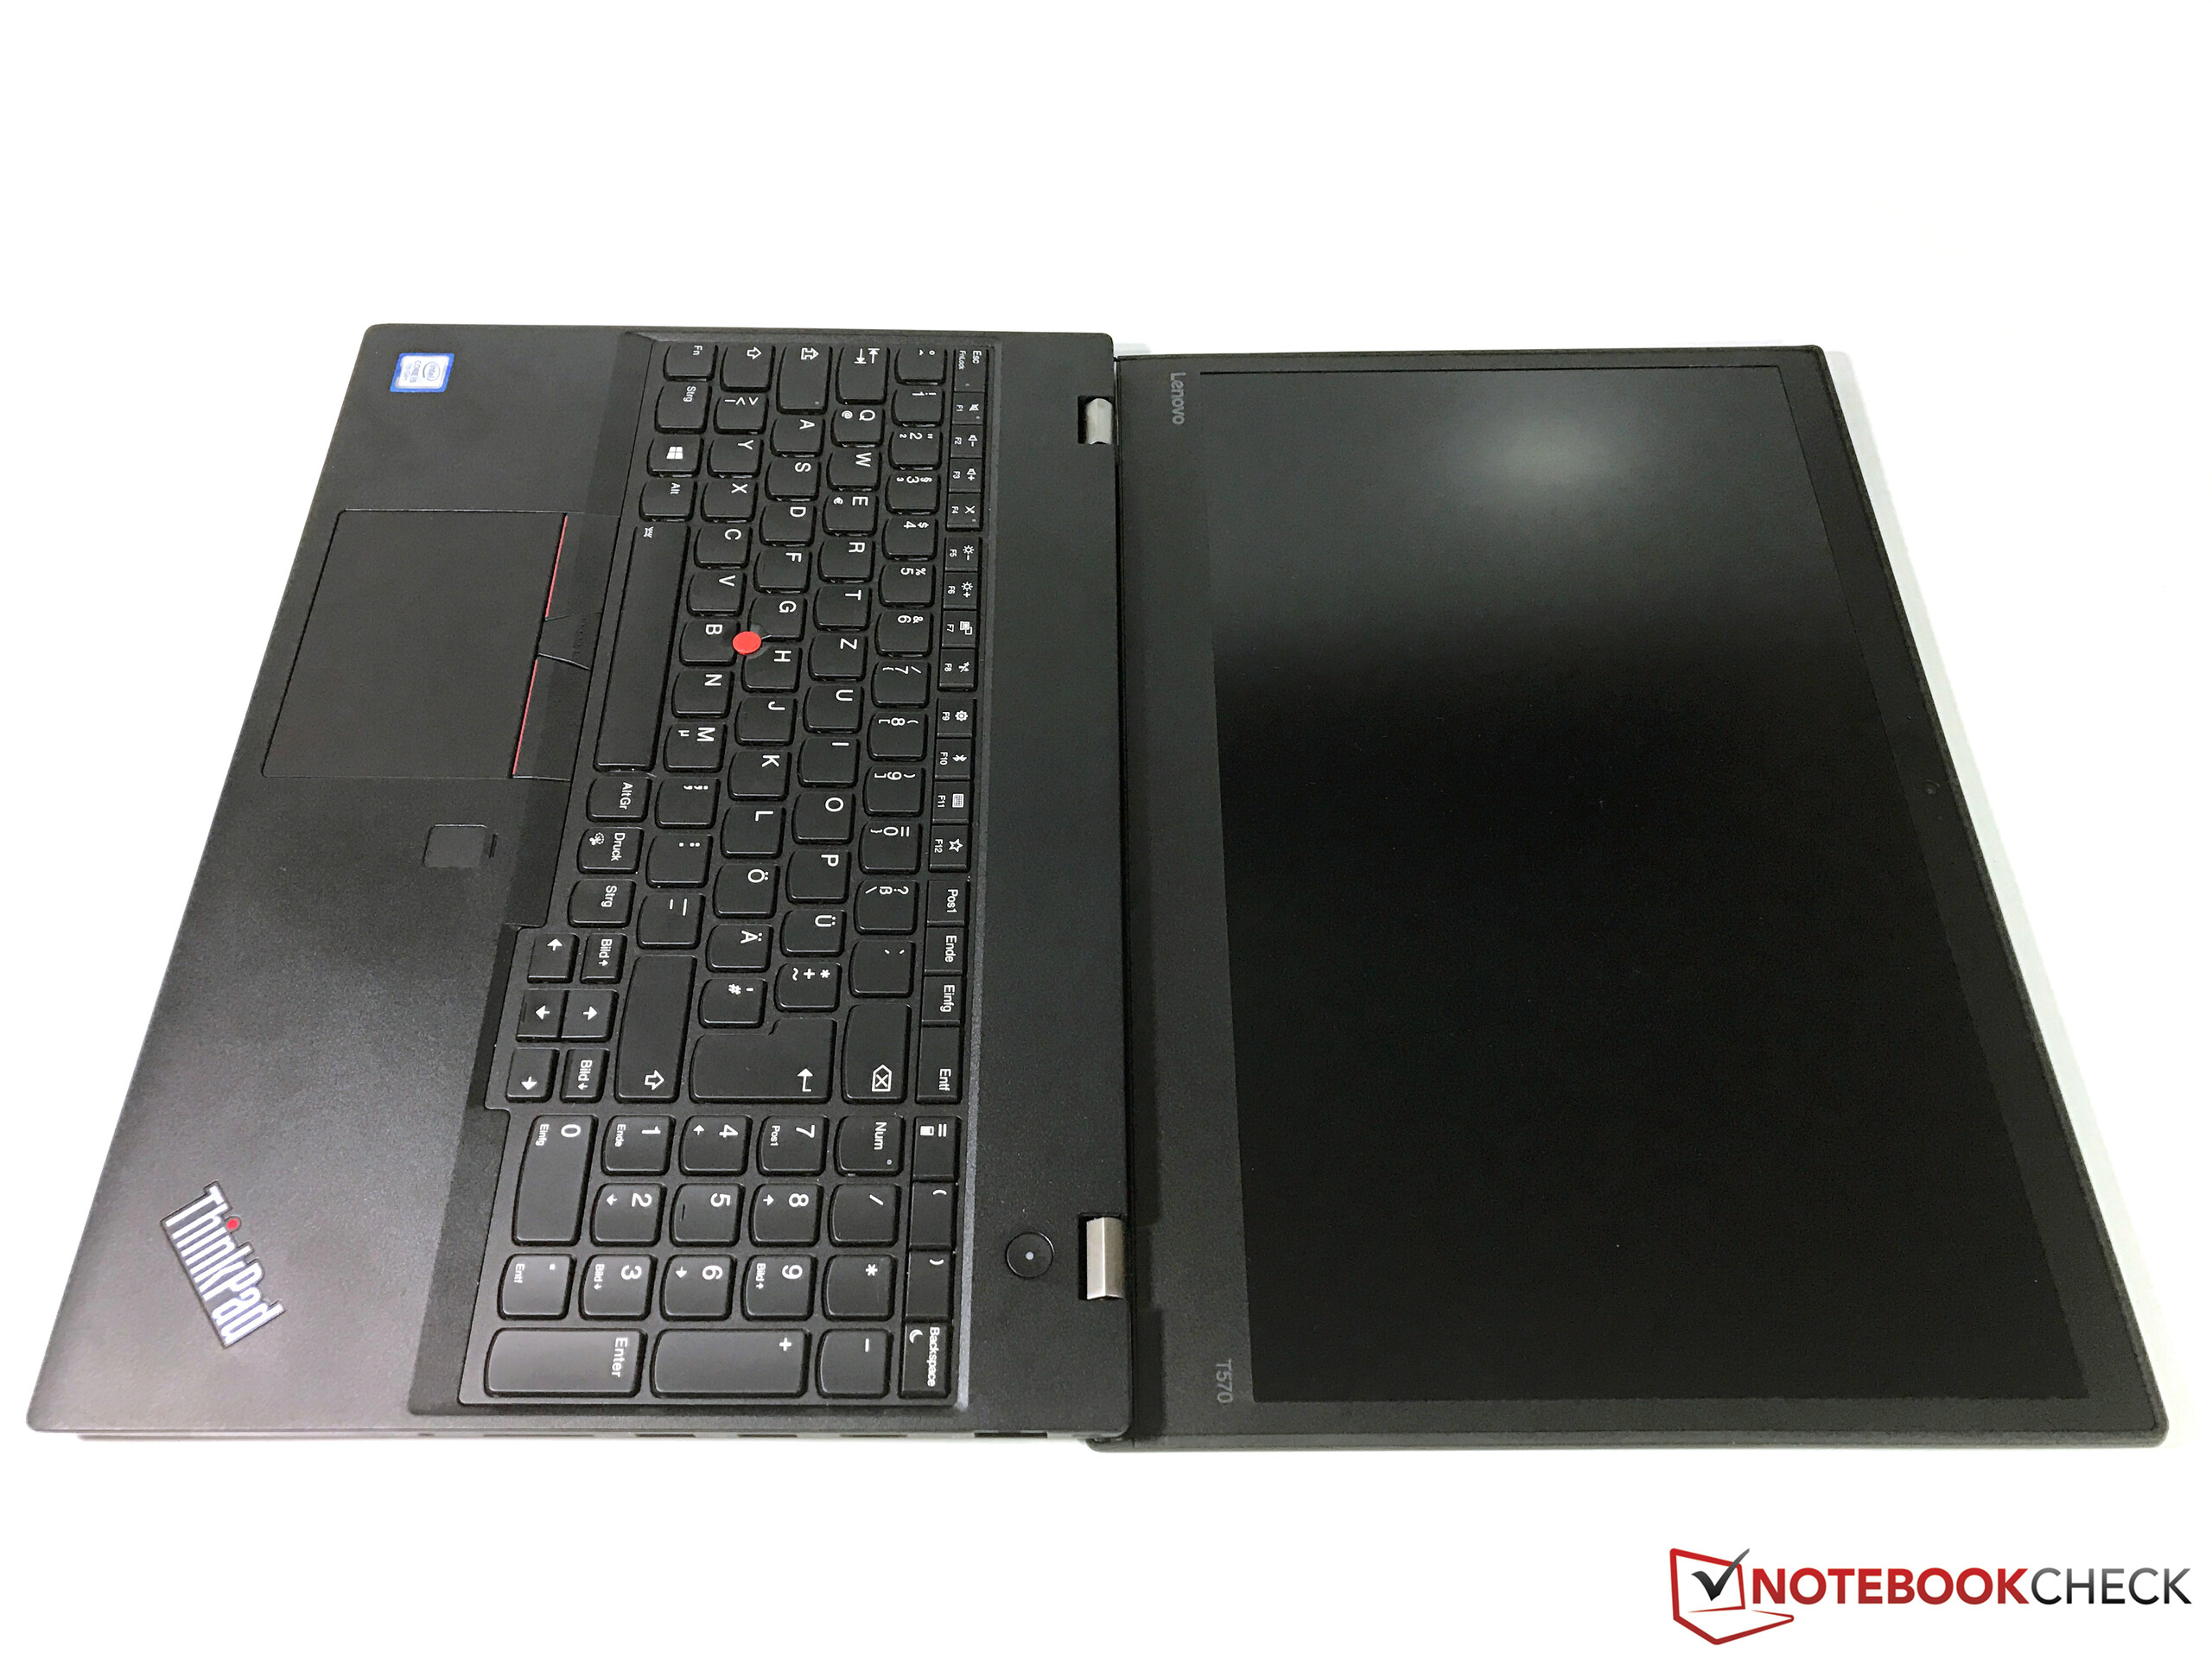
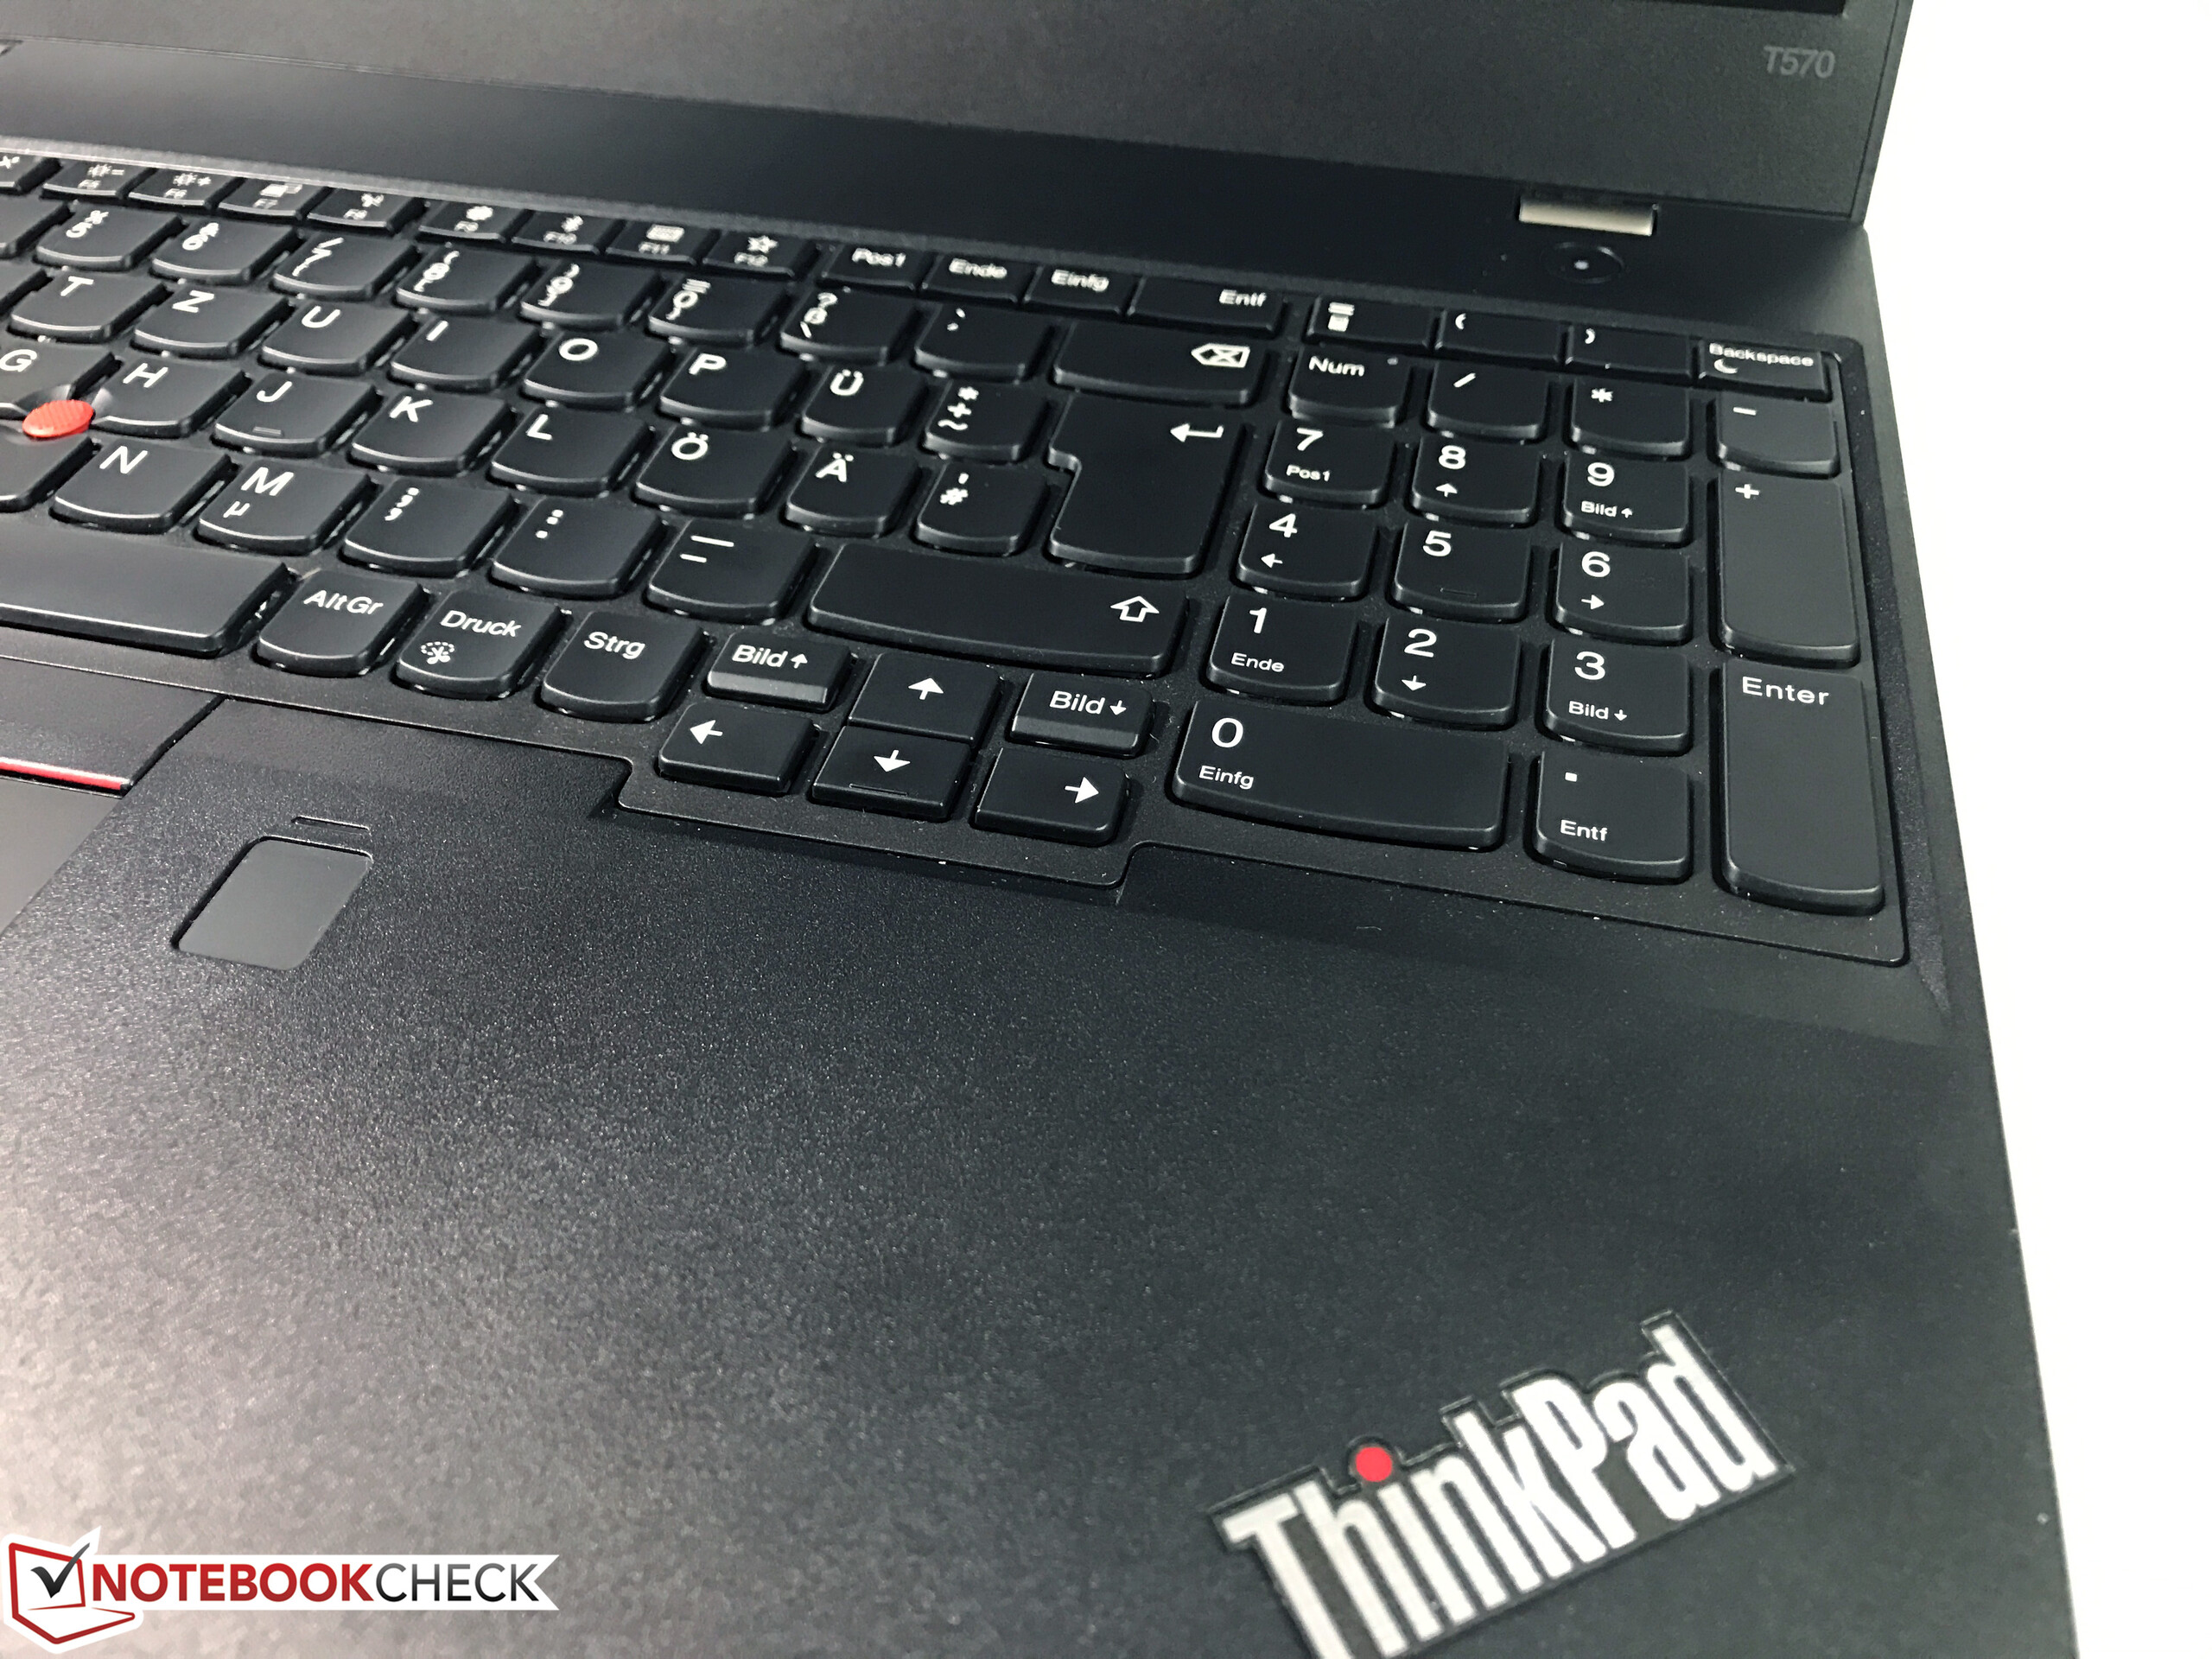
O T570 mais caro, consegue nos convencer, assim como o modelo mais acessível. Ele possui características muito boas que a nossa unidade de teste inicial também teve: a carcaça robusta e relativamente compacta, os confortáveis dispositivos de entrada, bem como as muitas opções de conexão. Recursos práticos como PowerBridge ou a câmera com infravermelhos, tornam o T570 em um portátil muito flexível. Além das vantagens do acessível T570, agora também vem a tela 4K de uma qualidade convincente e a GPU NVIDIA, que, apesar de ser um modelo mais antigo, é consideravelmente mais poderosa que a GPU da Intel integrada na CPU.
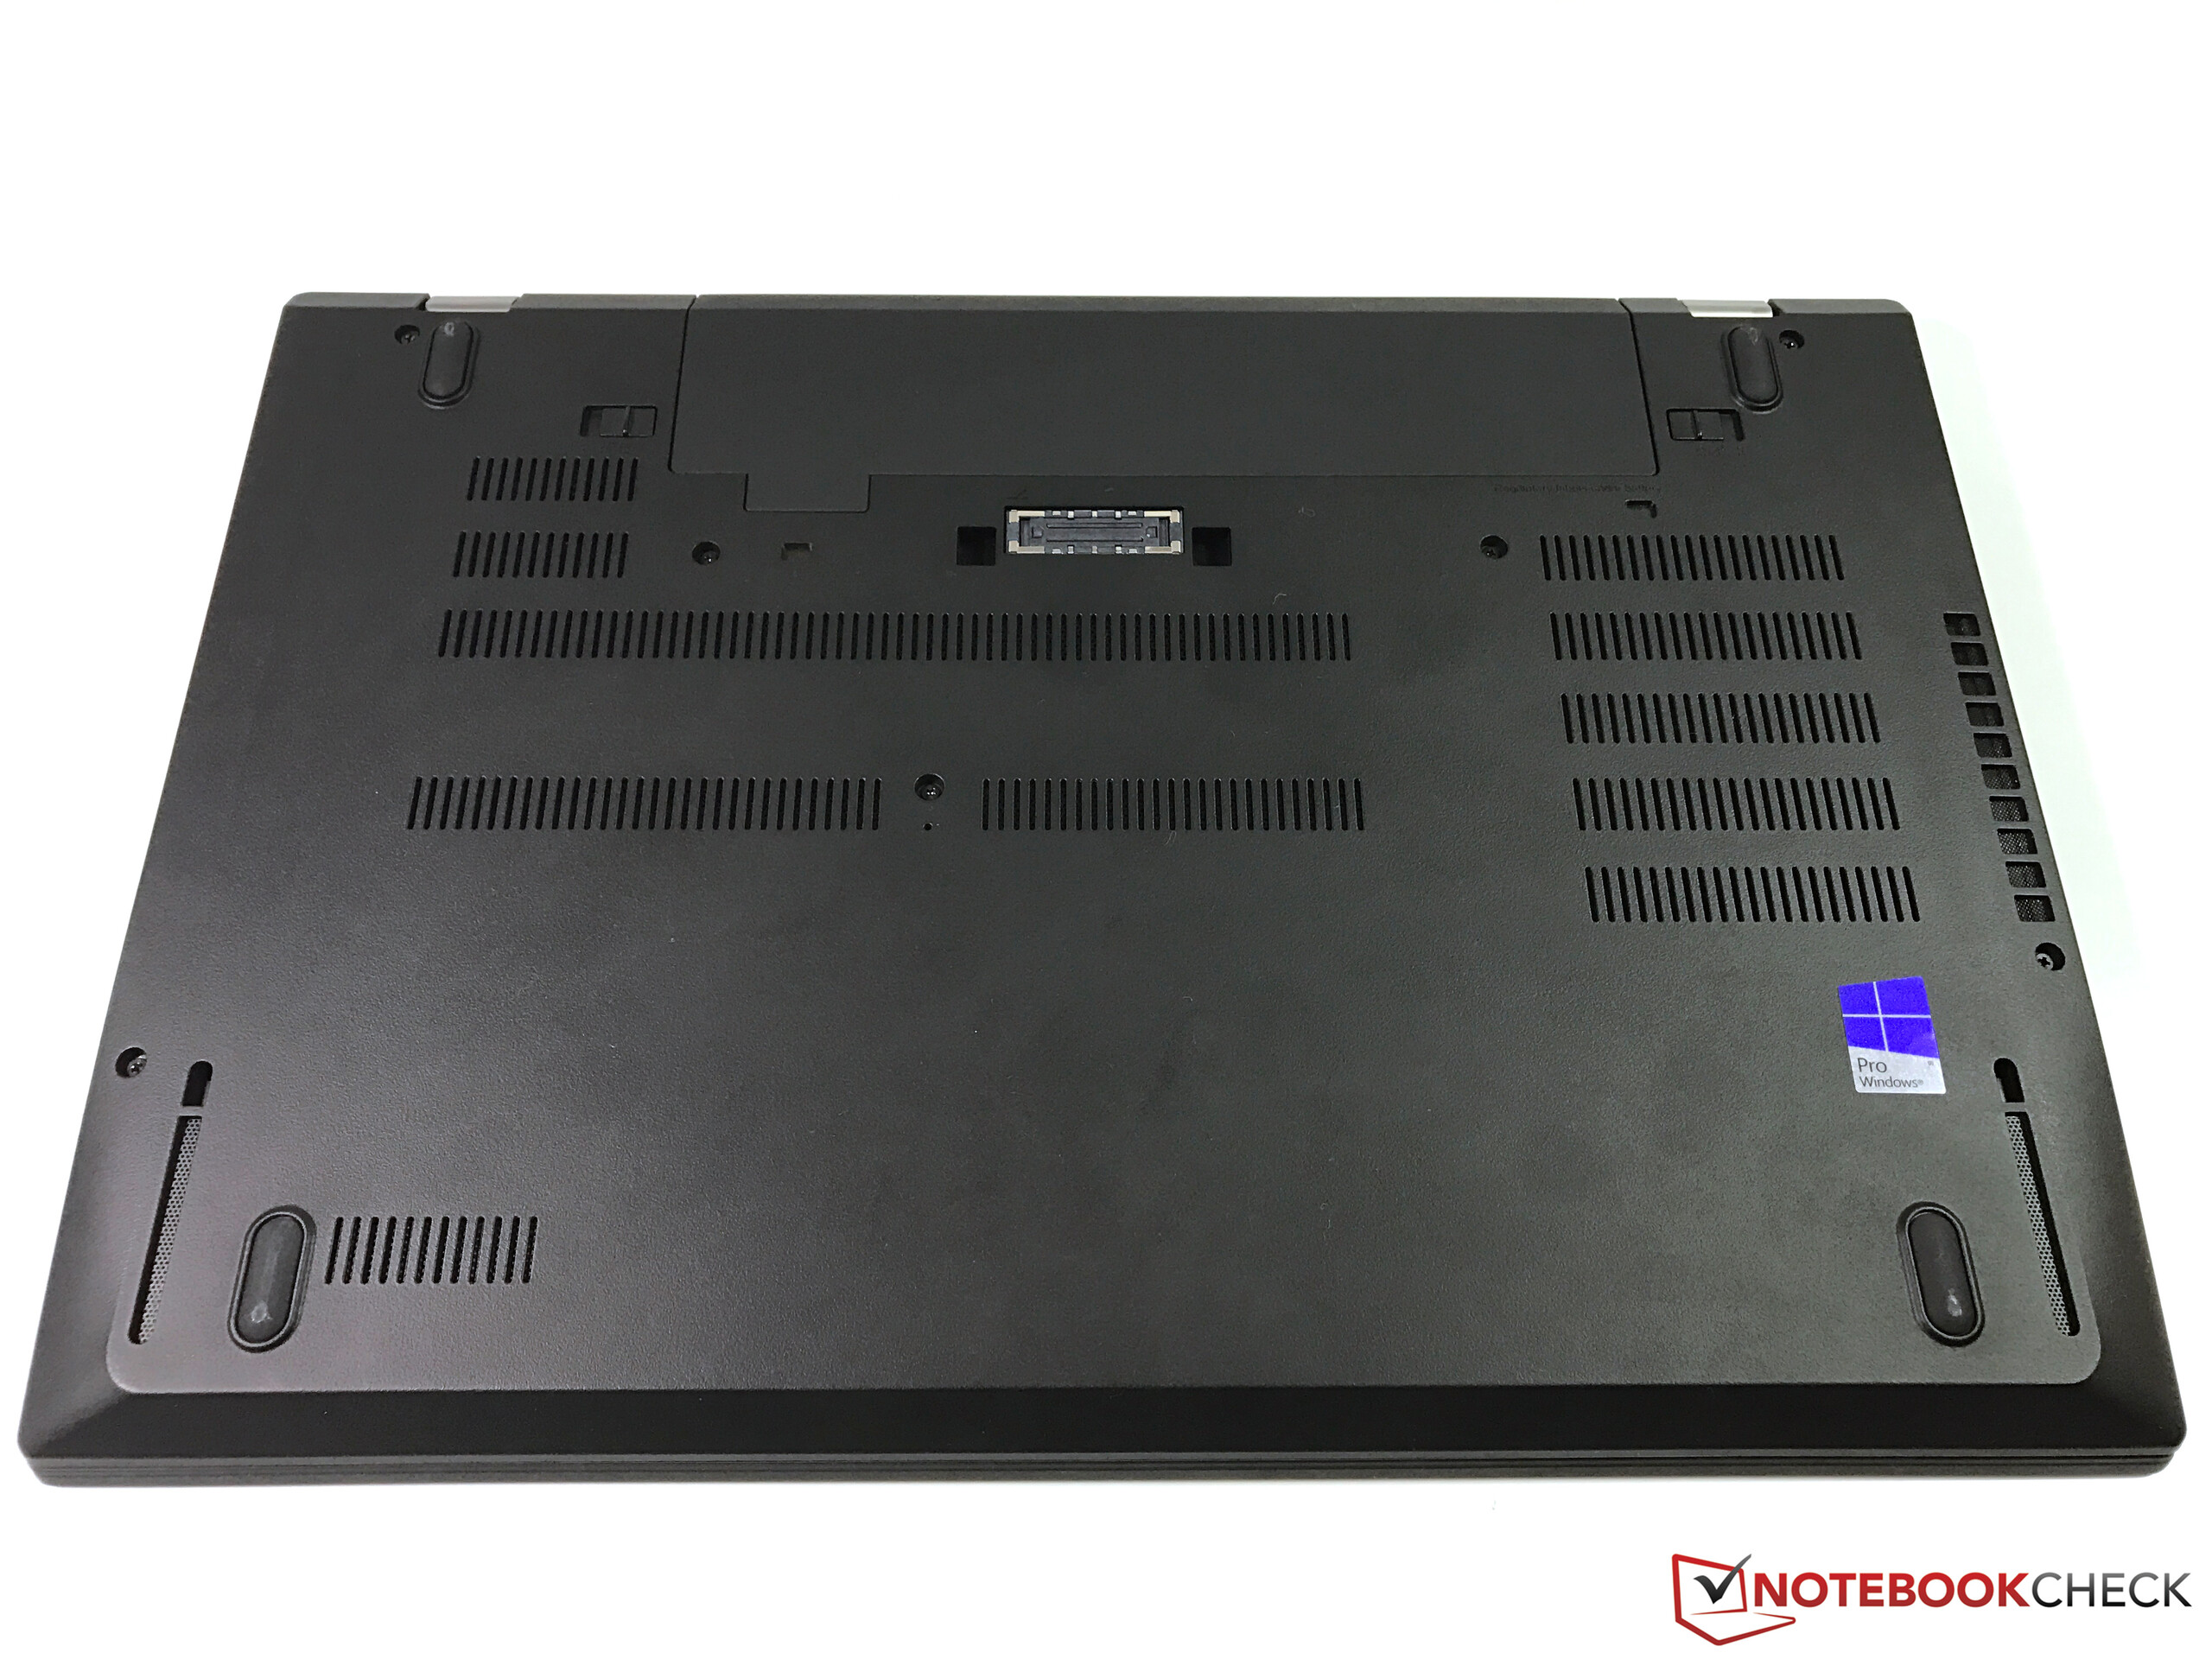
No entanto, este modelo também não é impecável. Nosso maior reclamo e a redução forçado do desempenho da CPU durante a operação com bateria. Durante a operação na tomada, conseguimos evitar as flutuações do desempenho neste modelo com uma modificação nas configurações, mas o desempenho durante a operação com bateria não pode ser incrementado desta forma. Um novo problema adicional é o aquecimento no lado inferior durante o uso intenso, que provavelmente possa ser atribuído à GPU da Nvidia. Em termos deste problema, o T560 se saiu um pouco melhor, talvez por causa de sua carcaça mais grossa e maior. Elém disso, o preço para a versão não-estudante do T570, com tela 4K e GPU Nvidia não é muito acessível, e a fonte de energia fornecida não é suficiente durante o uso intenso.
Com a tela 4K, o T570 apresenta um bom pacote geral e é um candidato promissor no segmento de 15,6 polegadas, dado que oferece uma combinação interessante de recursos empresariais e características multimídia.
Em resumo, o T570 com uma tela 4K, pode ser claramente recomendado. Com esta tela, ele melhorou muito em uma área crucial, onde a unidade de teste inicial tinha decepcionado. Se não fosse pela redução do desempenho durante a operação com bateria, teria atingido uma recomendação "muito boa". Aqui reduzimos a avaliação final em dois pontos percentuais. Com isto, a redução é um pouco menor que para a primeira unidade de teste, dado que desta vez, a GPU não é afetada pela redução do desempenho e a operação na tomada é estável.
Existe infinidade de alternativas com uma tela de 15,6 polegadas, enquanto o setor empresarial, em particular, está mais concentrado no formato de 14 polegadas. O MacBook Pro 15 e o Dell XPS 15 são fortes concorrentes, que não oferecem os recursos empresariais e o excelente teclado do T570, mas opções de GPU e CPU bastantes mais poderosas.
Pro
Contra
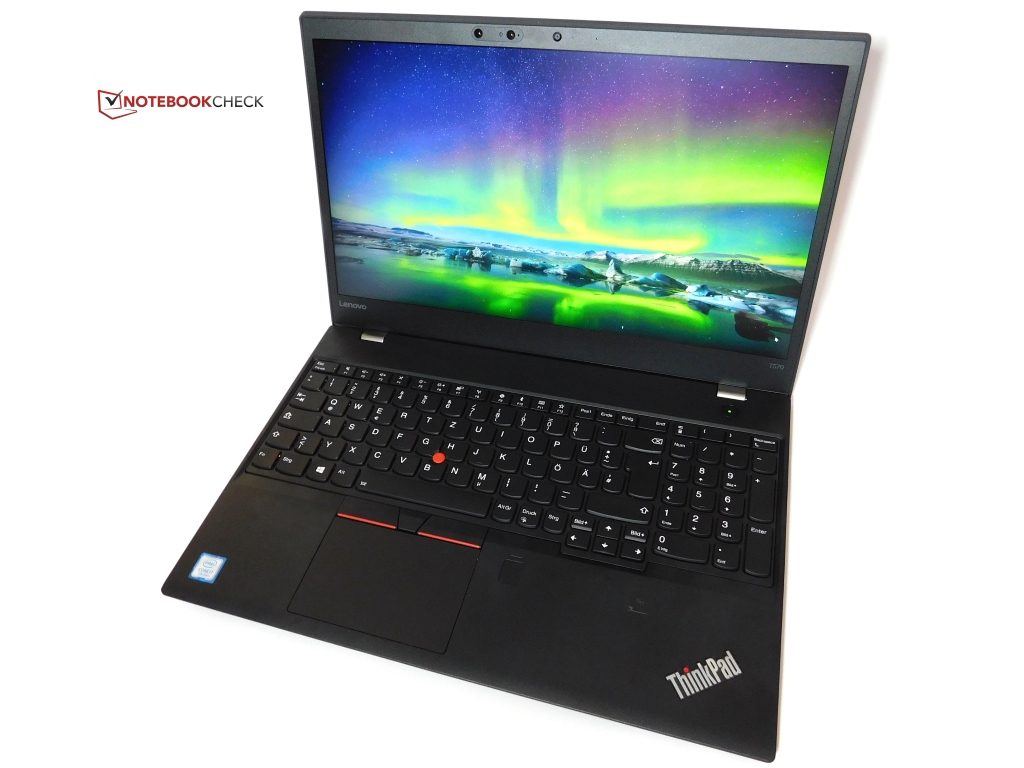
The more expensive T570 can convince us just as much as the more affordable model. It has many good characteristics that our initial test unit also had: the robust, relatively compact case, the comfortable input devices, as well as the many connection options. Practical features such as PowerBridge or the infrared camera turn the T570 into a very flexible laptop. In addition to the advantages from the affordable T570, now also come the 4K display of a convincing quality and the NVIDIA GPU, which, despite being an older model, is considerably more powerful than the Intel GPU integrated into the CPU.
However, this model is also not without problems. Our biggest complaint is the enforced CPU performance reduction during battery operation. During mains operation, we could avoid the performance fluctuations in this model with a settings change, but the performance during battery operation cannot be raised in this way. An added, new problem is the heat development on the bottom during load, which can probably be attributed to the Nvidia GPU. In terms of this problem, the T560 did a little better, perhaps due to its thicker and larger case. In addition, the price for the non-student version of the T570 with 4K display and Nvidia GPU is not really very affordable, and the supplied power supply is not sufficiently sized for operation during load.
With the 4K display, the T570 presents a good overall package and is a promising candidate in the 15.6-inch segment, since it offers an interesting combination of business features and multimedia characteristics.
In summary, the T570 with a 4K display can be clearly recommended. With this display, it was markedly improved in a crucial area where the initial test unit had disappointed. If it were not for the performance reduction during battery operation, it would have achieved a "very good" recommendation. Here we reduce the end note by two percentage points. With this, the reduction is slightly less than for the first test unit, since at this time, the GPU is not affected by the performance reduction and the performance in mains operation is stable.
There are countless alternatives with a 15.6-inch display, whereas the business sector in particular is more concentrated on the 14-inch format. The MacBook Pro 15 and the Dell XPS 15 are strong competitors, which do not offer the business features and the excellent keyboard of the T570, but considerably stronger GPU and CPU options, instead.
Lenovo ThinkPad T570-20HAS01E00
- 04/25/2017 v6 (old)
Benjamin Herzig