Breve Análise do Portátil Lenovo ThinkPad T580 (i7-8650U, FHD)

| SD Card Reader | |
| average JPG Copy Test (av. of 3 runs) | |
| Dell Latitude 5590 (Toshiba Exceria Pro SDXC 64 GB UHS-II) | |
| Dell XPS 15 9570 i7 UHD (Toshiba Exceria Pro SDXC 64 GB UHS-II) | |
| Lenovo ThinkPad T580-20LAS01H00 (Toshiba Exceria Pro SDXC 64 GB UHS-II) | |
| Lenovo ThinkPad T580-20L9001AUS (Toshiba Exceria Pro SDXC 64 GB UHS-II) | |
| Média da turma Office (19.8 - 198.5, n=22, últimos 2 anos) | |
| maximum AS SSD Seq Read Test (1GB) | |
| Dell Latitude 5590 (Toshiba Exceria Pro SDXC 64 GB UHS-II) | |
| Dell XPS 15 9570 i7 UHD (Toshiba Exceria Pro SDXC 64 GB UHS-II) | |
| Lenovo ThinkPad T580-20LAS01H00 (Toshiba Exceria Pro SDXC 64 GB UHS-II) | |
| Lenovo ThinkPad T580-20L9001AUS (Toshiba Exceria Pro SDXC 64 GB UHS-II) | |
| Média da turma Office (27.4 - 249, n=21, últimos 2 anos) | |
| Networking | |
| iperf3 transmit AX12 | |
| Dell XPS 15 9570 i7 UHD | |
| Dell Latitude 5590 | |
| Lenovo ThinkPad T580-20LAS01H00 | |
| Lenovo ThinkPad T580-20L9001AUS | |
| iperf3 receive AX12 | |
| Lenovo ThinkPad T580-20L9001AUS | |
| Lenovo ThinkPad T580-20LAS01H00 | |
| Dell XPS 15 9570 i7 UHD | |
| Dell Latitude 5590 | |
| |||||||||||||||||||||||||
iluminação: 87 %
iluminação com acumulador: 254.5 cd/m²
Contraste: 943:1 (Preto: 0.27 cd/m²)
ΔE ColorChecker Calman: 4.58 | ∀{0.5-29.43 Ø4.72}
calibrated: 4.34
ΔE Greyscale Calman: 3.3 | ∀{0.09-98 Ø4.97}
55% sRGB (Argyll 1.6.3 3D)
35% AdobeRGB 1998 (Argyll 1.6.3 3D)
38.16% AdobeRGB 1998 (Argyll 3D)
55.3% sRGB (Argyll 3D)
36.94% Display P3 (Argyll 3D)
Gamma: 2.403
CCT: 6355 K
| Lenovo ThinkPad T580-20L9001AUS B156HAK02.0, IPS, 15.6", 1920x1080 | Lenovo ThinkPad T580-20LAS01H00 NV156QUM-N44, IPS LED, 15.6", 3840x2160 | Dell Latitude 5590 NV15N42, IPS, 15.6", 1920x1080 | HP EliteBook 850 G4-Z2W86ET AUO35ED, TN LED, 15.6", 1920x1080 | Dell XPS 15 9570 i7 UHD LQ156D1, IPS, 15.6", 3840x2160 | |
|---|---|---|---|---|---|
| Display | 75% | 12% | 53% | 100% | |
| Display P3 Coverage (%) | 36.94 | 69.2 87% | 41.56 13% | 56.8 54% | 79.1 114% |
| sRGB Coverage (%) | 55.3 | 90.7 64% | 61.3 11% | 83.7 51% | 98.8 79% |
| AdobeRGB 1998 Coverage (%) | 38.16 | 66.3 74% | 42.93 13% | 58.7 54% | 79.2 108% |
| Response Times | -31% | -52% | 2% | -28% | |
| Response Time Grey 50% / Grey 80% * (ms) | 33.2 ? | 51.2 ? -54% | 53.2 ? -60% | 47.2 ? -42% | 46.4 ? -40% |
| Response Time Black / White * (ms) | 27.6 ? | 29.6 ? -7% | 39.6 ? -43% | 15.2 ? 45% | 32 ? -16% |
| PWM Frequency (Hz) | 952 ? | 1000 ? | 199.2 ? | 980 ? | |
| Screen | 36% | -6% | -52% | 41% | |
| Brightness middle (cd/m²) | 254.5 | 310 22% | 243 -5% | 338 33% | 494 94% |
| Brightness (cd/m²) | 238 | 283 19% | 234 -2% | 341 43% | 457 92% |
| Brightness Distribution (%) | 87 | 87 0% | 83 -5% | 90 3% | 88 1% |
| Black Level * (cd/m²) | 0.27 | 0.24 11% | 0.19 30% | 0.81 -200% | 0.34 -26% |
| Contrast (:1) | 943 | 1292 37% | 1279 36% | 417 -56% | 1453 54% |
| Colorchecker dE 2000 * | 4.58 | 3.1 32% | 6.6 -44% | 10.9 -138% | 5.2 -14% |
| Colorchecker dE 2000 max. * | 17.99 | 7.6 58% | 22.3 -24% | 18.7 -4% | 17.5 3% |
| Colorchecker dE 2000 calibrated * | 4.34 | 2.2 49% | 5 -15% | ||
| Greyscale dE 2000 * | 3.3 | 2.3 30% | 5.2 -58% | 13.3 -303% | 2.7 18% |
| Gamma | 2.403 92% | 2.21 100% | 2.24 98% | 2.11 104% | 2.1 105% |
| CCT | 6355 102% | 6876 95% | 6990 93% | 16030 41% | 7038 92% |
| Color Space (Percent of AdobeRGB 1998) (%) | 35 | 59.1 69% | 39.2 12% | 53.8 54% | 71.2 103% |
| Color Space (Percent of sRGB) (%) | 55 | 90.1 64% | 60.8 11% | 83.4 52% | 98.8 80% |
| Média Total (Programa/Configurações) | 27% /
35% | -15% /
-8% | 1% /
-24% | 38% /
43% |
* ... menor é melhor
Exibir tempos de resposta
| ↔ Tempo de resposta preto para branco | ||
|---|---|---|
| 27.6 ms ... ascensão ↗ e queda ↘ combinadas | ↗ 14.8 ms ascensão | 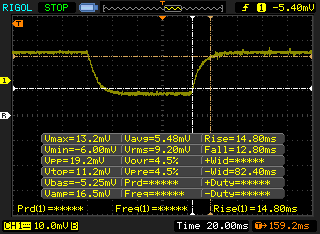 |
| ↘ 12.8 ms queda | ||
| A tela mostra taxas de resposta relativamente lentas em nossos testes e pode ser muito lenta para os jogadores. Em comparação, todos os dispositivos testados variam de 0.1 (mínimo) a 240 (máximo) ms. » 70 % de todos os dispositivos são melhores. Isso significa que o tempo de resposta medido é pior que a média de todos os dispositivos testados (19.8 ms). | ||
| ↔ Tempo de resposta 50% cinza a 80% cinza | ||
| 33.2 ms ... ascensão ↗ e queda ↘ combinadas | ↗ 15.6 ms ascensão | 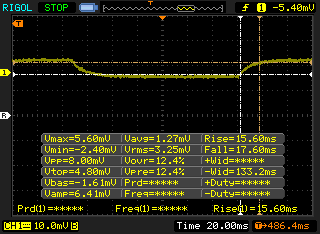 |
| ↘ 17.6 ms queda | ||
| A tela mostra taxas de resposta lentas em nossos testes e será insatisfatória para os jogadores. Em comparação, todos os dispositivos testados variam de 0.165 (mínimo) a 636 (máximo) ms. » 46 % de todos os dispositivos são melhores. Isso significa que o tempo de resposta medido é semelhante à média de todos os dispositivos testados (31 ms). | ||
Cintilação da tela / PWM (modulação por largura de pulso)
| Tela tremeluzindo / PWM não detectado | 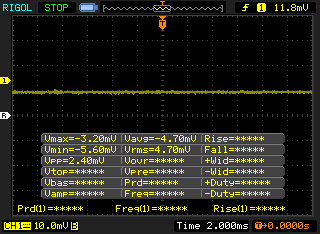 | ||
[pwm_comparison] Em comparação: 52 % de todos os dispositivos testados não usam PWM para escurecer a tela. Se PWM foi detectado, uma média de 7769 (mínimo: 5 - máximo: 343500) Hz foi medida. | |||
| Cinebench R15 | |
| CPU Single 64Bit | |
| Média da turma Office (99.5 - 312, n=75, últimos 2 anos) | |
| Dell XPS 15 9570 i7 UHD | |
| Lenovo ThinkPad T580-20L9001AUS | |
| Média Intel Core i7-8650U (128 - 178, n=17) | |
| Lenovo ThinkPad T580-20LAS01H00 | |
| Dell Latitude 5590 | |
| HP EliteBook 850 G4 Z8W50EA | |
| CPU Multi 64Bit | |
| Média da turma Office (250 - 3380, n=75, últimos 2 anos) | |
| Dell XPS 15 9570 i7 UHD | |
| Dell XPS 15 9570 i7 UHD | |
| Dell Latitude 5590 | |
| Lenovo ThinkPad T580-20LAS01H00 | |
| Lenovo ThinkPad T580-20L9001AUS | |
| Média Intel Core i7-8650U (451 - 675, n=19) | |
| HP EliteBook 850 G4 Z8W50EA | |
| PCMark 8 | |
| Home Score Accelerated v2 | |
| Média da turma Office (n=1últimos 2 anos) | |
| Dell Latitude 5590 | |
| Lenovo ThinkPad T580-20L9001AUS | |
| Média Intel Core i7-8650U, Intel UHD Graphics 620 (3216 - 4103, n=10) | |
| Dell XPS 15 9570 i7 UHD | |
| Lenovo ThinkPad T580-20LAS01H00 | |
| Work Score Accelerated v2 | |
| Média da turma Office (n=1últimos 2 anos) | |
| Lenovo ThinkPad T580-20L9001AUS | |
| Média Intel Core i7-8650U, Intel UHD Graphics 620 (3926 - 5200, n=8) | |
| Dell Latitude 5590 | |
| Dell XPS 15 9570 i7 UHD | |
| Lenovo ThinkPad T580-20LAS01H00 | |
| PCMark 8 Home Score Accelerated v2 | 3728 pontos | |
| PCMark 8 Work Score Accelerated v2 | 5038 pontos | |
| PCMark 10 Score | 3933 pontos | |
Ajuda | ||
| Lenovo ThinkPad T580-20L9001AUS Samsung SSD PM981 MZVLB512HAJQ | Lenovo ThinkPad T580-20LAS01H00 Samsung SSD PM981 MZVLB512HAJQ | Dell Latitude 5590 SK hynix SC311 M.2 | HP EliteBook 850 G4 Z8W50EA Samsung PM961 NVMe MZVLW512HMJP | Média Samsung SSD PM981 MZVLB512HAJQ | |
|---|---|---|---|---|---|
| AS SSD | -3% | -69% | 13% | -3% | |
| Score Total (Points) | 3587 | 3548 -1% | 912 -75% | 3789 6% | 3966 ? 11% |
| Score Write (Points) | 1564 | 1515 -3% | 326 -79% | 1291 -17% | 1780 ? 14% |
| Score Read (Points) | 1336 | 1342 0% | 385 -71% | 1681 26% | 1451 ? 9% |
| Access Time Write * (ms) | 0.035 | 0.033 6% | 0.047 -34% | 0.031 11% | 0.08337 ? -138% |
| Access Time Read * (ms) | 0.047 | 0.059 -26% | 0.111 -136% | 0.037 21% | 0.05092 ? -8% |
| 4K-64 Write (MB/s) | 1325 | 1278 -4% | 212.7 -84% | 1017 -23% | 1504 ? 14% |
| 4K-64 Read (MB/s) | 1140 | 1153 1% | 306 -73% | 1382 21% | 1203 ? 6% |
| 4K Write (MB/s) | 106.2 | 110.9 4% | 73.5 -31% | 120.6 14% | 112 ? 5% |
| 4K Read (MB/s) | 50.8 | 51.5 1% | 29.03 -43% | 49.34 -3% | 50.5 ? -1% |
| Seq Write (MB/s) | 1324 | 1262 -5% | 393 -70% | 1538 16% | 1637 ? 24% |
| Seq Read (MB/s) | 1454 | 1373 -6% | 503 -65% | 2497 72% | 1976 ? 36% |
* ... menor é melhor

| 3DMark 11 | |
| 1280x720 Performance GPU | |
| Dell XPS 15 9570 i7 UHD | |
| Média da turma Office (2551 - 18313, n=69, últimos 2 anos) | |
| Lenovo ThinkPad T580-20LAS01H00 | |
| Lenovo ThinkPad T580-20L9001AUS | |
| Média Intel UHD Graphics 620 (1144 - 3432, n=244) | |
| Dell Latitude 5590 | |
| HP EliteBook 850 G4 Z8W50EA | |
| 1280x720 Performance Combined | |
| Dell XPS 15 9570 i7 UHD | |
| Média da turma Office (2054 - 16787, n=69, últimos 2 anos) | |
| Lenovo ThinkPad T580-20LAS01H00 | |
| Média Intel UHD Graphics 620 (927 - 2505, n=244) | |
| Lenovo ThinkPad T580-20L9001AUS | |
| Dell Latitude 5590 | |
| HP EliteBook 850 G4 Z8W50EA | |
| 3DMark | |
| 1280x720 Cloud Gate Standard Graphics | |
| Média da turma Office (11640 - 118515, n=37, últimos 2 anos) | |
| Lenovo ThinkPad T580-20LAS01H00 | |
| Média Intel UHD Graphics 620 (6205 - 16400, n=225) | |
| Lenovo ThinkPad T580-20L9001AUS | |
| Dell Latitude 5590 | |
| HP EliteBook 850 G4 Z8W50EA | |
| 1920x1080 Fire Strike Graphics | |
| Dell XPS 15 9570 i7 UHD | |
| Média da turma Office (736 - 21871, n=73, últimos 2 anos) | |
| Lenovo ThinkPad T580-20LAS01H00 | |
| Média Intel UHD Graphics 620 (557 - 2608, n=213) | |
| Lenovo ThinkPad T580-20L9001AUS | |
| Dell Latitude 5590 | |
| HP EliteBook 850 G4 Z8W50EA | |
| 1920x1080 Ice Storm Extreme Graphics | |
| Média da turma Office (80312 - 156297, n=5, últimos 2 anos) | |
| Dell Latitude 5590 | |
| Média Intel UHD Graphics 620 (26409 - 59483, n=71) | |
| HP EliteBook 850 G4 Z8W50EA | |
| 3DMark 11 Performance | 1966 pontos | |
| 3DMark Cloud Gate Standard Score | 8240 pontos | |
| 3DMark Fire Strike Score | 1015 pontos | |
Ajuda | ||
| BioShock Infinite | |
| 1280x720 Very Low Preset (classificar por valor) | |
| Lenovo ThinkPad T580-20L9001AUS | |
| Lenovo ThinkPad T580-20LAS01H00 | |
| Dell Latitude 5590 | |
| HP EliteBook 850 G4 Z8W50EA | |
| Dell XPS 15 9570 i7 UHD | |
| Média Intel UHD Graphics 620 (18.3 - 90.2, n=187) | |
| 1366x768 Medium Preset (classificar por valor) | |
| Lenovo ThinkPad T580-20L9001AUS | |
| Lenovo ThinkPad T580-20LAS01H00 | |
| Dell Latitude 5590 | |
| HP EliteBook 850 G4 Z8W50EA | |
| Dell XPS 15 9570 i7 UHD | |
| Média Intel UHD Graphics 620 (11.5 - 45.5, n=187) | |
| 1366x768 High Preset (classificar por valor) | |
| Lenovo ThinkPad T580-20L9001AUS | |
| Lenovo ThinkPad T580-20LAS01H00 | |
| Dell Latitude 5590 | |
| HP EliteBook 850 G4 Z8W50EA | |
| Dell XPS 15 9570 i7 UHD | |
| Média Intel UHD Graphics 620 (8.1 - 35.9, n=187) | |
| 1920x1080 Ultra Preset, DX11 (DDOF) (classificar por valor) | |
| Lenovo ThinkPad T580-20L9001AUS | |
| Lenovo ThinkPad T580-20LAS01H00 | |
| Dell Latitude 5590 | |
| HP EliteBook 850 G4 Z8W50EA | |
| Dell XPS 15 9570 i7 UHD | |
| Média Intel UHD Graphics 620 (4.5 - 17, n=176) | |
| baixo | média | alto | ultra | |
|---|---|---|---|---|
| BioShock Infinite (2013) | 60 | 27 | 22 | 8 |
Barulho
| Ocioso |
| 28.6 / 28.6 / 28.6 dB |
| Carga |
| 37.4 / 40 dB |
 | ||
30 dB silencioso 40 dB(A) audível 50 dB(A) ruidosamente alto |
||
min: | ||
| Lenovo ThinkPad T580-20L9001AUS UHD Graphics 620, i7-8650U, Samsung SSD PM981 MZVLB512HAJQ | Lenovo ThinkPad T580-20LAS01H00 GeForce MX150, i5-8550U, Samsung SSD PM981 MZVLB512HAJQ | Dell Latitude 5590 UHD Graphics 620, i5-8250U, SK hynix SC311 M.2 | HP EliteBook 850 G4 Z8W50EA HD Graphics 620, i5-7200U, Samsung PM961 NVMe MZVLW512HMJP | Dell XPS 15 2018 i5 FHD 97Wh GeForce GTX 1050 Mobile, i5-8300H, Lite-On CA3-8D256-Q11 | |
|---|---|---|---|---|---|
| Noise | -1% | -2% | 2% | -5% | |
| desligado / ambiente * (dB) | 28.6 | 29.3 -2% | 29 -1% | 30.3 -6% | |
| Idle Minimum * (dB) | 28.6 | 29.3 -2% | 29 -1% | 30 -5% | 30.3 -6% |
| Idle Average * (dB) | 28.6 | 29.3 -2% | 29 -1% | 30 -5% | 30.3 -6% |
| Idle Maximum * (dB) | 28.6 | 31.8 -11% | 31.3 -9% | 30 -5% | 30.3 -6% |
| Load Average * (dB) | 37.4 | 35.8 4% | 36.6 2% | 33.2 11% | 37.1 1% |
| Load Maximum * (dB) | 40 | 38 5% | 40.9 -2% | 34.2 14% | 43 -8% |
| Witcher 3 ultra * (dB) | 35.8 | 43.3 |
* ... menor é melhor
(+) A temperatura máxima no lado superior é 39 °C / 102 F, em comparação com a média de 34.3 °C / 94 F , variando de 21.2 a 62.5 °C para a classe Office.
(-) A parte inferior aquece até um máximo de 56 °C / 133 F, em comparação com a média de 36.8 °C / 98 F
(+) Em uso inativo, a temperatura média para o lado superior é 26.4 °C / 80 F, em comparação com a média do dispositivo de 29.5 °C / ### class_avg_f### F.
(+) Os apoios para as mãos e o touchpad são mais frios que a temperatura da pele, com um máximo de 31.8 °C / 89.2 F e, portanto, são frios ao toque.
(-) A temperatura média da área do apoio para as mãos de dispositivos semelhantes foi 27.5 °C / 81.5 F (-4.3 °C / -7.7 F).
Lenovo ThinkPad T580-20L9001AUS análise de áudio
(±) | o volume do alto-falante é médio, mas bom (###valor### dB)
Graves 100 - 315Hz
(±) | graves reduzidos - em média 7.5% menor que a mediana
(±) | a linearidade dos graves é média (7.8% delta para a frequência anterior)
Médios 400 - 2.000 Hz
(+) | médios equilibrados - apenas 3.6% longe da mediana
(±) | a linearidade dos médios é média (7% delta para frequência anterior)
Altos 2 - 16 kHz
(+) | agudos equilibrados - apenas 2.3% longe da mediana
(±) | a linearidade dos máximos é média (8.3% delta para frequência anterior)
Geral 100 - 16.000 Hz
(+) | o som geral é linear (12.7% diferença em relação à mediana)
Comparado com a mesma classe
» 5% de todos os dispositivos testados nesta classe foram melhores, 2% semelhantes, 93% piores
» O melhor teve um delta de 7%, a média foi 21%, o pior foi 53%
Comparado com todos os dispositivos testados
» 12% de todos os dispositivos testados foram melhores, 3% semelhantes, 86% piores
» O melhor teve um delta de 4%, a média foi 24%, o pior foi 134%
Dell Latitude 5590 análise de áudio
(+) | os alto-falantes podem tocar relativamente alto (###valor### dB)
Graves 100 - 315Hz
(-) | quase nenhum baixo - em média 17.3% menor que a mediana
(±) | a linearidade dos graves é média (9.3% delta para a frequência anterior)
Médios 400 - 2.000 Hz
(±) | médios mais altos - em média 5.4% maior que a mediana
(+) | médios são lineares (4.6% delta para frequência anterior)
Altos 2 - 16 kHz
(+) | agudos equilibrados - apenas 3.4% longe da mediana
(+) | os máximos são lineares (4.5% delta da frequência anterior)
Geral 100 - 16.000 Hz
(±) | a linearidade do som geral é média (16.3% diferença em relação à mediana)
Comparado com a mesma classe
» 19% de todos os dispositivos testados nesta classe foram melhores, 7% semelhantes, 74% piores
» O melhor teve um delta de 7%, a média foi 21%, o pior foi 53%
Comparado com todos os dispositivos testados
» 27% de todos os dispositivos testados foram melhores, 6% semelhantes, 68% piores
» O melhor teve um delta de 4%, a média foi 24%, o pior foi 134%
| desligado | |
| Ocioso | |
| Carga |
|
Key:
min: | |
| Lenovo ThinkPad T580-20L9001AUS i7-8650U, UHD Graphics 620, Samsung SSD PM981 MZVLB512HAJQ, IPS, 1920x1080, 15.6" | Lenovo ThinkPad T580-20LAS01H00 i5-8550U, GeForce MX150, Samsung SSD PM981 MZVLB512HAJQ, IPS LED, 3840x2160, 15.6" | Dell Latitude 5590 i5-8250U, UHD Graphics 620, SK hynix SC311 M.2, IPS, 1920x1080, 15.6" | HP EliteBook 850 G4 Z8W50EA i5-7200U, HD Graphics 620, Samsung PM961 NVMe MZVLW512HMJP, , 1920x1080, 15.6" | Dell XPS 15 2018 i5 FHD 97Wh i5-8300H, GeForce GTX 1050 Mobile, Lite-On CA3-8D256-Q11, LED IGZO IPS InfinityEdge, 1920x1080, 15.6" | |
|---|---|---|---|---|---|
| Power Consumption | -24% | 7% | 32% | -17% | |
| Idle Minimum * (Watt) | 4.7 | 5.3 -13% | 3.6 23% | 2.4 49% | 2.9 38% |
| Idle Average * (Watt) | 7.9 | 10.2 -29% | 6.5 18% | 6.1 23% | 5.8 27% |
| Idle Maximum * (Watt) | 11.4 | 13.6 -19% | 7.2 37% | 10 12% | 7.5 34% |
| Load Average * (Watt) | 47.2 | 58.3 -24% | 46.2 2% | 27.2 42% | 77.5 -64% |
| Load Maximum * (Watt) | 48.1 | 65.3 -36% | 68.8 -43% | 32 33% | 107 -122% |
| Witcher 3 ultra * (Watt) | 47.8 | 84 |
* ... menor é melhor
| Lenovo ThinkPad T580-20L9001AUS i7-8650U, UHD Graphics 620, 56 Wh | Lenovo ThinkPad T580-20LAS01H00 i5-8550U, GeForce MX150, 105 Wh | Dell Latitude 5590 i5-8250U, UHD Graphics 620, 51 Wh | HP EliteBook 850 G4 Z8W50EA i5-7200U, HD Graphics 620, 51.3 Wh | Dell XPS 15 9570 i7 UHD i7-8750H, GeForce GTX 1050 Ti Max-Q, 97 Wh | |
|---|---|---|---|---|---|
| Duração da bateria | 107% | 76% | 129% | ||
| WiFi v1.3 (h) | 4.2 | 8.7 107% | 7.4 76% | 9.6 129% | |
| WiFi (h) | 8.4 | ||||
| Witcher 3 ultra (h) | 1 |
Pro
Contra

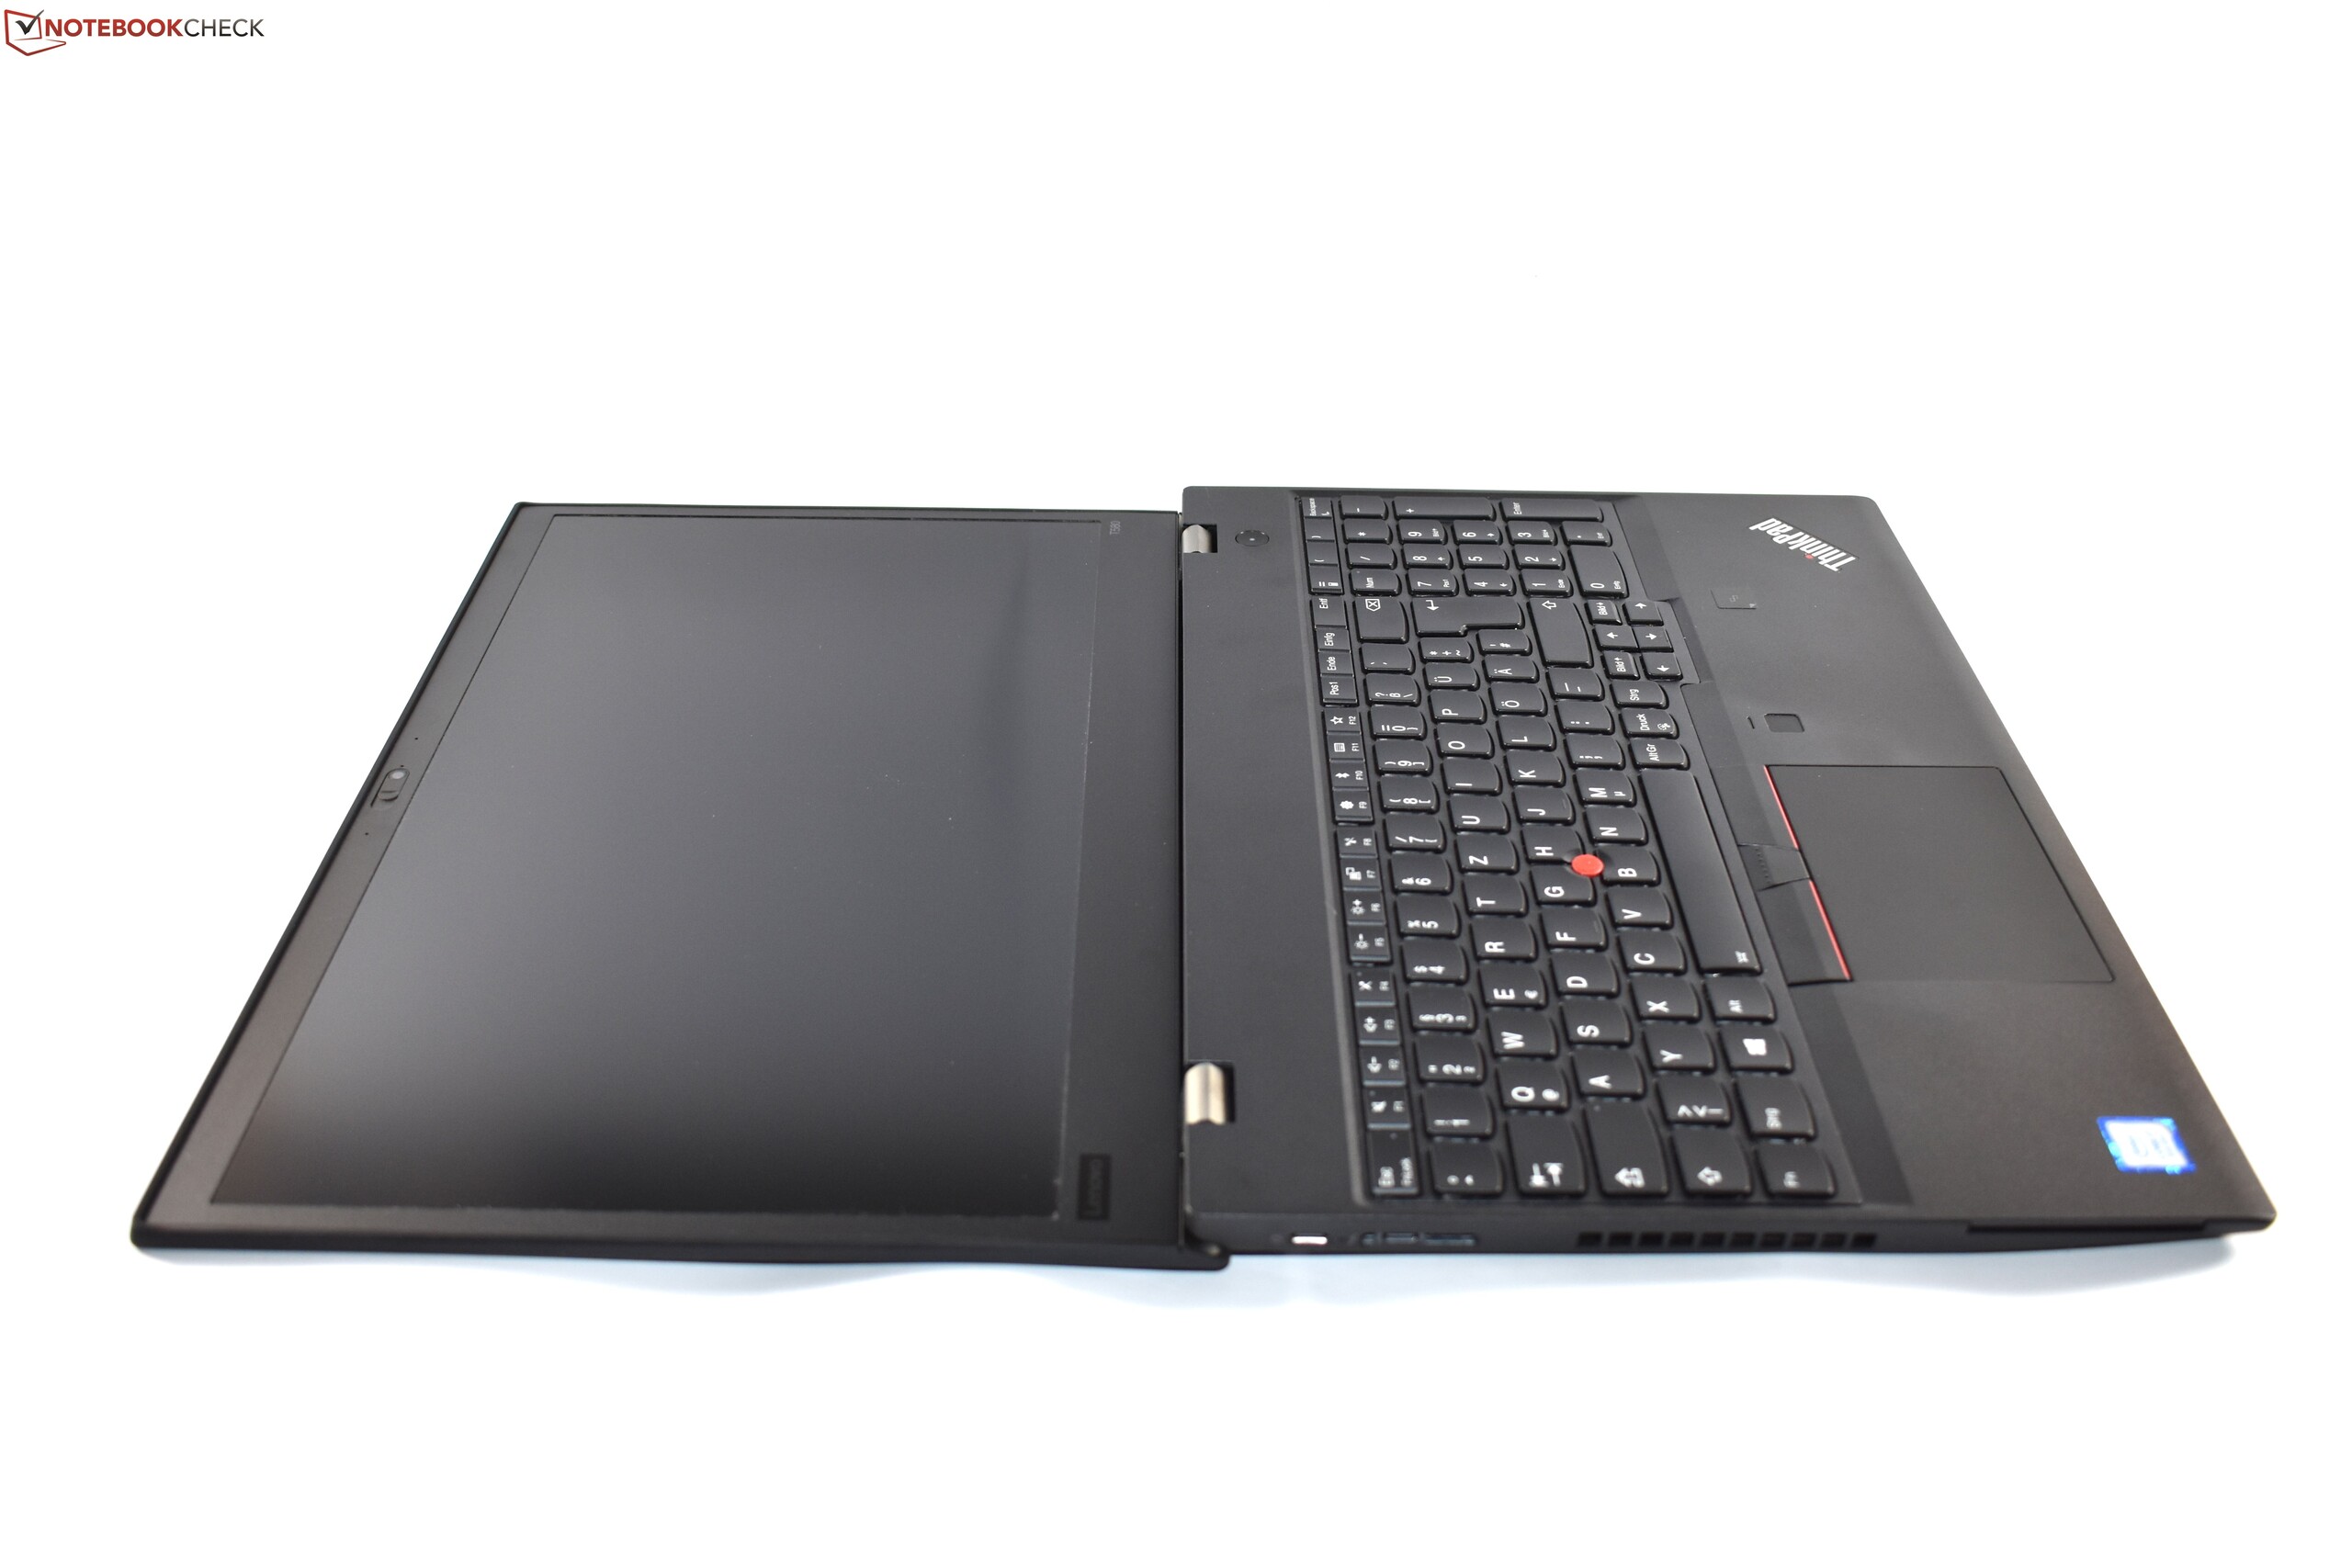
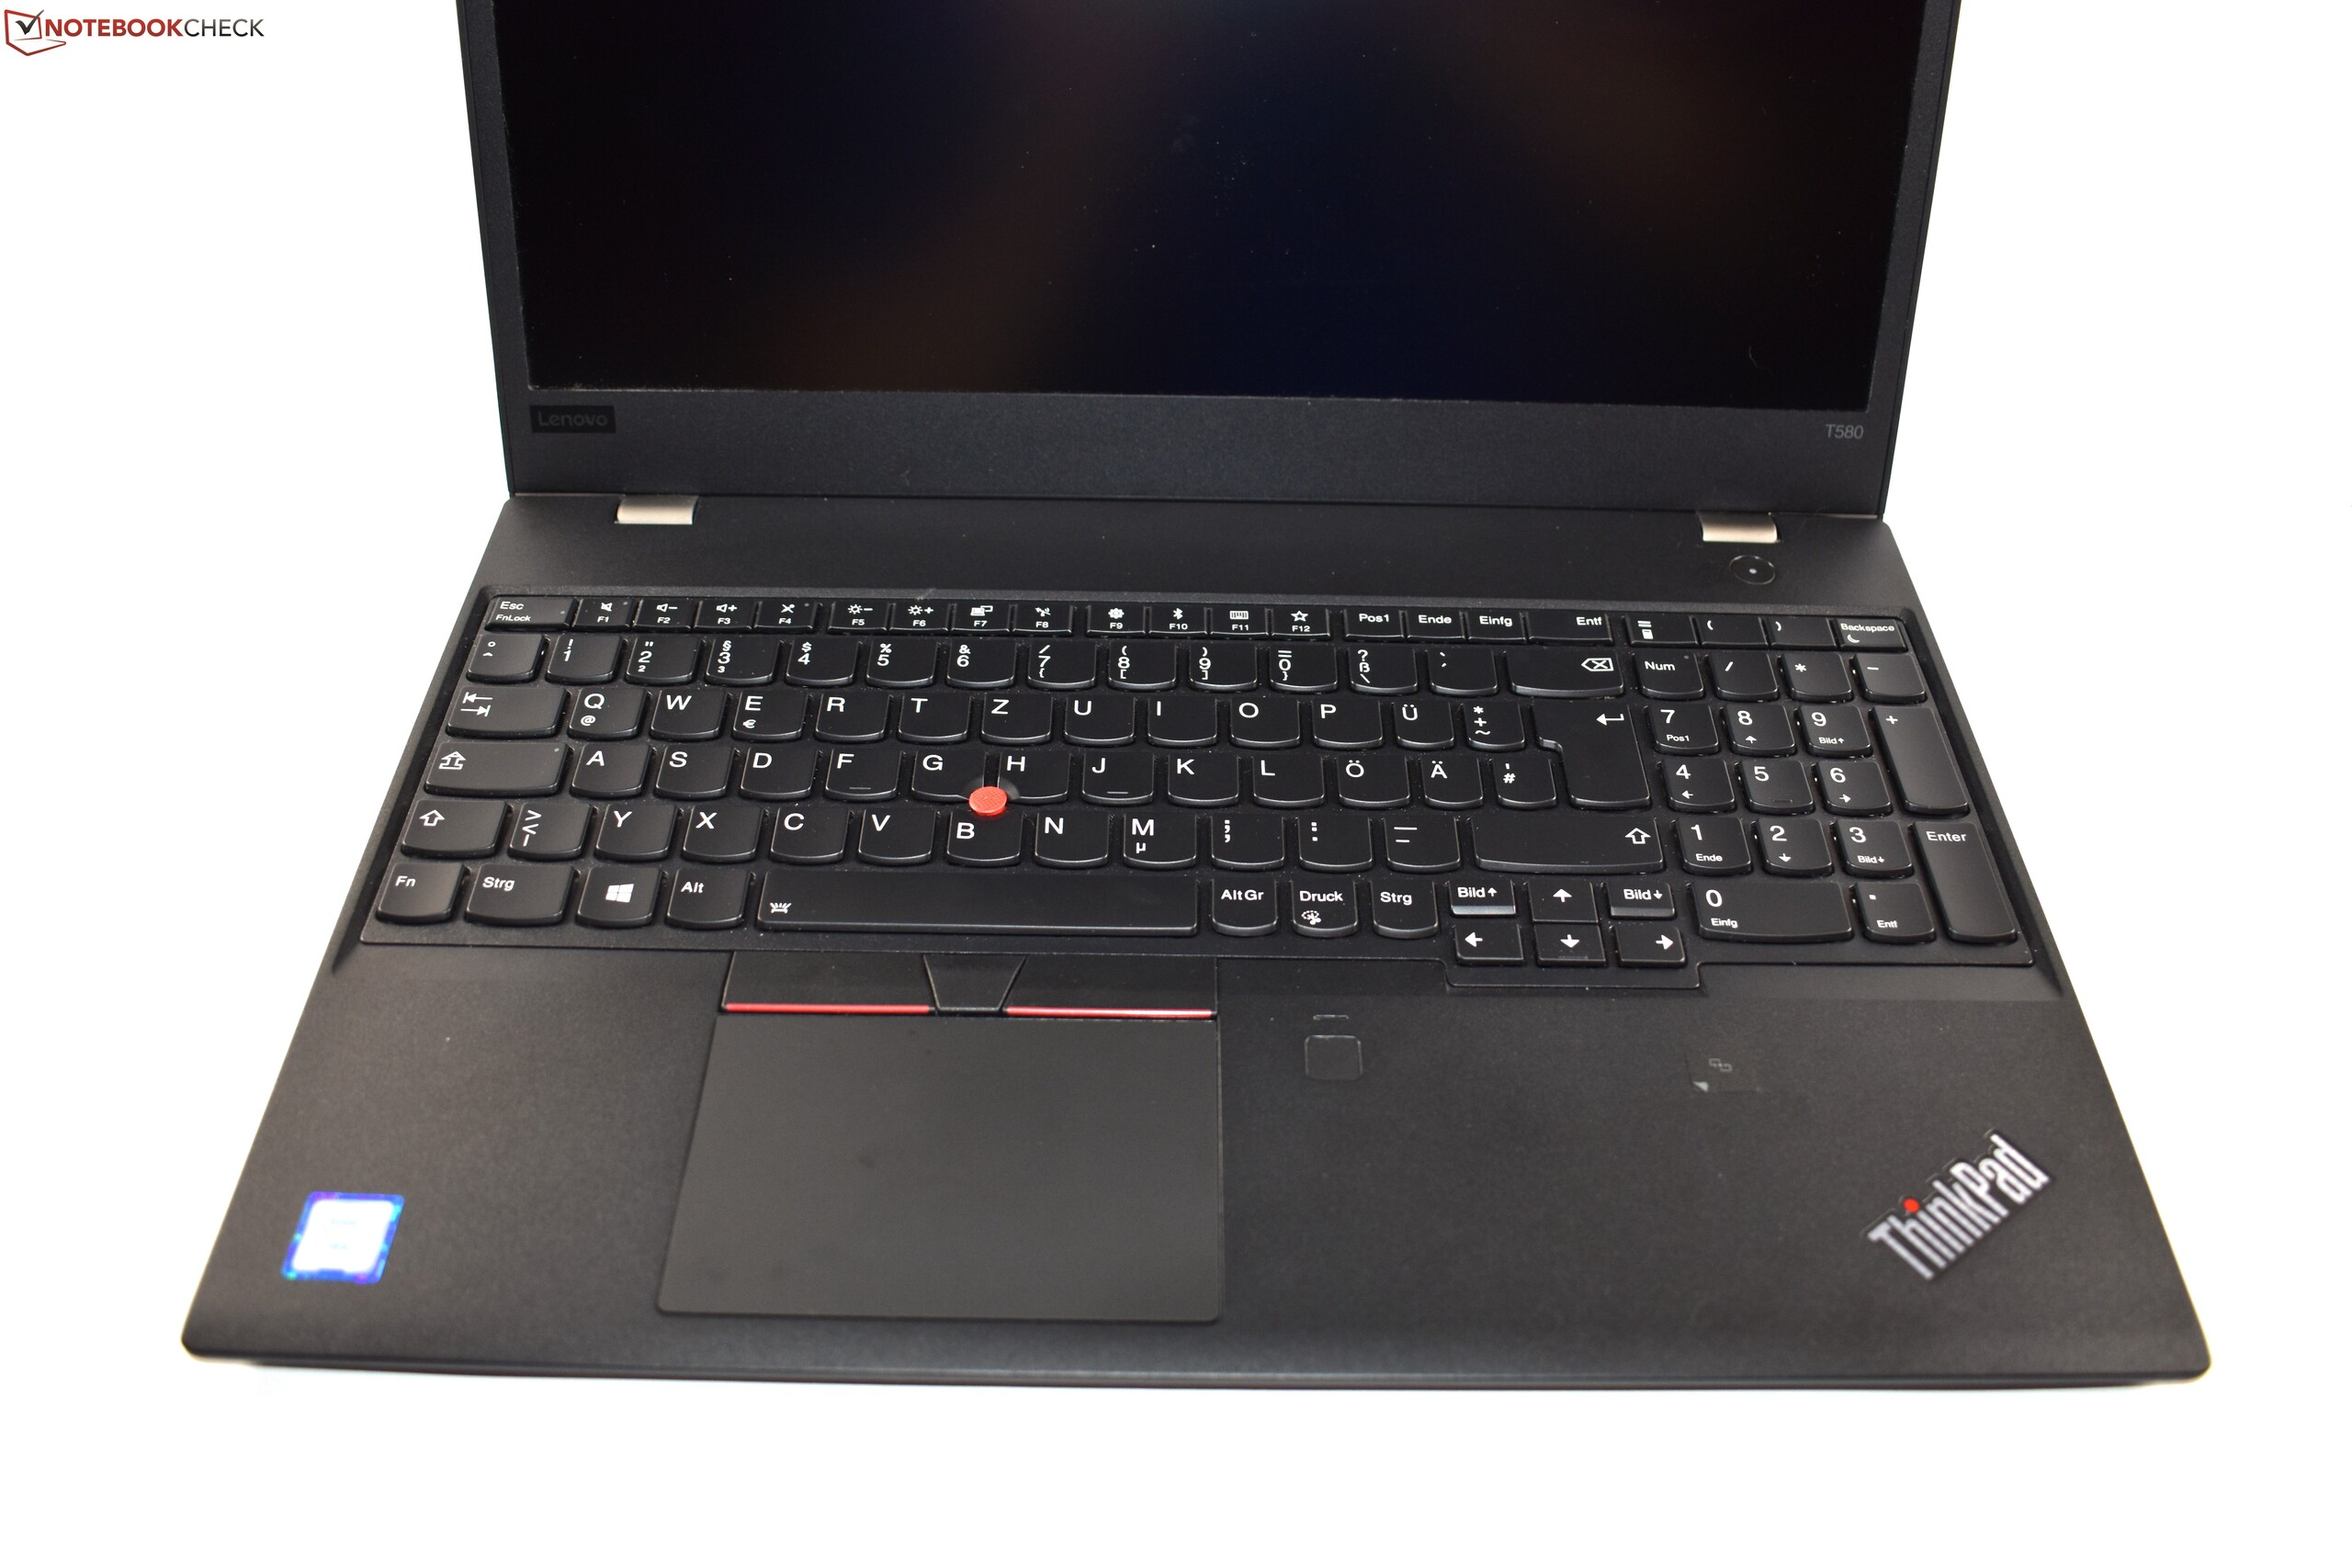
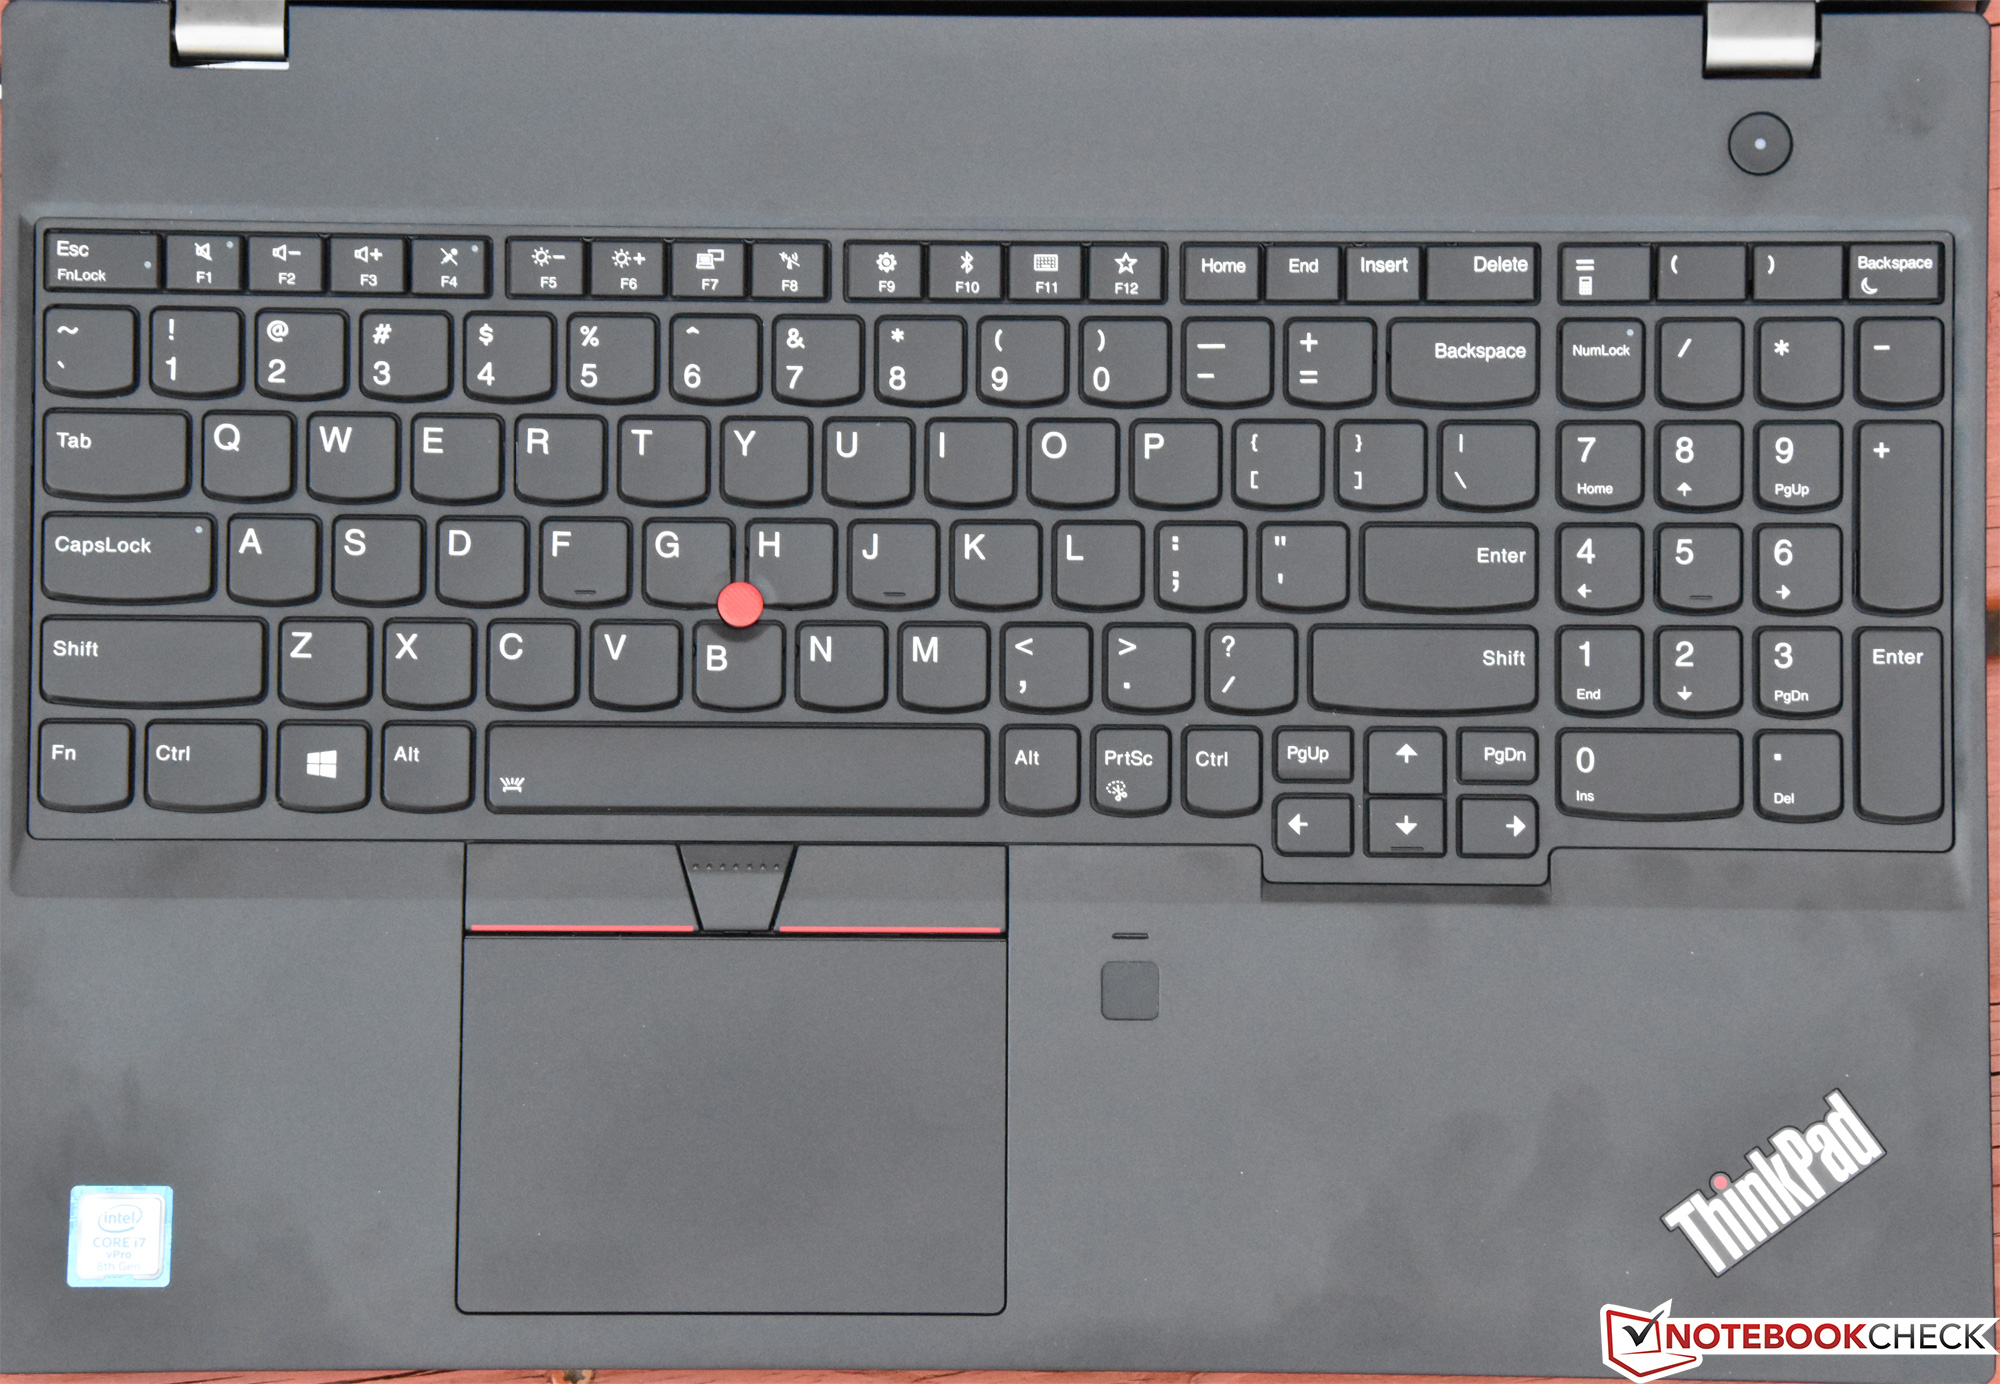
Para os tradicionalistas de portáteis de negócios fixados na presença de uma tela de 15,6 polegadas e teclado numérico, o ThinkPad T580 representa uma das poucas boas opções ainda disponíveis. É verdade que as máquinas menores (14 polegadas e menos) assumiram os papéis ultra-premium, com estabilidade/carcaças e aparência mais fortes - mas o T580 oferece a maioria dos mesmos benefícios em um formato ligeiramente maior com o sempre importante teclado numérico à direita. Como sempre, os dispositivos de entrada são de primeira linha, a qualidade de construção é muito boa, a manutenção é relativamente simples e a garantia de 3 anos no local é inerentemente reconfortante. Também é uma máquina muito silenciosa que exibe resultados gerais de desempenho do sistema e pontuações de teste de CPU que são suficientes para o usuário médio (mesmo que eles não consigam manter a força a longo prazo). Por fim, gostamos muito da tecnologia on-cell da tela táctil incorporada que estamos começando a ver incluída em muitos modelos de negócios; nossa unidade de teste atual apresenta esse painel, e é verdadeiramente anti-refletiva, apesar de suas capacidades tácteis.
Escolha suas especificações com sabedoria, mas, além da tela decepcionante e da fraca duração da bateria, quase tudo o mais sobre o ThinkPad T580 vai se sentir adequado para os tradicionalistas de máquinas de negócios.
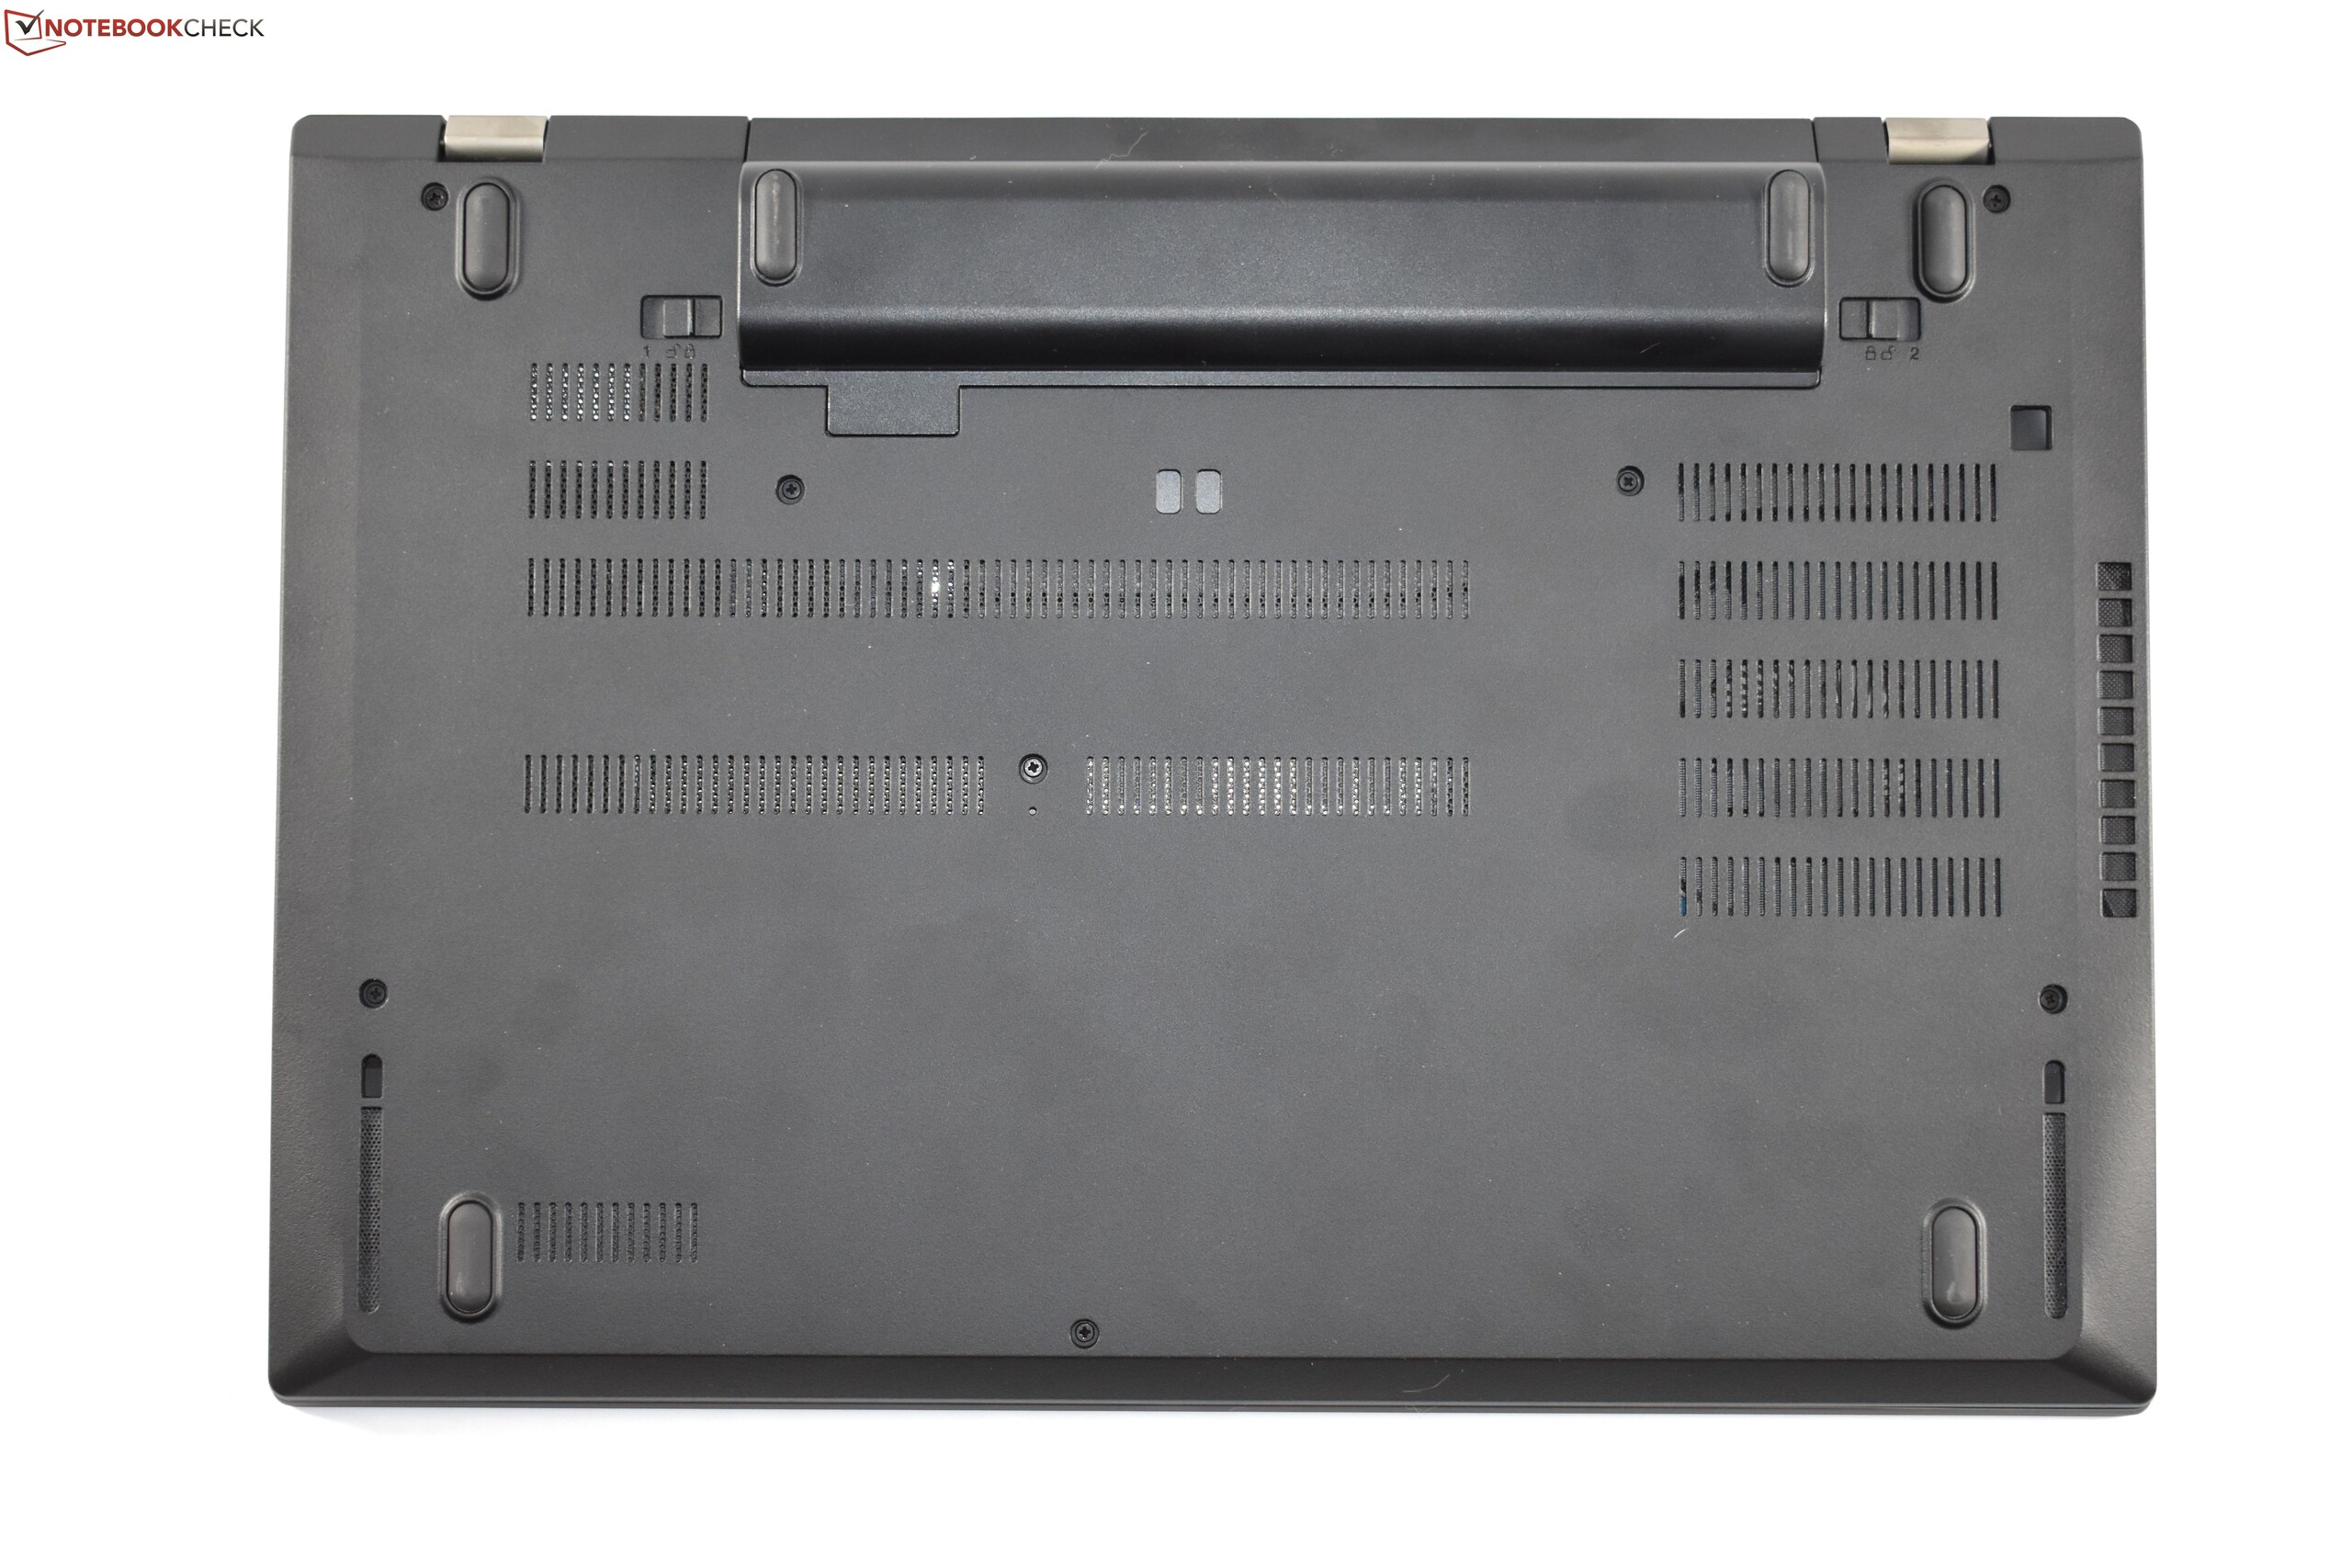
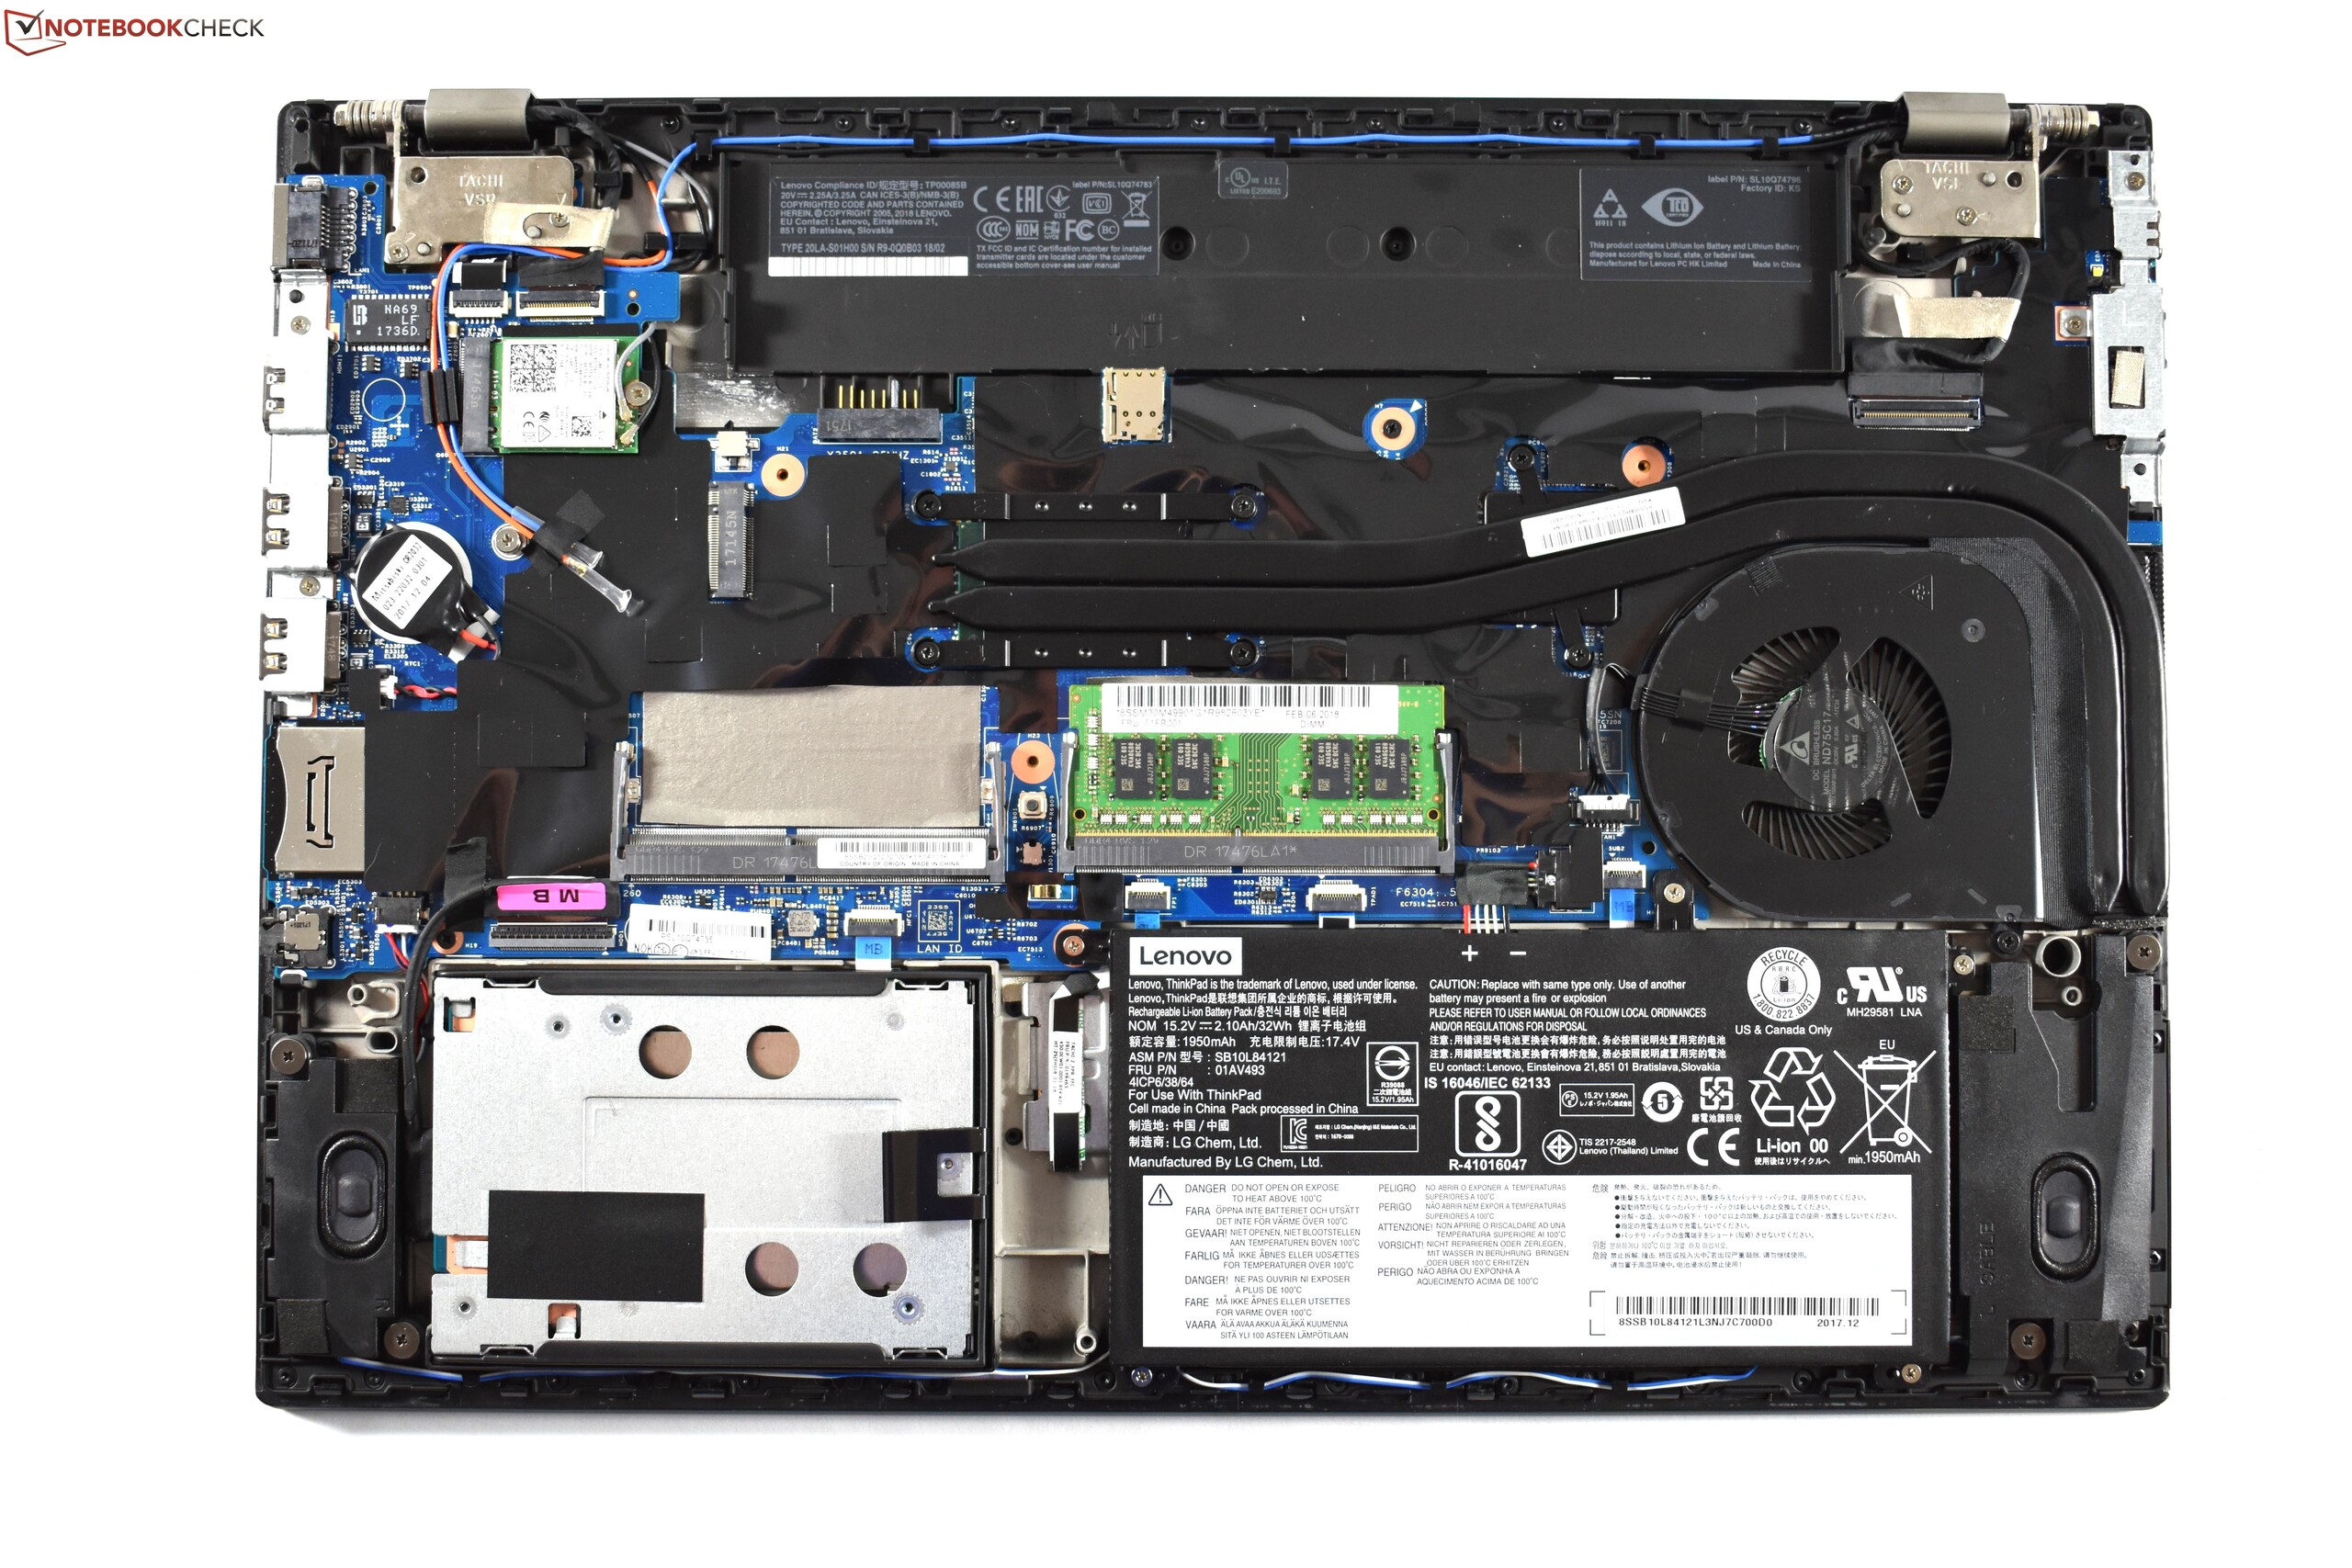
No entanto, há algumas pequenas desvantagens no T580. Para começar, como aludimos acima, as pontuações de desempenho da CPU despencam após vários minutos de atividade (uma queda de quase 20%) e nunca se recuperam subsequentemente até que a máquina receba um descanso. Os resultados de desempenho do Core i7 2670QM são, de fato, inferiores aos do our previous review unit (que incluía um Core i7-8550U), colocando em questão o valor da atualização. Em outros lugares, embora a unidade atual seja substancialmente mais barata do que a máquina de teste anterior, a tela FHD é fraca em comparação com o painel UHD sem brilho da unidade de abril. Há um par de pontos problemáticos na parte inferior da máquina, sob uso intenso, e o desempenho wireless foi estranhamente prejudicado pelo que parece ser um problema de antena (embora isso seja certamente específico para nossa unidade de teste e não seja indicativo de problemas com o modelo como um todo). E, finalmente, talvez de forma mais perplexa, os tempos de duração da bateria estão muito abaixo do que esperávamos ver de uma máquina equipada com 56 Wh, quase metade do que registramos em nossa unidade de teste Dell Latitude 5590 (cuja bateria é, de fato, menor). Felizmente, as baterias são fáceis de trocar neste modelo, graças ao design ThinkPad Power Bridge de bateria dupla, para que os usuários possam levar uma bateria externa extra para ajudar a resolver qualquer problema enquanto estiver em movimento.
Mas, além do HP EliteBook 840 G1 e Dell Latitude 5590, o ThinkPad T580 de $1.887 é uma das únicas opções restantes para um portátil de 15 polegadas com um teclado numérico que ainda se qualifica como uma máquina empresarial de gama alta (mas de uso geral). Sem entrar no território dos workstations, apenas os modelos derivados do consumidor (como o XPS 15) existem em outro lugar, e o XPS não possui o teclado. Escolha suas especificações com sabedoria, mas, além da tela decepcionante e da fraca duração da bateria, quase tudo o mais sobre o T580 vai se sentir adequado para os tradicionalistas de máquinas de negócios.
Lenovo ThinkPad T580-20L9001AUS
- 08/10/2018 v6 (old)
Steve Schardein
Price comparison
