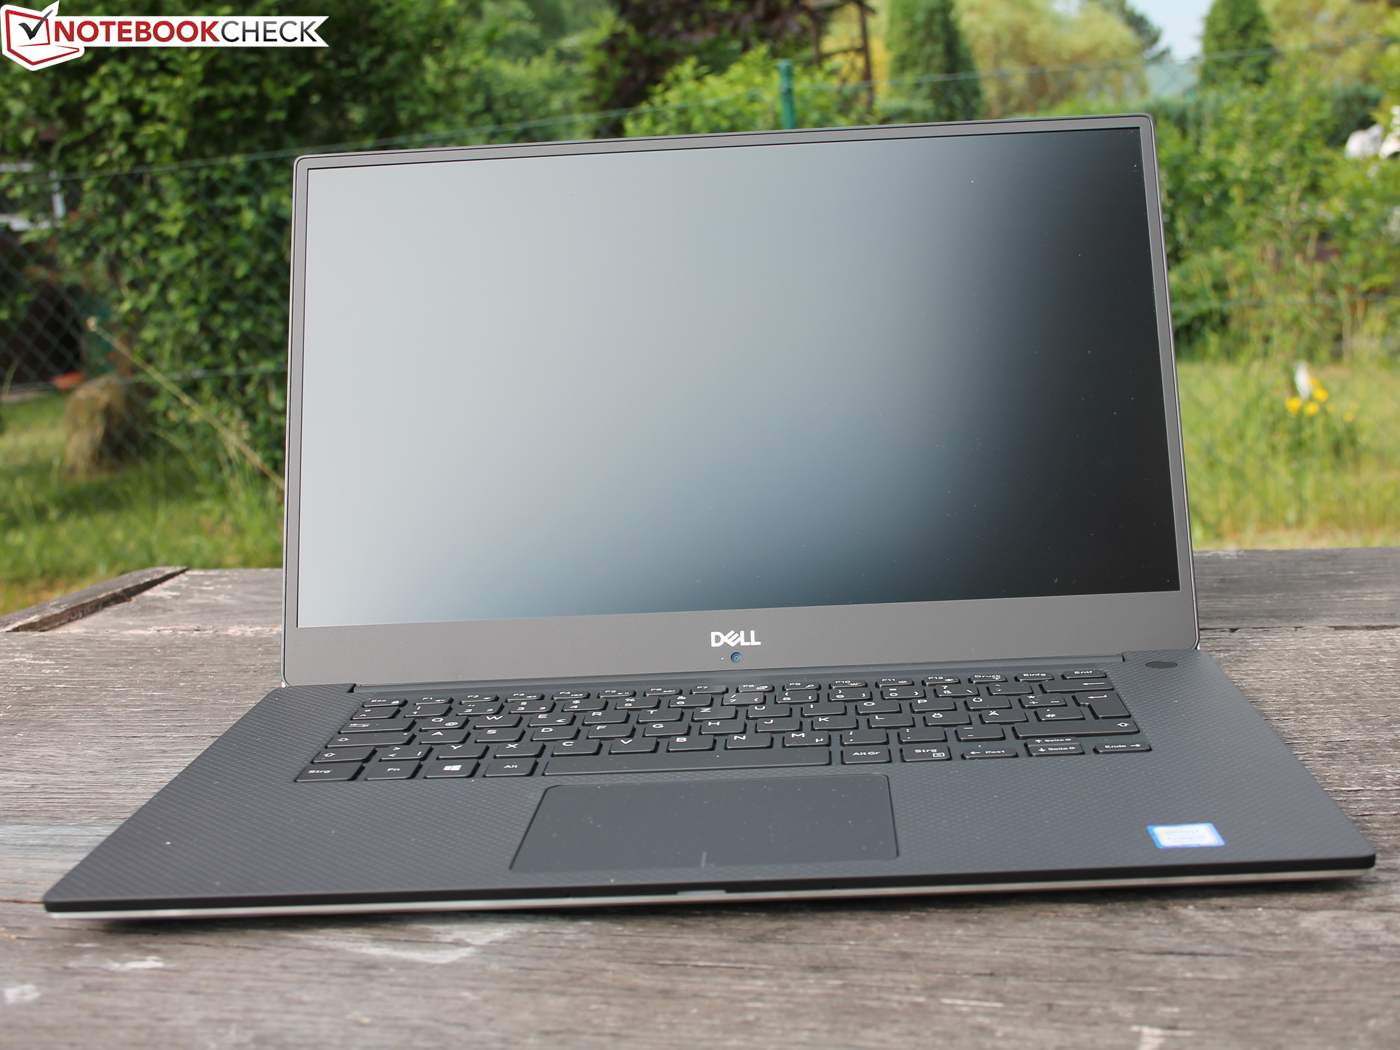
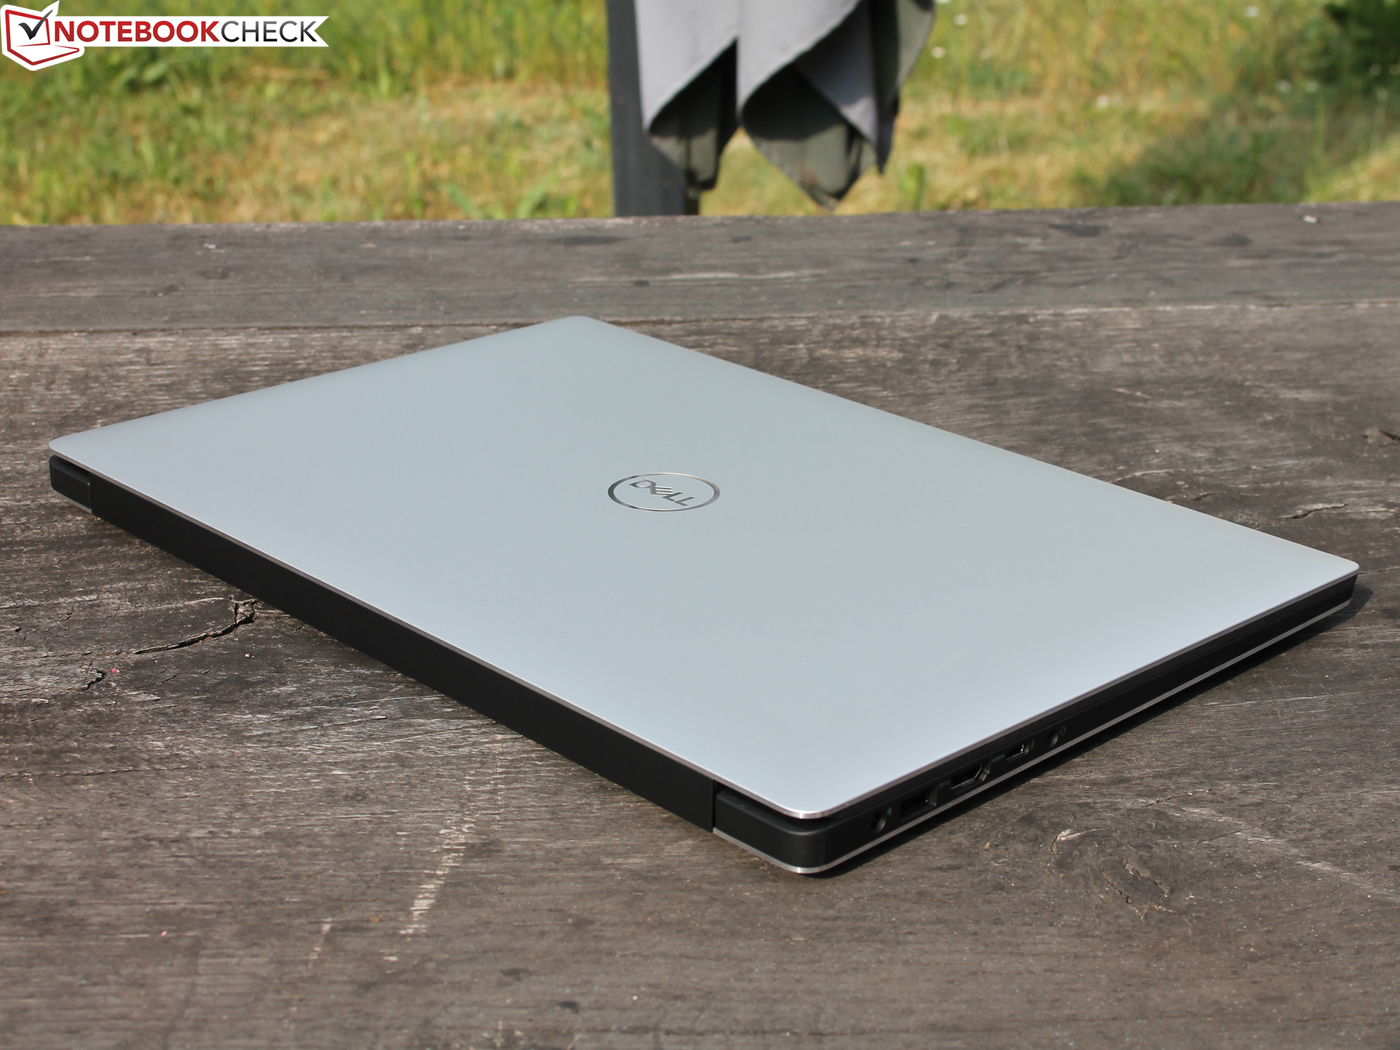
Breve Análise do Portátil Dell XPS 15 2018 9570 (8300H, GTX 1050, 97Wh)
| SD Card Reader | |
| average JPG Copy Test (av. of 3 runs) | |
| Dell XPS 13 9370 FHD i5 (Toshiba Exceria Pro M501 64 GB UHS-II) | |
| Dell XPS 15 2018 i5 FHD 97Wh | |
| Média da turma Multimedia (23 - 531, n=43, últimos 2 anos) | |
| Gigabyte Aero 14-K8 (Toshiba Exceria Pro SDXC 64 GB UHS-II) | |
| Gigabyte Aero 15 (Toshiba Exceria Pro SDXC 64 GB UHS-II) | |
| Asus Zenbook Pro UX550VE-DB71T (Toshiba Exceria Pro SDXC 64 GB UHS-II) | |
| Dell XPS 15 2017 9560 (7300HQ, Full-HD) (Toshiba Exceria Pro SDXC 64 GB UHS-II) | |
| maximum AS SSD Seq Read Test (1GB) | |
| Dell XPS 13 9370 FHD i5 (Toshiba Exceria Pro M501 64 GB UHS-II) | |
| Dell XPS 15 2017 9560 (7300HQ, Full-HD) (Toshiba Exceria Pro SDXC 64 GB UHS-II) | |
| Dell XPS 15 2018 i5 FHD 97Wh | |
| Média da turma Multimedia (27.9 - 1455, n=42, últimos 2 anos) | |
| Asus Zenbook Pro UX550VE-DB71T (Toshiba Exceria Pro SDXC 64 GB UHS-II) | |
| Gigabyte Aero 15 (Toshiba Exceria Pro SDXC 64 GB UHS-II) | |
| Gigabyte Aero 14-K8 (Toshiba Exceria Pro SDXC 64 GB UHS-II) | |
| |||||||||||||||||||||||||
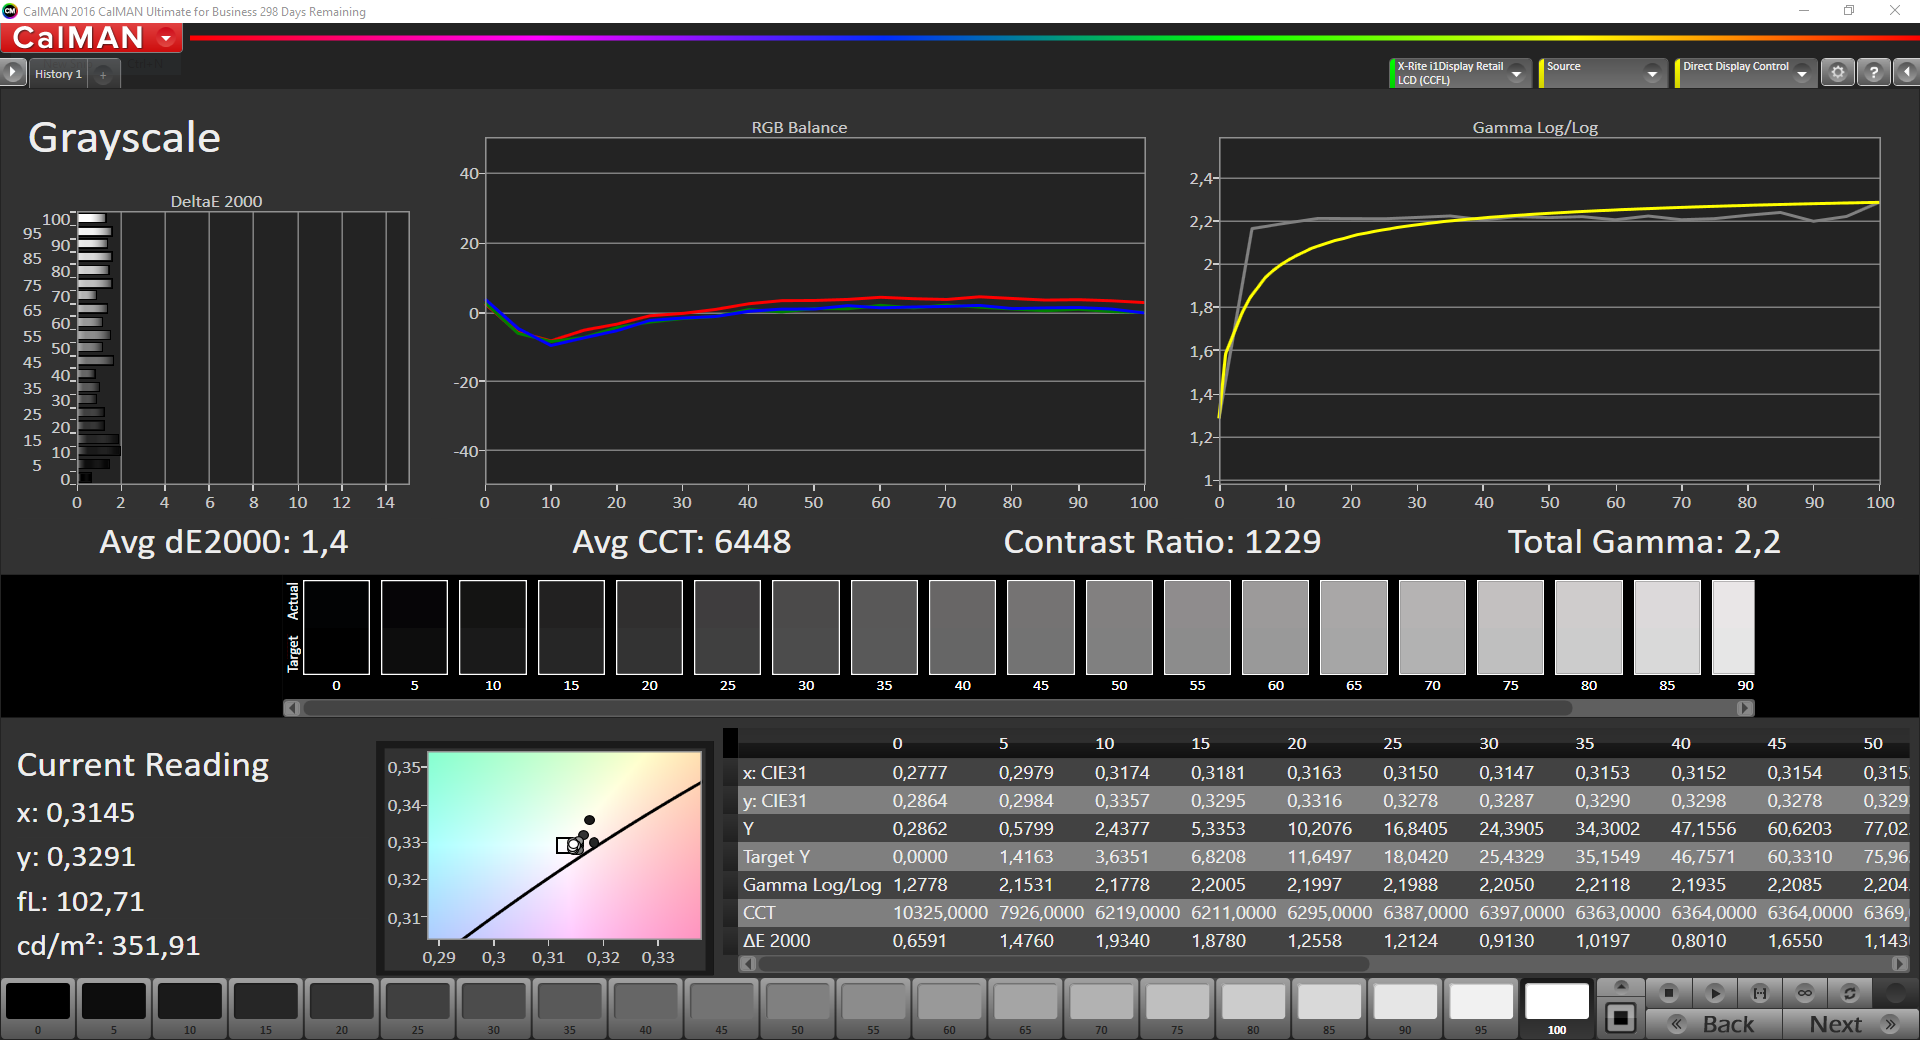
iluminação: 86 %
iluminação com acumulador: 414 cd/m²
Contraste: 1424:1 (Preto: 0.29 cd/m²)
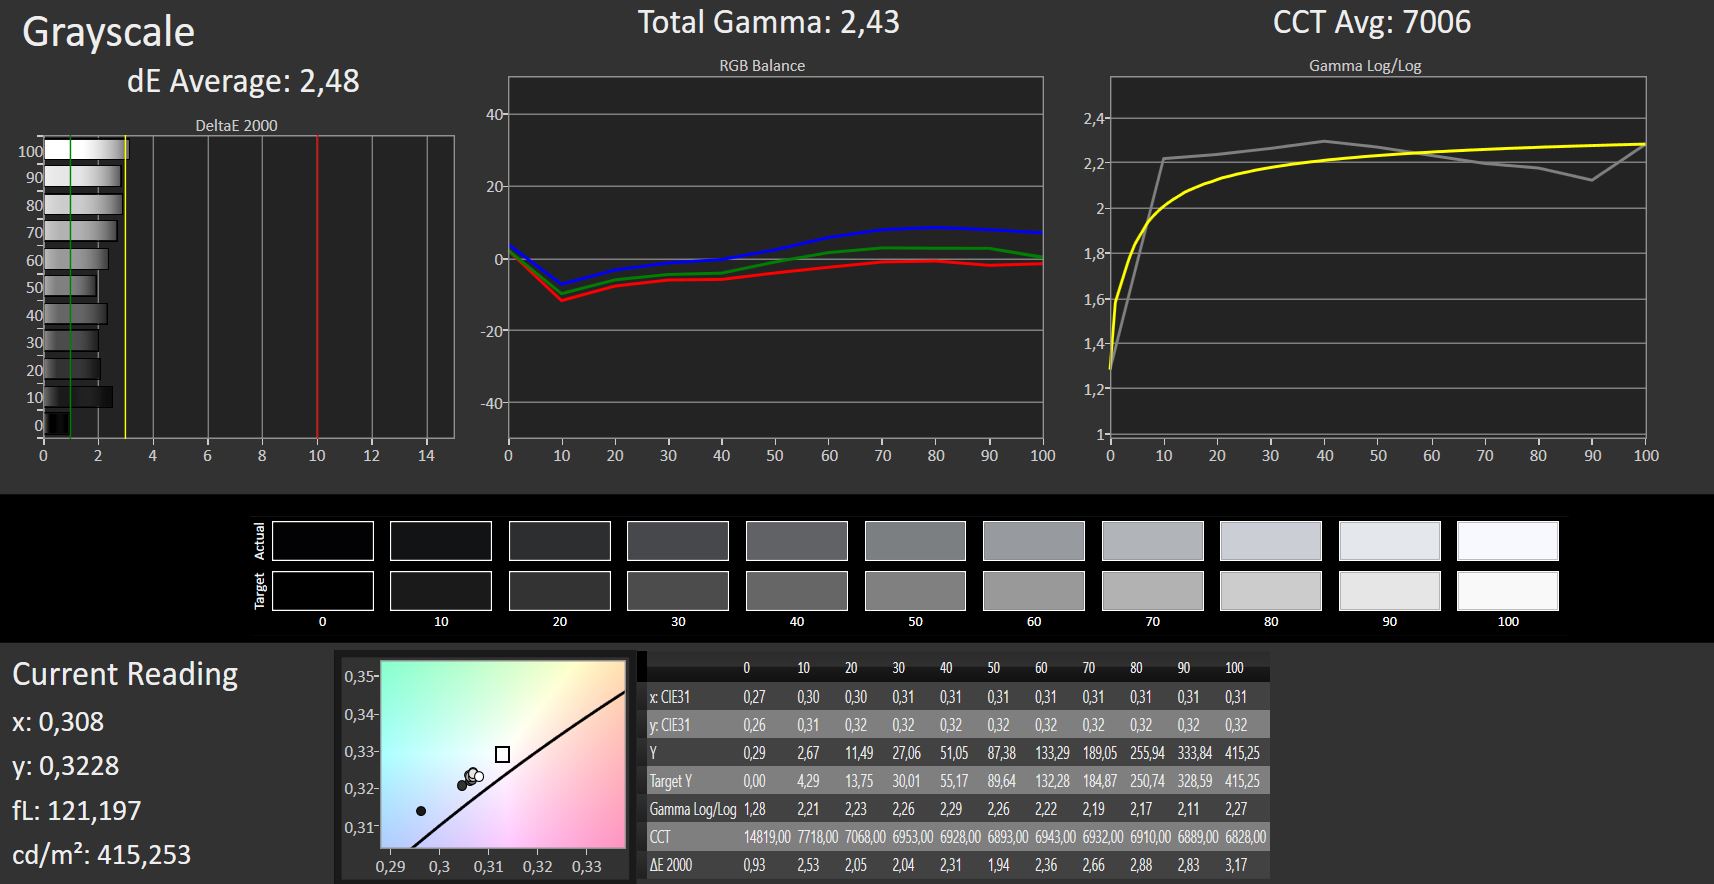
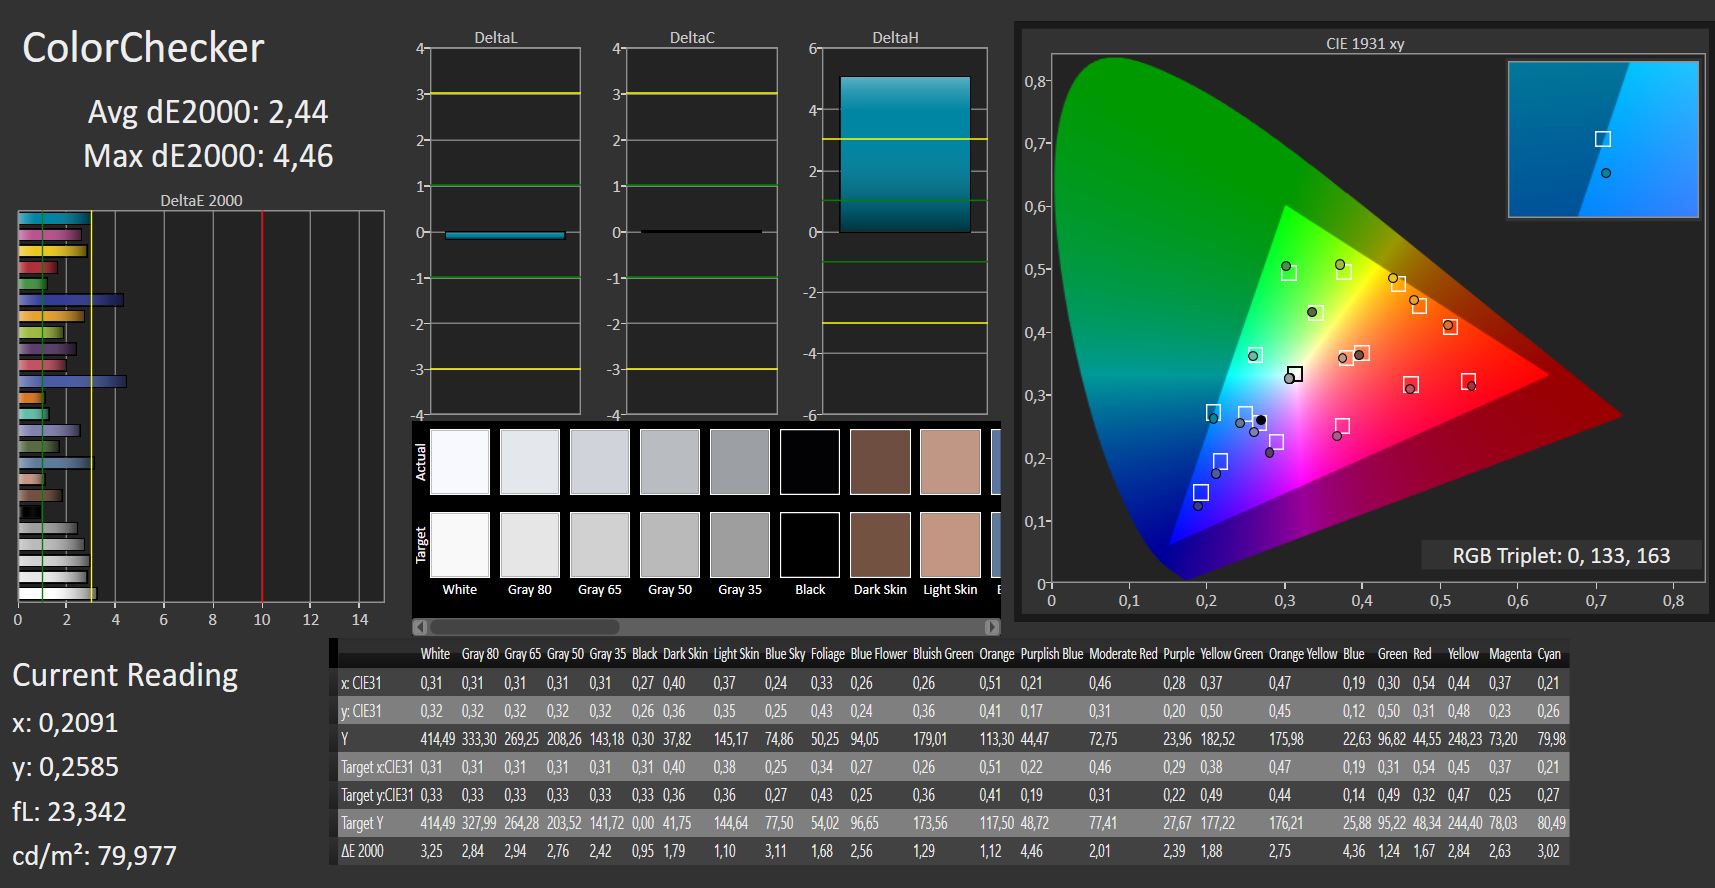
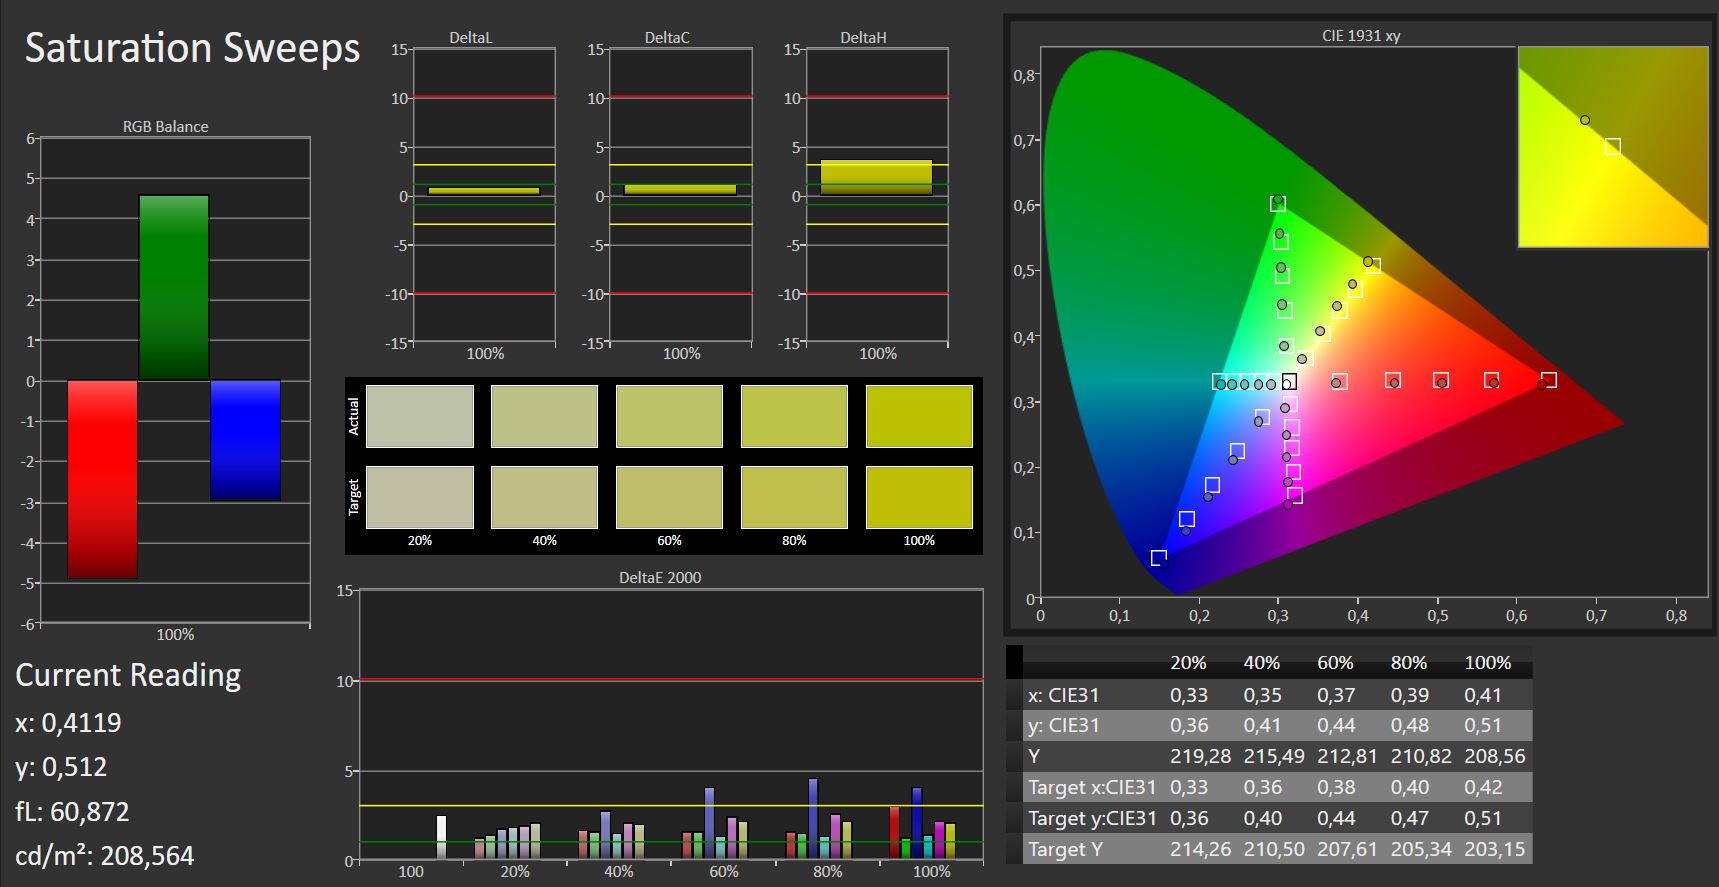
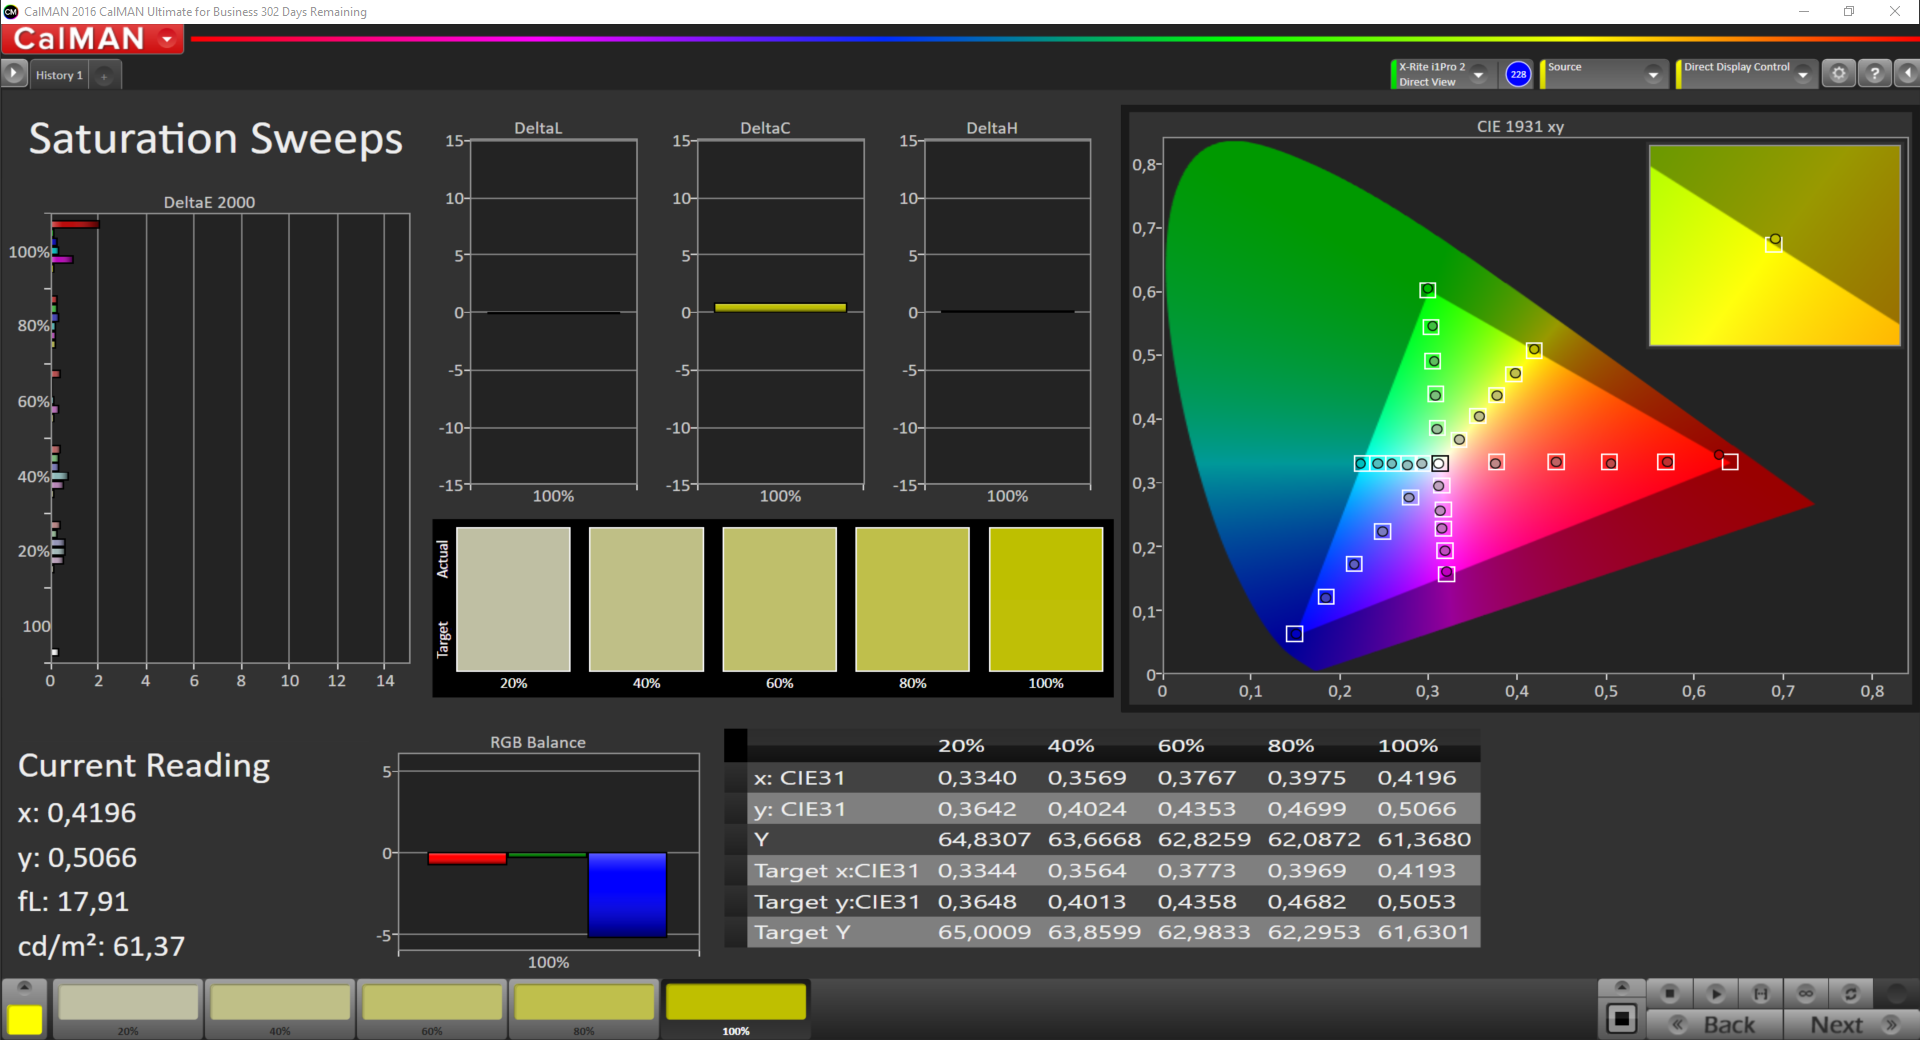
ΔE ColorChecker Calman: 2.44 | ∀{0.5-29.43 Ø4.73}
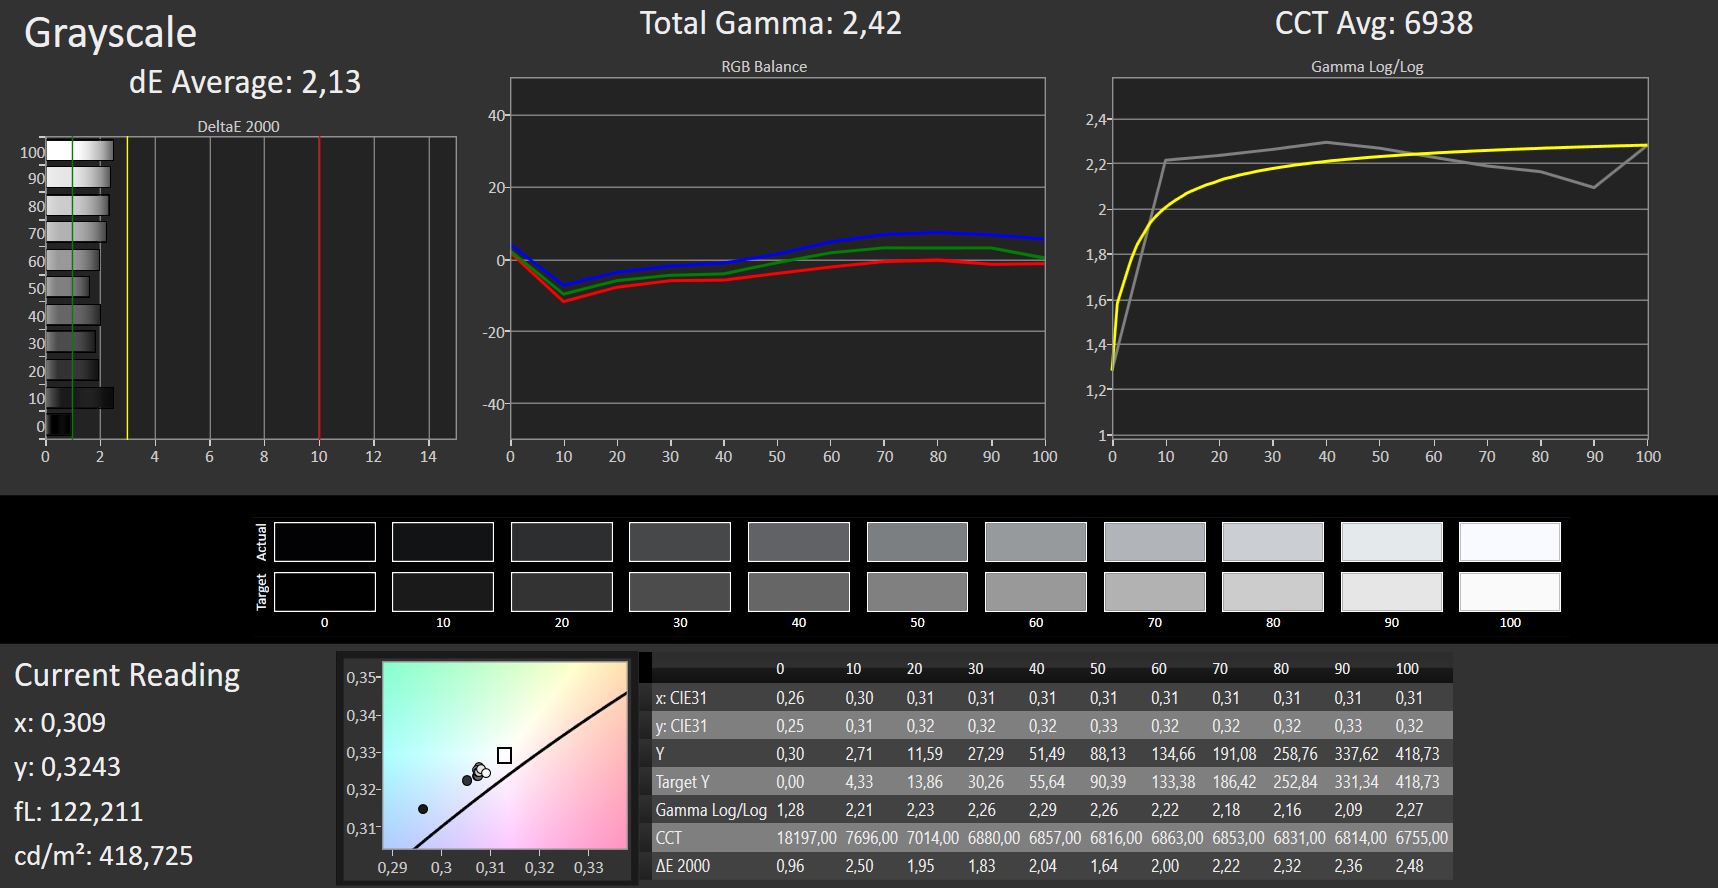
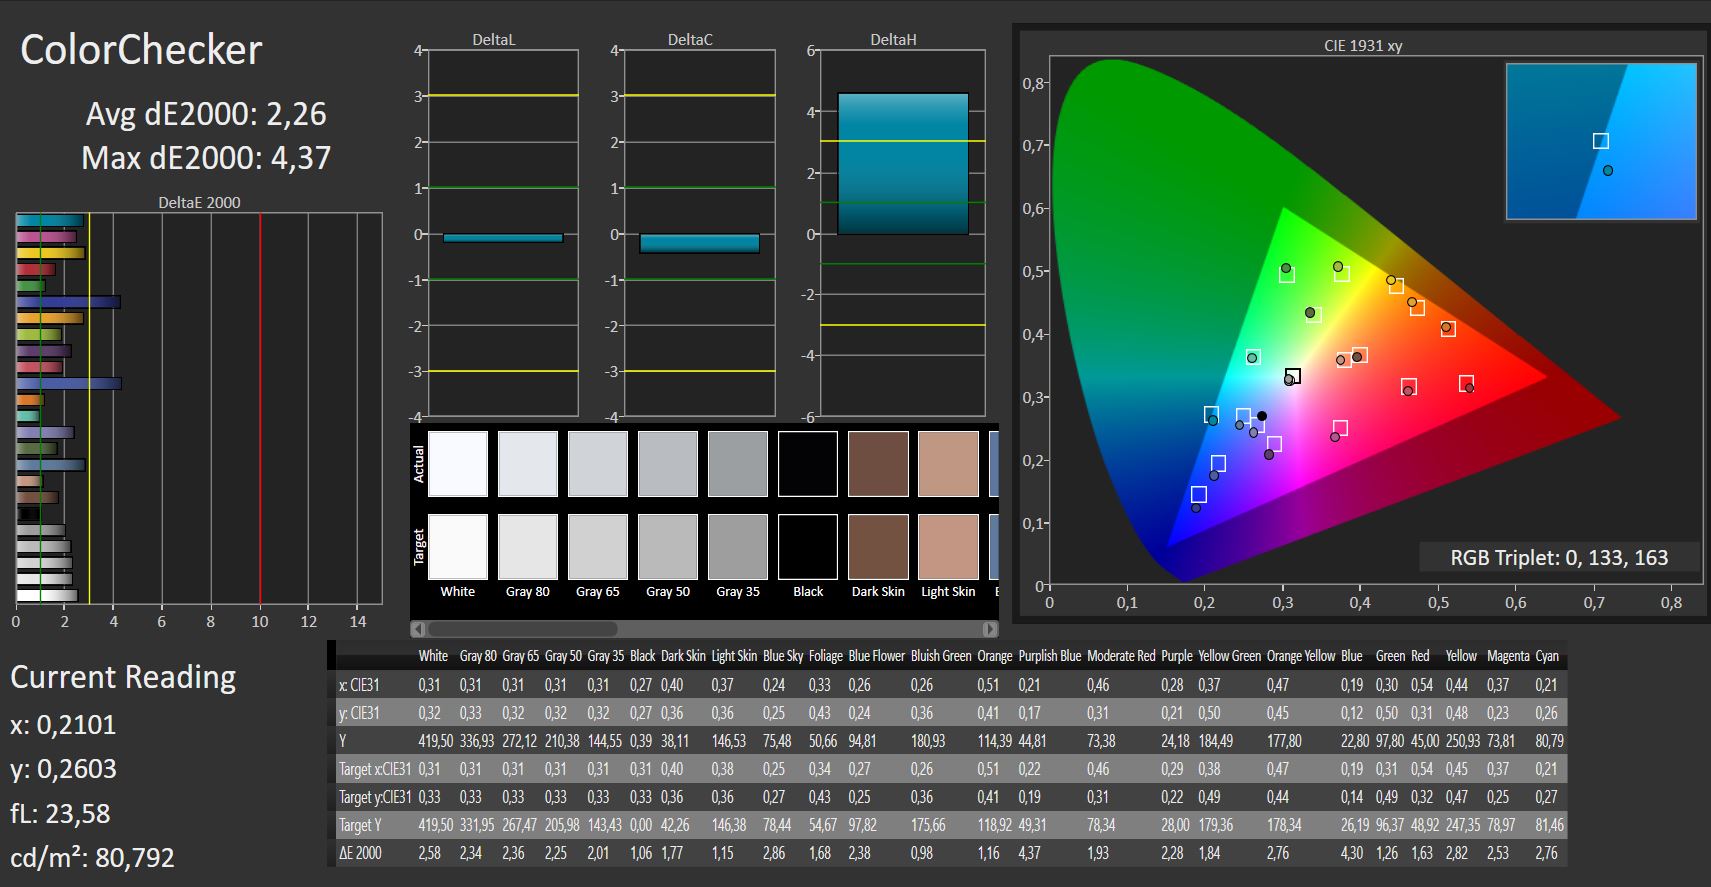
calibrated: 2.48
ΔE Greyscale Calman: 2.48 | ∀{0.09-98 Ø4.97}
96% sRGB (Argyll 1.6.3 3D)
62% AdobeRGB 1998 (Argyll 1.6.3 3D)
66.7% AdobeRGB 1998 (Argyll 3D)
96.5% sRGB (Argyll 3D)
66% Display P3 (Argyll 3D)
Gamma: 2.43
CCT: 7006 K
| Dell XPS 15 2018 i5 FHD 97Wh Sharp SHP149A LQ156M1, , 1920x1080, 15.6" | Dell XPS 15 9560 (i7-7700HQ, UHD) 3840x2160, 15.6" | Dell XPS 15 2017 9560 (7300HQ, Full-HD) Sharp SHP1453 LQ156M1, , 1920x1080, 15.6" | Dell XPS 13 9370 FHD i5 SHP1484, , 1920x1080, 13.3" | Apple MacBook Pro 15 2017 (2.8 GHz, 555) APPA031, , 2880x1800, 15.4" | Gigabyte Aero 14-K8 AU Optronics B140QAN01.5 (AUO1536), , 2560x1440, 14" | Gigabyte Aero 15 N156HCA-EA1 (CMN15D7), , 1920x1080, 15.6" | Asus Zenbook Pro UX550VE-DB71T N156HCE-EN1 (CMN15E8), , 1920x1080, 15.6" | |
|---|---|---|---|---|---|---|---|---|
| Display | 30% | 4% | 3% | 27% | 3% | -2% | -4% | |
| Display P3 Coverage (%) | 66 | 89.7 36% | 68.9 4% | 68.9 4% | 97.9 48% | 69.1 5% | 65.2 -1% | 64.3 -3% |
| sRGB Coverage (%) | 96.5 | 100 4% | 98.9 2% | 96.6 0% | 99.9 4% | 96 -1% | 92.5 -4% | 90.4 -6% |
| AdobeRGB 1998 Coverage (%) | 66.7 | 100 50% | 70.9 6% | 69.6 4% | 85.9 29% | 70.3 5% | 66.5 0% | 65.3 -2% |
| Response Times | -24% | -43% | -40% | -6% | -5% | 3% | 2% | |
| Response Time Grey 50% / Grey 80% * (ms) | 49 ? | 57.2 ? -17% | 54 ? -10% | 62.4 ? -27% | 48 ? 2% | 47.2 ? 4% | 42.8 ? 13% | 43.2 ? 12% |
| Response Time Black / White * (ms) | 30 ? | 39.2 ? -31% | 52.4 ? -75% | 45.6 ? -52% | 33.8 ? -13% | 34 ? -13% | 32 ? -7% | 32.8 ? -9% |
| PWM Frequency (Hz) | 961 ? | 962 | 1008 ? | 119000 ? | 26000 ? | 25510 ? | ||
| Screen | -35% | -41% | -16% | 10% | 6% | -45% | -62% | |
| Brightness middle (cd/m²) | 413 | 370.1 -10% | 400 -3% | 428 4% | 545 32% | 256 -38% | 320 -23% | 288.2 -30% |
| Brightness (cd/m²) | 378 | 356 -6% | 392 4% | 405 7% | 523 38% | 250 -34% | 316 -16% | 266 -30% |
| Brightness Distribution (%) | 86 | 87 1% | 89 3% | 87 1% | 86 0% | 90 5% | 90 5% | 75 -13% |
| Black Level * (cd/m²) | 0.29 | 0.37 -28% | 0.26 10% | 0.26 10% | 0.44 -52% | 0.28 3% | 0.36 -24% | 0.3 -3% |
| Contrast (:1) | 1424 | 1000 -30% | 1538 8% | 1646 16% | 1239 -13% | 914 -36% | 889 -38% | 961 -33% |
| Colorchecker dE 2000 * | 2.44 | 5.3 -117% | 4.9 -101% | 3.8 -56% | 1.6 34% | 1.21 50% | 4.62 -89% | 5.5 -125% |
| Colorchecker dE 2000 max. * | 4.46 | 9.9 -122% | 11 -147% | 7.2 -61% | 3.8 15% | 2.11 53% | 9.75 -119% | 11.3 -153% |
| Colorchecker dE 2000 calibrated * | 2.48 | |||||||
| Greyscale dE 2000 * | 2.48 | 4.6 -85% | 7.2 -190% | 4.4 -77% | 1.9 23% | 1.13 54% | 6 -142% | 7.9 -219% |
| Gamma | 2.43 91% | 2.31 95% | 2.11 104% | 2.21 100% | 2.26 97% | 2.42 91% | 2.46 89% | 2.09 105% |
| CCT | 7006 93% | 6284 103% | 6911 94% | 7067 92% | 6834 95% | 6422 101% | 6761 96% | 6559 99% |
| Color Space (Percent of AdobeRGB 1998) (%) | 62 | 88.3 42% | 64.2 4% | 62.8 1% | 62 0% | 60 -3% | 58.5 -6% | |
| Color Space (Percent of sRGB) (%) | 96 | 100 4% | 98.9 3% | 96.4 0% | 96 0% | 92 -4% | 90 -6% | |
| Média Total (Programa/Configurações) | -10% /
-21% | -27% /
-32% | -18% /
-15% | 10% /
11% | 1% /
4% | -15% /
-30% | -21% /
-42% |
* ... menor é melhor

Exibir tempos de resposta
| ↔ Tempo de resposta preto para branco | ||
|---|---|---|
| 30 ms ... ascensão ↗ e queda ↘ combinadas | ↗ 16 ms ascensão | 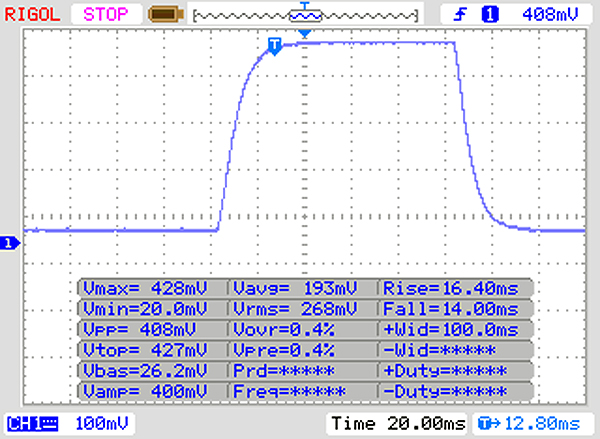 |
| ↘ 14 ms queda | ||
| A tela mostra taxas de resposta lentas em nossos testes e será insatisfatória para os jogadores. Em comparação, todos os dispositivos testados variam de 0.1 (mínimo) a 240 (máximo) ms. » 80 % de todos os dispositivos são melhores. Isso significa que o tempo de resposta medido é pior que a média de todos os dispositivos testados (19.9 ms). | ||
| ↔ Tempo de resposta 50% cinza a 80% cinza | ||
| 49 ms ... ascensão ↗ e queda ↘ combinadas | ↗ 25 ms ascensão | 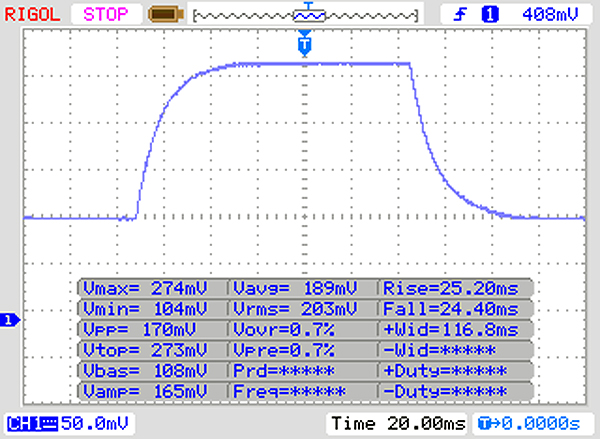 |
| ↘ 40 ms queda | ||
| A tela mostra taxas de resposta lentas em nossos testes e será insatisfatória para os jogadores. Em comparação, todos os dispositivos testados variam de 0.165 (mínimo) a 636 (máximo) ms. » 85 % de todos os dispositivos são melhores. Isso significa que o tempo de resposta medido é pior que a média de todos os dispositivos testados (31.1 ms). | ||
Cintilação da tela / PWM (modulação por largura de pulso)
| Tela tremeluzindo/PWM detectado | 961 Hz | ≤ 10 % configuração de brilho | 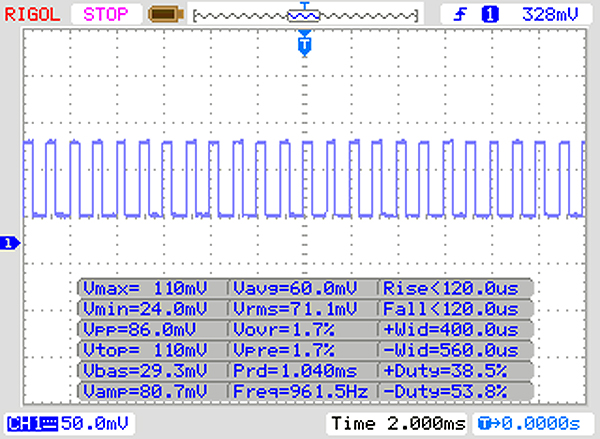 |
A luz de fundo da tela pisca em 961 Hz (pior caso, por exemplo, utilizando PWM) Cintilação detectada em uma configuração de brilho de 10 % e abaixo. Não deve haver cintilação ou PWM acima desta configuração de brilho. A frequência de 961 Hz é bastante alta, então a maioria dos usuários sensíveis ao PWM não deve notar nenhuma oscilação. [pwm_comparison] Em comparação: 52 % de todos os dispositivos testados não usam PWM para escurecer a tela. Se PWM foi detectado, uma média de 7801 (mínimo: 5 - máximo: 343500) Hz foi medida. | |||
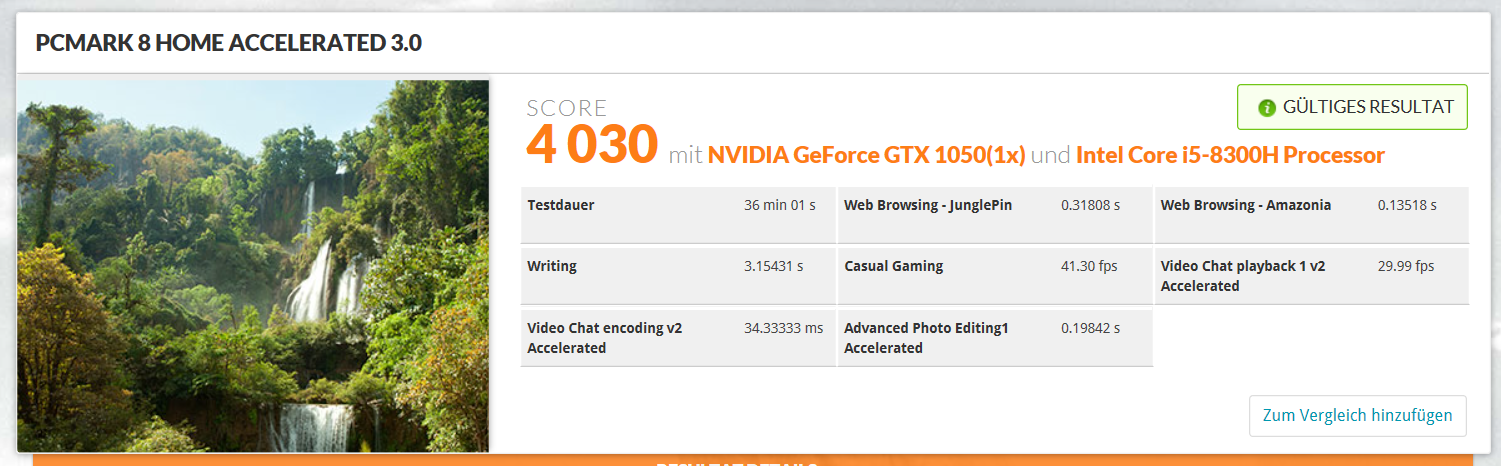
| PCMark 8 Home Score Accelerated v2 | 4030 pontos | |
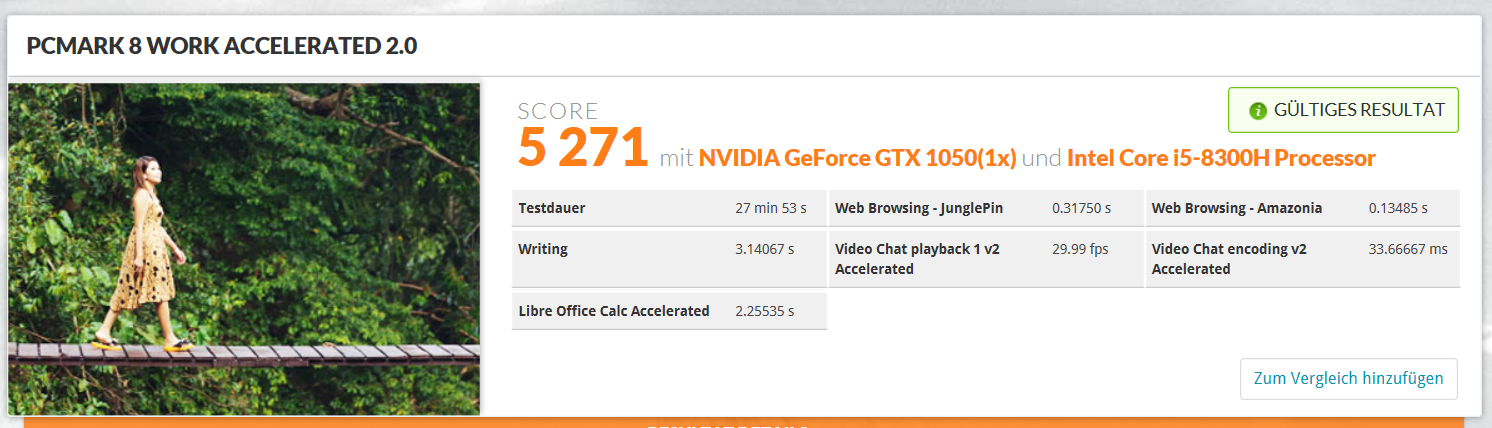
| PCMark 8 Work Score Accelerated v2 | 5271 pontos | |
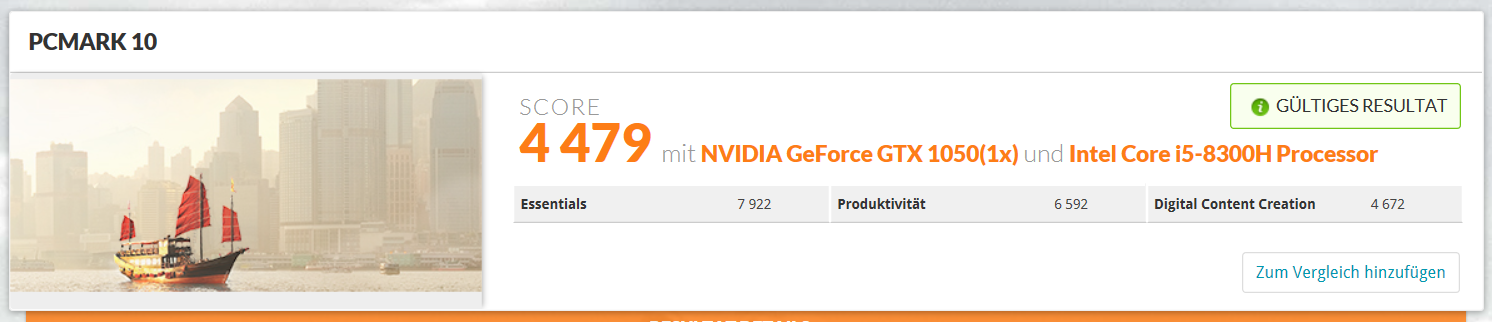
| PCMark 10 Score | 4479 pontos | |
Ajuda | ||
| Dell XPS 15 2018 i5 FHD 97Wh Lite-On CA3-8D256-Q11 | Apple MacBook Pro 15 2017 (2.8 GHz, 555) Apple SSD SM0256L | Gigabyte Aero 15 Lite-On CX2-8B512-Q11 | Dell XPS 13 9370 FHD i5 Toshiba XG5 KXG50ZNV256G | Dell XPS 15 9560 (i7-7700HQ, UHD) Lite-On CX2-8B512-Q11 | Média Lite-On CA3-8D256-Q11 | |
|---|---|---|---|---|---|---|
| CrystalDiskMark 3.0 | 44% | 63% | 5% | 54% | 0% | |
| Read Seq (MB/s) | 1706 | 1557 -9% | 1769 4% | 1875 10% | 1684 -1% | 1706 ? 0% |
| Write Seq (MB/s) | 613 | 1505 146% | 1133 85% | 352.7 -42% | 1106 80% | 613 ? 0% |
| Read 512 (MB/s) | 1171 | 968 -17% | 891 -24% | 840 -28% | 977 -17% | 1171 ? 0% |
| Write 512 (MB/s) | 483.4 | 1124 133% | 1069 121% | 353.9 -27% | 1119 131% | 483 ? 0% |
| Read 4k (MB/s) | 40.64 | 10.76 -74% | 44.7 10% | 34.18 -16% | 45.14 11% | 40.6 ? 0% |
| Write 4k (MB/s) | 89.4 | 12.87 -86% | 123.3 38% | 127.5 43% | 134.1 50% | 89.4 ? 0% |
| Read 4k QD32 (MB/s) | 233.8 | 631 170% | 645 176% | 381.8 63% | 509 118% | 234 ? 0% |
| Write 4k QD32 (MB/s) | 249.1 | 468.4 88% | 490.5 97% | 339.9 36% | 398.1 60% | 249 ? 0% |

| 3DMark 11 Performance | 7974 pontos | |
| 3DMark Cloud Gate Standard Score | 21868 pontos | |
| 3DMark Fire Strike Score | 5687 pontos | |
Ajuda | ||
| Final Fantasy XV Benchmark - 1280x720 Lite Quality | |
| Média da turma Multimedia (21.4 - 232, n=65, últimos 2 anos) | |
| Dell XPS 15 2018 i5 FHD 97Wh | |
| MSI GL62M 7RD-077 | |
| Média NVIDIA GeForce GTX 1050 Mobile (41 - 63.8, n=6) | |
| Asus GL753VD | |
| Acer Nitro 5 Spin NP515-51-86CX | |
| Apple MacBook Pro 15 2017 (2.8 GHz, 555) | |
| Dirt 4 - 1920x1080 High Preset AA:2xMS AF:8x | |
| MSI GL62M 7RD-077 | |
| Dell XPS 15 2018 i5 FHD 97Wh | |
| Acer Nitro 5 AN515-51-788E | |
| Média NVIDIA GeForce GTX 1050 Mobile (46.2 - 63.7, n=4) | |
| Apple MacBook Pro 15 2017 (2.8 GHz, 555) | |
| Fallout 4 - 1920x1080 Ultra Preset AA:T AF:16x | |
| Asus GL503VD-DB74 | |
| Dell XPS 15 2018 i5 FHD 97Wh | |
| Dell XPS 15 9560 (i7-7700HQ, UHD) | |
| Média NVIDIA GeForce GTX 1050 Mobile (31 - 37, n=10) | |
| Asus Strix GL753VD-GC045T | |
| HP Pavilion 15 Power 1GK62AV | |
| baixo | média | alto | ultra | |
|---|---|---|---|---|
| BioShock Infinite (2013) | 67.5 | |||
| The Witcher 3 (2015) | 46.7 | 39 | 22.7 | |
| Fallout 4 (2015) | 45.4 | 36.7 | ||
| Rise of the Tomb Raider (2016) | 73.2 | 40.6 | 33.2 | |
| Dirt 4 (2017) | 61.9 | 32.6 | ||
| F1 2017 (2017) | 57 | 36 | ||
| Final Fantasy XV Benchmark (2018) | 63.6 | 32.5 | 22.7 |
Barulho
| Ocioso |
| 30.3 / 30.3 / 30.3 dB |
| Carga |
| 37.1 / 43 dB |
 | ||
30 dB silencioso 40 dB(A) audível 50 dB(A) ruidosamente alto |
||
min: | ||
| Dell XPS 15 2018 i5 FHD 97Wh GeForce GTX 1050 Mobile, i5-8300H, Lite-On CA3-8D256-Q11 | Dell XPS 13 9370 FHD i5 UHD Graphics 620, i5-8250U, Toshiba XG5 KXG50ZNV256G | Apple MacBook Pro 15 2017 (2.8 GHz, 555) Radeon Pro 555, i7-7700HQ, Apple SSD SM0256L | Dell XPS 15 2017 9560 (7300HQ, Full-HD) GeForce GTX 1050 Mobile, i5-7300HQ, WDC WD10SPCX-75KHST0 + SanDisk Z400s M.2 2242 32 GB Cache | Gigabyte Aero 15 GeForce GTX 1060 Mobile, i7-7700HQ, Lite-On CX2-8B512-Q11 | Asus Zenbook Pro UX550VE-DB71T GeForce GTX 1050 Ti Mobile, i7-7700HQ, Samsung PM961 NVMe MZVLW512HMJP | |
|---|---|---|---|---|---|---|
| Noise | 7% | -2% | -10% | -7% | -4% | |
| desligado / ambiente * (dB) | 30.3 | 29.1 4% | 30.9 -2% | 30.3 -0% | 31 -2% | 28.3 7% |
| Idle Minimum * (dB) | 30.3 | 29.1 4% | 31.3 -3% | 31.6 -4% | 32 -6% | 30.4 -0% |
| Idle Average * (dB) | 30.3 | 29.1 4% | 31.3 -3% | 31.6 -4% | 33 -9% | 31 -2% |
| Idle Maximum * (dB) | 30.3 | 29.1 4% | 31.7 -5% | 33.4 -10% | 34 -12% | 31.2 -3% |
| Load Average * (dB) | 37.1 | 32.2 13% | 39.7 -7% | 47.8 -29% | 39 -5% | 43.3 -17% |
| Witcher 3 ultra * (dB) | 43.3 | 35.5 18% | 43 1% | 46.2 -7% | ||
| Load Maximum * (dB) | 43 | 37.3 13% | 48.6 -13% | 47.8 -11% | 50 -16% | 46.2 -7% |
* ... menor é melhor
(-) A temperatura máxima no lado superior é 55 °C / 131 F, em comparação com a média de 36.8 °C / 98 F , variando de 21 a 71 °C para a classe Multimedia.
(-) A parte inferior aquece até um máximo de 49.1 °C / 120 F, em comparação com a média de 39.1 °C / 102 F
(+) Em uso inativo, a temperatura média para o lado superior é 28.7 °C / 84 F, em comparação com a média do dispositivo de 31.3 °C / ### class_avg_f### F.
(-) Jogando The Witcher 3, a temperatura média para o lado superior é 40.5 °C / 105 F, em comparação com a média do dispositivo de 31.3 °C / ## #class_avg_f### F.
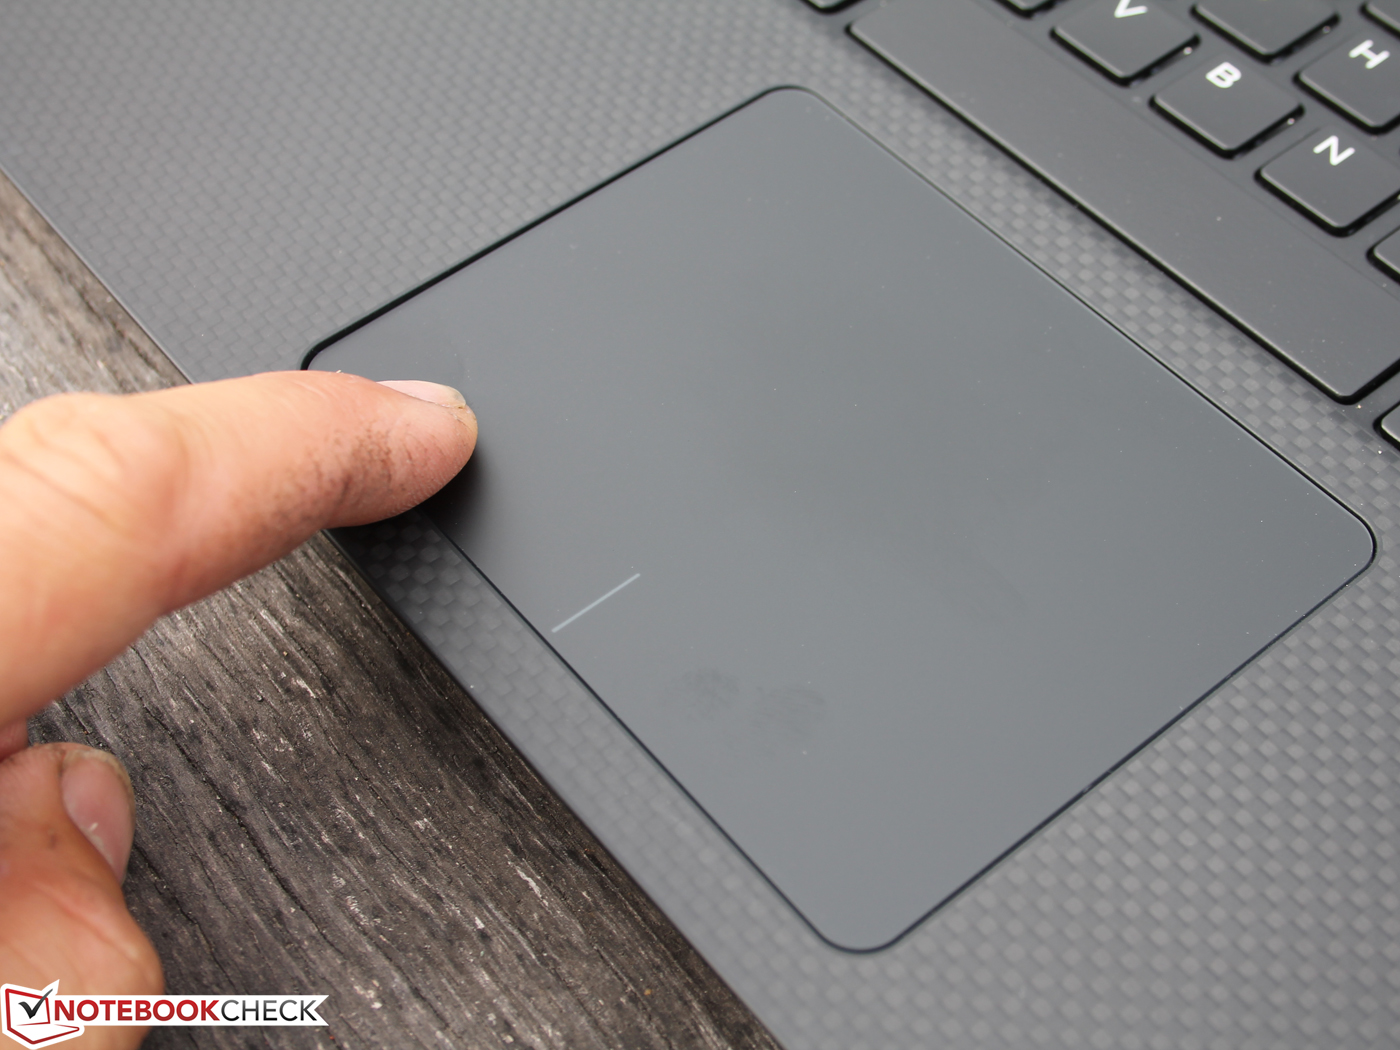
(±) Os apoios para as mãos e o touchpad podem ficar muito quentes ao toque, com um máximo de 37.1 °C / 98.8 F.
(-) A temperatura média da área do apoio para as mãos de dispositivos semelhantes foi 28.7 °C / 83.7 F (-8.4 °C / -15.1 F).
Dell XPS 15 2018 i5 FHD 97Wh análise de áudio
(±) | o volume do alto-falante é médio, mas bom (###valor### dB)
Graves 100 - 315Hz
(±) | graves reduzidos - em média 10.9% menor que a mediana
(+) | o baixo é linear (4.9% delta para a frequência anterior)
Médios 400 - 2.000 Hz
(±) | médios mais altos - em média 6.8% maior que a mediana
(+) | médios são lineares (6.8% delta para frequência anterior)
Altos 2 - 16 kHz
(+) | agudos equilibrados - apenas 3.7% longe da mediana
(+) | os máximos são lineares (6.9% delta da frequência anterior)
Geral 100 - 16.000 Hz
(±) | a linearidade do som geral é média (16.6% diferença em relação à mediana)
Comparado com a mesma classe
» 44% de todos os dispositivos testados nesta classe foram melhores, 7% semelhantes, 49% piores
» O melhor teve um delta de 5%, a média foi 17%, o pior foi 45%
Comparado com todos os dispositivos testados
» 29% de todos os dispositivos testados foram melhores, 6% semelhantes, 66% piores
» O melhor teve um delta de 4%, a média foi 24%, o pior foi 134%
Apple MacBook Pro 15 2017 (2.8 GHz, 555) análise de áudio
(+) | os alto-falantes podem tocar relativamente alto (###valor### dB)
Graves 100 - 315Hz
(±) | graves reduzidos - em média 8.7% menor que a mediana
(±) | a linearidade dos graves é média (11.1% delta para a frequência anterior)
Médios 400 - 2.000 Hz
(+) | médios equilibrados - apenas 2.5% longe da mediana
(±) | a linearidade dos médios é média (7.5% delta para frequência anterior)
Altos 2 - 16 kHz
(+) | agudos equilibrados - apenas 1.7% longe da mediana
(+) | os máximos são lineares (5% delta da frequência anterior)
Geral 100 - 16.000 Hz
(+) | o som geral é linear (7.9% diferença em relação à mediana)
Comparado com a mesma classe
» 7% de todos os dispositivos testados nesta classe foram melhores, 2% semelhantes, 91% piores
» O melhor teve um delta de 5%, a média foi 17%, o pior foi 45%
Comparado com todos os dispositivos testados
» 2% de todos os dispositivos testados foram melhores, 1% semelhantes, 98% piores
» O melhor teve um delta de 4%, a média foi 24%, o pior foi 134%
Dell XPS 15 2017 9560 (7300HQ, Full-HD) análise de áudio
(+) | os alto-falantes podem tocar relativamente alto (###valor### dB)
Graves 100 - 315Hz
(-) | quase nenhum baixo - em média 15.8% menor que a mediana
(±) | a linearidade dos graves é média (13.9% delta para a frequência anterior)
Médios 400 - 2.000 Hz
(+) | médios equilibrados - apenas 4.3% longe da mediana
(±) | a linearidade dos médios é média (7.1% delta para frequência anterior)
Altos 2 - 16 kHz
(+) | agudos equilibrados - apenas 3.1% longe da mediana
(±) | a linearidade dos máximos é média (7.9% delta para frequência anterior)
Geral 100 - 16.000 Hz
(+) | o som geral é linear (13.5% diferença em relação à mediana)
Comparado com a mesma classe
» 29% de todos os dispositivos testados nesta classe foram melhores, 4% semelhantes, 67% piores
» O melhor teve um delta de 5%, a média foi 17%, o pior foi 45%
Comparado com todos os dispositivos testados
» 14% de todos os dispositivos testados foram melhores, 4% semelhantes, 82% piores
» O melhor teve um delta de 4%, a média foi 24%, o pior foi 134%
| desligado | |
| Ocioso | |
| Carga |
|
Key:
min: | |
| Dell XPS 15 2018 i5 FHD 97Wh i5-8300H, GeForce GTX 1050 Mobile, Lite-On CA3-8D256-Q11, LED IGZO IPS InfinityEdge, 1920x1080, 15.6" | Apple MacBook Pro 15 2017 (2.8 GHz, 555) i7-7700HQ, Radeon Pro 555, Apple SSD SM0256L, IPS, 2880x1800, 15.4" | Gigabyte Aero 14-K8 i7-8750H, GeForce GTX 1050 Ti Mobile, Crucial MX300 CT525MX300SSD1, IPS, 2560x1440, 14" | Gigabyte Aero 15 i7-7700HQ, GeForce GTX 1060 Mobile, Lite-On CX2-8B512-Q11, IPS, 1920x1080, 15.6" | Asus Zenbook Pro UX550VE-DB71T i7-7700HQ, GeForce GTX 1050 Ti Mobile, Samsung PM961 NVMe MZVLW512HMJP, IPS, 1920x1080, 15.6" | Dell XPS 13 9370 FHD i5 i5-8250U, UHD Graphics 620, Toshiba XG5 KXG50ZNV256G, IPS, 1920x1080, 13.3" | MSI GT75 8RG-090 Titan i9-8950HK, GeForce GTX 1080 Mobile, 2x Samsung PM961 MZVLW256HEHP (RAID 0), TN, 1920x1080, 17.3" | Dell XPS 15 9560 (i7-7700HQ, UHD) i7-7700HQ, GeForce GTX 1050 Mobile, Lite-On CX2-8B512-Q11, IGZO IPS, 3840x2160, 15.6" | Dell XPS 15 2017 9560 (7300HQ, Full-HD) i5-7300HQ, GeForce GTX 1050 Mobile, WDC WD10SPCX-75KHST0 + SanDisk Z400s M.2 2242 32 GB Cache, LED IGZO IPS InfinityEdge, 1920x1080, 15.6" | Média NVIDIA GeForce GTX 1050 Mobile | Média da turma Multimedia | |
|---|---|---|---|---|---|---|---|---|---|---|---|
| Power Consumption | -39% | -55% | -121% | -30% | 25% | -418% | -116% | -49% | -62% | -45% | |
| Idle Minimum * (Watt) | 2.9 | 3.4 -17% | 7 -141% | 12 -314% | 6.3 -117% | 3.14 -8% | 31 -969% | 11.9 -310% | 6.6 -128% | 6.99 ? -141% | 5.71 ? -97% |
| Idle Average * (Watt) | 5.8 | 13.9 -140% | 10 -72% | 15 -159% | 7.9 -36% | 5.22 10% | 35 -503% | 17.1 -195% | 9 -55% | 10.7 ? -84% | 10.1 ? -74% |
| Idle Maximum * (Watt) | 7.5 | 17.6 -135% | 13 -73% | 20 -167% | 8.1 -8% | 6 20% | 45 -500% | 17.3 -131% | 10.7 -43% | 12.7 ? -69% | 12.4 ? -65% |
| Load Average * (Watt) | 77.5 | 71.1 8% | 73 6% | 82 -6% | 84.9 -10% | 38.5 50% | 130 -68% | 94.7 -22% | 77.5 -0% | 82.9 ? -7% | 65 ? 16% |
| Witcher 3 ultra * (Watt) | 84 | 57.9 31% | 96 -14% | 111 -32% | 96.3 -15% | 268 -219% | 104.8 -25% | ||||
| Load Maximum * (Watt) | 107 | 88.5 17% | 143 -34% | 161 -50% | 102.4 4% | 50.4 53% | 374 -250% | 122 -14% | 130 -21% | 115.3 ? -8% | 112.2 ? -5% |
* ... menor é melhor
| Dell XPS 15 2018 i5 FHD 97Wh i5-8300H, GeForce GTX 1050 Mobile, 97 Wh | Dell XPS 15 2017 9560 (7300HQ, Full-HD) i5-7300HQ, GeForce GTX 1050 Mobile, 56 Wh | Dell XPS 15 9560 (i7-7700HQ, UHD) i7-7700HQ, GeForce GTX 1050 Mobile, 97 Wh | Dell XPS 13 9370 FHD i5 i5-8250U, UHD Graphics 620, 52 Wh | Apple MacBook Pro 15 2017 (2.8 GHz, 555) i7-7700HQ, Radeon Pro 555, 76 Wh | Asus Zenbook Pro UX550VE-DB71T i7-7700HQ, GeForce GTX 1050 Ti Mobile, 73 Wh | Gigabyte Aero 14-K8 i7-8750H, GeForce GTX 1050 Ti Mobile, 94.24 Wh | Gigabyte Aero 15 i7-7700HQ, GeForce GTX 1060 Mobile, 94.24 Wh | Média da turma Multimedia | |
|---|---|---|---|---|---|---|---|---|---|
| Duração da bateria | -45% | -33% | -14% | -10% | -40% | 19% | -28% | -18% | |
| WiFi v1.3 (h) | 15.7 | 5.6 -64% | 7.2 -54% | 10.7 -32% | 10.7 -32% | 8.9 -43% | 11 -30% | 7 -55% | 12 ? -24% |
| Witcher 3 ultra (h) | 1 | 1.5 50% | |||||||
| Load (h) | 1.9 | 1.4 -26% | 1.7 -11% | 2 5% | 1 -47% | 1.2 -37% | 3.2 68% | 1.9 0% | 1.675 ? -12% |
| Reader / Idle (h) | 9.4 | 13.9 | 23.6 | 17.1 | 17.6 | 10.6 | 25.2 ? | ||
| H.264 (h) | 13.9 | 8.5 | 7.7 | 16.4 ? |
Pro
Contra
Não mudou muita coisa por fora, mas os usuários do XPS 15 2018 logo perceberão: A Dell conseguiu tornar um portátil já muito bom ainda melhor. Suas emissões, tempos de duração da bateria e um detalhe na seleção de portas foram aprimorados. O resultado é uma avaliação melhor.
A Dell conseguiu tornar um portátil já muito bom ainda melhor. Suas emissões, tempos de duração da bateria e um detalhe na seleção de portas foram aprimorados.
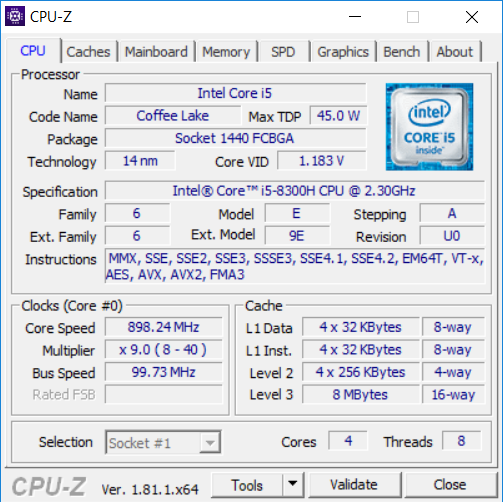
O desempenho do i5-8300H já tem muito a oferecer aos usuários. Comparado com as versões mais caras com o Core i7-8750H e Core i9-8950HK (ambos com seis núcleos), o i5-8300H só tem uma desvantagem real quando se trata de multitarefa intensiva.
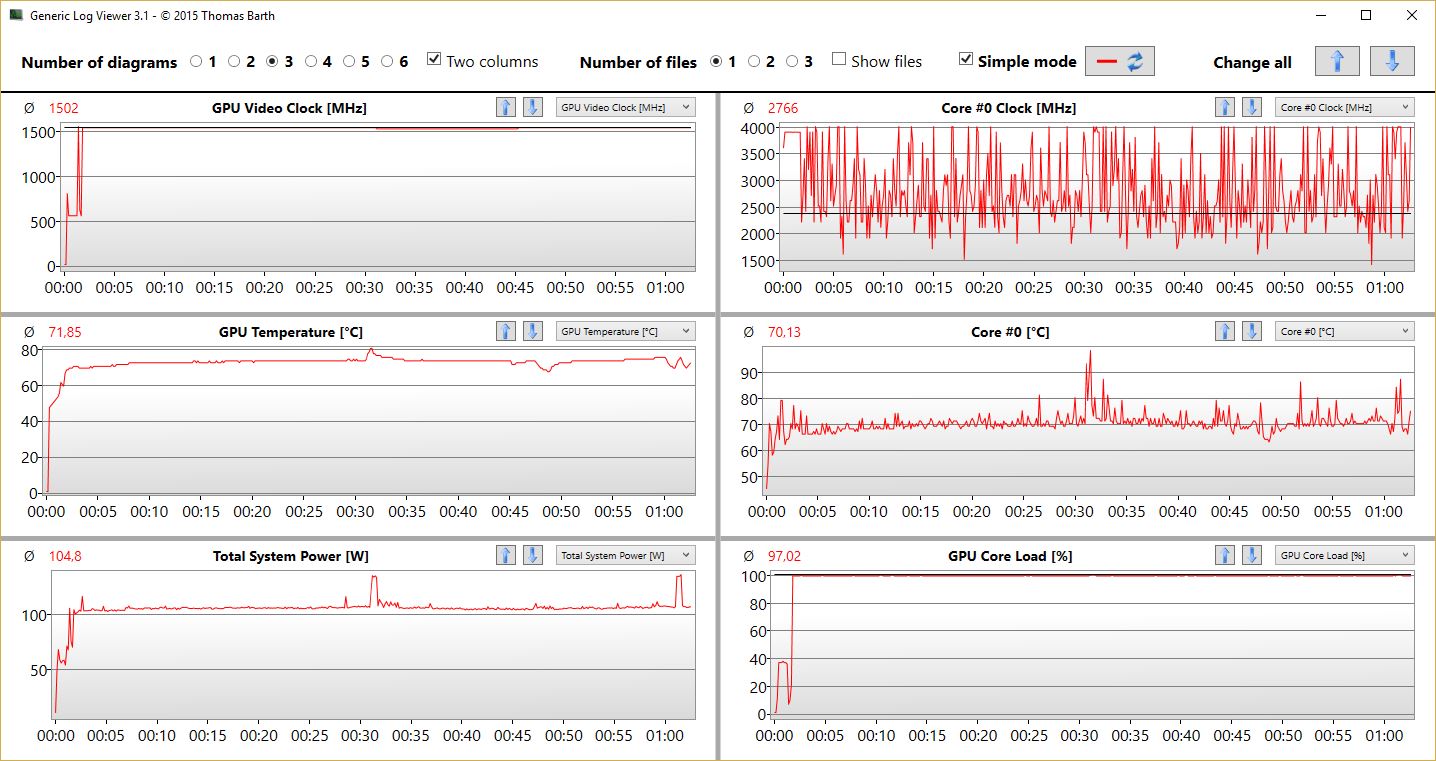
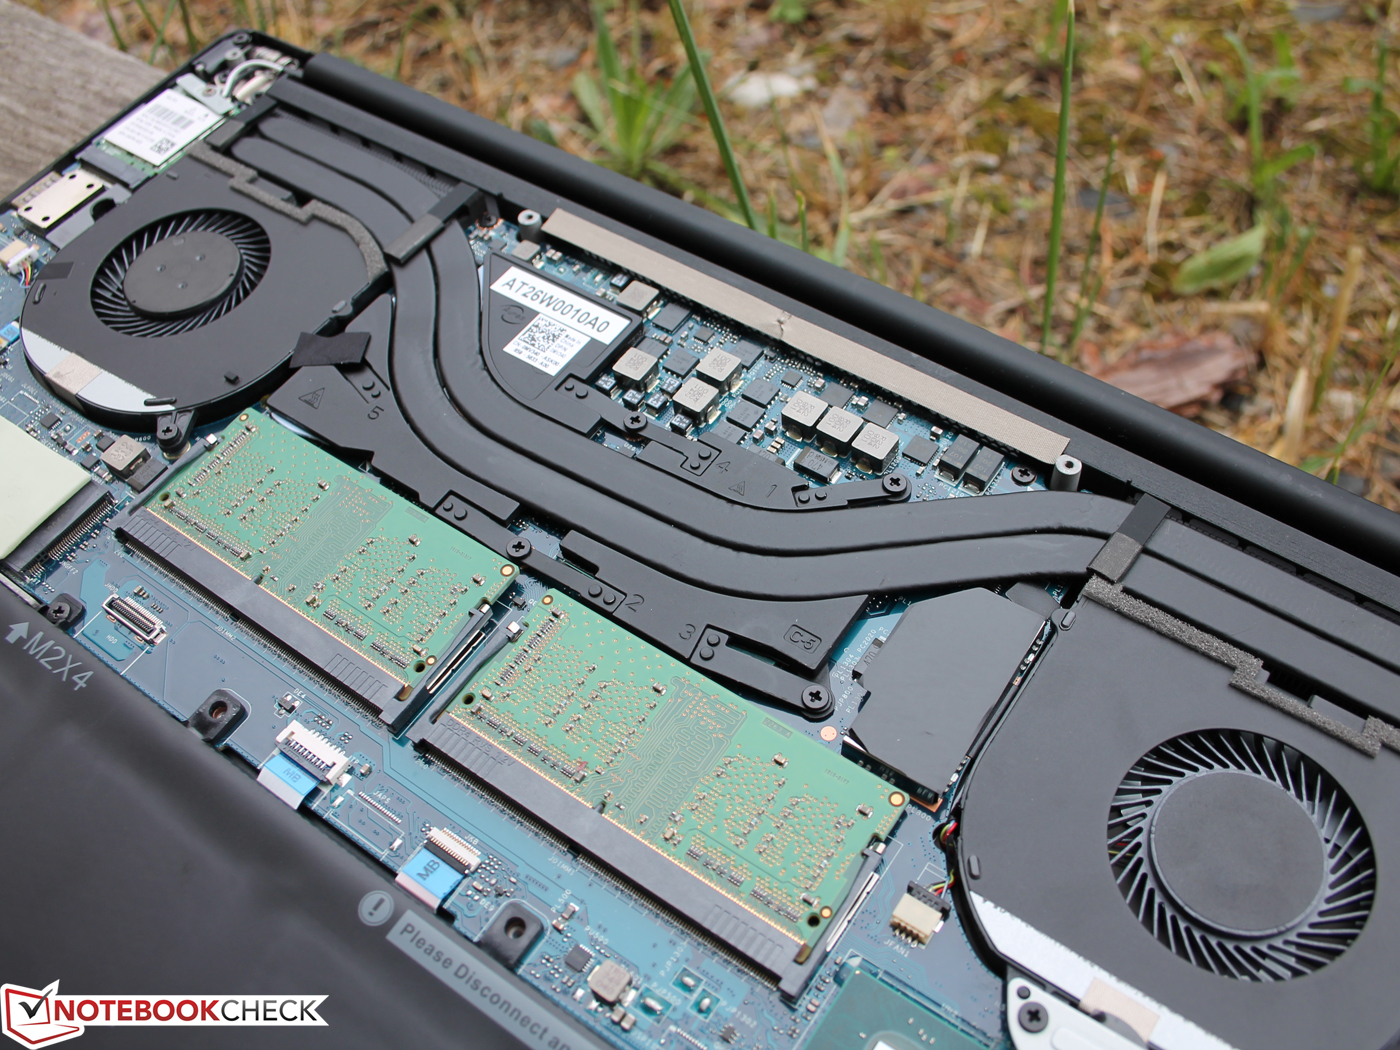
O i5-8300H faz uso total de seu sistema de resfriamento (ventilador duplo, 94 °C / 201 °F), mas é limitado apenas minimamente pelo limite de temperatura (-3,5%). Estamos curiosos para ver como o modelo de seis núcleos se sai neste caso e se ele também consegue manter o afogamento a um mínimo. Somente o teste de estresse fez com que o processador fosse afogado de forma significativa, como era de se esperar. A GPU Nvidia toma precedência. Isso não se aplica à carga normal do processador, mas apenas à combinação pouco realista de 100% de carga de CPU e GPU cada.
O nosso dispositivo 8300H recebeu bons resultados nos benchmarks PCMark e há apenas pequenas diferenças no desempenho de 0 - 6% para poderosos dispositivos multimídia. O SSD Lite-On não consegue acompanhar os SSDs no XPS 15 2017 ou Aero 15 de acordo com os benchmarks, mas isso não parece ter impacto nos resultados do PCMark.
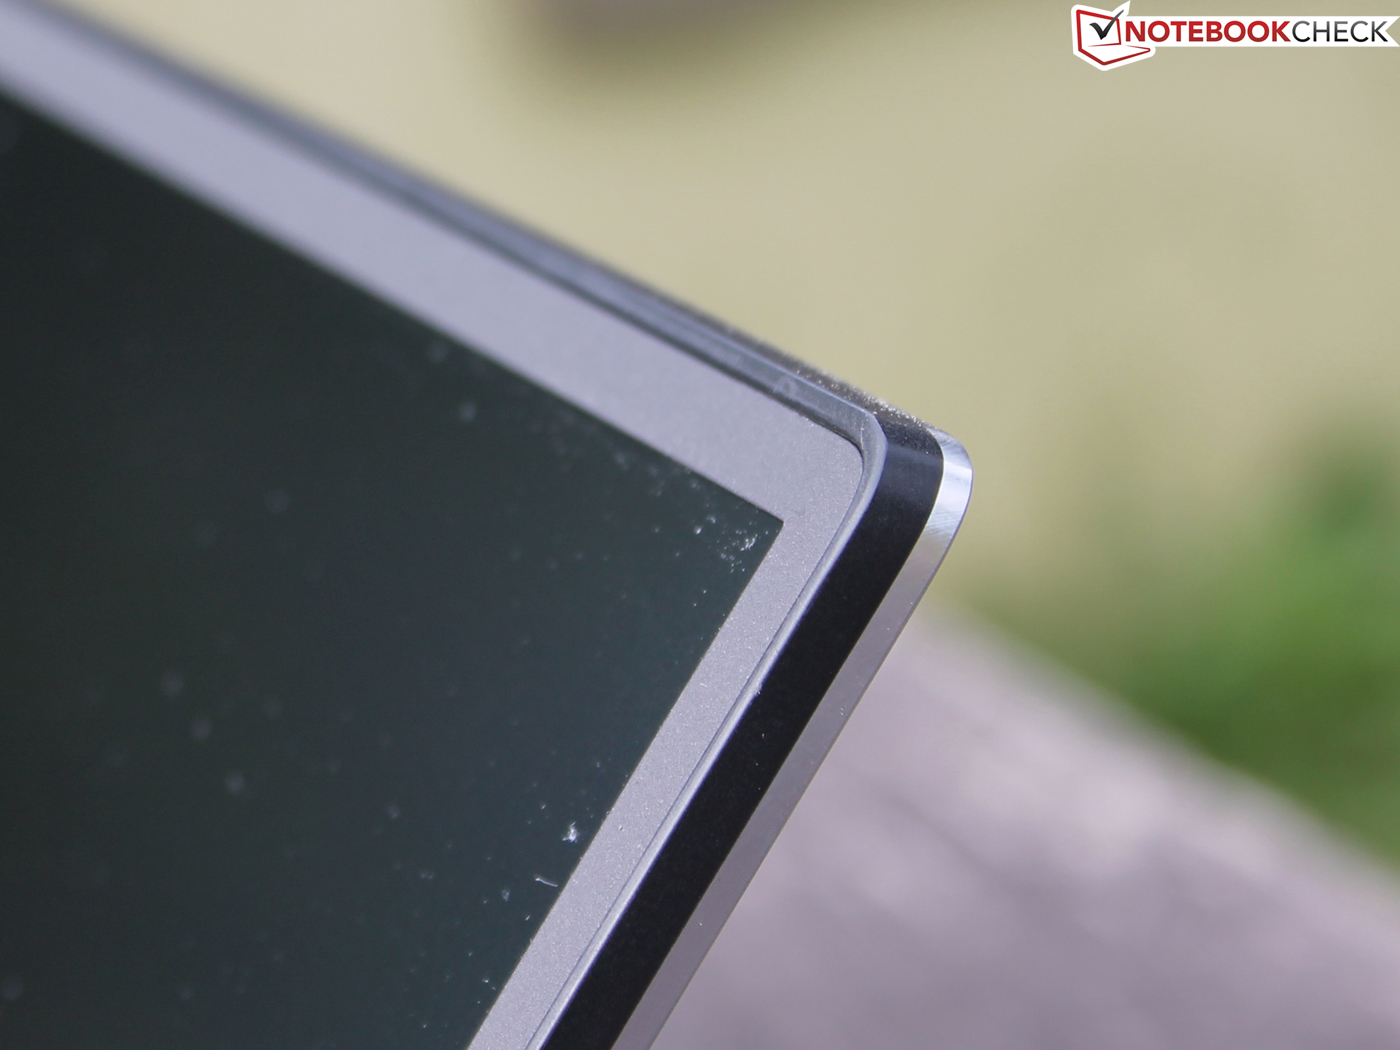
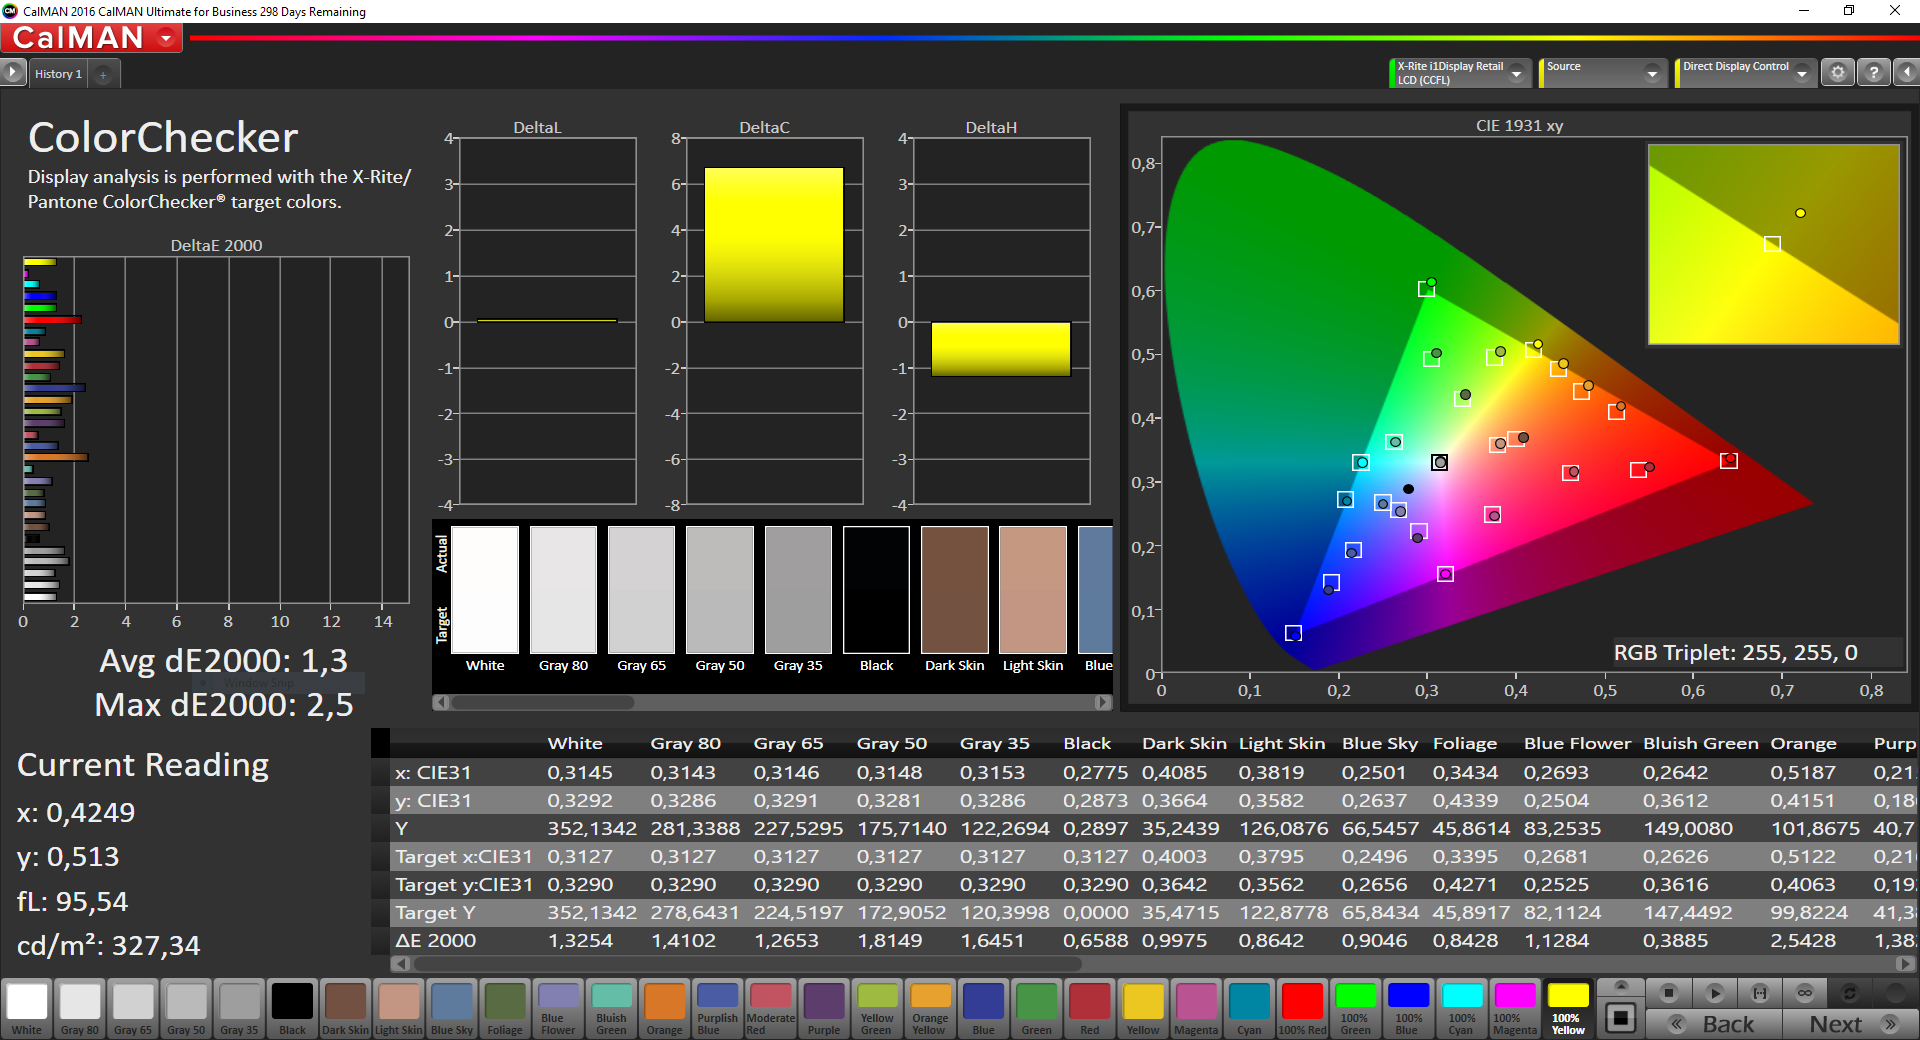
Nós preferimos a tela FHD à do modelo 2017. Embora o painel seja da mesma estrutura, a nova tela oferece melhor exibição de cores de fábrica (sem calibração) e taxas de resposta mais baixas. O contraste e a cobertura do espaço de cores permanecem muito bons. No entanto, esta é a primeira vez que a Dell escolheu usar o PWM para reduzir o brilho, embora isso não ocorra até um nível de brilho de 10% ou inferior e não deve afetar o uso diário da maioria dos usuários.
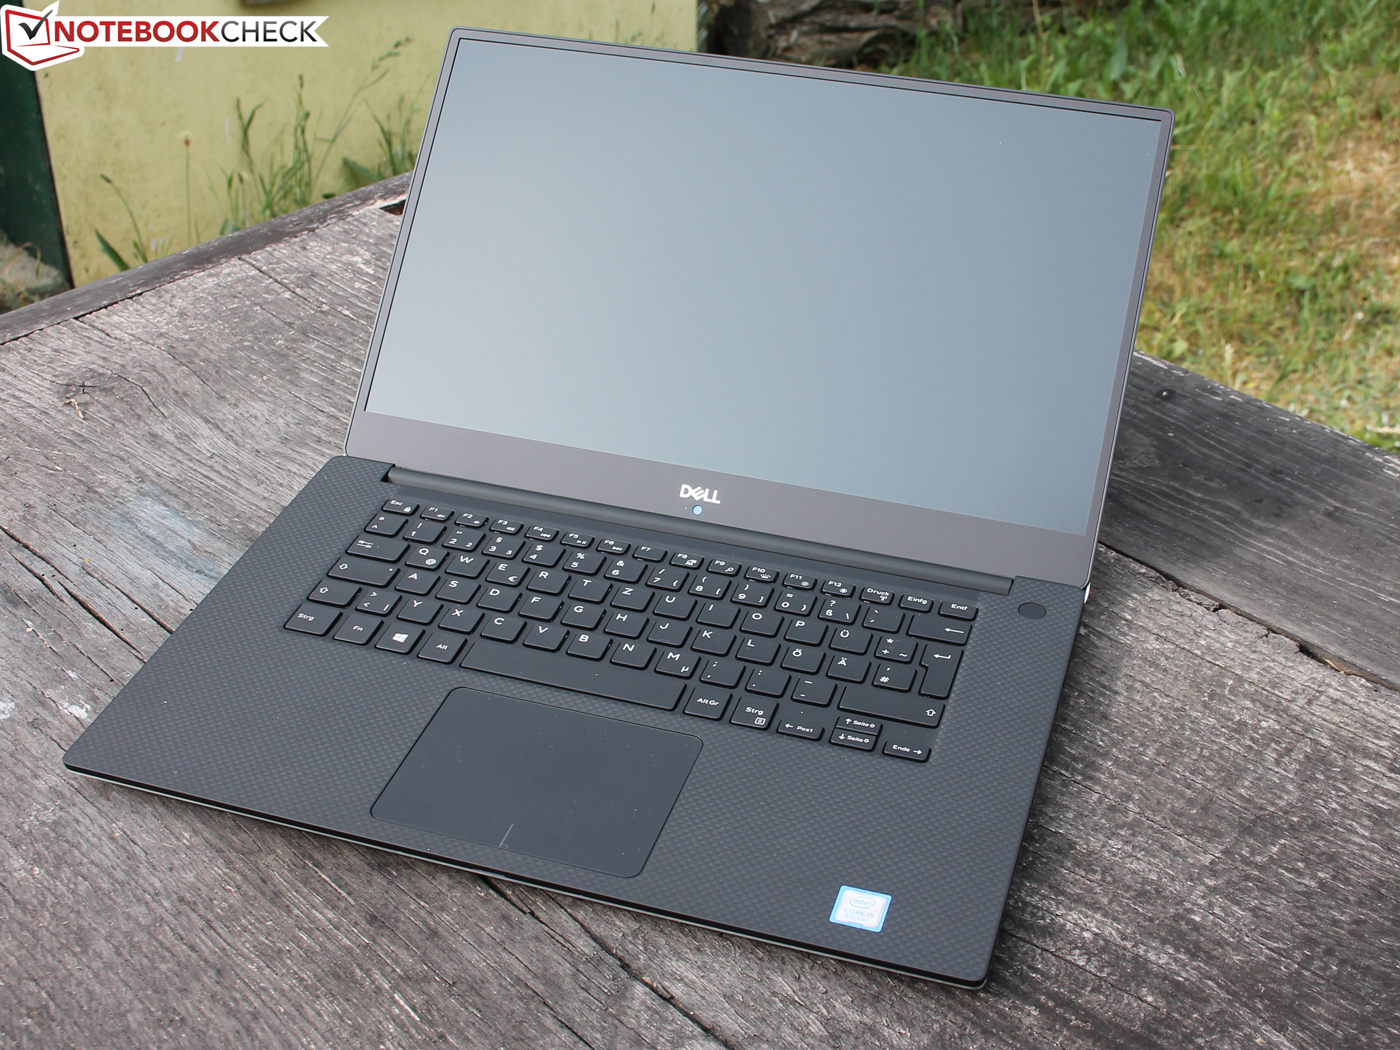
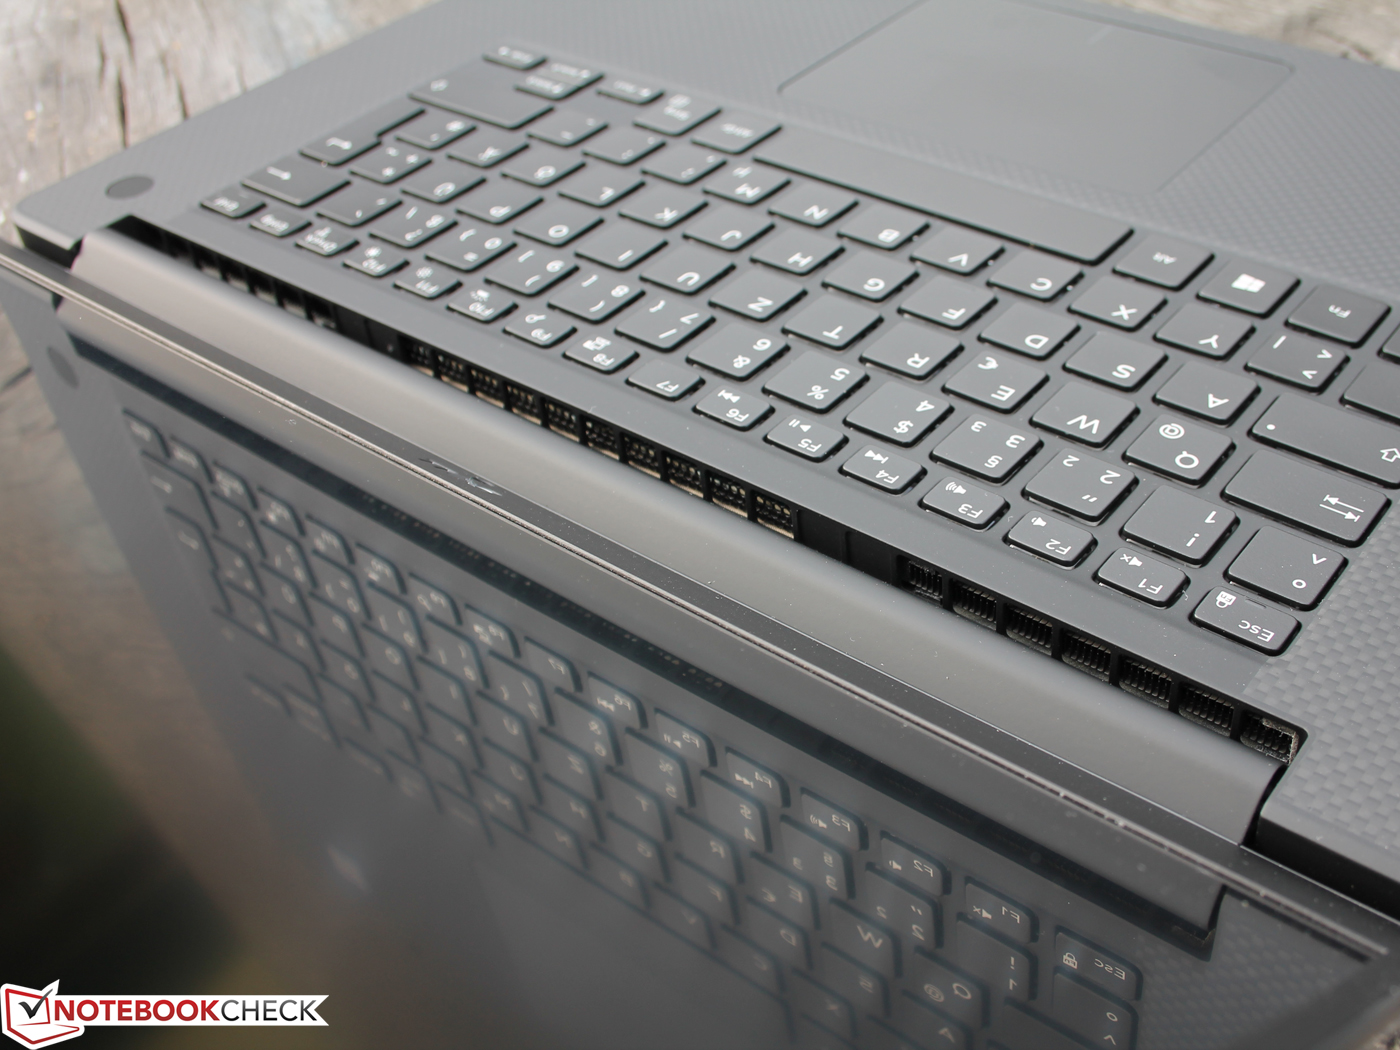
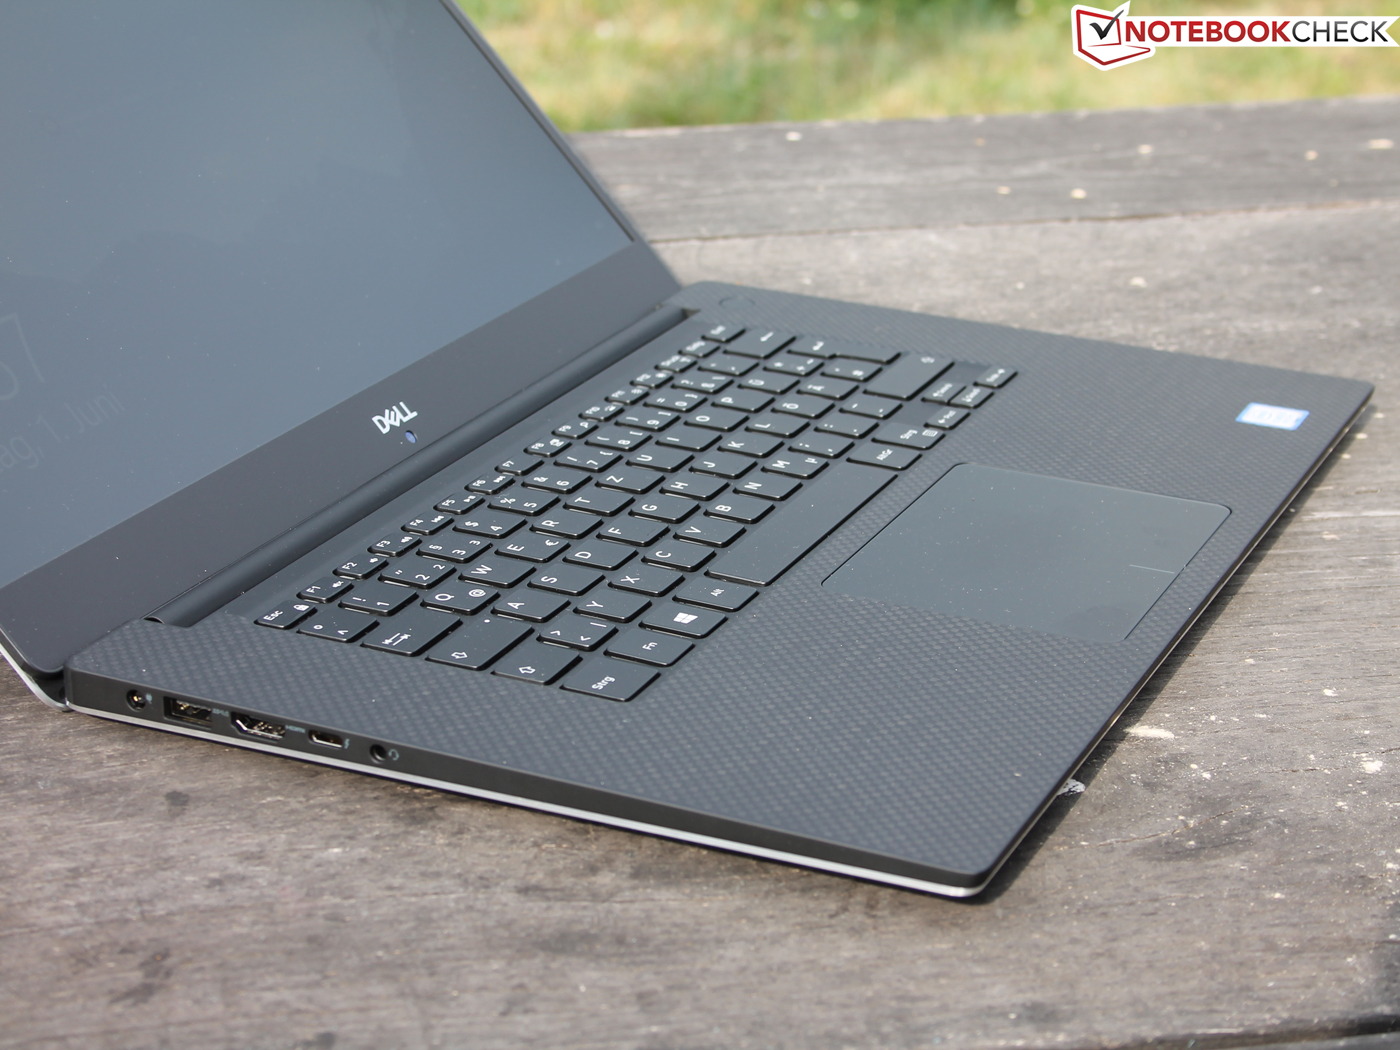
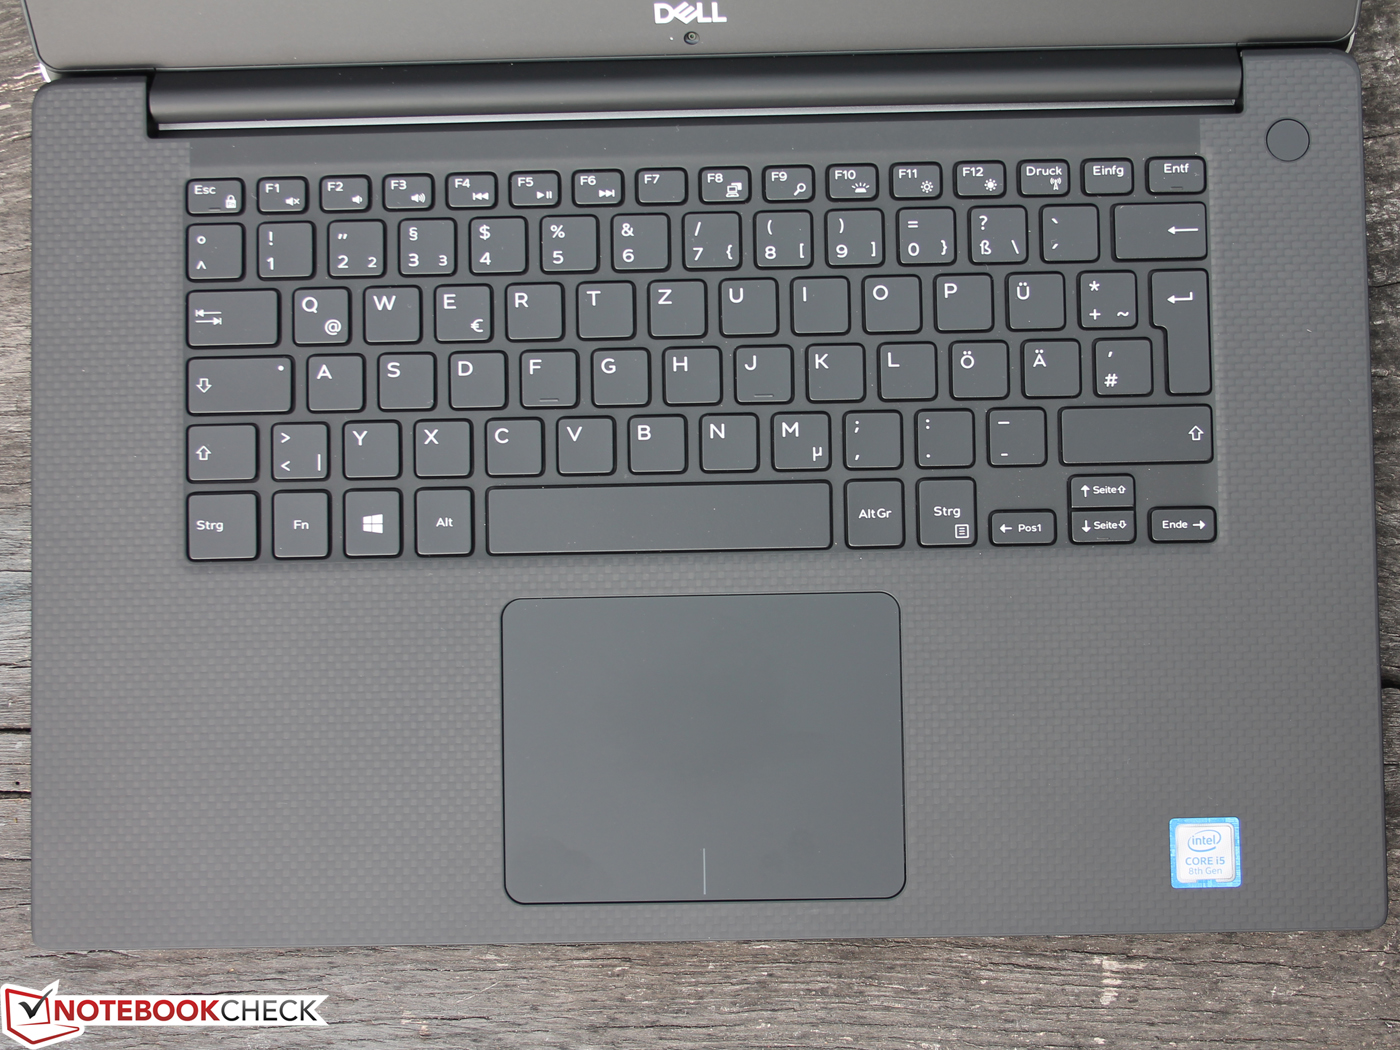
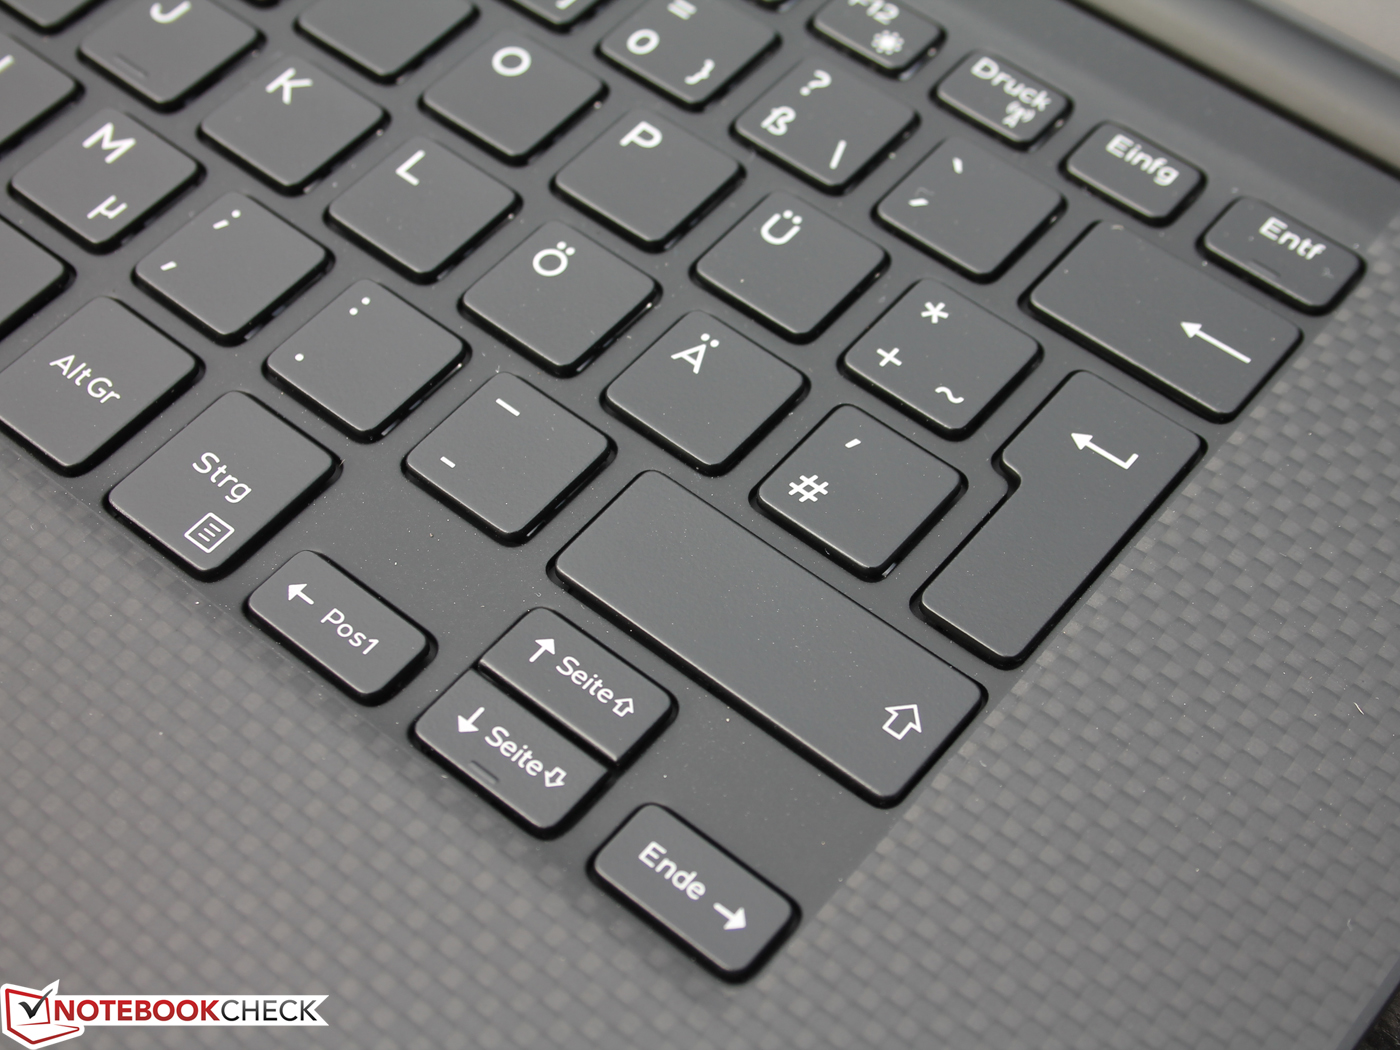
Os dispositivos de entrada são de alta qualidade como de costume, e são adequados para datilógrafos frequentes, não há alterações aqui. A retro iluminação do teclado ainda tem PWM a 64 Hz no nível de luminosidade inferior.
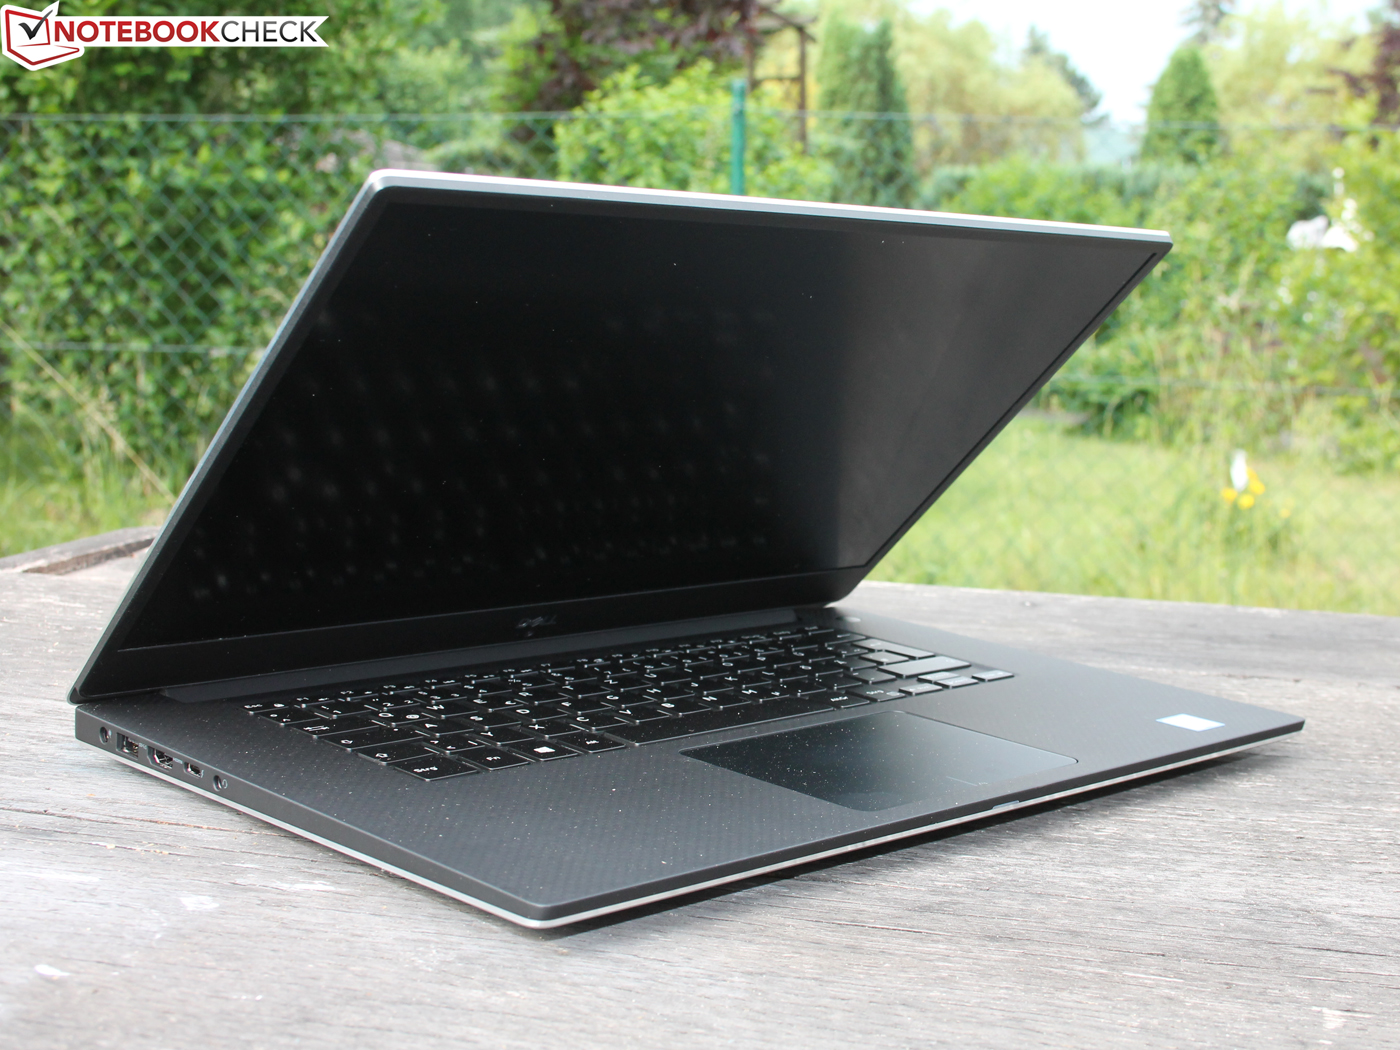
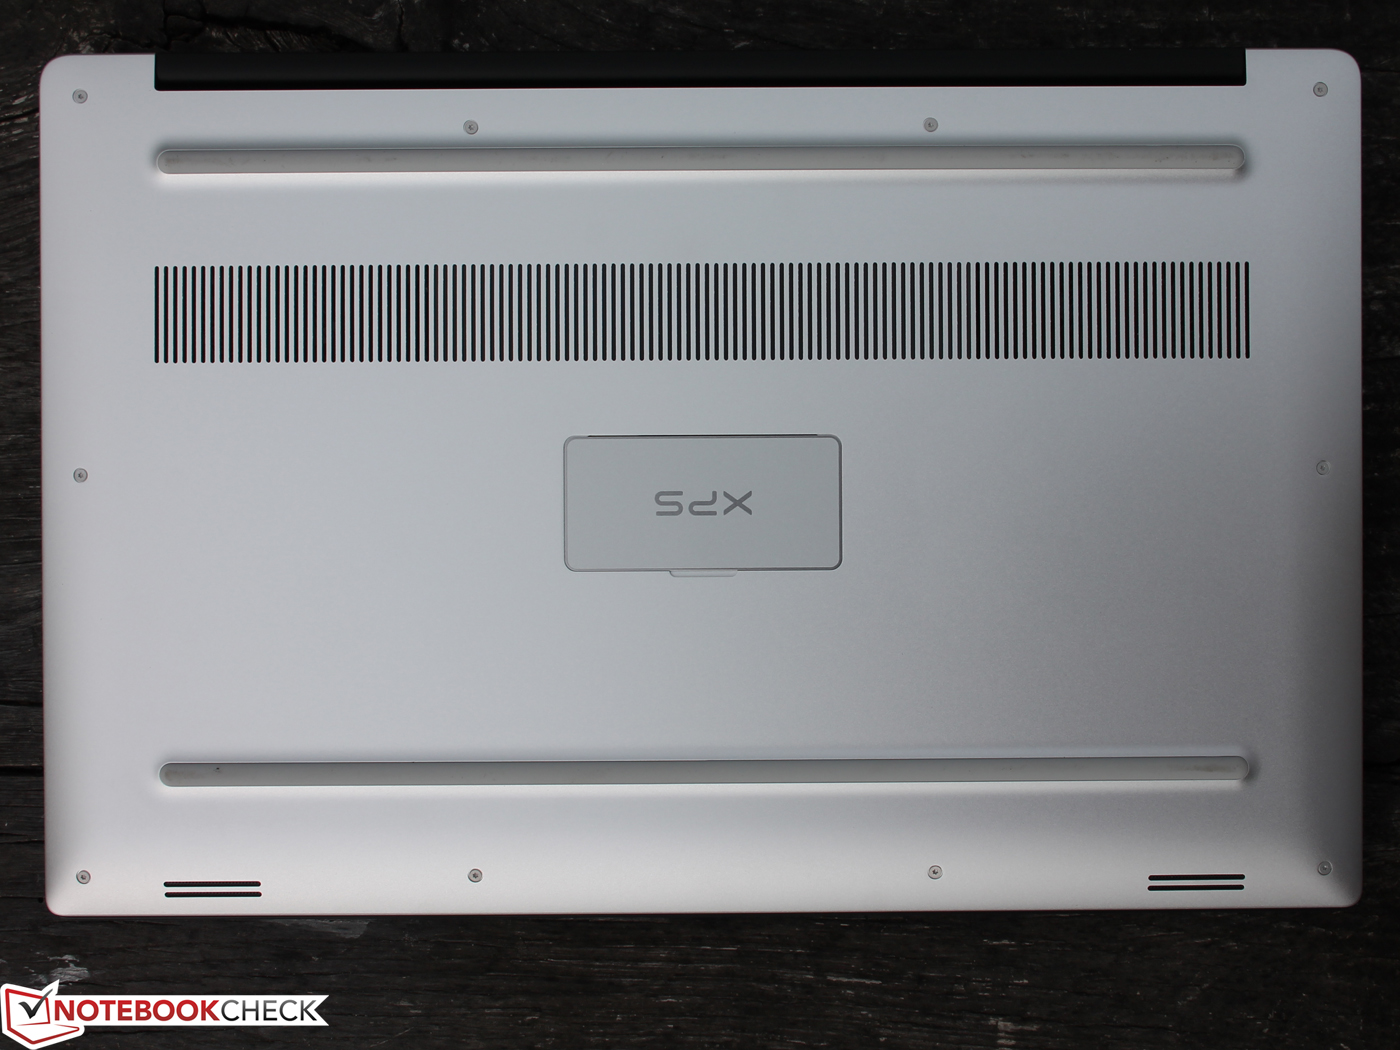
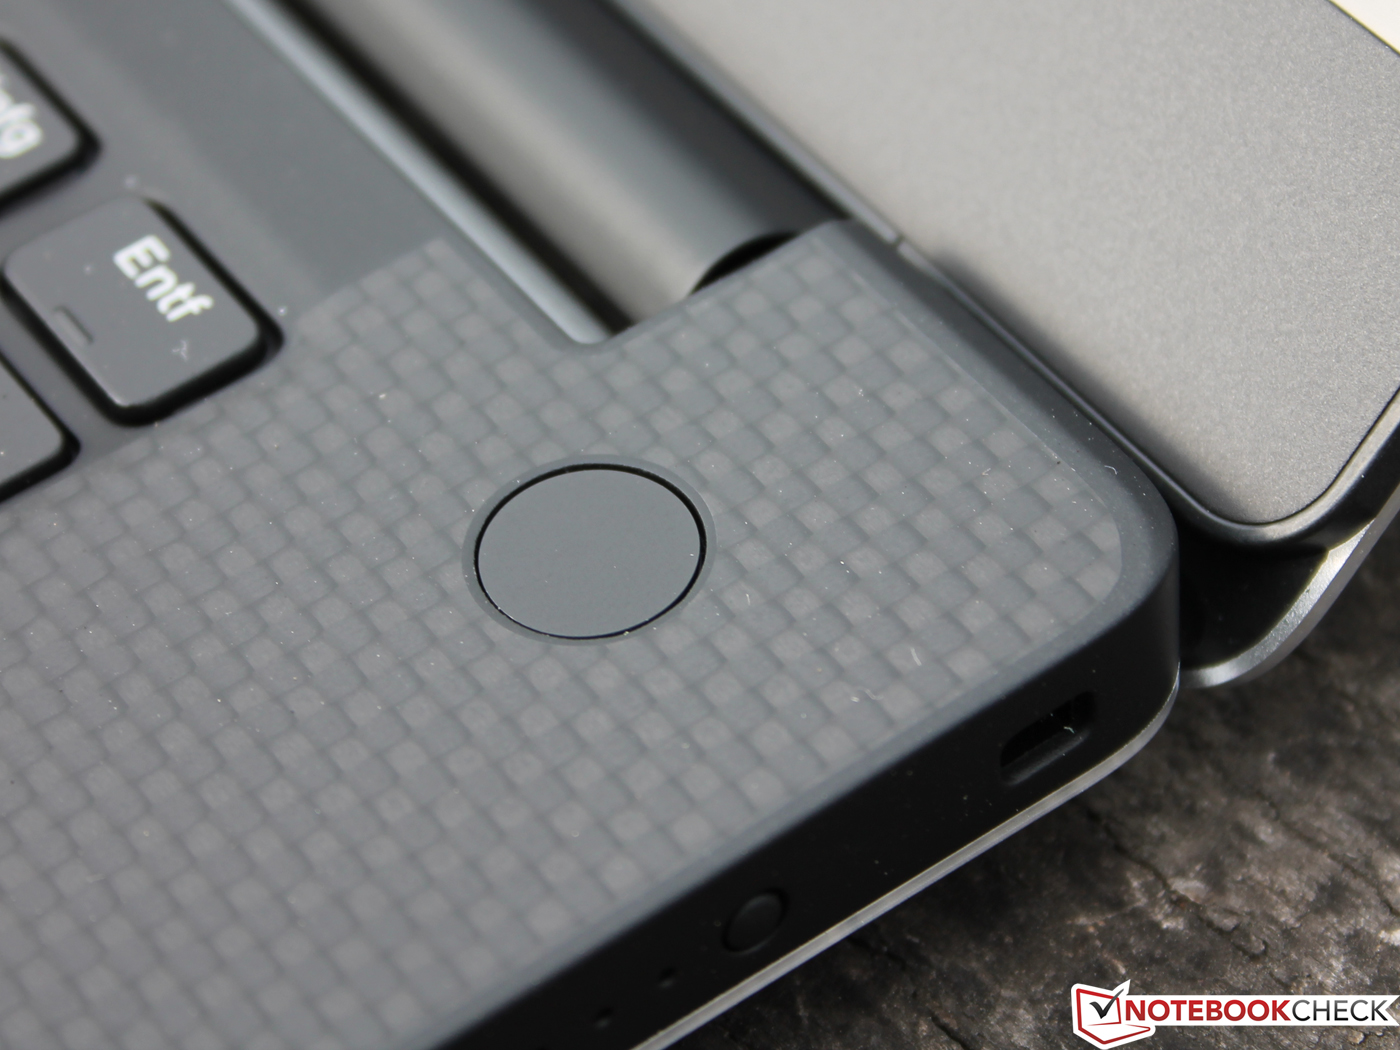
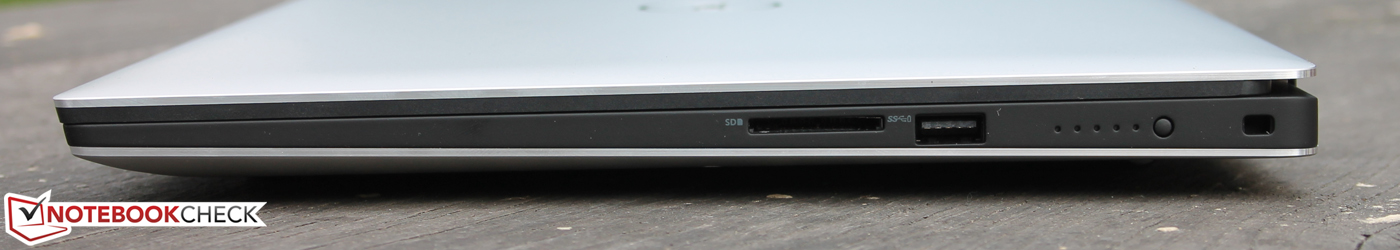
A Dell continua a oferecer as opções básicas de 2 dispositivos de armazenamento e 56 Wh ou 1 dispositivo de armazenamento e 97 Wh. Isto oferece muita flexibilidade na configuração do seu dispositivo e também é possível combinar um i7 com 56 Wh.
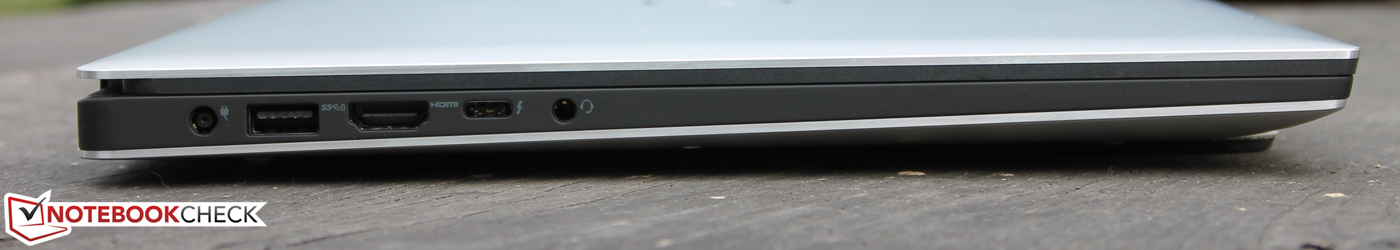
A duração é ótima: Quase 16 horas durante o teste de Wi-Fi. Durante os jogos, a GTX 1050 Ti tem uma vantagem de cerca de 20%; a GTX 1050 funciona acima da média. Estamos curiosos para ver o que a GTX 1050 Ti pode fazer no XPS 15. Os jogadores com uma GPU externa, como o Razer Core, ficarão satisfeitos com as quatro faixas PCIe da porta Thunderbolt 3 (a 9560 tinha apenas duas faixas).
Não encontramos nada para criticar sobre o ruído do sistema do dispositivo, que não era ideal no XPS 15 2017. O volume máximo é menor e os ventiladores permanecem desligados enquanto estão no modo inativo com um script da web. Portanto, é possível trabalhar silenciosamente ao usar aplicativos de escritório.
Em seguida, vamos dar uma olhada nas versões Core i7/i9, GTX 1050 Ti do XPS 15 9570. As unidades de teste já estão a caminho.
Atualização 06/06/2018:
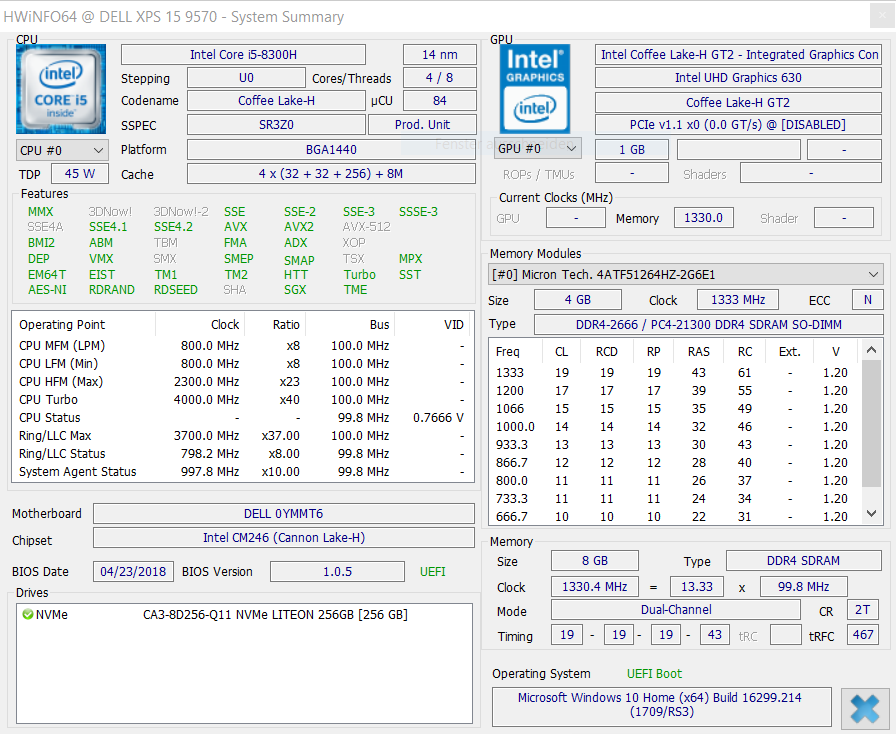
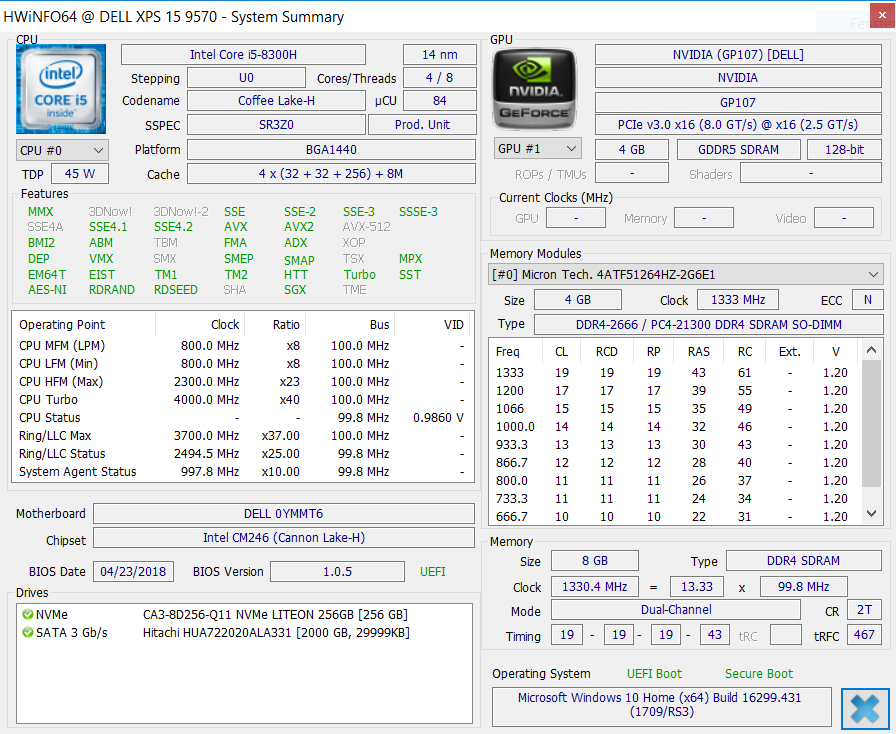
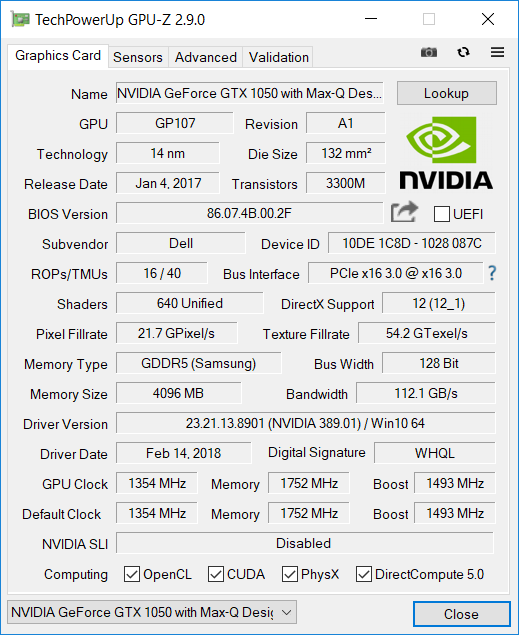
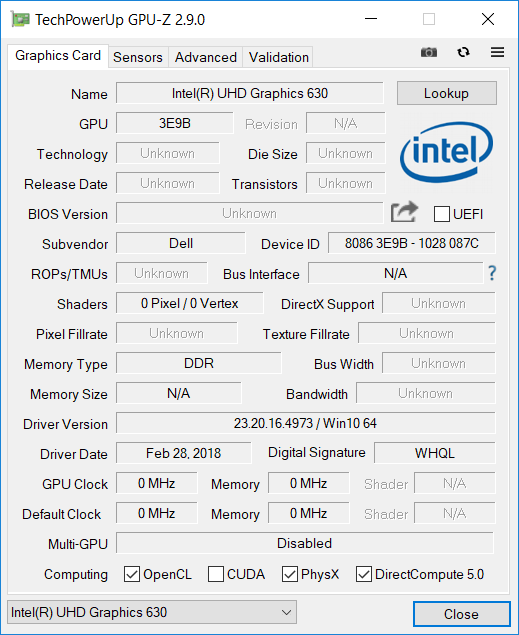
Enquanto isso, a Dell confirmou um problema de controlador que faz com que a placa gráfica seja identificada incorretamente. O controlador A01 de 30/05/2018 deve reconhecer a GPU corretamente. Você pode baixar o controlador no site da Dell. Aqui.
Dell XPS 15 2018 i5 FHD 97Wh
- 06/05/2018 v6 (old)
Sebastian Jentsch
Price comparison
