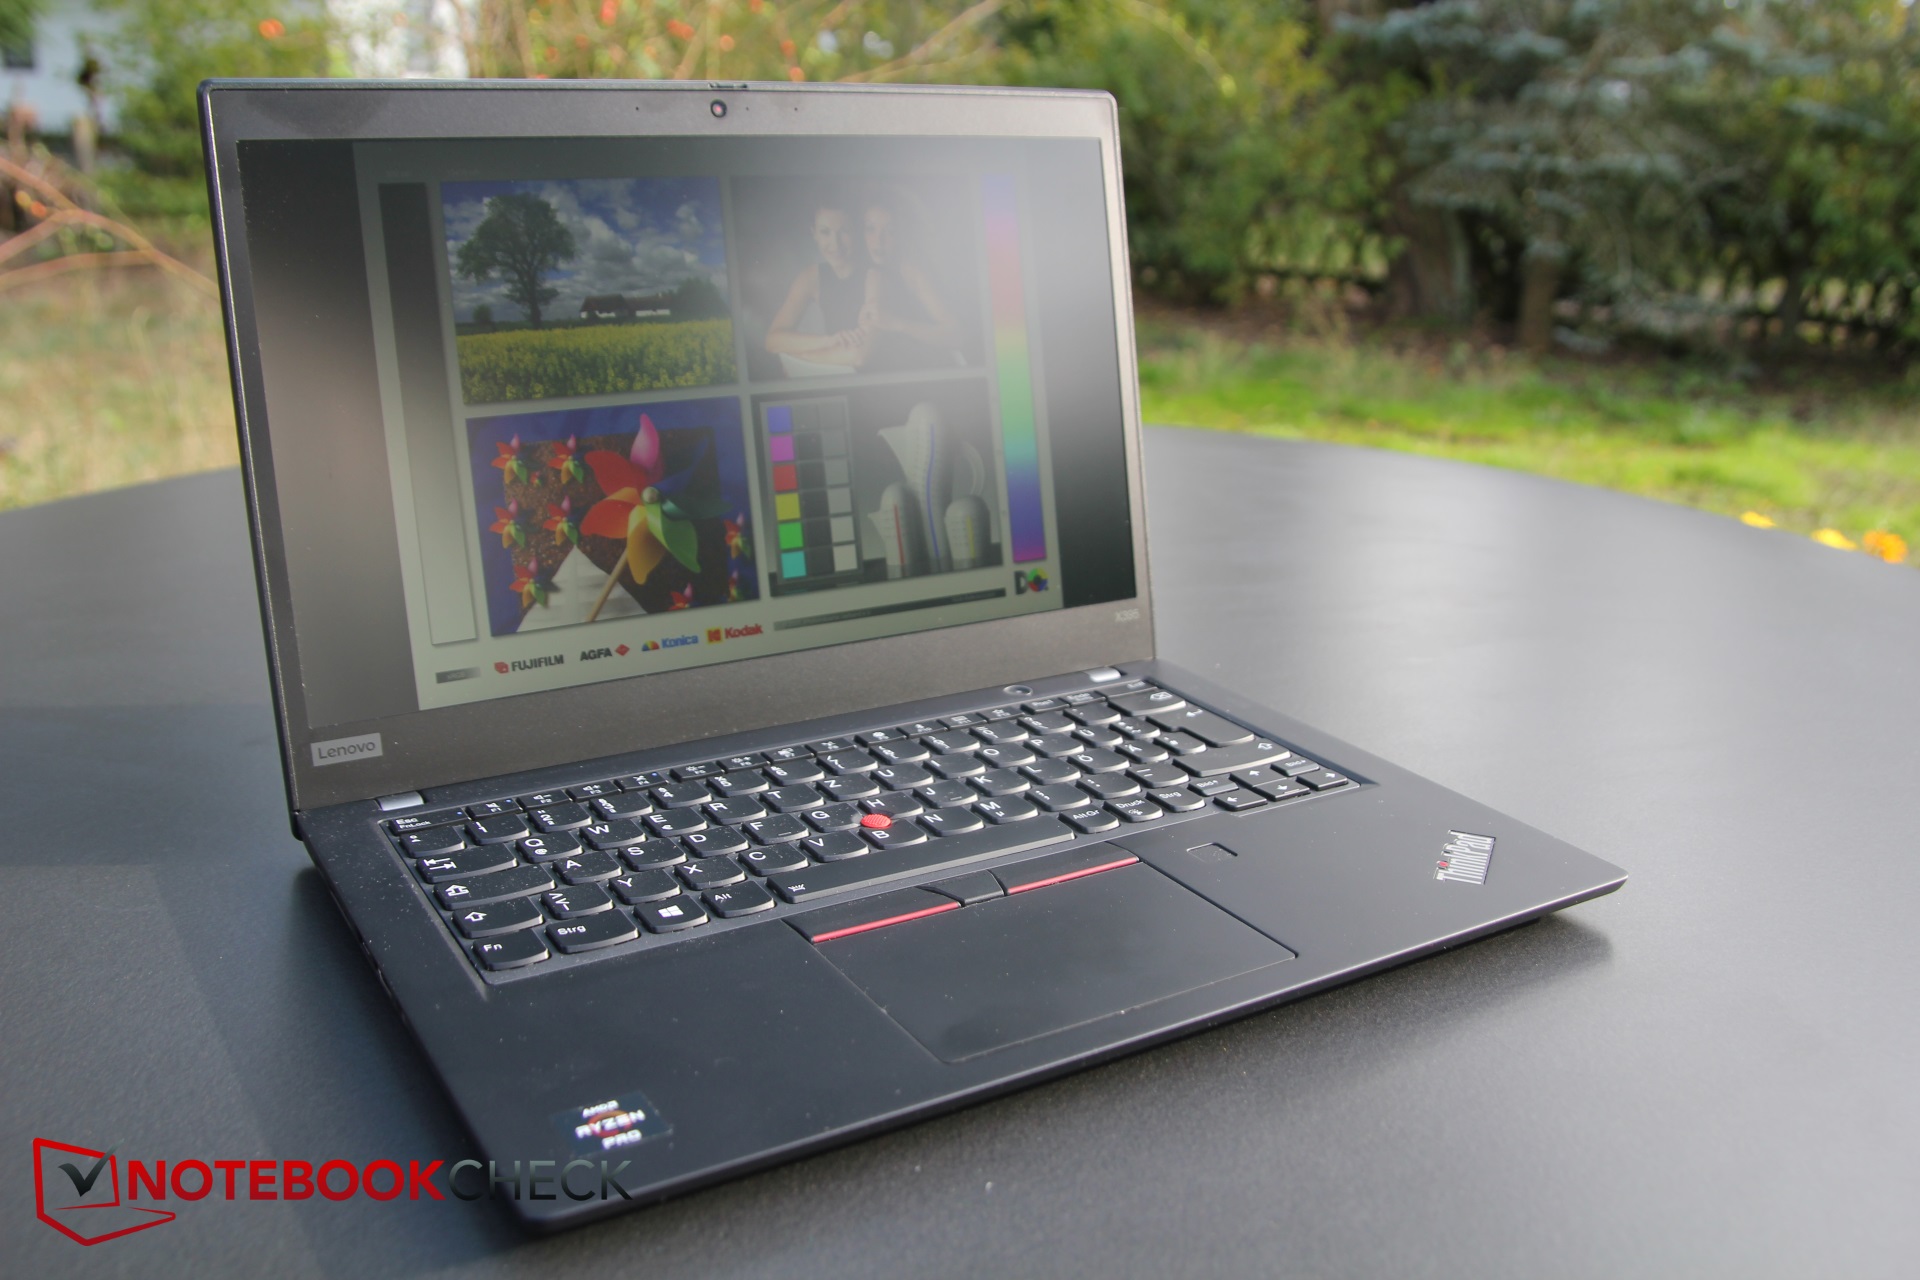
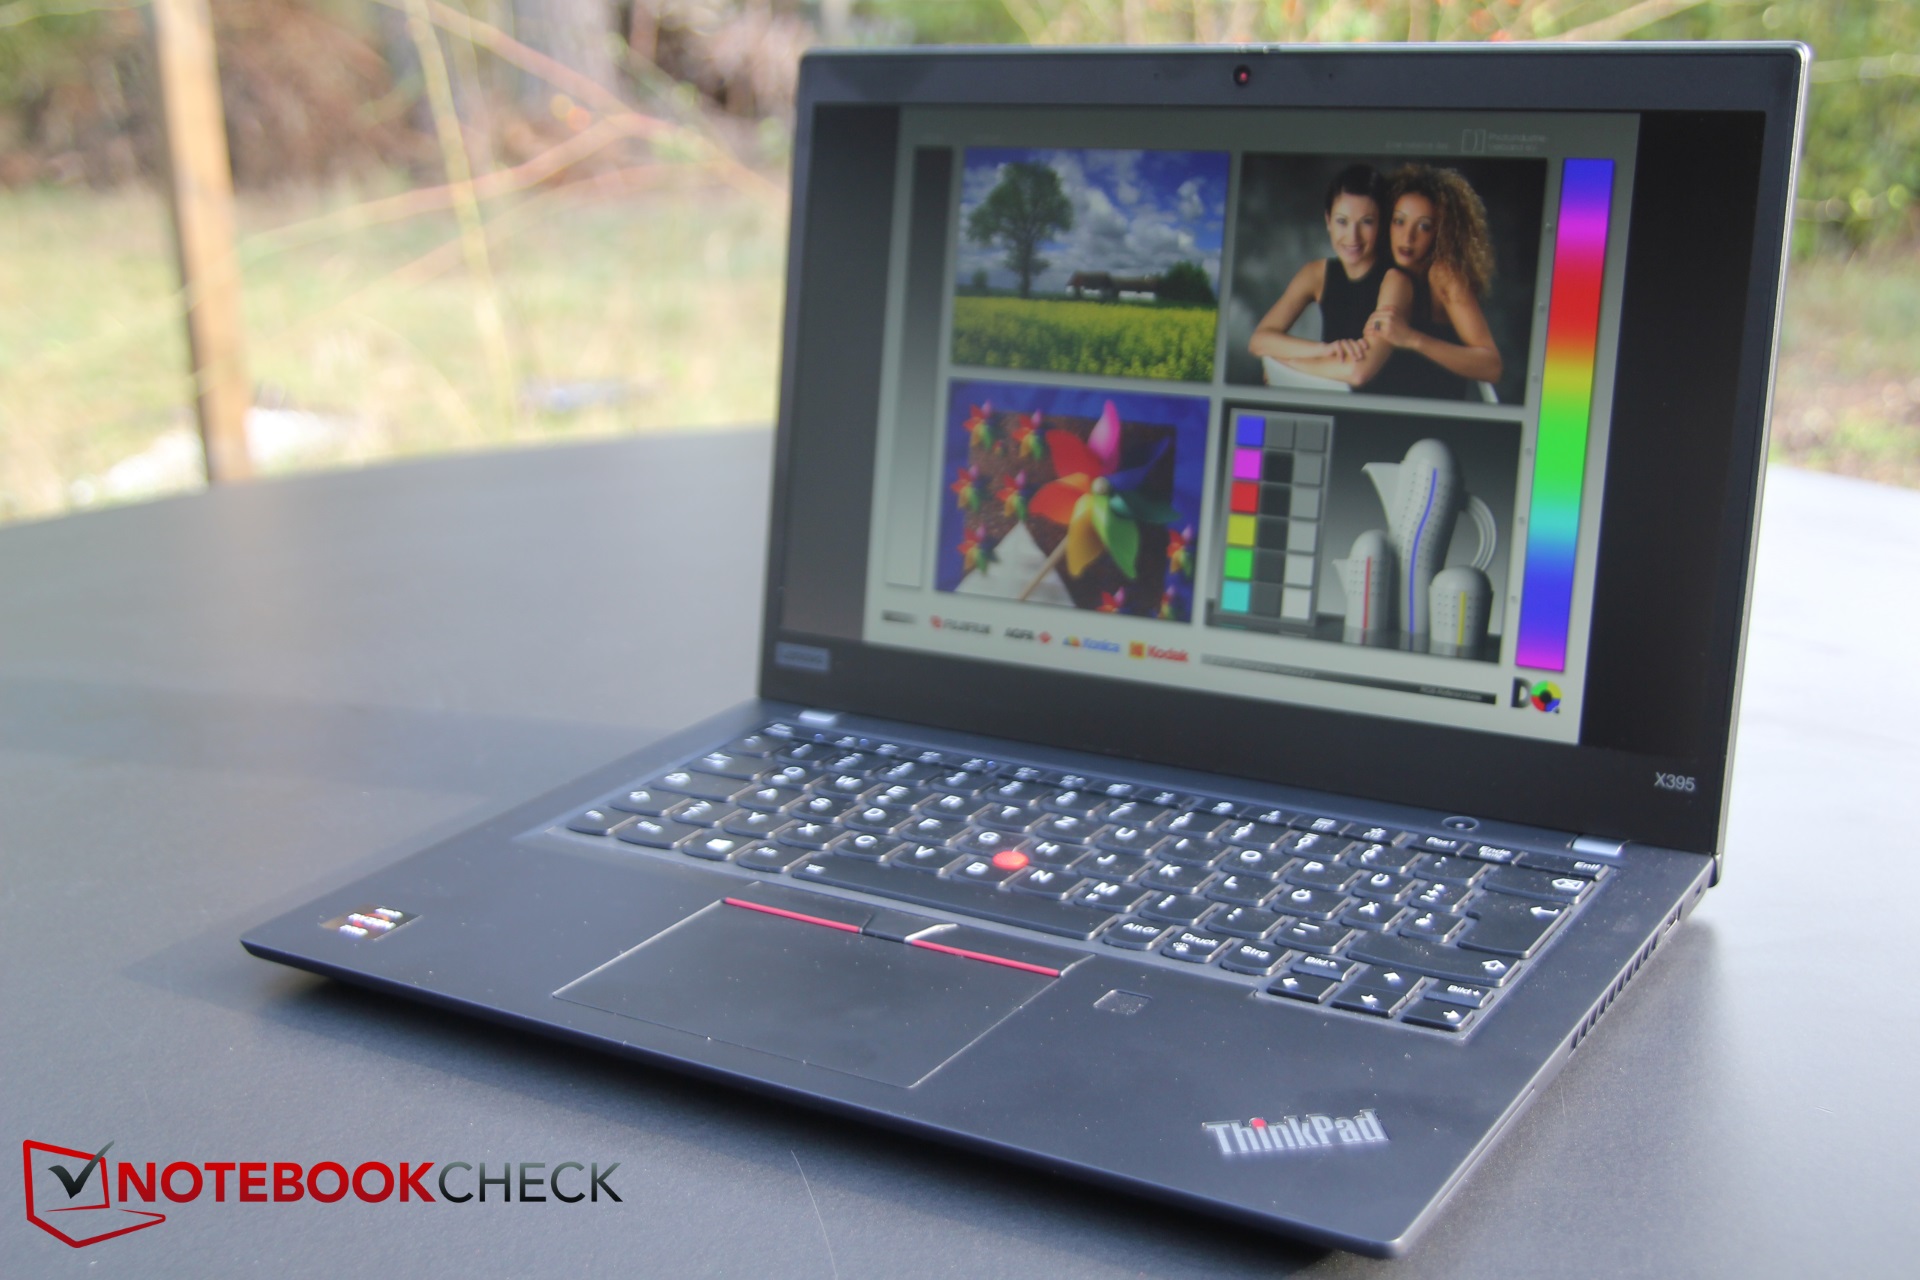
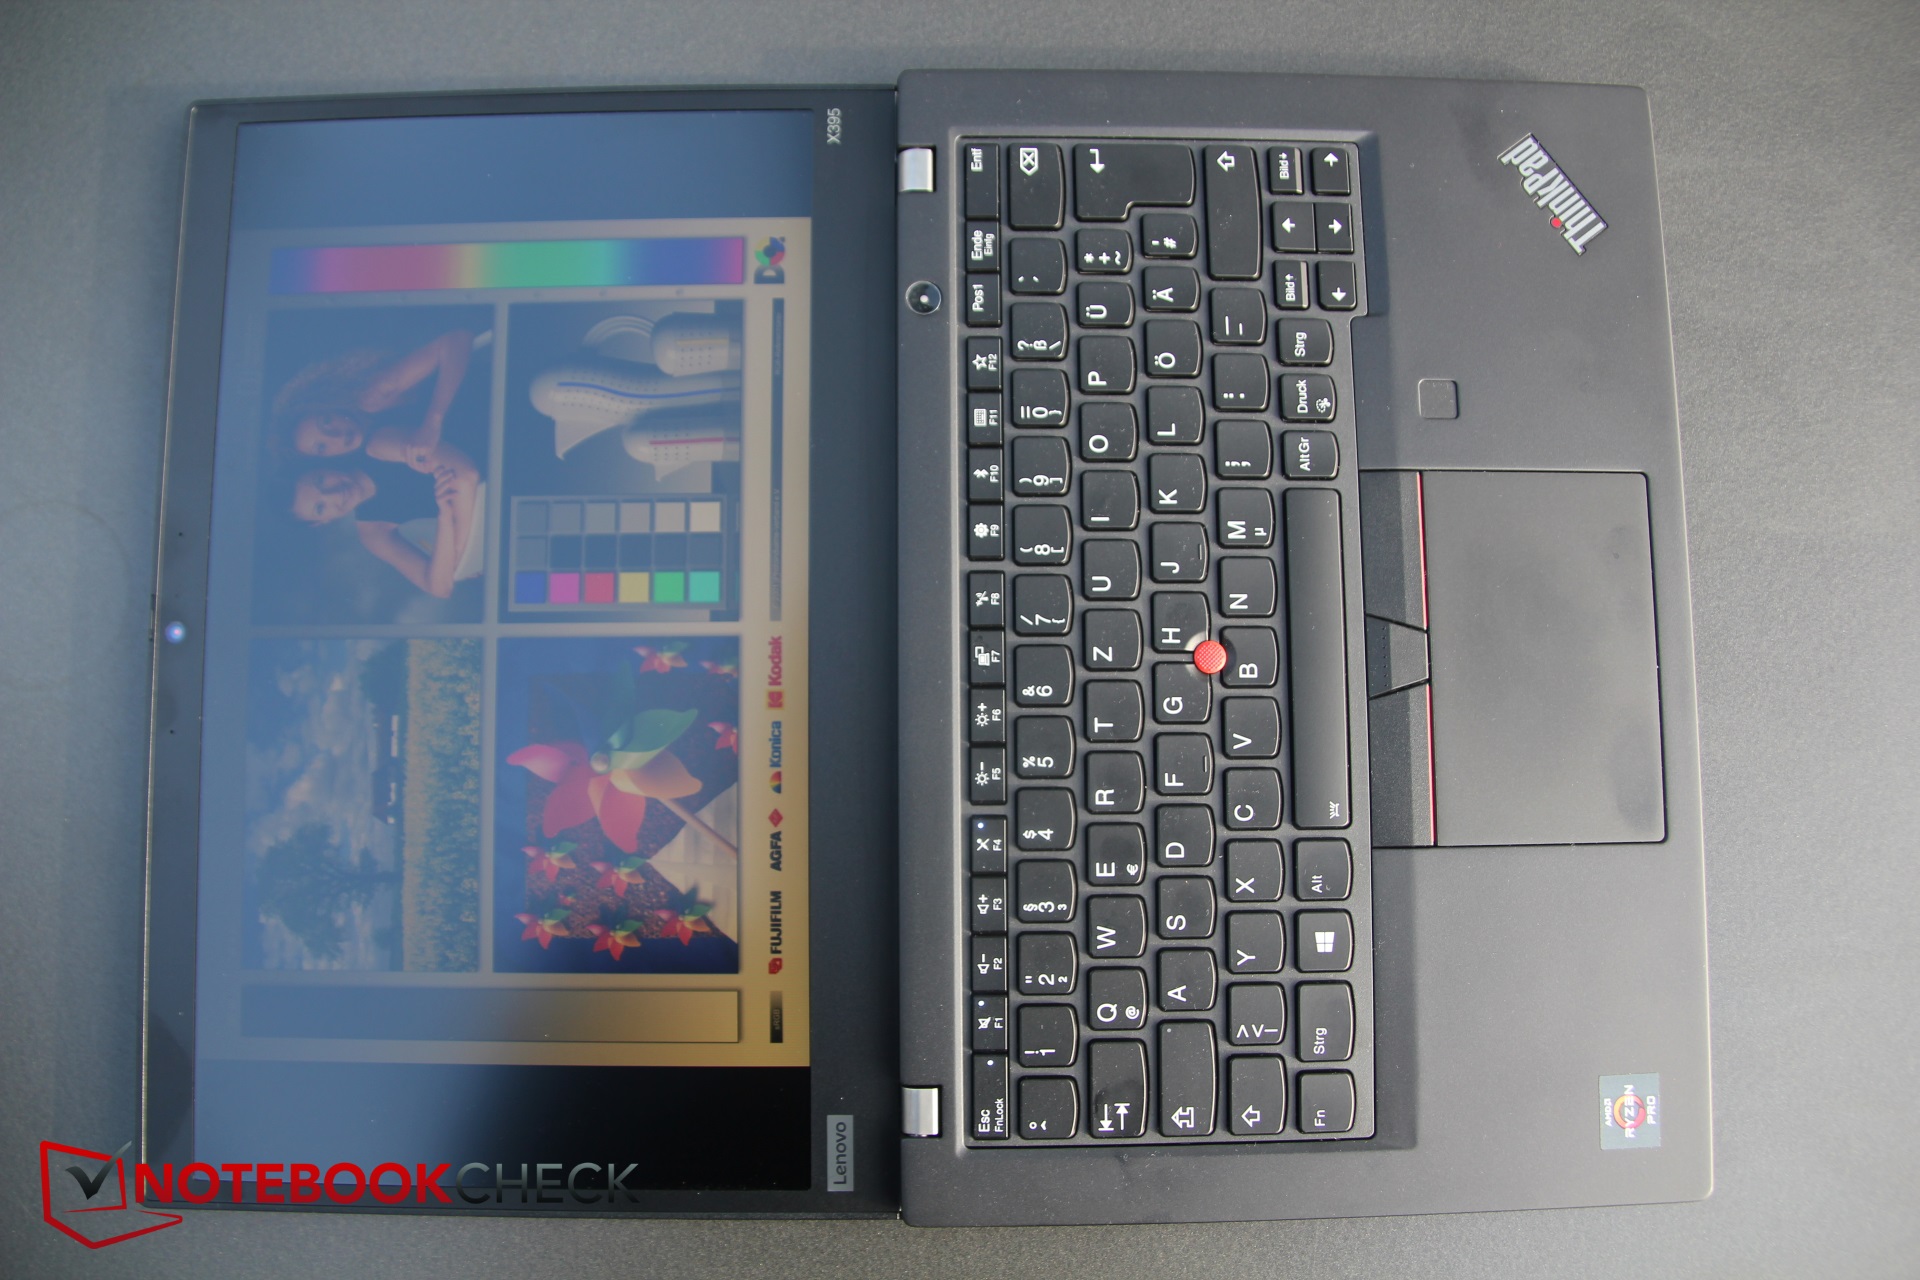
Breve Análise do Portátil Lenovo ThinkPad X395: Uma luta pela hegemonia dos portáteis empresariais
#compare_competitor
Avaliação | Data | Modelo | Peso | Altura | Size | Resolução | Preço |
|---|---|---|---|---|---|---|---|
| 88.8 % v7 (old) | 10/2019 | Lenovo ThinkPad X395 R3 PRO 3300U, Vega 6 | 1.3 kg | 16.9 mm | 13.30" | 1920x1080 | |
| 90.3 % v6 (old) | 05/2019 | Lenovo ThinkPad X390-20Q1S02M00 i5-8265U, UHD Graphics 620 | 1.3 kg | 16.9 mm | 13.30" | 1920x1080 | |
| 87.4 % v6 (old) | 06/2019 | Lenovo ThinkPad X390 Yoga-20NQS05R00 i7-8565U, UHD Graphics 620 | 1.3 kg | 15.95 mm | 13.30" | 1920x1080 | |
| 84.2 % v7 (old) | 06/2019 | Huawei Matebook 13-53010FYW i7-8565U, UHD Graphics 620 | 1.3 kg | 15 mm | 13.00" | 2160x1440 | |
| 89.5 % v7 (old) | 08/2018 | HP EliteBook x360 1030 G3 i5-8250U, UHD Graphics 620 | 1.3 kg | 15.8 mm | 13.30" | 1920x1080 | |
| 84.9 % v7 (old) | Dell Latitude 5300 i5-8365U, UHD Graphics 620 | 1.4 kg | 19 mm | 13.30" | 1920x1080 |
| SD Card Reader | |
| average JPG Copy Test (av. of 3 runs) | |
| Dell Latitude 5300 (Toshiba Exceria Pro M501 64 GB UHS-II) | |
| Lenovo ThinkPad X390 Yoga-20NQS05R00 (Toshiba Exceria Pro M501) | |
| Lenovo ThinkPad X390-20Q1S02M00 (Toshiba Exceria Pro M501) | |
| Média da turma Subnotebook (23.7 - 188, n=9, últimos 2 anos) | |
| Lenovo ThinkPad X395 | |
| maximum AS SSD Seq Read Test (1GB) | |
| Dell Latitude 5300 (Toshiba Exceria Pro M501 64 GB UHS-II) | |
| Média da turma Subnotebook (24.9 - 195, n=8, últimos 2 anos) | |
| Lenovo ThinkPad X390-20Q1S02M00 (Toshiba Exceria Pro M501) | |
| Lenovo ThinkPad X395 | |
| Lenovo ThinkPad X390 Yoga-20NQS05R00 (Toshiba Exceria Pro M501) | |
| Networking | |
| iperf3 transmit AX12 | |
| Lenovo ThinkPad X390-20Q1S02M00 | |
| Lenovo ThinkPad X395 | |
| HP EliteBook x360 1030 G3 | |
| iperf3 receive AX12 | |
| Lenovo ThinkPad X395 | |
| Lenovo ThinkPad X390-20Q1S02M00 | |
| HP EliteBook x360 1030 G3 | |
| |||||||||||||||||||||||||
iluminação: 88 %
iluminação com acumulador: 300 cd/m²
Contraste: 2225:1 (Preto: 0.16 cd/m²)
ΔE ColorChecker Calman: 3.6 | ∀{0.5-29.43 Ø4.71}
calibrated: 1.11
ΔE Greyscale Calman: 4.7 | ∀{0.09-98 Ø4.96}
96% sRGB (Argyll 1.6.3 3D)
61% AdobeRGB 1998 (Argyll 1.6.3 3D)
65.8% AdobeRGB 1998 (Argyll 3D)
95.2% sRGB (Argyll 3D)
64.1% Display P3 (Argyll 3D)
Gamma: 2.92
CCT: 6222 K
| Lenovo ThinkPad X395 LP133WF7-SPB1, , 1920x1080, 13.3" | Lenovo ThinkPad X390-20Q1S02M00 LP133WF7-SPB1, , 1920x1080, 13.3" | HP EliteBook x360 1030 G3 Chi Mei CMN1380, , 1920x1080, 13.3" | Lenovo ThinkPad X390 Yoga-20NQS05R00 LP133WF7-SPA1, , 1920x1080, 13.3" | Huawei Matebook 13-53010FYW Chi Mei CMN8201, , 2160x1440, 13" | Dell Latitude 5300 LGD05ED-133WF6, , 1920x1080, 13.3" | |
|---|---|---|---|---|---|---|
| Display | 1% | 3% | 2% | 5% | 3% | |
| Display P3 Coverage (%) | 64.1 | 65.3 2% | 66.1 3% | 65.2 2% | 68.1 6% | 68.2 6% |
| sRGB Coverage (%) | 95.2 | 95.9 1% | 97.8 3% | 97 2% | 99.3 4% | 94.4 -1% |
| AdobeRGB 1998 Coverage (%) | 65.8 | 66.6 1% | 67.8 3% | 67.3 2% | 69.7 6% | 68.7 4% |
| Response Times | -6% | 25% | -2% | 13% | 23% | |
| Response Time Grey 50% / Grey 80% * (ms) | 55 ? | 57.6 ? -5% | 39.2 ? 29% | 59.2 ? -8% | 43.2 ? 21% | 38 ? 31% |
| Response Time Black / White * (ms) | 32 ? | 34 ? -6% | 25.6 ? 20% | 30.8 ? 4% | 30.4 ? 5% | 27.2 ? 15% |
| PWM Frequency (Hz) | 26040 ? | 60240 ? | ||||
| Screen | 0% | -9% | -21% | -21% | -14% | |
| Brightness middle (cd/m²) | 356 | 356 0% | 470.1 32% | 319 -10% | 356 0% | 326 -8% |
| Brightness (cd/m²) | 336 | 336 0% | 443 32% | 306 -9% | 346 3% | 313 -7% |
| Brightness Distribution (%) | 88 | 88 0% | 88 0% | 90 2% | 86 -2% | 87 -1% |
| Black Level * (cd/m²) | 0.16 | 0.16 -0% | 0.38 -138% | 0.15 6% | 0.35 -119% | 0.27 -69% |
| Contrast (:1) | 2225 | 2225 0% | 1237 -44% | 2127 -4% | 1017 -54% | 1207 -46% |
| Colorchecker dE 2000 * | 3.6 | 3.6 -0% | 2.47 31% | 6.1 -69% | 3.3 8% | 3.2 11% |
| Colorchecker dE 2000 max. * | 5.5 | 5.5 -0% | 5.73 -4% | 9.7 -76% | 8.7 -58% | 6.3 -15% |
| Colorchecker dE 2000 calibrated * | 1.11 | 1.1 1% | 1.52 -37% | 1 10% | 1.1 1% | 1.6 -44% |
| Greyscale dE 2000 * | 4.7 | 4.7 -0% | 3.7 21% | 8.6 -83% | 5.8 -23% | 3.8 19% |
| Gamma | 2.92 75% | 2.48 89% | 2.35 94% | 2.62 84% | 2.21 100% | 2.14 103% |
| CCT | 6222 104% | 6374 102% | 7373 88% | 6613 98% | 6670 97% | 6900 94% |
| Color Space (Percent of AdobeRGB 1998) (%) | 61 | 61.3 0% | 62 2% | 61.9 1% | 64.1 5% | 63.8 5% |
| Color Space (Percent of sRGB) (%) | 96 | 95.7 0% | 98.2 2% | 96.8 1% | 99.4 4% | 94.8 -1% |
| Média Total (Programa/Configurações) | -2% /
-0% | 6% /
-3% | -7% /
-14% | -1% /
-12% | 4% /
-6% |
* ... menor é melhor
Exibir tempos de resposta
| ↔ Tempo de resposta preto para branco | ||
|---|---|---|
| 32 ms ... ascensão ↗ e queda ↘ combinadas | ↗ 18 ms ascensão | 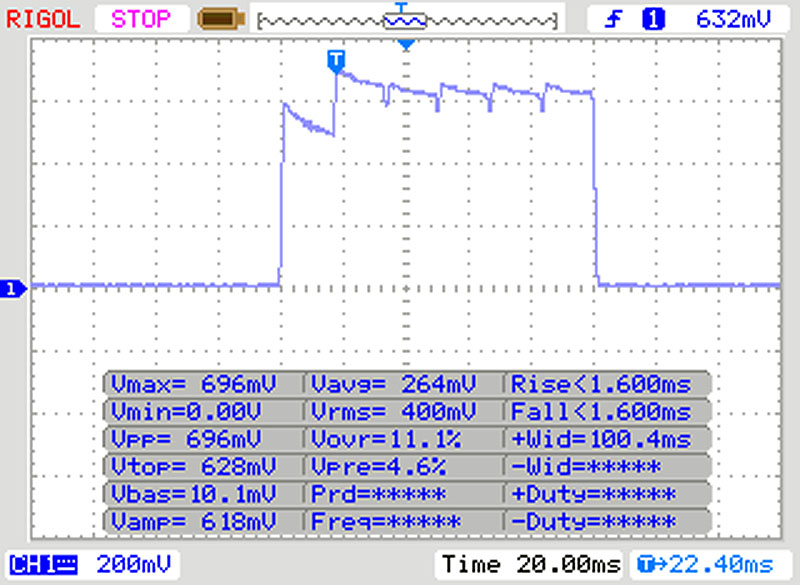 |
| ↘ 14 ms queda | ||
| A tela mostra taxas de resposta lentas em nossos testes e será insatisfatória para os jogadores. Em comparação, todos os dispositivos testados variam de 0.1 (mínimo) a 240 (máximo) ms. » 86 % de todos os dispositivos são melhores. Isso significa que o tempo de resposta medido é pior que a média de todos os dispositivos testados (19.8 ms). | ||
| ↔ Tempo de resposta 50% cinza a 80% cinza | ||
| 55 ms ... ascensão ↗ e queda ↘ combinadas | ↗ 26 ms ascensão | 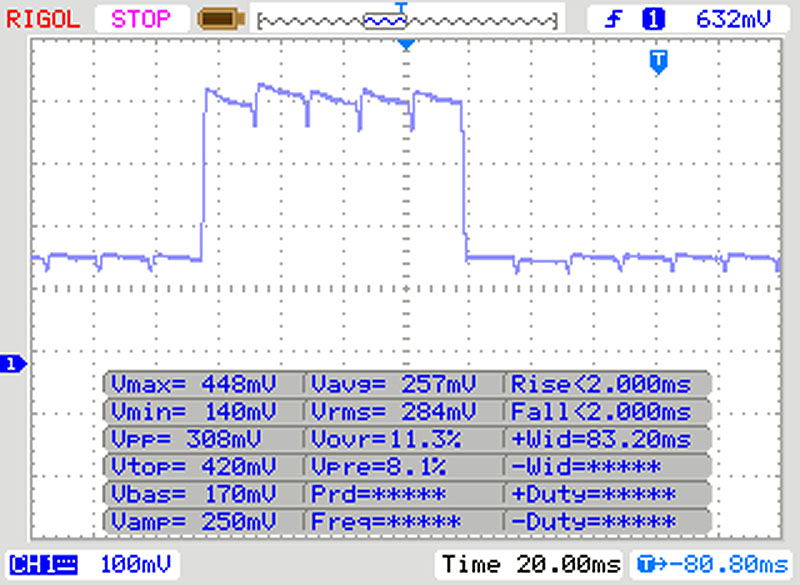 |
| ↘ 29 ms queda | ||
| A tela mostra taxas de resposta lentas em nossos testes e será insatisfatória para os jogadores. Em comparação, todos os dispositivos testados variam de 0.165 (mínimo) a 636 (máximo) ms. » 92 % de todos os dispositivos são melhores. Isso significa que o tempo de resposta medido é pior que a média de todos os dispositivos testados (30.9 ms). | ||
Cintilação da tela / PWM (modulação por largura de pulso)
| Tela tremeluzindo / PWM não detectado | 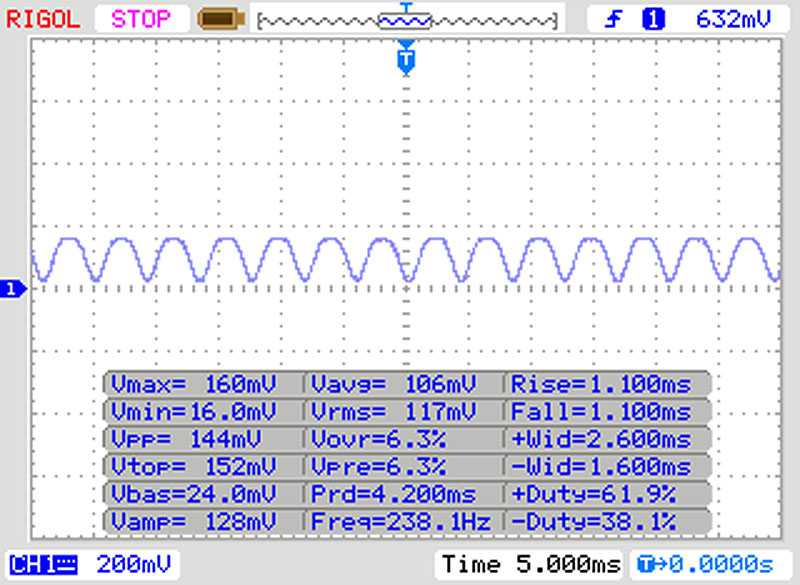 | ||
[pwm_comparison] Em comparação: 52 % de todos os dispositivos testados não usam PWM para escurecer a tela. Se PWM foi detectado, uma média de 7744 (mínimo: 5 - máximo: 343500) Hz foi medida. | |||
| Cinebench R10 | |
| Rendering Single CPUs 64Bit | |
| Média da turma Subnotebook (11450 - 15516, n=4, últimos 2 anos) | |
| Lenovo ThinkPad X395 | |
| Média AMD Ryzen 3 PRO 3300U (n=1) | |
| Rendering Multiple CPUs 64Bit | |
| Média da turma Subnotebook (53207 - 66113, n=4, últimos 2 anos) | |
| Lenovo ThinkPad X395 | |
| Média AMD Ryzen 3 PRO 3300U (n=1) | |
| PCMark 8 Home Score Accelerated v2 | 3260 pontos | |
| PCMark 8 Work Score Accelerated v2 | 4356 pontos | |
| PCMark 10 Score | 3606 pontos | |
Ajuda | ||
| Lenovo ThinkPad X395 Samsung SSD PM981a MZVLB256HBHQ | Lenovo ThinkPad X390-20Q1S02M00 Intel SSD Pro 7600p SSDPEKKF512G8L | HP EliteBook x360 1030 G3 Samsung PM871b MZNLN128HAHQ | Dell Latitude 5300 SK Hynix PC401 512GB M.2 (HFS512GD9TNG) | Lenovo ThinkPad X390 Yoga-20NQS05R00 Intel SSD Pro 7600p SSDPEKKF512G8L | Huawei Matebook 13-53010FYW WDC PC SN520 SDAPNUW-512G | Média Samsung SSD PM981a MZVLB256HBHQ | |
|---|---|---|---|---|---|---|---|
| CrystalDiskMark 5.2 / 6 | -2% | -57% | -9% | 13% | 35% | 8% | |
| Write 4K (MB/s) | 129.4 | 120.7 -7% | 64.3 -50% | 119.2 -8% | 144.1 11% | 191.2 48% | 135.2 ? 4% |
| Read 4K (MB/s) | 41.6 | 58.5 41% | 34.13 -18% | 41.43 0% | 63.5 53% | 53.1 28% | 44.6 ? 7% |
| Write Seq (MB/s) | 2334 | 1491 -36% | 466.4 -80% | 1240 -47% | 1496 -36% | 1768 -24% | 2091 ? -10% |
| Read Seq (MB/s) | 2151 | 2760 28% | 498.3 -77% | 1668 -22% | 2677 24% | 1710 -21% | 2097 ? -3% |
| Write 4K Q32T1 (MB/s) | 234 | 237.5 1% | 193.3 -17% | 381.7 63% | 357.4 53% | 575 146% | 370 ? 58% |
| Read 4K Q32T1 (MB/s) | 325.7 | 336.1 3% | 179.7 -45% | 371.5 14% | 482.3 48% | 654 101% | 372 ? 14% |
| Write Seq Q32T1 (MB/s) | 2348 | 1512 -36% | 396.8 -83% | 1369 -42% | 1558 -34% | 2544 8% | 2308 ? -2% |
| Read Seq Q32T1 (MB/s) | 3563 | 3154 -11% | 547 -85% | 2652 -26% | 3021 -15% | 3433 -4% | 3395 ? -5% |
| Write 4K Q8T8 (MB/s) | 1065 | 989 | 208 ? | ||||
| Read 4K Q8T8 (MB/s) | 891 | 883 | 383 ? | ||||
| AS SSD | 26% | -63% | -12% | 21% | 30% | 5% | |
| Seq Read (MB/s) | 2234 | 2689 20% | 488.2 -78% | 2123 -5% | 2742 23% | 2934 31% | 2276 ? 2% |
| Seq Write (MB/s) | 2110 | 1462 -31% | 403.2 -81% | 744 -65% | 1511 -28% | 2407 14% | 1486 ? -30% |
| 4K Read (MB/s) | 45.78 | 63.8 39% | 31.07 -32% | 43.02 -6% | 66.3 45% | 48.31 6% | 49.6 ? 8% |
| 4K Write (MB/s) | 102.7 | 139.8 36% | 70.8 -31% | 117.4 14% | 175.2 71% | 179.7 75% | 129.5 ? 26% |
| 4K-64 Read (MB/s) | 903 | 865 -4% | 255.1 -72% | 680 -25% | 873 -3% | 1296 44% | 683 ? -24% |
| 4K-64 Write (MB/s) | 986 | 1041 6% | 156.5 -84% | 1039 5% | 594 -40% | 1459 48% | 895 ? -9% |
| Access Time Read * (ms) | 0.064 | 0.037 42% | 0.093 -45% | 0.057 11% | 0.035 45% | 0.103 -61% | 0.06433 ? -1% |
| Access Time Write * (ms) | 0.042 | 0.024 43% | 0.048 -14% | 0.051 -21% | 0.021 50% | 0.021 50% | 0.04793 ? -14% |
| Score Read (Points) | 1172 | 1198 2% | 335 -71% | 935 -20% | 1213 3% | 1638 40% | 960 ? -18% |
| Score Write (Points) | 1300 | 1328 2% | 268 -79% | 1230 -5% | 920 -29% | 1879 45% | 1173 ? -10% |
| Score Total (Points) | 3075 | 3095 1% | 781 -75% | 2586 -16% | 2712 -12% | 4334 41% | 2598 ? -16% |
| Copy ISO MB/s (MB/s) | 1008 | 1290 28% | 208.1 -79% | 1725 71% | 1474 ? 46% | ||
| Copy Program MB/s (MB/s) | 237.6 | 436.5 84% | 74.3 -69% | 418.3 76% | 426 ? 79% | ||
| Copy Game MB/s (MB/s) | 572 | 1147 101% | 164.5 -71% | 687 20% | 760 ? 33% | ||
| Média Total (Programa/Configurações) | 12% /
16% | -60% /
-61% | -11% /
-11% | 17% /
18% | 33% /
32% | 7% /
6% |
* ... menor é melhor

| 3DMark 11 Performance | 3425 pontos | |
| 3DMark Cloud Gate Standard Score | 10619 pontos | |
| 3DMark Fire Strike Score | 2025 pontos | |
Ajuda | ||
| The Witcher 3 | |
| 1024x768 Low Graphics & Postprocessing | |
| Média da turma Subnotebook (38.8 - 176, n=11, últimos 2 anos) | |
| Média AMD Radeon RX Vega 6 (Ryzen 2000/3000) (38 - 39, n=2) | |
| Lenovo ThinkPad X395 | |
| Lenovo ThinkPad X390 Yoga-20NQS05R00 | |
| HP EliteBook x360 1030 G3 | |
| Lenovo ThinkPad X390-20Q1S02M00 | |
| 1920x1080 High Graphics & Postprocessing (Nvidia HairWorks Off) | |
| Média da turma Subnotebook (25.6 - 64, n=11, últimos 2 anos) | |
| Lenovo ThinkPad X395 | |
| Média AMD Radeon RX Vega 6 (Ryzen 2000/3000) (7.4 - 9.7, n=2) | |
| HP EliteBook x360 1030 G3 | |
| Rise of the Tomb Raider | |
| 1024x768 Lowest Preset | |
| Lenovo ThinkPad X395 | |
| Média AMD Radeon RX Vega 6 (Ryzen 2000/3000) (29.8 - 37.5, n=2) | |
| Lenovo ThinkPad X390-20Q1S02M00 | |
| Lenovo ThinkPad X390 Yoga-20NQS05R00 | |
| HP EliteBook x360 1030 G3 | |
| 1920x1080 High Preset AA:FX AF:4x | |
| Lenovo ThinkPad X395 | |
| Média AMD Radeon RX Vega 6 (Ryzen 2000/3000) (9.7 - 12.4, n=2) | |
| HP EliteBook x360 1030 G3 | |
| Rocket League | |
| 1280x720 Performance | |
| Lenovo ThinkPad X395 | |
| Média AMD Radeon RX Vega 6 (Ryzen 2000/3000) (52.6 - 138.1, n=2) | |
| 1920x1080 Performance | |
| Lenovo ThinkPad X395 | |
| Média AMD Radeon RX Vega 6 (Ryzen 2000/3000) (42.2 - 78.9, n=2) | |
| 1920x1080 Quality AA:Medium FX | |
| Lenovo ThinkPad X395 | |
| Média AMD Radeon RX Vega 6 (Ryzen 2000/3000) (26.9 - 47.9, n=2) | |
| 1920x1080 High Quality AA:High FX | |
| Lenovo ThinkPad X395 | |
| Média AMD Radeon RX Vega 6 (Ryzen 2000/3000) (17.4 - 27.7, n=2) | |
| baixo | média | alto | ultra | |
|---|---|---|---|---|
| The Witcher 3 (2015) | 38 | 9.7 | ||
| Rise of the Tomb Raider (2016) | 37.5 | 12.4 | ||
| Rocket League (2017) | 138.1 | 47.9 | 27.7 |
| Lenovo ThinkPad X395 Vega 6, R3 PRO 3300U, Samsung SSD PM981a MZVLB256HBHQ | Lenovo ThinkPad X390-20Q1S02M00 UHD Graphics 620, i5-8265U, Intel SSD Pro 7600p SSDPEKKF512G8L | HP EliteBook x360 1030 G3 UHD Graphics 620, i5-8250U, Samsung PM871b MZNLN128HAHQ | Lenovo ThinkPad X390 Yoga-20NQS05R00 UHD Graphics 620, i7-8565U, Intel SSD Pro 7600p SSDPEKKF512G8L | Huawei Matebook 13-53010FYW UHD Graphics 620, i7-8565U, WDC PC SN520 SDAPNUW-512G | Dell Latitude 5300 UHD Graphics 620, i5-8365U, SK Hynix PC401 512GB M.2 (HFS512GD9TNG) | |
|---|---|---|---|---|---|---|
| Noise | 2% | 6% | 1% | 4% | 5% | |
| desligado / ambiente * (dB) | 30.2 | 29.2 3% | 28.5 6% | 29.2 3% | 29.2 3% | 28.8 5% |
| Idle Minimum * (dB) | 30.2 | 29.2 3% | 28.5 6% | 29.2 3% | 29.2 3% | 28.8 5% |
| Idle Average * (dB) | 30.2 | 29.2 3% | 28.5 6% | 29.2 3% | 29.2 3% | 28.8 5% |
| Idle Maximum * (dB) | 30.2 | 29.2 3% | 28.5 6% | 29.2 3% | 29.2 3% | 29.8 1% |
| Load Average * (dB) | 34.3 | 34.8 -1% | 31.3 9% | 35 -2% | 31.7 8% | 31.7 8% |
| Load Maximum * (dB) | 34.3 | 34.8 -1% | 33.5 2% | 35 -2% | 33 4% | 33.2 3% |
* ... menor é melhor
Barulho
| Ocioso |
| 30.2 / 30.2 / 30.2 dB |
| Carga |
| 34.3 / 34.3 dB |
 | ||
30 dB silencioso 40 dB(A) audível 50 dB(A) ruidosamente alto |
||
min: | ||
| Lenovo ThinkPad X395 Vega 6, R3 PRO 3300U, Samsung SSD PM981a MZVLB256HBHQ | Lenovo ThinkPad X390-20Q1S02M00 UHD Graphics 620, i5-8265U, Intel SSD Pro 7600p SSDPEKKF512G8L | HP EliteBook x360 1030 G3 UHD Graphics 620, i5-8250U, Samsung PM871b MZNLN128HAHQ | Lenovo ThinkPad X390 Yoga-20NQS05R00 UHD Graphics 620, i7-8565U, Intel SSD Pro 7600p SSDPEKKF512G8L | Huawei Matebook 13-53010FYW UHD Graphics 620, i7-8565U, WDC PC SN520 SDAPNUW-512G | Dell Latitude 5300 UHD Graphics 620, i5-8365U, SK Hynix PC401 512GB M.2 (HFS512GD9TNG) | |
|---|---|---|---|---|---|---|
| Heat | 4% | -4% | -11% | 2% | -5% | |
| Maximum Upper Side * (°C) | 38.4 | 44.6 -16% | 38 1% | 41.7 -9% | 39.7 -3% | 43 -12% |
| Maximum Bottom * (°C) | 39.7 | 41.1 -4% | 45.4 -14% | 50.1 -26% | 44.4 -12% | 53 -34% |
| Idle Upper Side * (°C) | 28.1 | 23.2 17% | 26.4 6% | 27.8 1% | 24.7 12% | 23.9 15% |
| Idle Bottom * (°C) | 28 | 22.8 19% | 30 -7% | 30.2 -8% | 25.3 10% | 24.7 12% |
* ... menor é melhor
(+) A temperatura máxima no lado superior é 38.4 °C / 101 F, em comparação com a média de 35.9 °C / 97 F , variando de 21.4 a 59 °C para a classe Subnotebook.
(+) A parte inferior aquece até um máximo de 39.7 °C / 103 F, em comparação com a média de 39.2 °C / 103 F
(+) Em uso inativo, a temperatura média para o lado superior é 26.7 °C / 80 F, em comparação com a média do dispositivo de 30.8 °C / ### class_avg_f### F.
(+) Os apoios para as mãos e o touchpad são mais frios que a temperatura da pele, com um máximo de 31 °C / 87.8 F e, portanto, são frios ao toque.
(-) A temperatura média da área do apoio para as mãos de dispositivos semelhantes foi 28.2 °C / 82.8 F (-2.8 °C / -5 F).
Lenovo ThinkPad X395 análise de áudio
(-) | alto-falantes não muito altos (###valor### dB)
Graves 100 - 315Hz
(-) | quase nenhum baixo - em média 18.8% menor que a mediana
(±) | a linearidade dos graves é média (12.6% delta para a frequência anterior)
Médios 400 - 2.000 Hz
(+) | médios equilibrados - apenas 4.2% longe da mediana
(±) | a linearidade dos médios é média (11.9% delta para frequência anterior)
Altos 2 - 16 kHz
(+) | agudos equilibrados - apenas 2.2% longe da mediana
(+) | os máximos são lineares (6.6% delta da frequência anterior)
Geral 100 - 16.000 Hz
(±) | a linearidade do som geral é média (20.5% diferença em relação à mediana)
Comparado com a mesma classe
» 66% de todos os dispositivos testados nesta classe foram melhores, 7% semelhantes, 26% piores
» O melhor teve um delta de 5%, a média foi 18%, o pior foi 53%
Comparado com todos os dispositivos testados
» 54% de todos os dispositivos testados foram melhores, 8% semelhantes, 38% piores
» O melhor teve um delta de 4%, a média foi 23%, o pior foi 134%
Apple MacBook 12 (Early 2016) 1.1 GHz análise de áudio
(+) | os alto-falantes podem tocar relativamente alto (###valor### dB)
Graves 100 - 315Hz
(±) | graves reduzidos - em média 11.3% menor que a mediana
(±) | a linearidade dos graves é média (14.2% delta para a frequência anterior)
Médios 400 - 2.000 Hz
(+) | médios equilibrados - apenas 2.4% longe da mediana
(+) | médios são lineares (5.5% delta para frequência anterior)
Altos 2 - 16 kHz
(+) | agudos equilibrados - apenas 2% longe da mediana
(+) | os máximos são lineares (4.5% delta da frequência anterior)
Geral 100 - 16.000 Hz
(+) | o som geral é linear (10.2% diferença em relação à mediana)
Comparado com a mesma classe
» 7% de todos os dispositivos testados nesta classe foram melhores, 2% semelhantes, 90% piores
» O melhor teve um delta de 5%, a média foi 18%, o pior foi 53%
Comparado com todos os dispositivos testados
» 5% de todos os dispositivos testados foram melhores, 1% semelhantes, 94% piores
» O melhor teve um delta de 4%, a média foi 23%, o pior foi 134%
| desligado | |
| Ocioso | |
| Carga |
|
Key:
min: | |
| Lenovo ThinkPad X395 R3 PRO 3300U, Vega 6, Samsung SSD PM981a MZVLB256HBHQ, IPS, 1920x1080, 13.3" | Lenovo ThinkPad X390-20Q1S02M00 i5-8265U, UHD Graphics 620, Intel SSD Pro 7600p SSDPEKKF512G8L, IPS LED, 1920x1080, 13.3" | HP EliteBook x360 1030 G3 i5-8250U, UHD Graphics 620, Samsung PM871b MZNLN128HAHQ, IPS, 1920x1080, 13.3" | Lenovo ThinkPad X390 Yoga-20NQS05R00 i7-8565U, UHD Graphics 620, Intel SSD Pro 7600p SSDPEKKF512G8L, IPS LED, 1920x1080, 13.3" | Huawei Matebook 13-53010FYW i7-8565U, UHD Graphics 620, WDC PC SN520 SDAPNUW-512G, IPS, 2160x1440, 13" | Dell Latitude 5300 i5-8365U, UHD Graphics 620, SK Hynix PC401 512GB M.2 (HFS512GD9TNG), IPS, 1920x1080, 13.3" | Média AMD Radeon RX Vega 6 (Ryzen 2000/3000) | Média da turma Subnotebook | |
|---|---|---|---|---|---|---|---|---|
| Power Consumption | -10% | 4% | -14% | -20% | -12% | -13% | -12% | |
| Idle Minimum * (Watt) | 4 | 3.4 15% | 3.8 5% | 3.46 13% | 3.84 4% | 3.8 5% | 5.15 ? -29% | 3.73 ? 7% |
| Idle Average * (Watt) | 6.3 | 5.6 11% | 7.5 -19% | 5.88 7% | 7.68 -22% | 6.9 -10% | 7.75 ? -23% | 6.57 ? -4% |
| Idle Maximum * (Watt) | 9.3 | 8.7 6% | 8.6 8% | 9.12 2% | 9.36 -1% | 7.5 19% | 9.45 ? -2% | 7.93 ? 15% |
| Load Average * (Watt) | 34 | 43.6 -28% | 33.1 3% | 45.6 -34% | 43.2 -27% | 41.4 -22% | 36 ? -6% | 42.1 ? -24% |
| Load Maximum * (Watt) | 42 | 65 -55% | 31.8 24% | 65.9 -57% | 64.8 -54% | 63.1 -50% | 44 ? -5% | 65.1 ? -55% |
* ... menor é melhor
| Lenovo ThinkPad X395 R3 PRO 3300U, Vega 6, 48 Wh | Lenovo ThinkPad X390-20Q1S02M00 i5-8265U, UHD Graphics 620, 48 Wh | HP EliteBook x360 1030 G3 i5-8250U, UHD Graphics 620, 56.2 Wh | Dell Latitude 5300 i5-8365U, UHD Graphics 620, 60 Wh | Lenovo ThinkPad X390 Yoga-20NQS05R00 i7-8565U, UHD Graphics 620, 50 Wh | Huawei Matebook 13-53010FYW i7-8565U, UHD Graphics 620, 41.7 Wh | Média da turma Subnotebook | |
|---|---|---|---|---|---|---|---|
| Duração da bateria | -20% | 0% | -24% | -30% | -23% | 19% | |
| Reader / Idle (h) | 18.4 | 23 25% | 23.6 28% | 26.4 ? 43% | |||
| H.264 (h) | 10.3 | 12.7 23% | 10 -3% | 15.3 ? 49% | |||
| WiFi v1.3 (h) | 10.9 | 8.3 -24% | 10 -8% | 8.3 -24% | 8.2 -25% | 7 -36% | 13.9 ? 28% |
| Load (h) | 3.8 | 1.6 -58% | 3.2 -16% | 1.5 -61% | 1.5 -61% | 2.04 ? -46% |
Pro
Contra
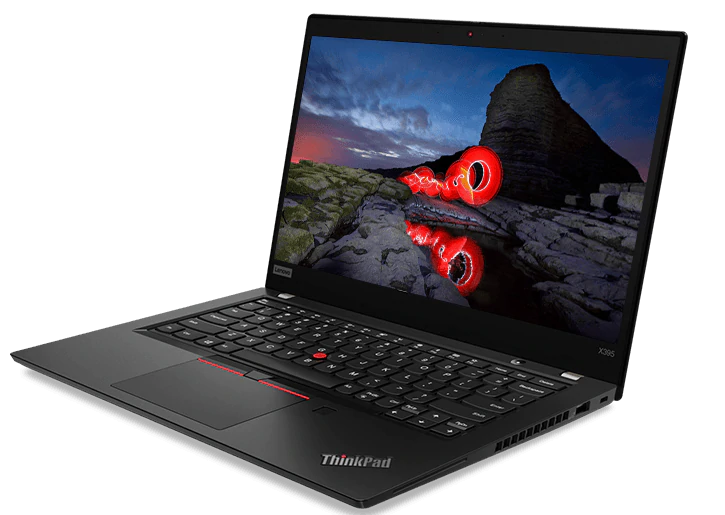
Veredicto - Um excelente subportátil com afogamento de CPU tolerável
O ThinkPad X390 e sua CPU Intel obtiveram 90% quando analisamos em abril, 1% a mais do que o ThinkPad X395. Isso não torna o primeiro melhor do que o último, já que passamos para um novo sistema de classificação desde abril. O ThinkPad X390 e o X395 são tão bons quanto os outros, mas ambos têm suas idiossincrasias.
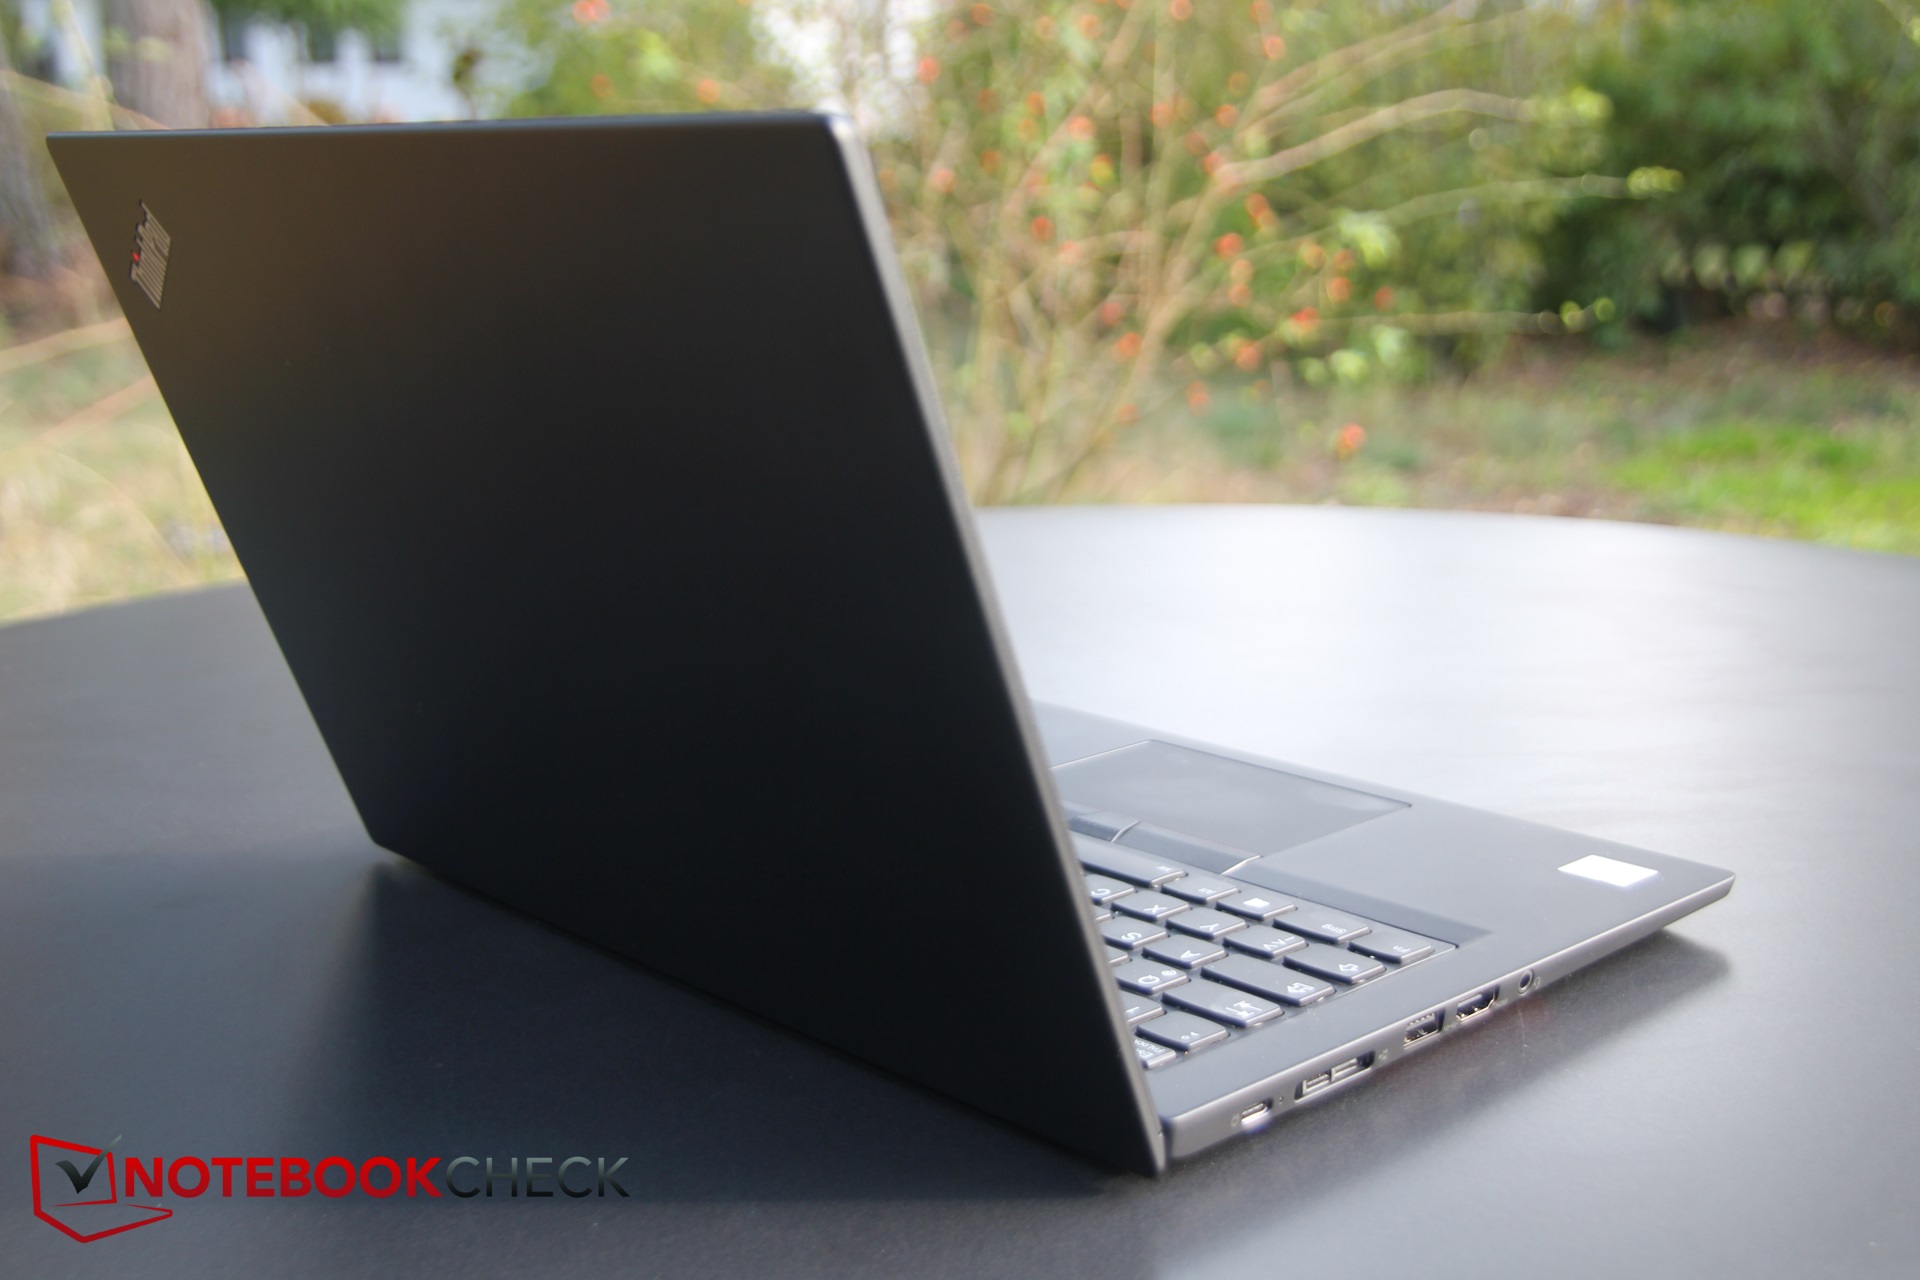
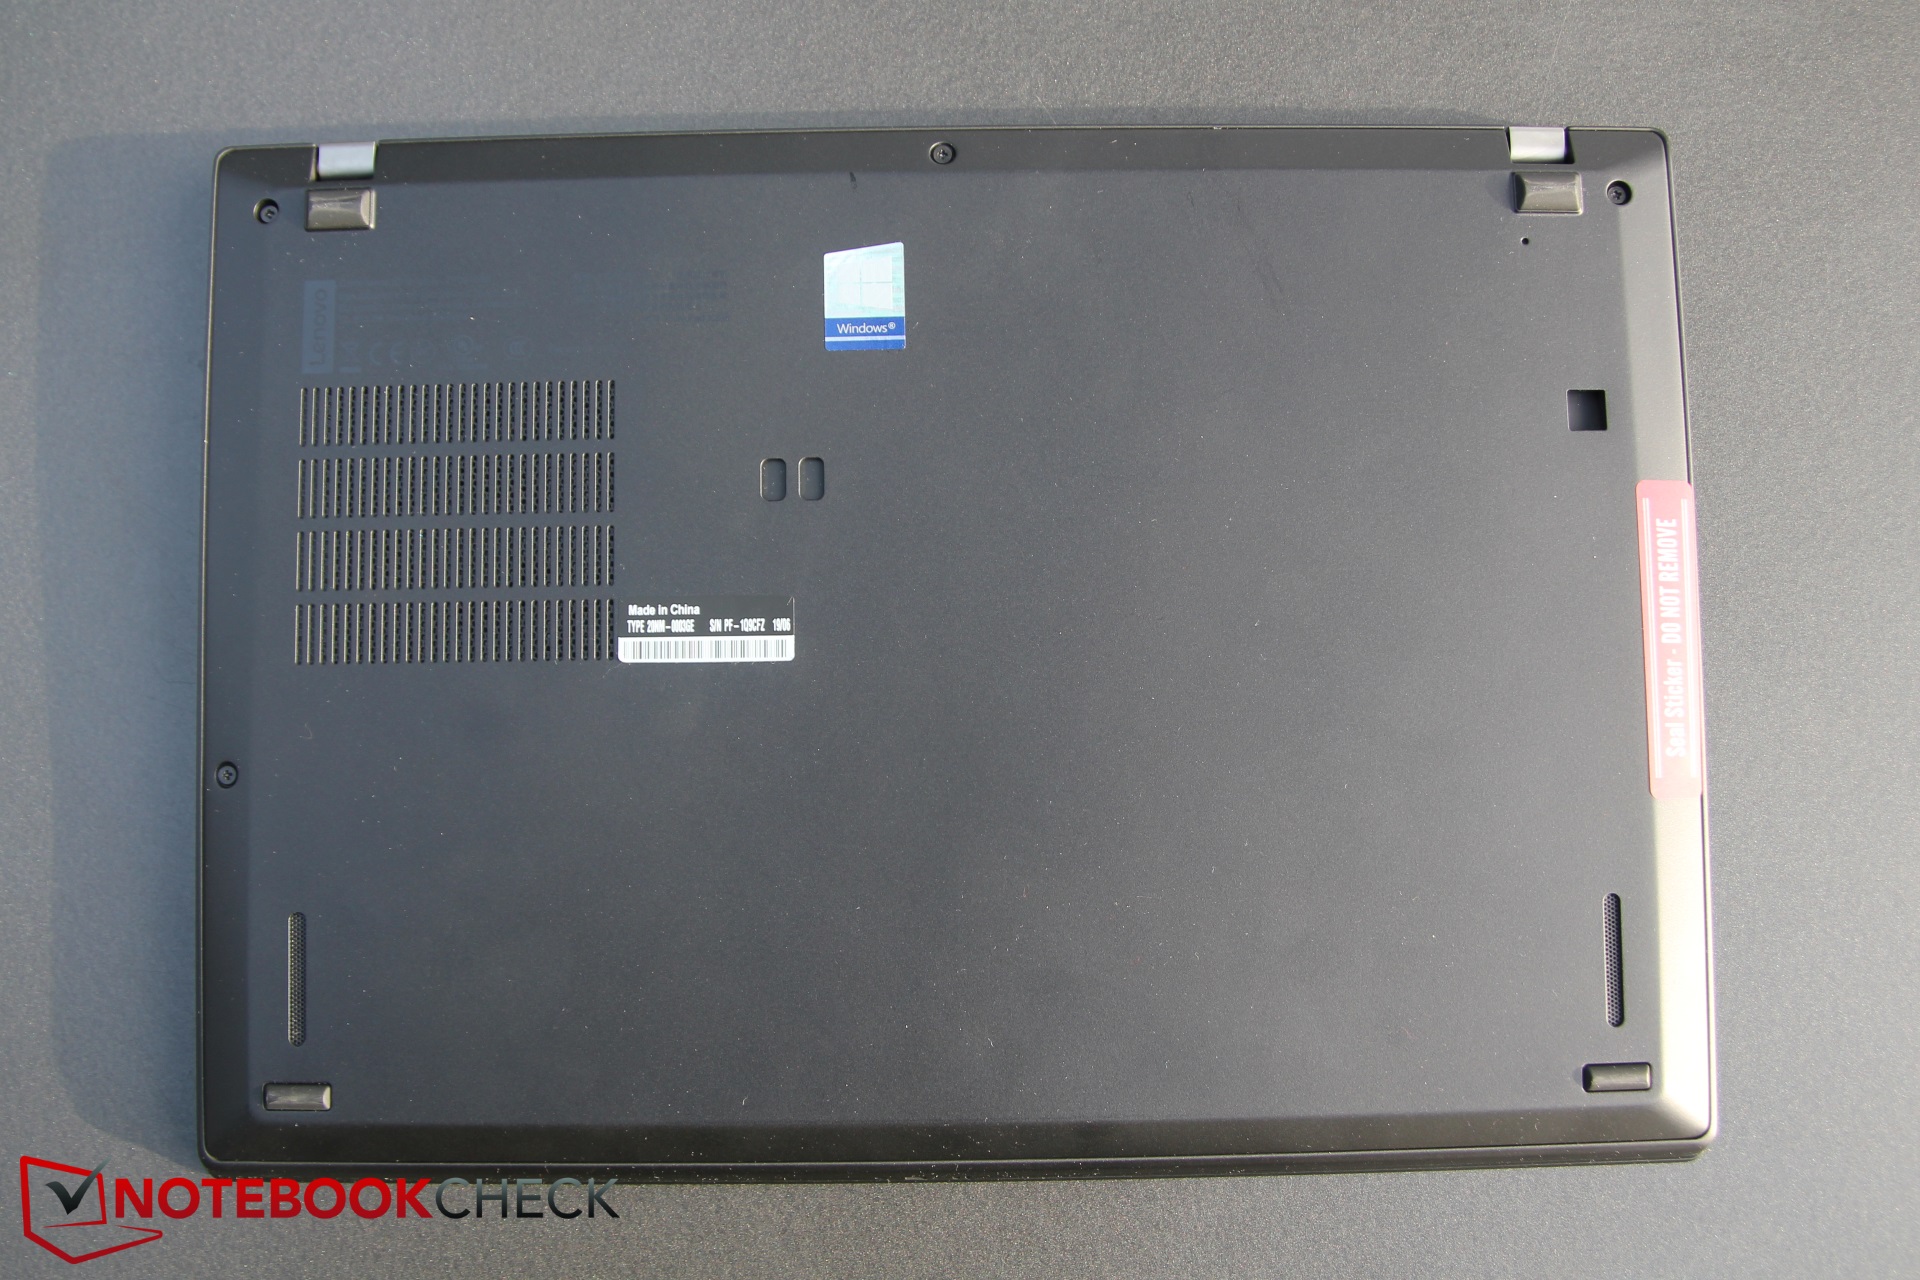
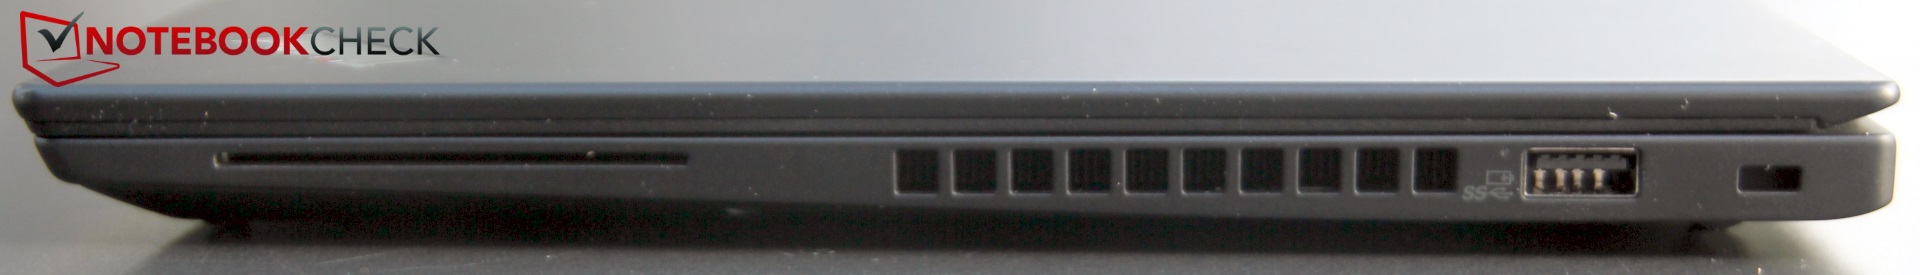
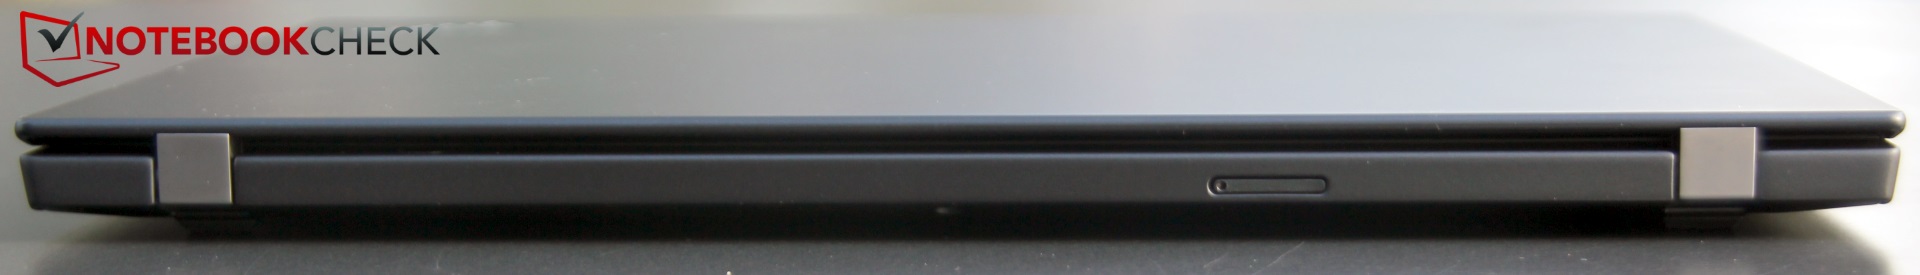
Os dois dispositivos compartilham os mesmos excelentes dispositivos de entrada e excelente tela, junto com o slot para cartão microSD com posicionamento desconfortável. A Lenovo equipou ambos os dispositivos com RAM soldada e um respiradouro do ventilador no lado direito do chassi também, o qual expulsará o ar quente sobre a mão segurando o mouse se você for destro.
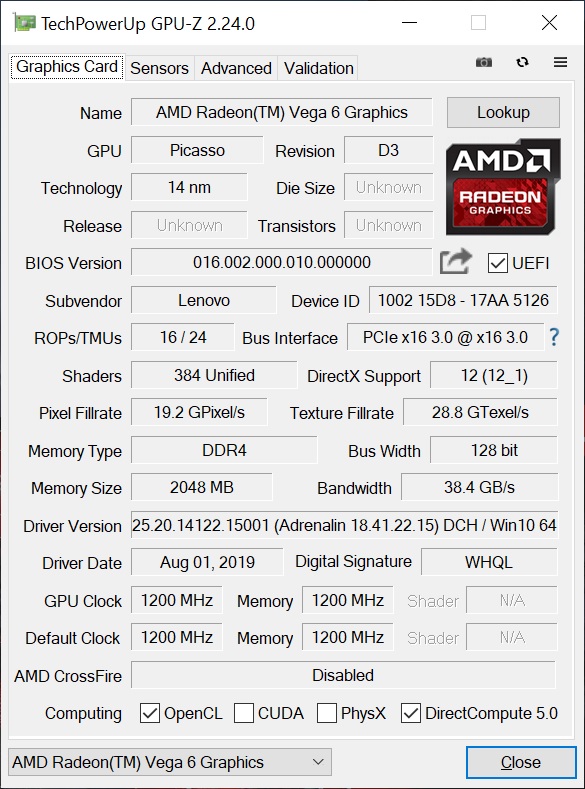
No entanto, o X395 oferece mais recursos de segurança do que o X390, além de desempenho gráfico significativamente melhor, além de usar menos energia sob uso intenso. Portanto, o X395 pode ficar à frente do X390 em uma comparação direta.
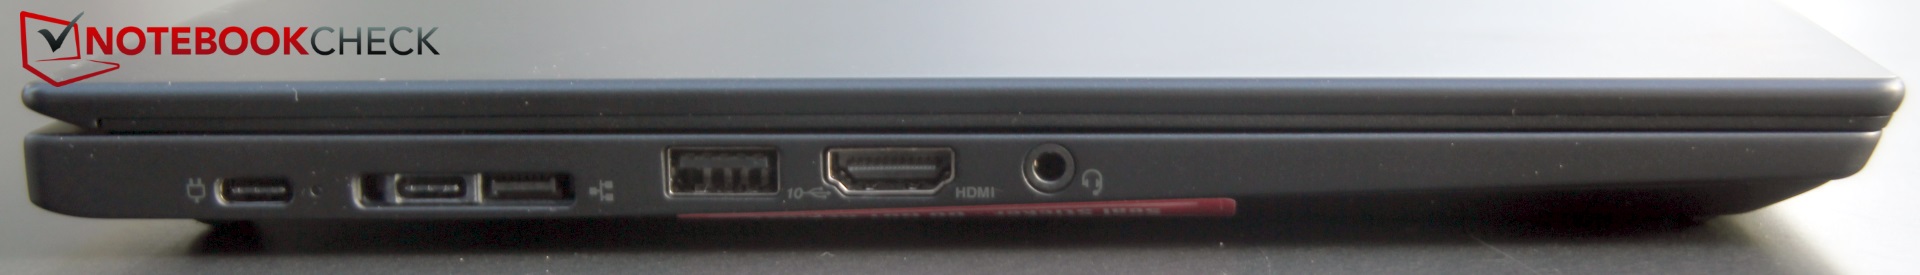
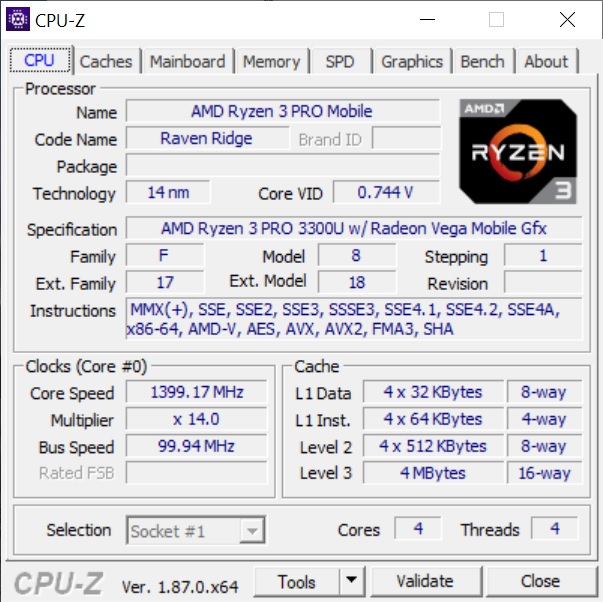
Dito isso, embora o X395 ofereça melhor desempenho da GPU que o X390, ele também afoga sua CPU mais fortemente sob uso intenso contínuo. A Lenovo parece ter feito isso para manter o X395 funcionando silenciosamente, de forma fria e econômica, embora à custa do desempenho da CPU. Aliás, o X395 também não possui uma porta Thunderbolt 3, que atualmente permanece como uma interface proprietária da Intel, mas possui HDMI 2.0 em vez do padrão 1.4 mais antigo.
O Lenovo ThinkPad X395 é um ótimo subportátil para escritório que revelou poucas fraquezas durante nossos testes. A máquina impulsionada por AMD é pelo menos igual à irmã Intel, mas funciona de forma mais silenciosa, fria e econômica. O X395 também tem um desempenho de GPU mais potente que o X390, o que é um bônus.
Atualmente, a Lenovo vende nossa configuração de teste por cerca de 927 Euros (~US$ 1.022), mas varejistas terceirizados poderão em breve começar a oferecer o X395 a preços mais acessíveis. No geral, recomendamos o X395 não apenas para empresas, mas também para particulares que buscam um sólido subportátil de 13,3 polegadas.
Lenovo ThinkPad X395
- 10/14/2019 v7 (old)
Christian Hintze
Price comparison
