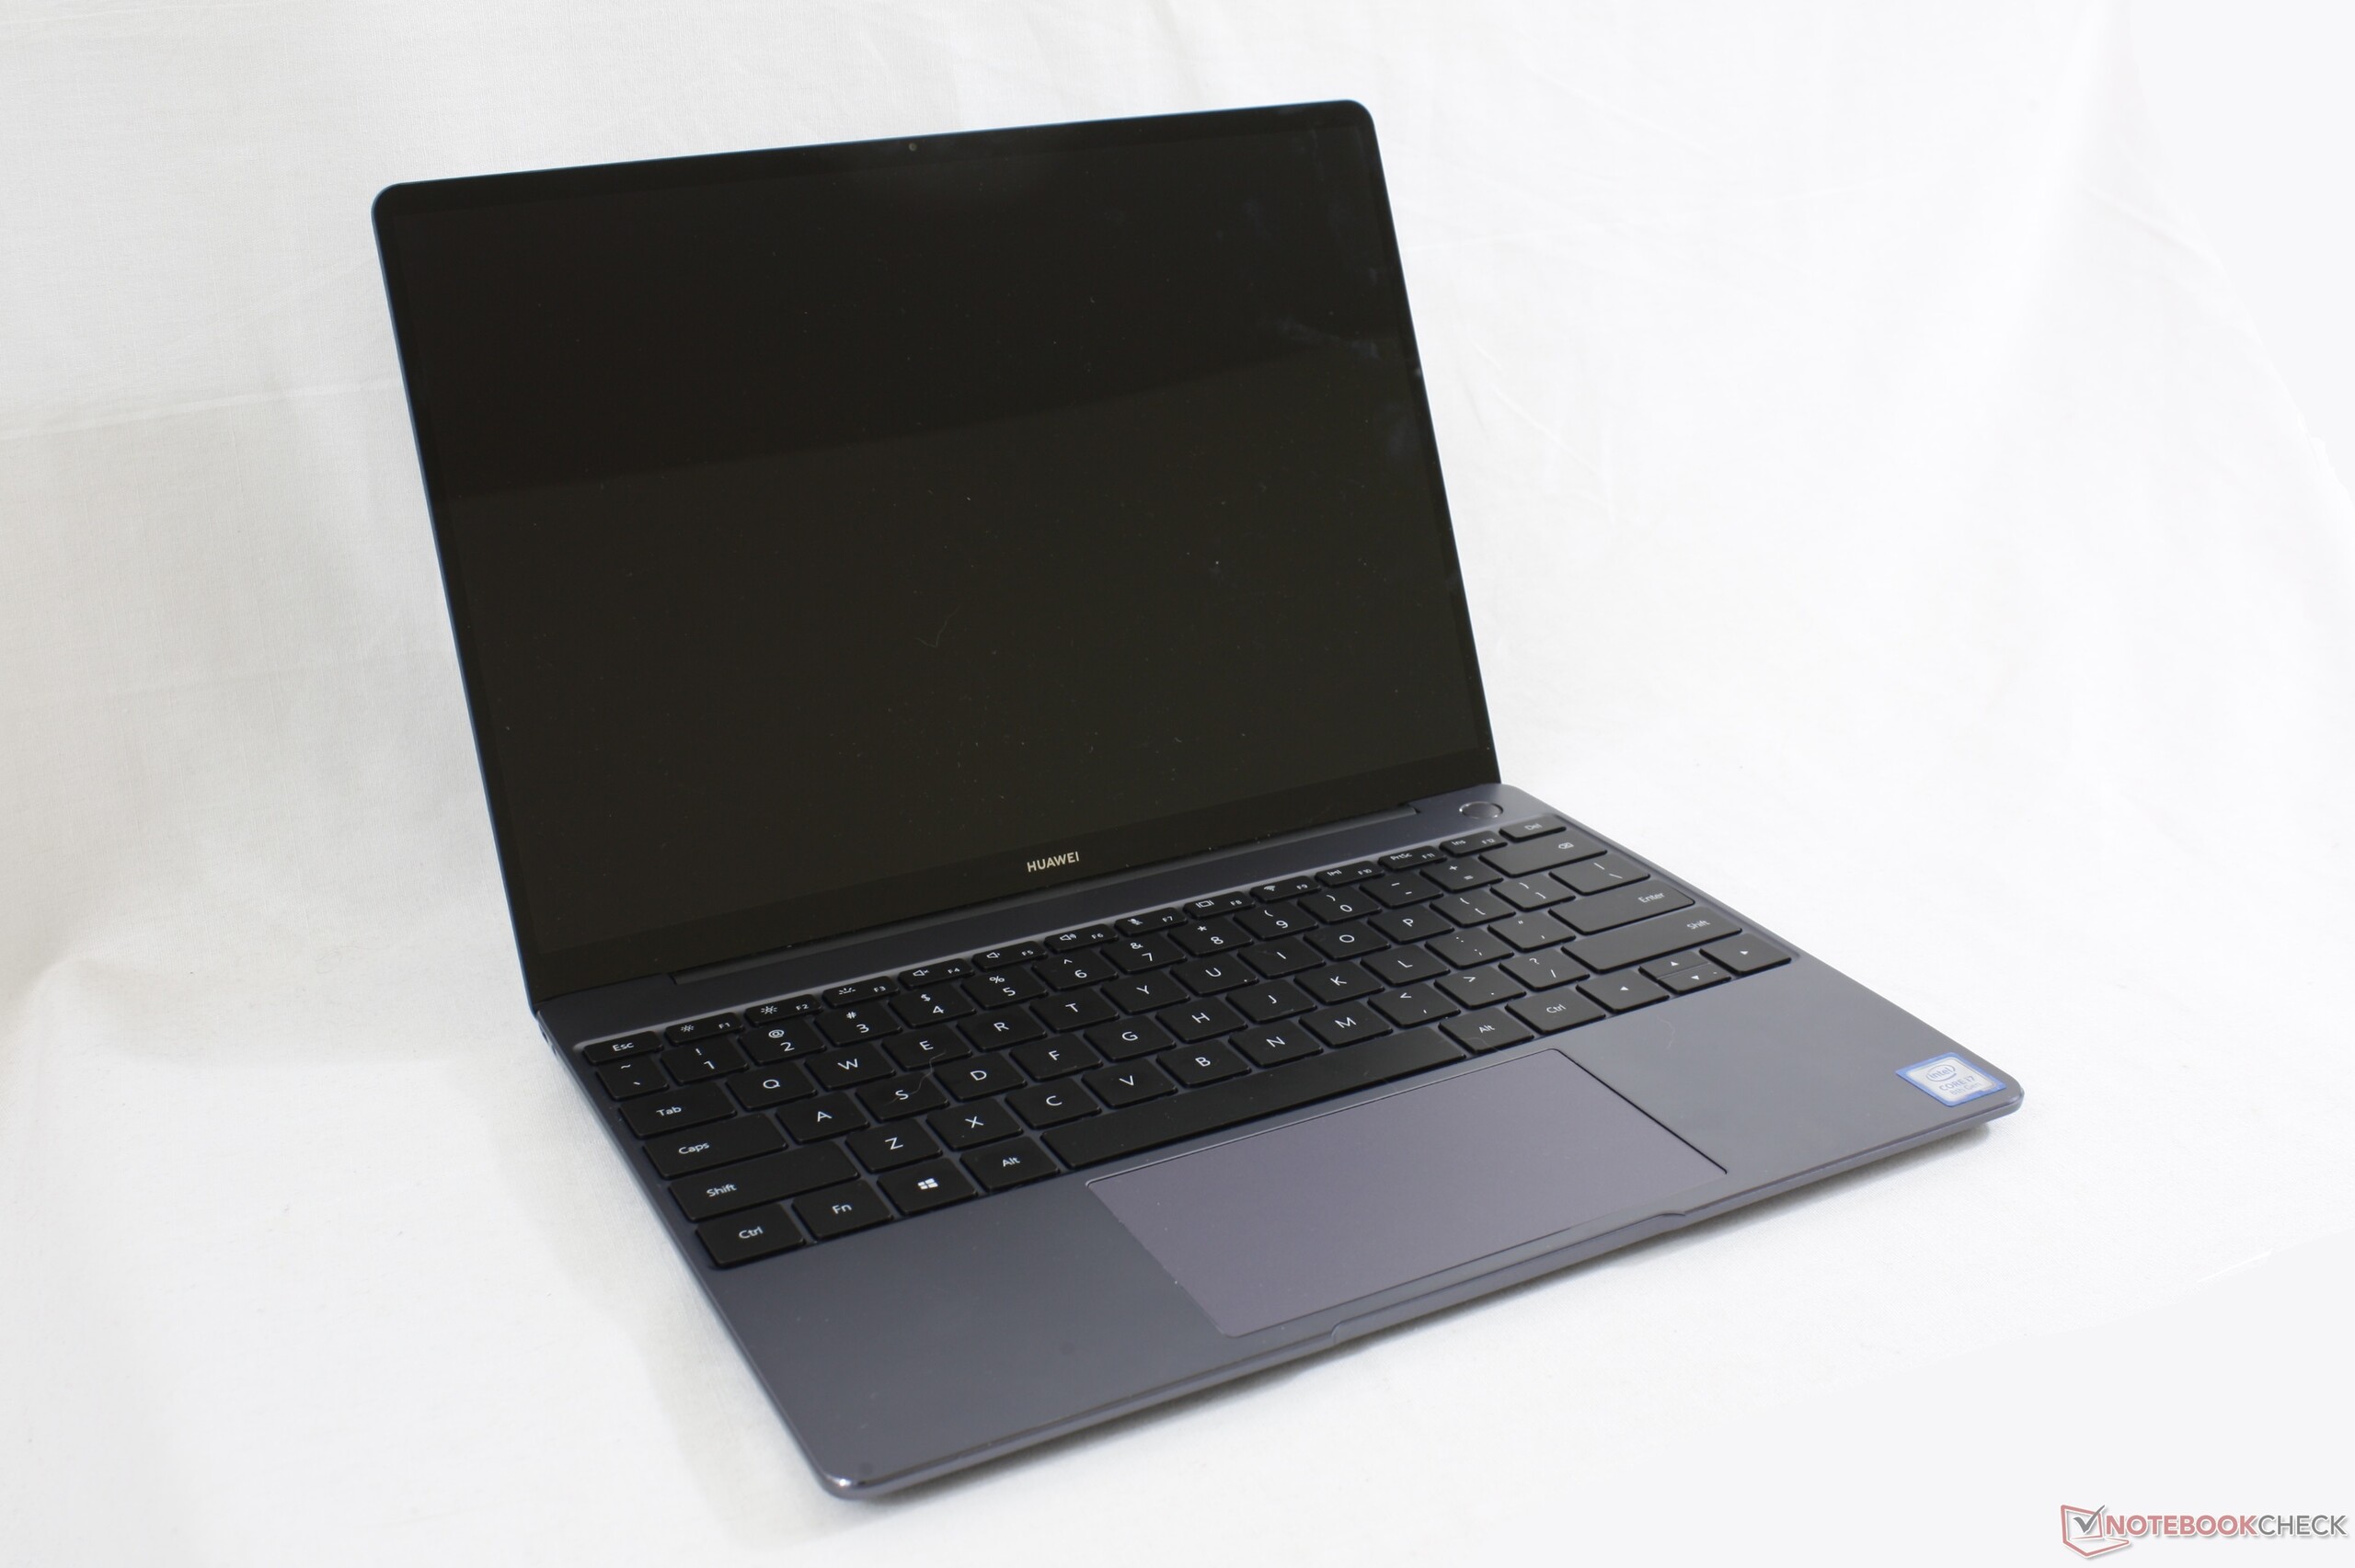
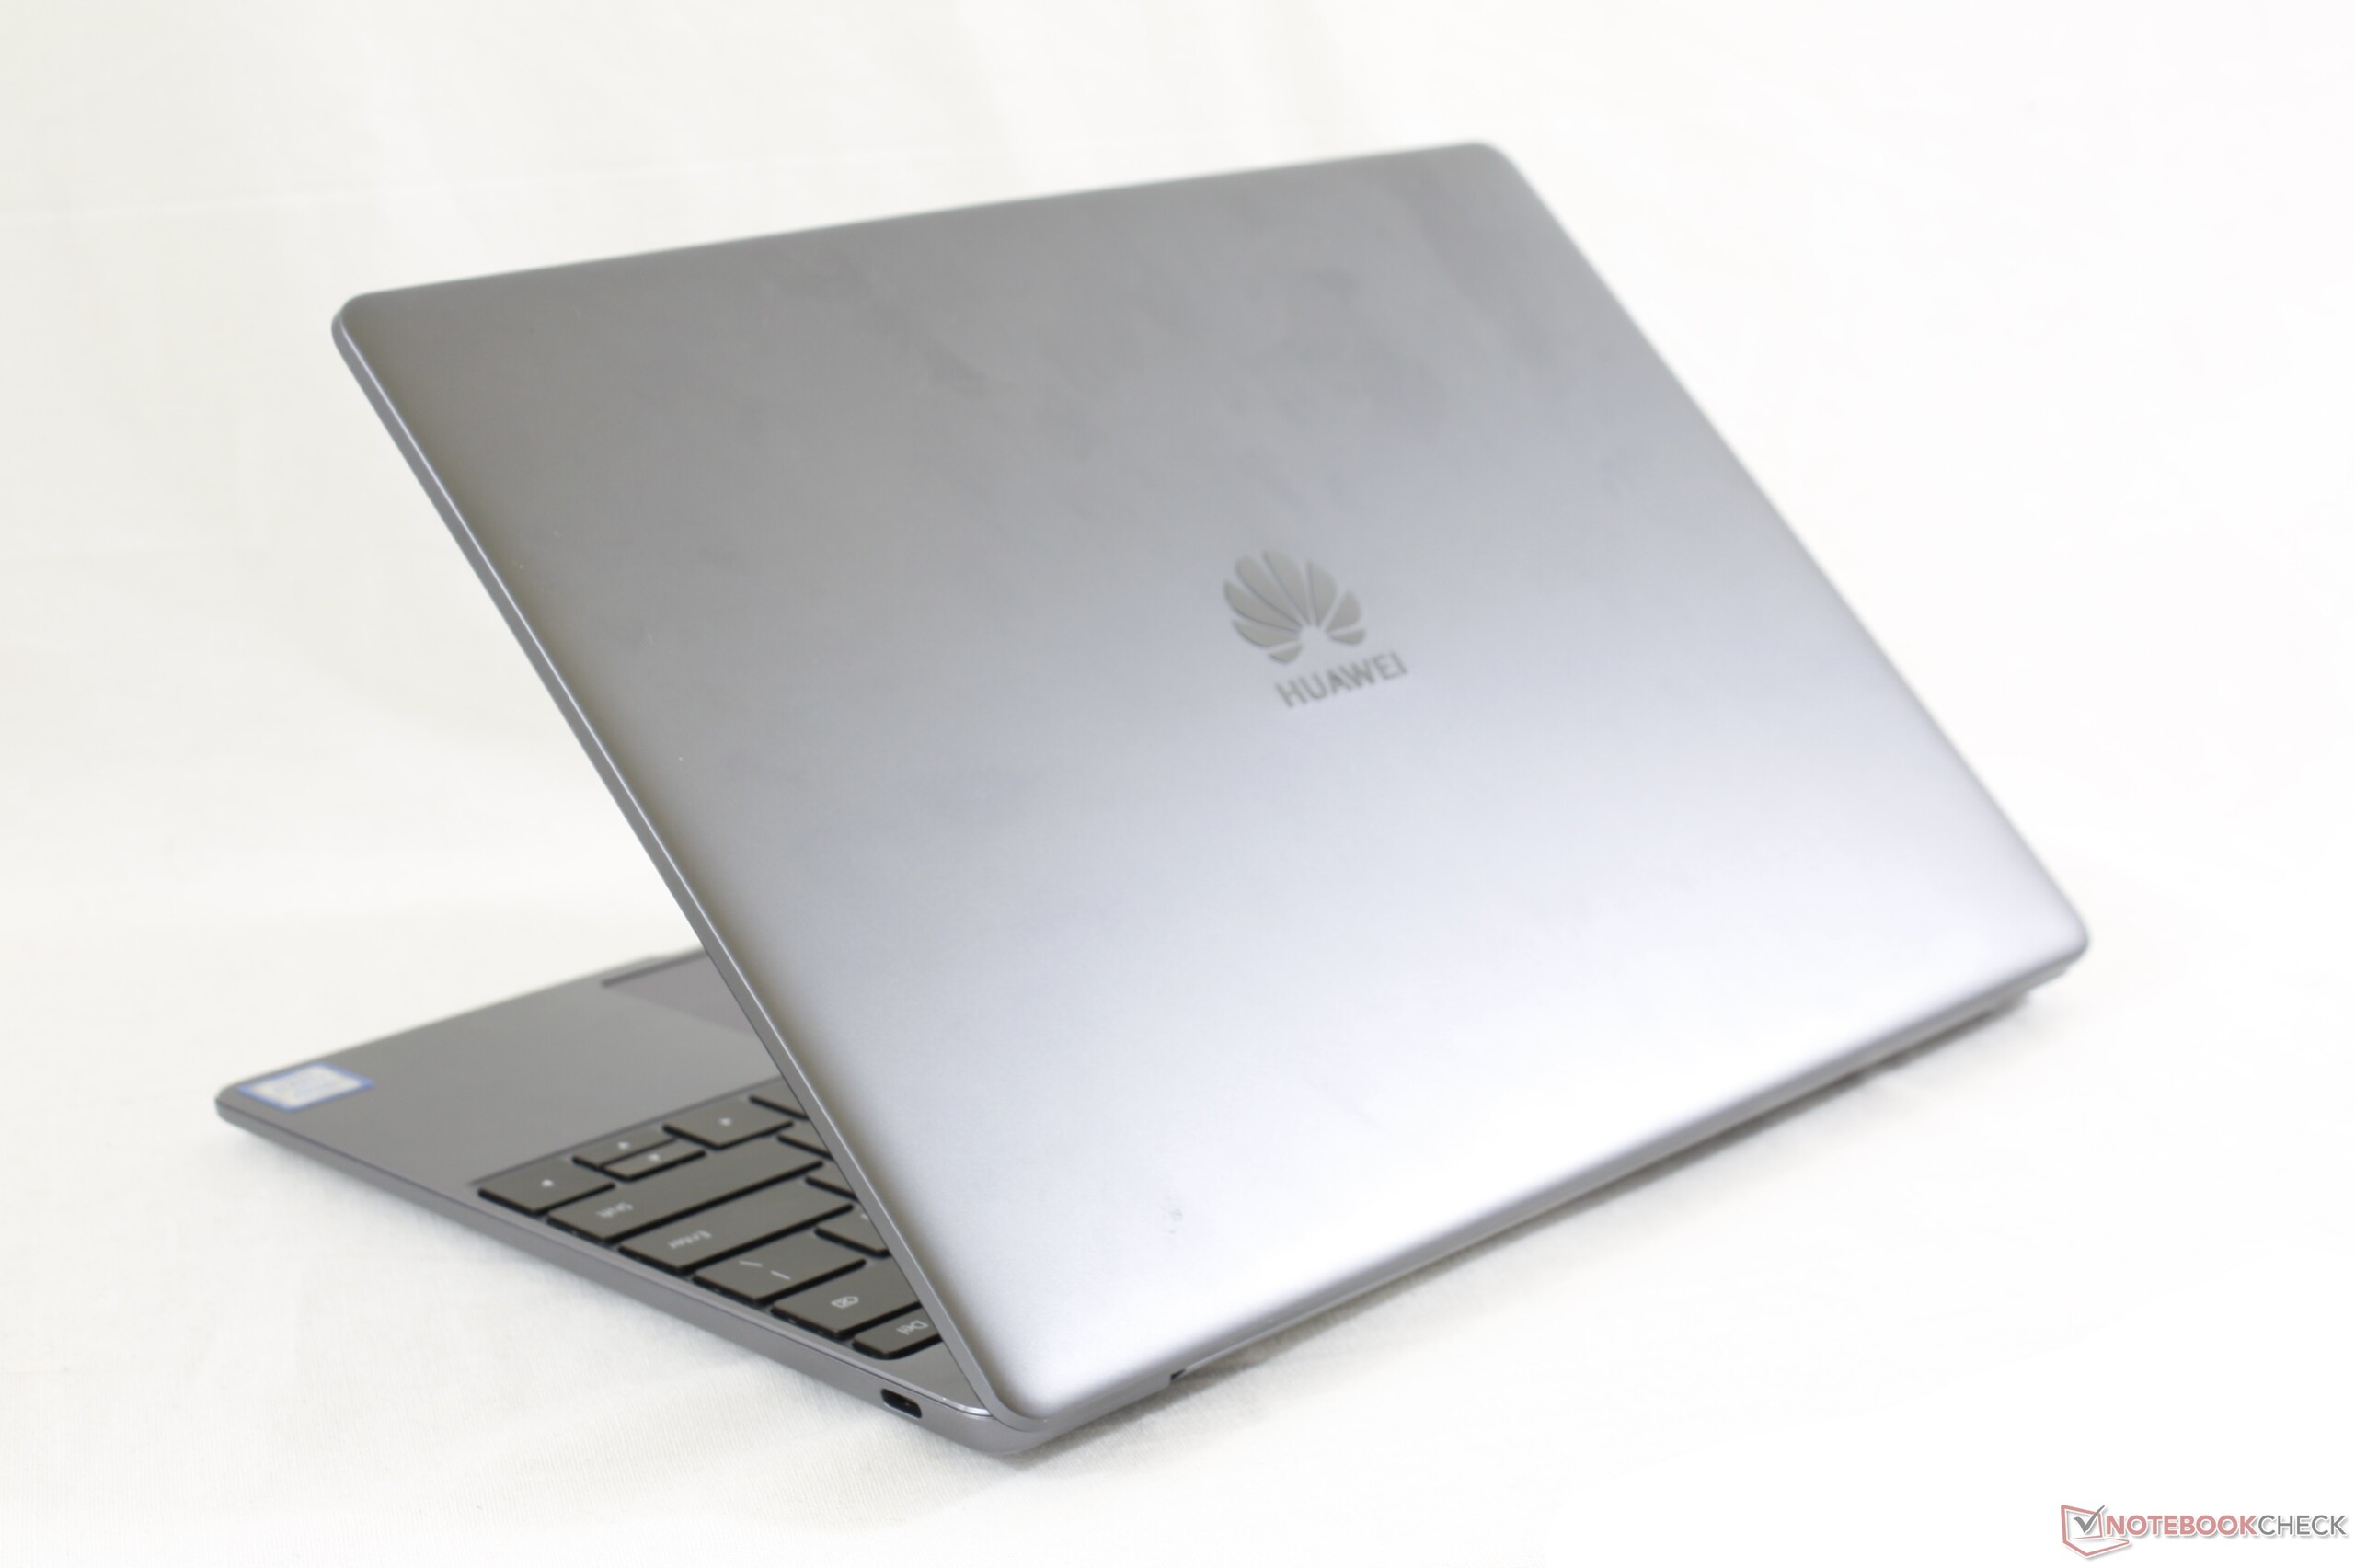
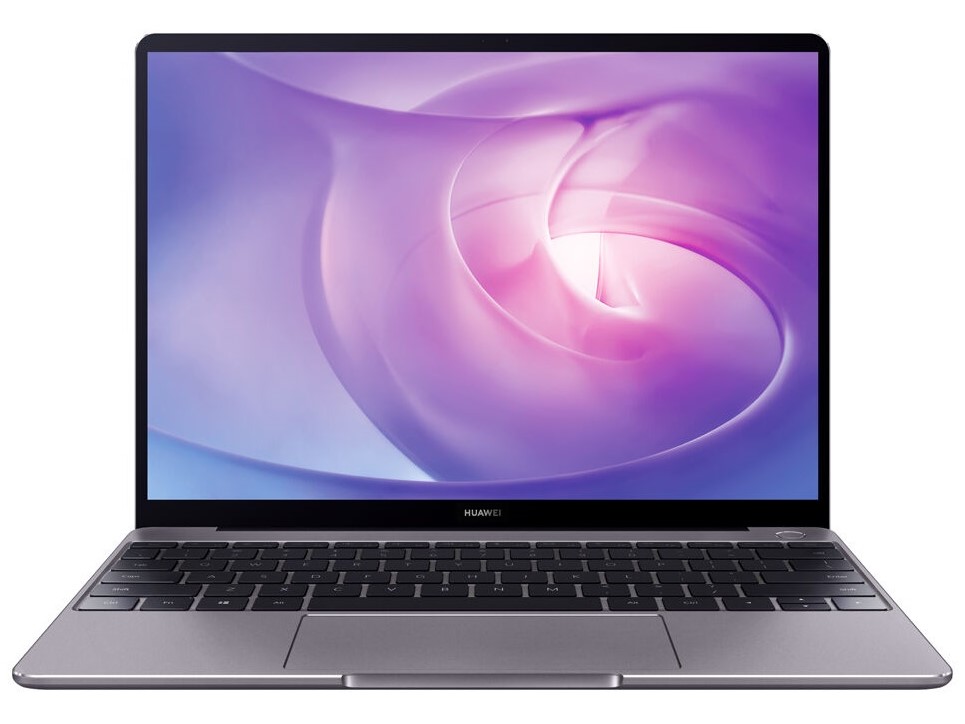
Breve Análise do Portátil Huawei MateBook 13 (i7, UHD Graphics 620)
| Networking | |
| iperf3 transmit AX12 | |
| Huawei Matebook 13-53010FYW | |
| Lenovo ThinkPad X390-20Q1S02M00 | |
| HP ProBook 430 G6-5TJ89EA | |
| Dell Inspiron 13 7380 | |
| Asus ZenBook S13 UX392FN | |
| iperf3 receive AX12 | |
| HP ProBook 430 G6-5TJ89EA | |
| Asus ZenBook S13 UX392FN | |
| Lenovo ThinkPad X390-20Q1S02M00 | |
| Huawei Matebook 13-53010FYW | |
| Dell Inspiron 13 7380 | |
| |||||||||||||||||||||||||
iluminação: 86 %
iluminação com acumulador: 355 cd/m²
Contraste: 1017:1 (Preto: 0.35 cd/m²)
ΔE ColorChecker Calman: 3.3 | ∀{0.5-29.43 Ø4.73}
calibrated: 1.1
ΔE Greyscale Calman: 5.8 | ∀{0.09-98 Ø4.97}
99.4% sRGB (Argyll 1.6.3 3D)
64.1% AdobeRGB 1998 (Argyll 1.6.3 3D)
69.7% AdobeRGB 1998 (Argyll 3D)
99.3% sRGB (Argyll 3D)
68.1% Display P3 (Argyll 3D)
Gamma: 2.21
CCT: 6670 K
| Huawei Matebook 13-53010FYW Chi Mei CMN8201, , 2160x1440, 13" | Huawei MateBook 13 i7 Chi Mei CMN8201, , 2160x1440, 13" | Asus ZenBook S13 UX392FN Tianma XM, , 1920x1080, 13.9" | Lenovo ThinkPad X390-20Q1S02M00 LP133WF7-SPB1, , 1920x1080, 13.3" | HP ProBook 430 G6-5TJ89EA CMN1375, , 1920x1080, 13.3" | Dell Inspiron 13 7380 LG Philips LGD05DD / Dell 133WF4, , 1920x1080, 13.3" | |
|---|---|---|---|---|---|---|
| Display | -1% | -2% | -4% | -38% | -10% | |
| Display P3 Coverage (%) | 68.1 | 68.1 0% | 67.5 -1% | 65.3 -4% | 41.87 -39% | 65.8 -3% |
| sRGB Coverage (%) | 99.3 | 97.7 -2% | 95.8 -4% | 95.9 -3% | 62.6 -37% | 84.7 -15% |
| AdobeRGB 1998 Coverage (%) | 69.7 | 69.2 -1% | 69 -1% | 66.6 -4% | 43.3 -38% | 61.9 -11% |
| Response Times | -3% | 5% | -23% | 3% | 26% | |
| Response Time Grey 50% / Grey 80% * (ms) | 43.2 ? | 43.2 ? -0% | 47.2 ? -9% | 57.6 ? -33% | 40.8 ? 6% | 34 ? 21% |
| Response Time Black / White * (ms) | 30.4 ? | 32 ? -5% | 24.8 ? 18% | 34 ? -12% | 30.4 ? -0% | 21 ? 31% |
| PWM Frequency (Hz) | 60240 ? | 26040 ? | 135000 ? | |||
| Screen | 2% | 17% | 19% | -43% | -12% | |
| Brightness middle (cd/m²) | 356 | 366.6 3% | 466 31% | 356 0% | 255 -28% | 329 -8% |
| Brightness (cd/m²) | 346 | 360 4% | 462 34% | 336 -3% | 238 -31% | 301 -13% |
| Brightness Distribution (%) | 86 | 93 8% | 90 5% | 88 2% | 88 2% | 84 -2% |
| Black Level * (cd/m²) | 0.35 | 0.39 -11% | 0.33 6% | 0.16 54% | 0.18 49% | 0.32 9% |
| Contrast (:1) | 1017 | 940 -8% | 1412 39% | 2225 119% | 1417 39% | 1028 1% |
| Colorchecker dE 2000 * | 3.3 | 2.76 16% | 1.93 42% | 3.6 -9% | 5.4 -64% | 5.81 -76% |
| Colorchecker dE 2000 max. * | 8.7 | 6.19 29% | 4.26 51% | 5.5 37% | 19.5 -124% | 12.17 -40% |
| Colorchecker dE 2000 calibrated * | 1.1 | 1.53 -39% | 1.99 -81% | 1.1 -0% | 4.1 -273% | |
| Greyscale dE 2000 * | 5.8 | 4.2 28% | 1.7 71% | 4.7 19% | 3.8 34% | 3.77 35% |
| Gamma | 2.21 100% | 2.22 99% | 2.15 102% | 2.48 89% | 2.41 91% | 2.13 103% |
| CCT | 6670 97% | 6271 104% | 6382 102% | 6374 102% | 7100 92% | 6940 94% |
| Color Space (Percent of AdobeRGB 1998) (%) | 64.1 | 63.2 -1% | 62.2 -3% | 61.3 -4% | 39.4 -39% | 56 -13% |
| Color Space (Percent of sRGB) (%) | 99.4 | 97.6 -2% | 95.7 -4% | 95.7 -4% | 62.5 -37% | 85 -14% |
| Média Total (Programa/Configurações) | -1% /
1% | 7% /
12% | -3% /
10% | -26% /
-36% | 1% /
-7% |
* ... menor é melhor
Exibir tempos de resposta
| ↔ Tempo de resposta preto para branco | ||
|---|---|---|
| 30.4 ms ... ascensão ↗ e queda ↘ combinadas | ↗ 17.2 ms ascensão | 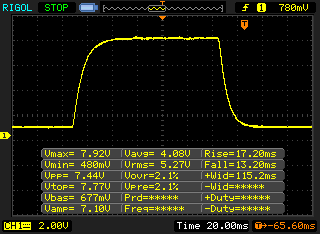 |
| ↘ 13.2 ms queda | ||
| A tela mostra taxas de resposta lentas em nossos testes e será insatisfatória para os jogadores. Em comparação, todos os dispositivos testados variam de 0.1 (mínimo) a 240 (máximo) ms. » 82 % de todos os dispositivos são melhores. Isso significa que o tempo de resposta medido é pior que a média de todos os dispositivos testados (19.9 ms). | ||
| ↔ Tempo de resposta 50% cinza a 80% cinza | ||
| 43.2 ms ... ascensão ↗ e queda ↘ combinadas | ↗ 23.6 ms ascensão | 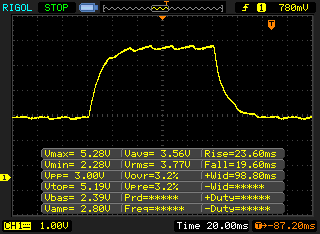 |
| ↘ 19.6 ms queda | ||
| A tela mostra taxas de resposta lentas em nossos testes e será insatisfatória para os jogadores. Em comparação, todos os dispositivos testados variam de 0.165 (mínimo) a 636 (máximo) ms. » 72 % de todos os dispositivos são melhores. Isso significa que o tempo de resposta medido é pior que a média de todos os dispositivos testados (31.1 ms). | ||
Cintilação da tela / PWM (modulação por largura de pulso)
| Tela tremeluzindo/PWM detectado | 60240 Hz | ≤ 30 % configuração de brilho | 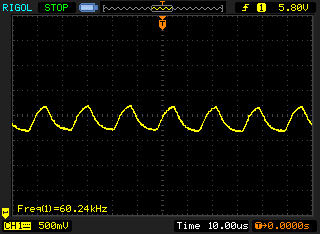 |
A luz de fundo da tela pisca em 60240 Hz (pior caso, por exemplo, utilizando PWM) Cintilação detectada em uma configuração de brilho de 30 % e abaixo. Não deve haver cintilação ou PWM acima desta configuração de brilho. A frequência de 60240 Hz é bastante alta, então a maioria dos usuários sensíveis ao PWM não deve notar nenhuma oscilação. [pwm_comparison] Em comparação: 52 % de todos os dispositivos testados não usam PWM para escurecer a tela. Se PWM foi detectado, uma média de 7798 (mínimo: 5 - máximo: 343500) Hz foi medida. | |||

| PCMark 8 Home Score Accelerated v2 | 3587 pontos | |
| PCMark 8 Work Score Accelerated v2 | 4958 pontos | |
| PCMark 10 Score | 4138 pontos | |
Ajuda | ||
| Huawei Matebook 13-53010FYW WDC PC SN520 SDAPNUW-512G | Huawei MateBook 13 i7 Samsung SSD PM981 MZVLB512HAJQ | Asus ZenBook S13 UX392FN WDC PC SN520 SDAPNUW-512G | Lenovo ThinkPad X390-20Q1S02M00 Intel SSD Pro 7600p SSDPEKKF512G8L | HP ProBook 430 G6-5TJ89EA WDC PC SN520 SDAPNUW-256G | Dell Inspiron 13 7380 Toshiba BG3 KBG30ZMS256G | Média WDC PC SN520 SDAPNUW-512G | |
|---|---|---|---|---|---|---|---|
| CrystalDiskMark 5.2 / 6 | -9% | -27% | -17% | -39% | -64% | -32% | |
| Write 4K (MB/s) | 191.2 | 159.4 -17% | 149.2 -22% | 120.7 -37% | 101.8 -47% | 75 -61% | 138.5 ? -28% |
| Read 4K (MB/s) | 53.1 | 47.31 -11% | 47.18 -11% | 58.5 10% | 41.35 -22% | 31.61 -40% | 44.2 ? -17% |
| Write Seq (MB/s) | 1768 | 1899 7% | 750 -58% | 1491 -16% | 929 -47% | 235.7 -87% | 1265 ? -28% |
| Read Seq (MB/s) | 1710 | 2173 27% | 1137 -34% | 2760 61% | 1388 -19% | 901 -47% | 1237 ? -28% |
| Write 4K Q32T1 (MB/s) | 575 | 368.1 -36% | 749 30% | 237.5 -59% | 453.5 -21% | 154.3 -73% | 404 ? -30% |
| Read 4K Q32T1 (MB/s) | 654 | 526 -20% | 478.7 -27% | 336.1 -49% | 286.2 -56% | 294.4 -55% | 421 ? -36% |
| Write Seq Q32T1 (MB/s) | 2544 | 1914 -25% | 1453 -43% | 1512 -41% | 1302 -49% | 241.5 -91% | 1491 ? -41% |
| Read Seq Q32T1 (MB/s) | 3433 | 3487 2% | 1713 -50% | 3154 -8% | 1751 -49% | 1440 -58% | 1741 ? -49% |
| Write 4K Q8T8 (MB/s) | 1065 | 572 | 715 ? | ||||
| Read 4K Q8T8 (MB/s) | 891 | 826 | 1027 ? | ||||
| AS SSD | -7% | -23% | -12% | -48% | -159% | -31% | |
| Seq Read (MB/s) | 2934 | 1889 -36% | 1224 -58% | 2689 -8% | 1373 -53% | 1257 -57% | 1363 ? -54% |
| Seq Write (MB/s) | 2407 | 1812 -25% | 907 -62% | 1462 -39% | 726 -70% | 164.4 -93% | 1227 ? -49% |
| 4K Read (MB/s) | 48.31 | 55.5 15% | 41.46 -14% | 63.8 32% | 40.67 -16% | 32.13 -33% | 40.8 ? -16% |
| 4K Write (MB/s) | 179.7 | 118.4 -34% | 126.2 -30% | 139.8 -22% | 119.7 -33% | 82.6 -54% | 127.3 ? -29% |
| 4K-64 Read (MB/s) | 1296 | 1257 -3% | 1021 -21% | 865 -33% | 567 -56% | 340.6 -74% | 957 ? -26% |
| 4K-64 Write (MB/s) | 1459 | 1571 8% | 1251 -14% | 1041 -29% | 408.2 -72% | 126.2 -91% | 1081 ? -26% |
| Access Time Read * (ms) | 0.103 | 0.041 60% | 0.053 49% | 0.037 64% | 0.107 -4% | 0.084 18% | 0.07744 ? 25% |
| Access Time Write * (ms) | 0.021 | 0.032 -52% | 0.027 -29% | 0.024 -14% | 0.03 -43% | 0.258 -1129% | 0.03671 ? -75% |
| Score Read (Points) | 1638 | 1502 -8% | 1185 -28% | 1198 -27% | 745 -55% | 498 -70% | 1134 ? -31% |
| Score Write (Points) | 1879 | 1871 0% | 1468 -22% | 1328 -29% | 600 -68% | 225 -88% | 1331 ? -29% |
| Score Total (Points) | 4334 | 4147 -4% | 3250 -25% | 3095 -29% | 1706 -61% | 934 -78% | 3046 ? -30% |
| Copy ISO MB/s (MB/s) | 1800 | 1404 | 1290 | 1117 | 277.3 | 1169 ? | |
| Copy Program MB/s (MB/s) | 385.6 | 402.4 | 436.5 | 376.4 | 128.6 | 446 ? | |
| Copy Game MB/s (MB/s) | 982 | 902 | 1147 | 796 | 166.3 | 874 ? | |
| Média Total (Programa/Configurações) | -8% /
-8% | -25% /
-25% | -15% /
-14% | -44% /
-44% | -112% /
-119% | -32% /
-31% |
* ... menor é melhor

| 3DMark 11 - 1280x720 Performance GPU | |
| Média da turma Subnotebook (995 - 18489, n=57, últimos 2 anos) | |
| Huawei MateBook 13 i7 | |
| Asus ZenBook S13 UX392FN | |
| Huawei Matebook 13-53010FYW | |
| Dell Inspiron 13 7380 | |
| Lenovo ThinkPad X390-20Q1S02M00 | |
| Média Intel UHD Graphics 620 (1144 - 3432, n=244) | |
| HP ProBook 430 G6-5TJ89EA | |
| 3DMark | |
| 1280x720 Cloud Gate Standard Graphics | |
| Média da turma Subnotebook (5577 - 61591, n=30, últimos 2 anos) | |
| Huawei MateBook 13 i7 | |
| Asus ZenBook S13 UX392FN | |
| Dell Inspiron 13 7380 | |
| Huawei Matebook 13-53010FYW | |
| Lenovo ThinkPad X390-20Q1S02M00 | |
| Média Intel UHD Graphics 620 (6205 - 16400, n=225) | |
| HP ProBook 430 G6-5TJ89EA | |
| 1920x1080 Fire Strike Graphics | |
| Média da turma Subnotebook (832 - 16347, n=58, últimos 2 anos) | |
| Huawei MateBook 13 i7 | |
| Asus ZenBook S13 UX392FN | |
| Huawei Matebook 13-53010FYW | |
| Dell Inspiron 13 7380 | |
| Lenovo ThinkPad X390-20Q1S02M00 | |
| Média Intel UHD Graphics 620 (557 - 2608, n=213) | |
| HP ProBook 430 G6-5TJ89EA | |
| 2560x1440 Time Spy Graphics | |
| Média da turma Subnotebook (804 - 6288, n=57, últimos 2 anos) | |
| Asus ZenBook S13 UX392FN | |
| Média Intel UHD Graphics 620 (299 - 797, n=88) | |
| 3DMark 11 Performance | 2133 pontos | |
| 3DMark Cloud Gate Standard Score | 8831 pontos | |
| 3DMark Fire Strike Score | 1219 pontos | |
Ajuda | ||
| BioShock Infinite | |
| 1280x720 Very Low Preset | |
| Huawei MateBook 13 i7 | |
| Asus ZenBook S13 UX392FN | |
| Huawei Matebook 13-53010FYW | |
| Lenovo ThinkPad X390-20Q1S02M00 | |
| Dell Inspiron 13 7380 | |
| Média Intel UHD Graphics 620 (18.3 - 90.2, n=187) | |
| HP ProBook 430 G6-5TJ89EA | |
| 1366x768 Medium Preset | |
| Huawei MateBook 13 i7 | |
| Asus ZenBook S13 UX392FN | |
| Huawei Matebook 13-53010FYW | |
| Dell Inspiron 13 7380 | |
| Lenovo ThinkPad X390-20Q1S02M00 | |
| Média Intel UHD Graphics 620 (11.5 - 45.5, n=187) | |
| HP ProBook 430 G6-5TJ89EA | |
| 1366x768 High Preset | |
| Huawei MateBook 13 i7 | |
| Asus ZenBook S13 UX392FN | |
| Huawei Matebook 13-53010FYW | |
| Lenovo ThinkPad X390-20Q1S02M00 | |
| Dell Inspiron 13 7380 | |
| Média Intel UHD Graphics 620 (8.1 - 35.9, n=187) | |
| HP ProBook 430 G6-5TJ89EA | |
| 1920x1080 Ultra Preset, DX11 (DDOF) | |
| Huawei MateBook 13 i7 | |
| Asus ZenBook S13 UX392FN | |
| Lenovo ThinkPad X390-20Q1S02M00 | |
| Huawei Matebook 13-53010FYW | |
| Dell Inspiron 13 7380 | |
| Média Intel UHD Graphics 620 (4.5 - 17, n=176) | |
| HP ProBook 430 G6-5TJ89EA | |
| Thief | |
| 1024x768 Very Low Preset | |
| Huawei Matebook 13-53010FYW | |
| Média Intel UHD Graphics 620 (16.3 - 34.3, n=10) | |
| 1366x768 Normal Preset AA:FX | |
| Huawei Matebook 13-53010FYW | |
| Média Intel UHD Graphics 620 (10.4 - 19.7, n=10) | |
| 1366x768 High Preset AA:FXAA & Low SS AF:4x | |
| Huawei Matebook 13-53010FYW | |
| Média Intel UHD Graphics 620 (8.5 - 15.1, n=5) | |
| baixo | média | alto | ultra | |
|---|---|---|---|---|
| BioShock Infinite (2013) | 83 | 40 | 34 | 10 |
| Thief (2014) | 34.3 | 19.3 | 14.7 | |
| Dota 2 Reborn (2015) | 75.3 | 50.2 | 22 | 19.8 |
Barulho
| Ocioso |
| 29.2 / 29.2 / 29.2 dB |
| Carga |
| 31.7 / 33 dB |
 | ||
30 dB silencioso 40 dB(A) audível 50 dB(A) ruidosamente alto |
||
min: | ||
(+) A temperatura máxima no lado superior é 39.7 °C / 103 F, em comparação com a média de 35.9 °C / 97 F , variando de 21.4 a 59 °C para a classe Subnotebook.
(±) A parte inferior aquece até um máximo de 44.4 °C / 112 F, em comparação com a média de 39.2 °C / 103 F
(+) Em uso inativo, a temperatura média para o lado superior é 24.1 °C / 75 F, em comparação com a média do dispositivo de 30.8 °C / ### class_avg_f### F.
(+) Os apoios para as mãos e o touchpad estão atingindo a temperatura máxima da pele (34.2 °C / 93.6 F) e, portanto, não estão quentes.
(-) A temperatura média da área do apoio para as mãos de dispositivos semelhantes foi 28.2 °C / 82.8 F (-6 °C / -10.8 F).
Huawei Matebook 13-53010FYW análise de áudio
(±) | o volume do alto-falante é médio, mas bom (###valor### dB)
Graves 100 - 315Hz
(-) | quase nenhum baixo - em média 20.7% menor que a mediana
(±) | a linearidade dos graves é média (11.9% delta para a frequência anterior)
Médios 400 - 2.000 Hz
(+) | médios equilibrados - apenas 3.3% longe da mediana
(+) | médios são lineares (4.7% delta para frequência anterior)
Altos 2 - 16 kHz
(+) | agudos equilibrados - apenas 3% longe da mediana
(+) | os máximos são lineares (4.4% delta da frequência anterior)
Geral 100 - 16.000 Hz
(±) | a linearidade do som geral é média (19.9% diferença em relação à mediana)
Comparado com a mesma classe
» 63% de todos os dispositivos testados nesta classe foram melhores, 8% semelhantes, 29% piores
» O melhor teve um delta de 5%, a média foi 18%, o pior foi 53%
Comparado com todos os dispositivos testados
» 51% de todos os dispositivos testados foram melhores, 7% semelhantes, 42% piores
» O melhor teve um delta de 4%, a média foi 24%, o pior foi 134%
Apple MacBook 12 (Early 2016) 1.1 GHz análise de áudio
(+) | os alto-falantes podem tocar relativamente alto (###valor### dB)
Graves 100 - 315Hz
(±) | graves reduzidos - em média 11.3% menor que a mediana
(±) | a linearidade dos graves é média (14.2% delta para a frequência anterior)
Médios 400 - 2.000 Hz
(+) | médios equilibrados - apenas 2.4% longe da mediana
(+) | médios são lineares (5.5% delta para frequência anterior)
Altos 2 - 16 kHz
(+) | agudos equilibrados - apenas 2% longe da mediana
(+) | os máximos são lineares (4.5% delta da frequência anterior)
Geral 100 - 16.000 Hz
(+) | o som geral é linear (10.2% diferença em relação à mediana)
Comparado com a mesma classe
» 7% de todos os dispositivos testados nesta classe foram melhores, 2% semelhantes, 91% piores
» O melhor teve um delta de 5%, a média foi 18%, o pior foi 53%
Comparado com todos os dispositivos testados
» 5% de todos os dispositivos testados foram melhores, 1% semelhantes, 94% piores
» O melhor teve um delta de 4%, a média foi 24%, o pior foi 134%
| desligado | |
| Ocioso | |
| Carga |
|
Key:
min: | |
| Huawei Matebook 13-53010FYW i7-8565U, UHD Graphics 620, WDC PC SN520 SDAPNUW-512G, IPS, 2160x1440, 13" | Huawei MateBook 13 i7 i7-8565U, GeForce MX150, Samsung SSD PM981 MZVLB512HAJQ, IPS, 2160x1440, 13" | Asus ZenBook S13 UX392FN i7-8565U, GeForce MX150, WDC PC SN520 SDAPNUW-512G, IPS, 1920x1080, 13.9" | Lenovo ThinkPad X390-20Q1S02M00 i5-8265U, UHD Graphics 620, Intel SSD Pro 7600p SSDPEKKF512G8L, IPS LED, 1920x1080, 13.3" | HP ProBook 430 G6-5TJ89EA i5-8265U, UHD Graphics 620, WDC PC SN520 SDAPNUW-256G, IPS LED, 1920x1080, 13.3" | Dell Inspiron 13 7380 i7-8565U, UHD Graphics 620, Toshiba BG3 KBG30ZMS256G, IPS, 1920x1080, 13.3" | Média Intel UHD Graphics 620 | Média da turma Subnotebook | |
|---|---|---|---|---|---|---|---|---|
| Power Consumption | -14% | 1% | 9% | 19% | 16% | 13% | 8% | |
| Idle Minimum * (Watt) | 3.84 | 3.5 9% | 3.4 11% | 3.4 11% | 3.5 9% | 3.4 11% | 3.81 ? 1% | 3.77 ? 2% |
| Idle Average * (Watt) | 7.68 | 7.5 2% | 6.3 18% | 5.6 27% | 5.76 25% | 7.6 1% | 6.94 ? 10% | 6.56 ? 15% |
| Idle Maximum * (Watt) | 9.36 | 12.4 -32% | 10.4 -11% | 8.7 7% | 8.3 11% | 9.6 -3% | 8.75 ? 7% | 7.9 ? 16% |
| Load Average * (Watt) | 43.2 | 64.2 -49% | 51 -18% | 43.6 -1% | 34.8 19% | 32 26% | 35 ? 19% | 41.5 ? 4% |
| Load Maximum * (Watt) | 64.8 | 65.7 -1% | 62.7 3% | 65 -0% | 45.7 29% | 35.6 45% | 47.5 ? 27% | 64.1 ? 1% |
| Witcher 3 ultra * (Watt) | 52.5 | 39 |
* ... menor é melhor
| Huawei Matebook 13-53010FYW i7-8565U, UHD Graphics 620, 41.7 Wh | Huawei MateBook 13 i7 i7-8565U, GeForce MX150, 41.7 Wh | Asus ZenBook S13 UX392FN i7-8565U, GeForce MX150, 50 Wh | Lenovo ThinkPad X390-20Q1S02M00 i5-8265U, UHD Graphics 620, 48 Wh | HP ProBook 430 G6-5TJ89EA i5-8265U, UHD Graphics 620, 45 Wh | Dell Inspiron 13 7380 i7-8565U, UHD Graphics 620, 38 Wh | Média da turma Subnotebook | |
|---|---|---|---|---|---|---|---|
| Duração da bateria | -22% | 18% | 13% | 22% | -14% | 49% | |
| Reader / Idle (h) | 23.6 | 15.4 -35% | 28.5 21% | 16.2 -31% | 27.8 ? 18% | ||
| WiFi v1.3 (h) | 7 | 7.6 9% | 8.4 20% | 8.3 19% | 9.5 36% | 6 -14% | 14 ? 100% |
| Load (h) | 1.5 | 0.9 -40% | 1.7 13% | 1.6 7% | 2.4 60% | 1.951 ? 30% |
Pro
Contra
Veredicto - Bom subportátil com poucas portas
Em nossa análise, o MateBook 13 prova ser um portátil de escritório sólido. O bom desempenho do sistema e a reprodução de cores permitem que os usuários executem uma ampla variedade de tarefas no portátil da Huawei. No entanto, os compradores devem evitar aplicações graficamente exigentes. Aqueles que precisam de mais potência gráfica podem teoricamente optar pelo modelo com a Nvidia GeForce MX150. Infelizmente, esse modelo não está disponível na Europa no momento. Além disso, oferece reprodução de cores, brilho da tela e distribuição de brilho um pouco piores.
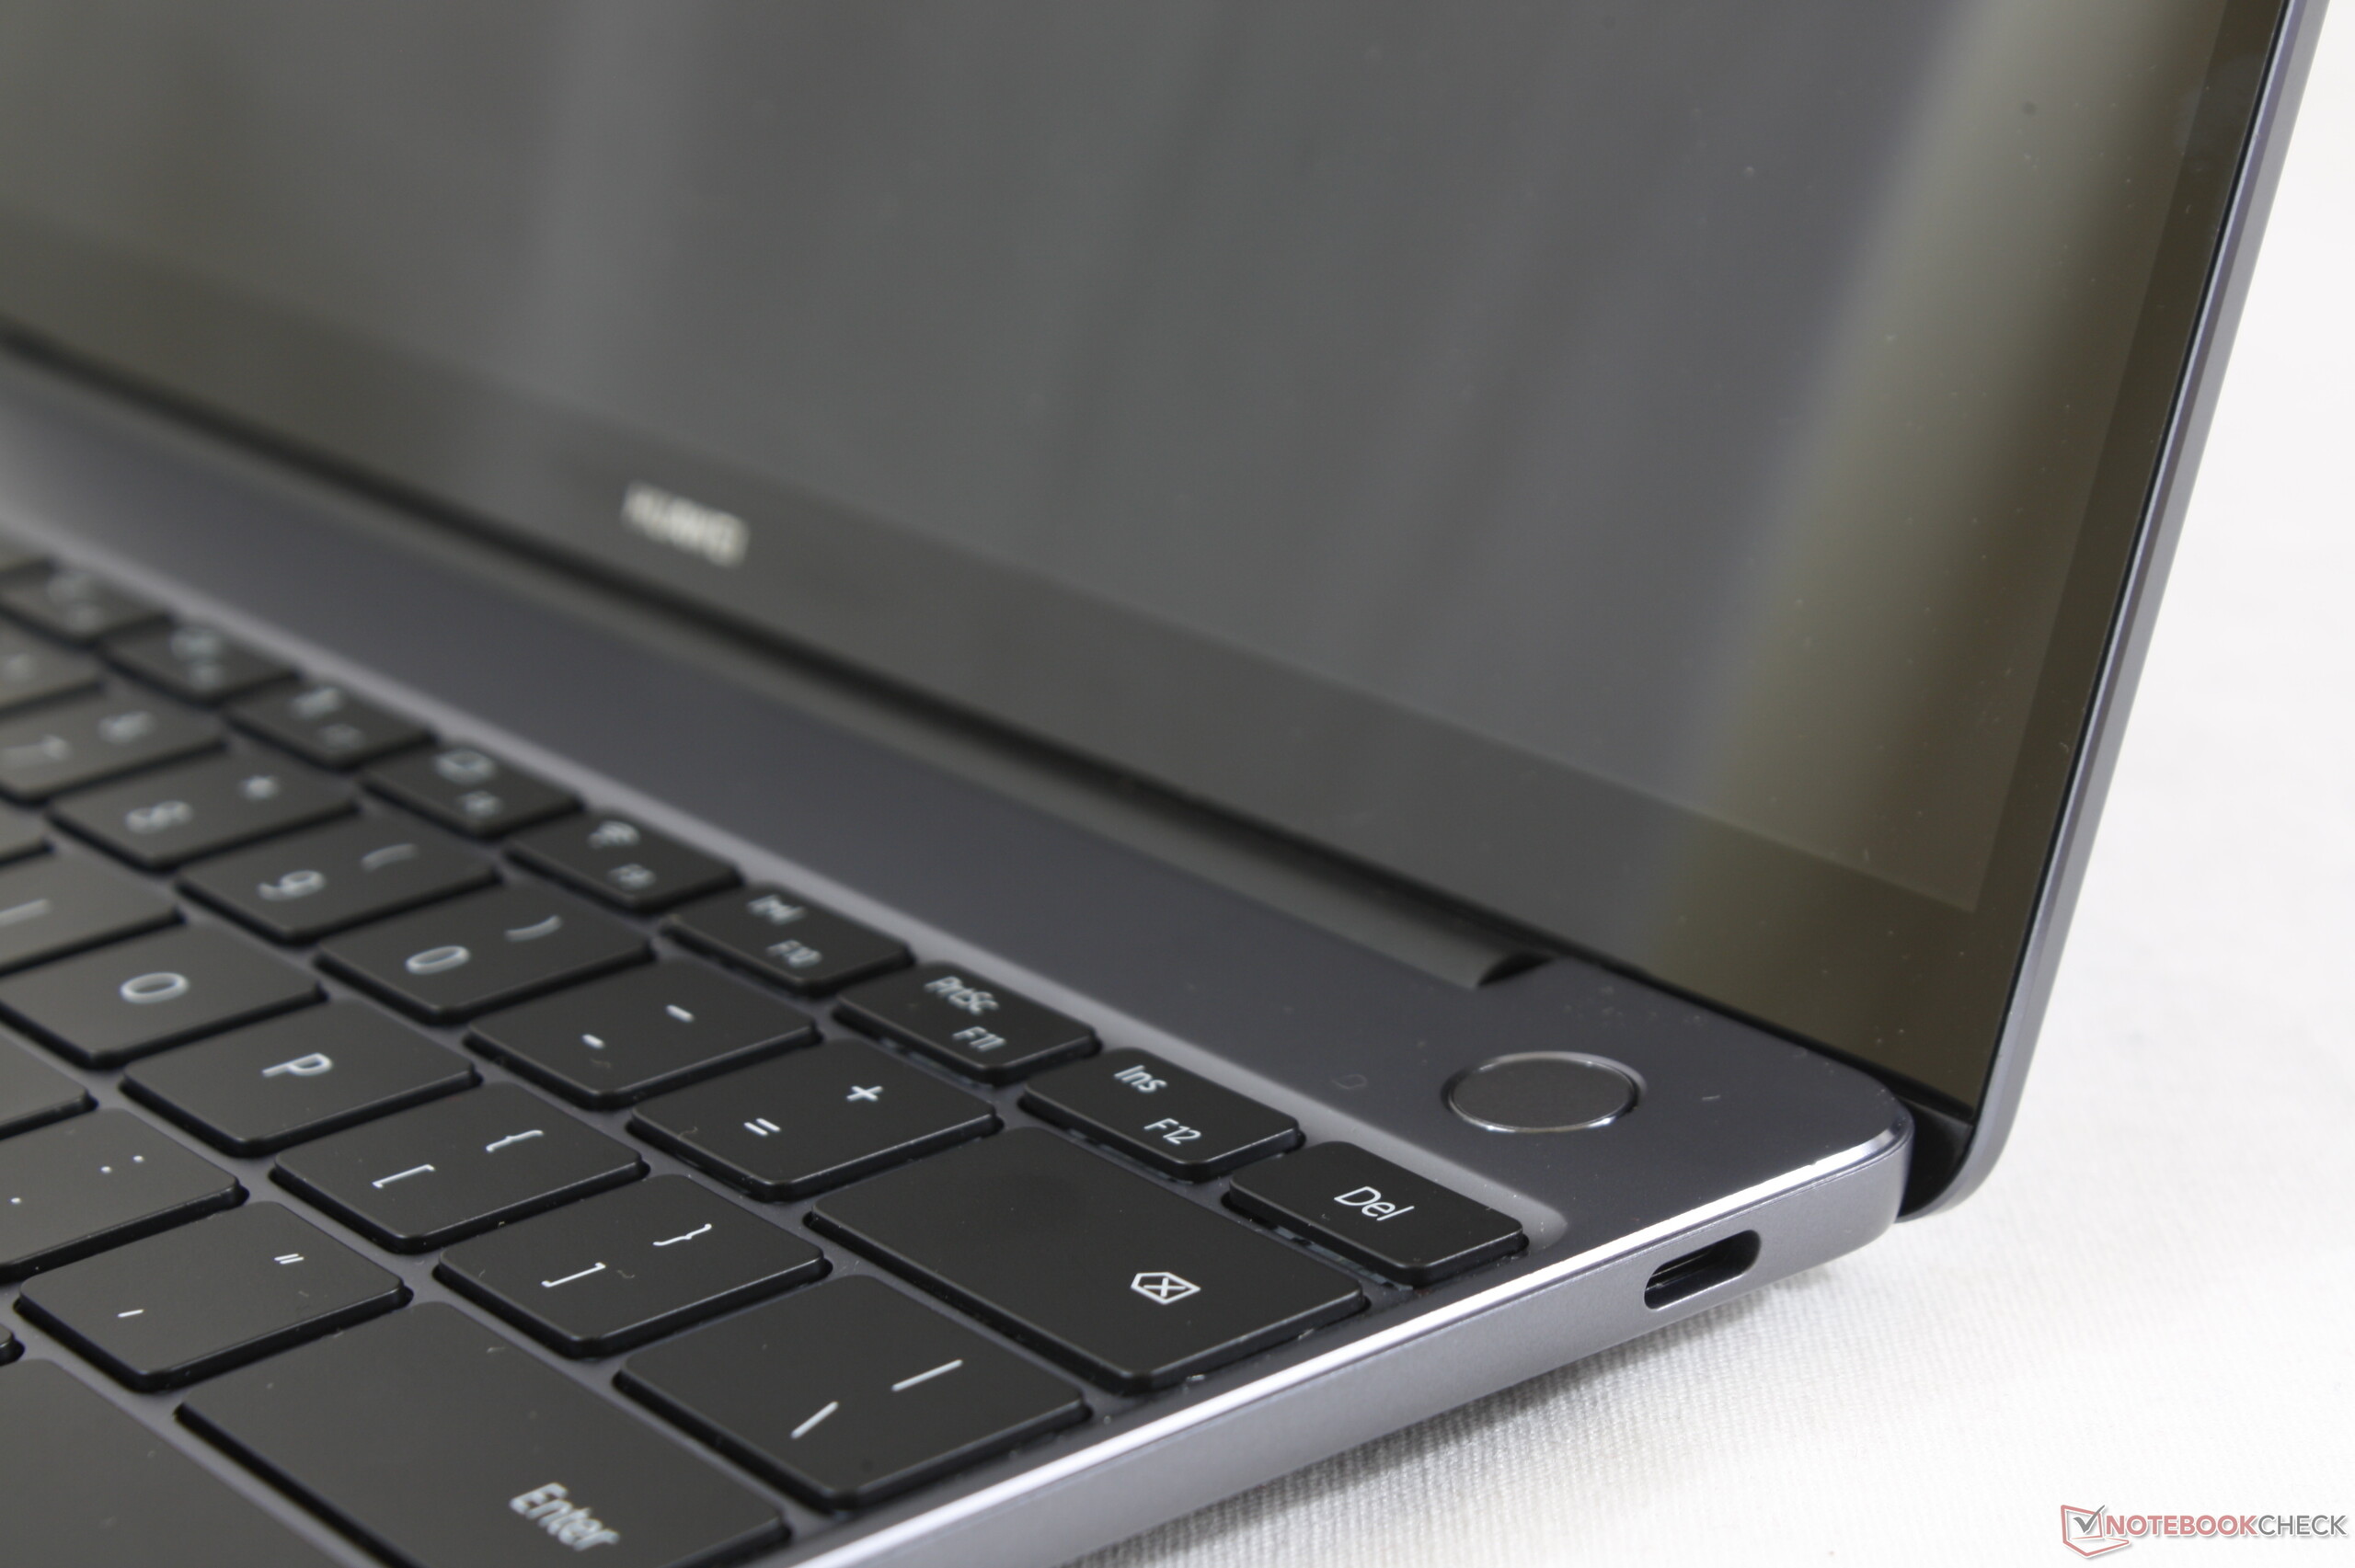
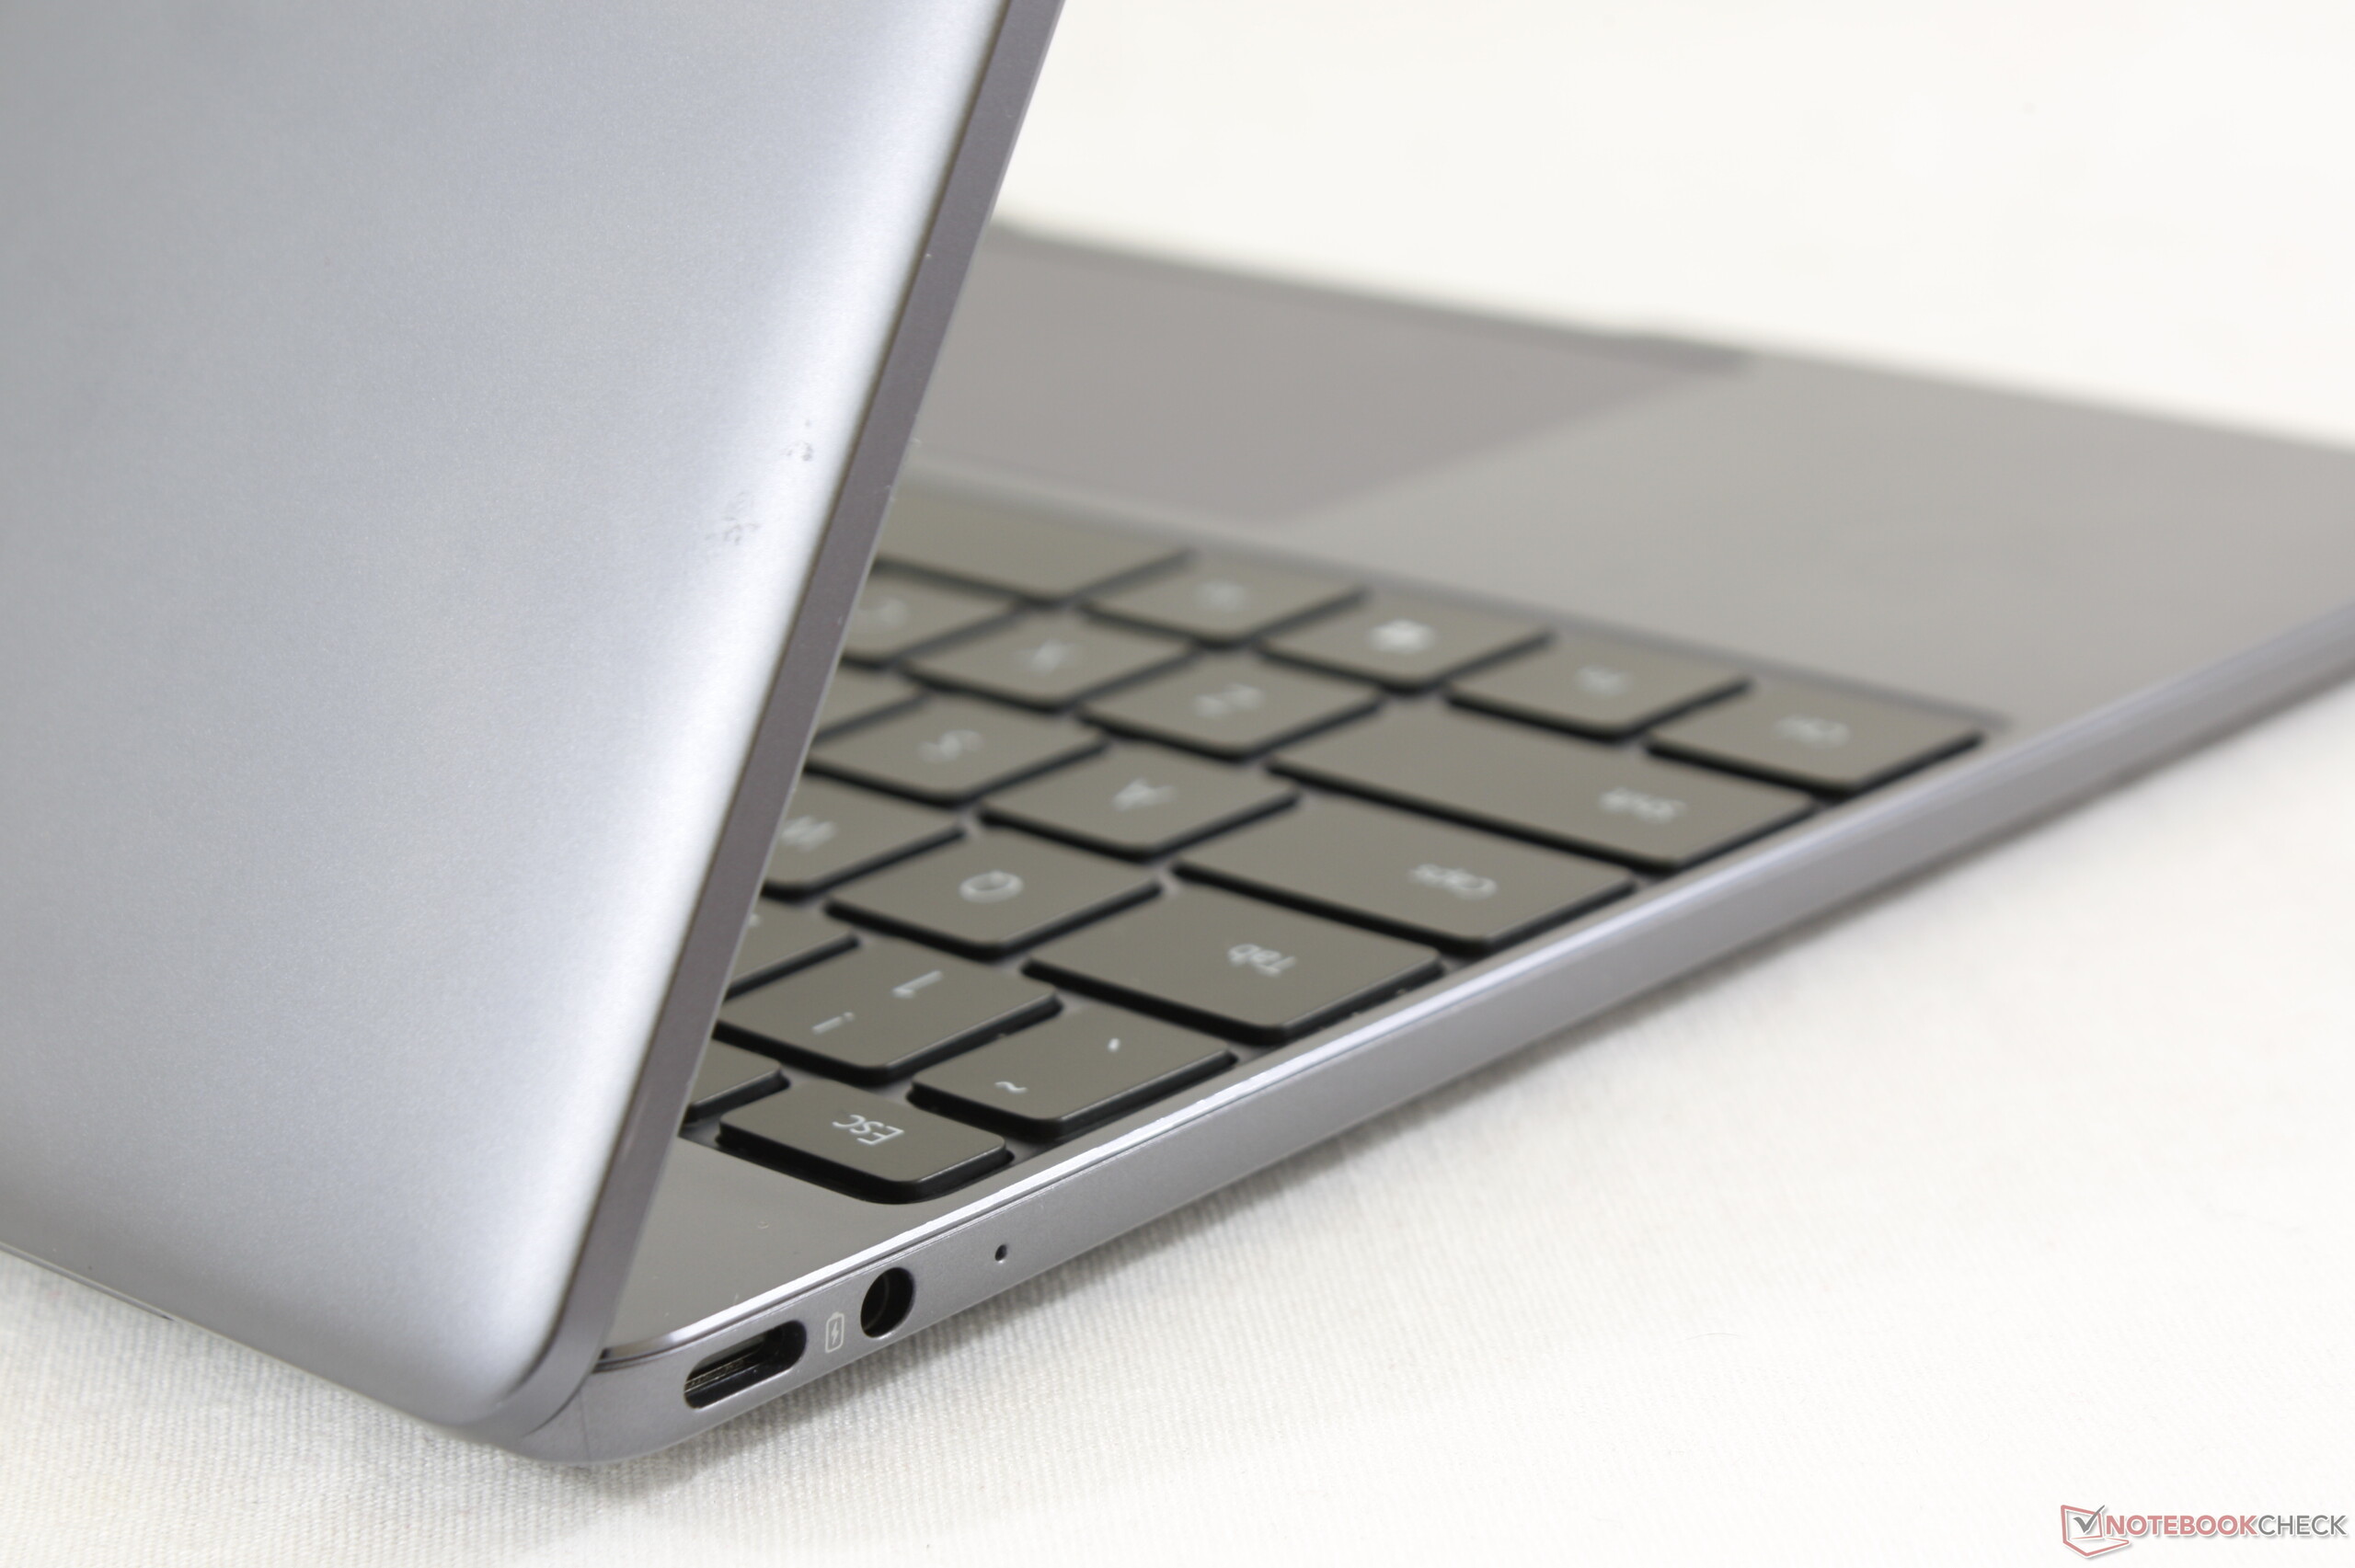
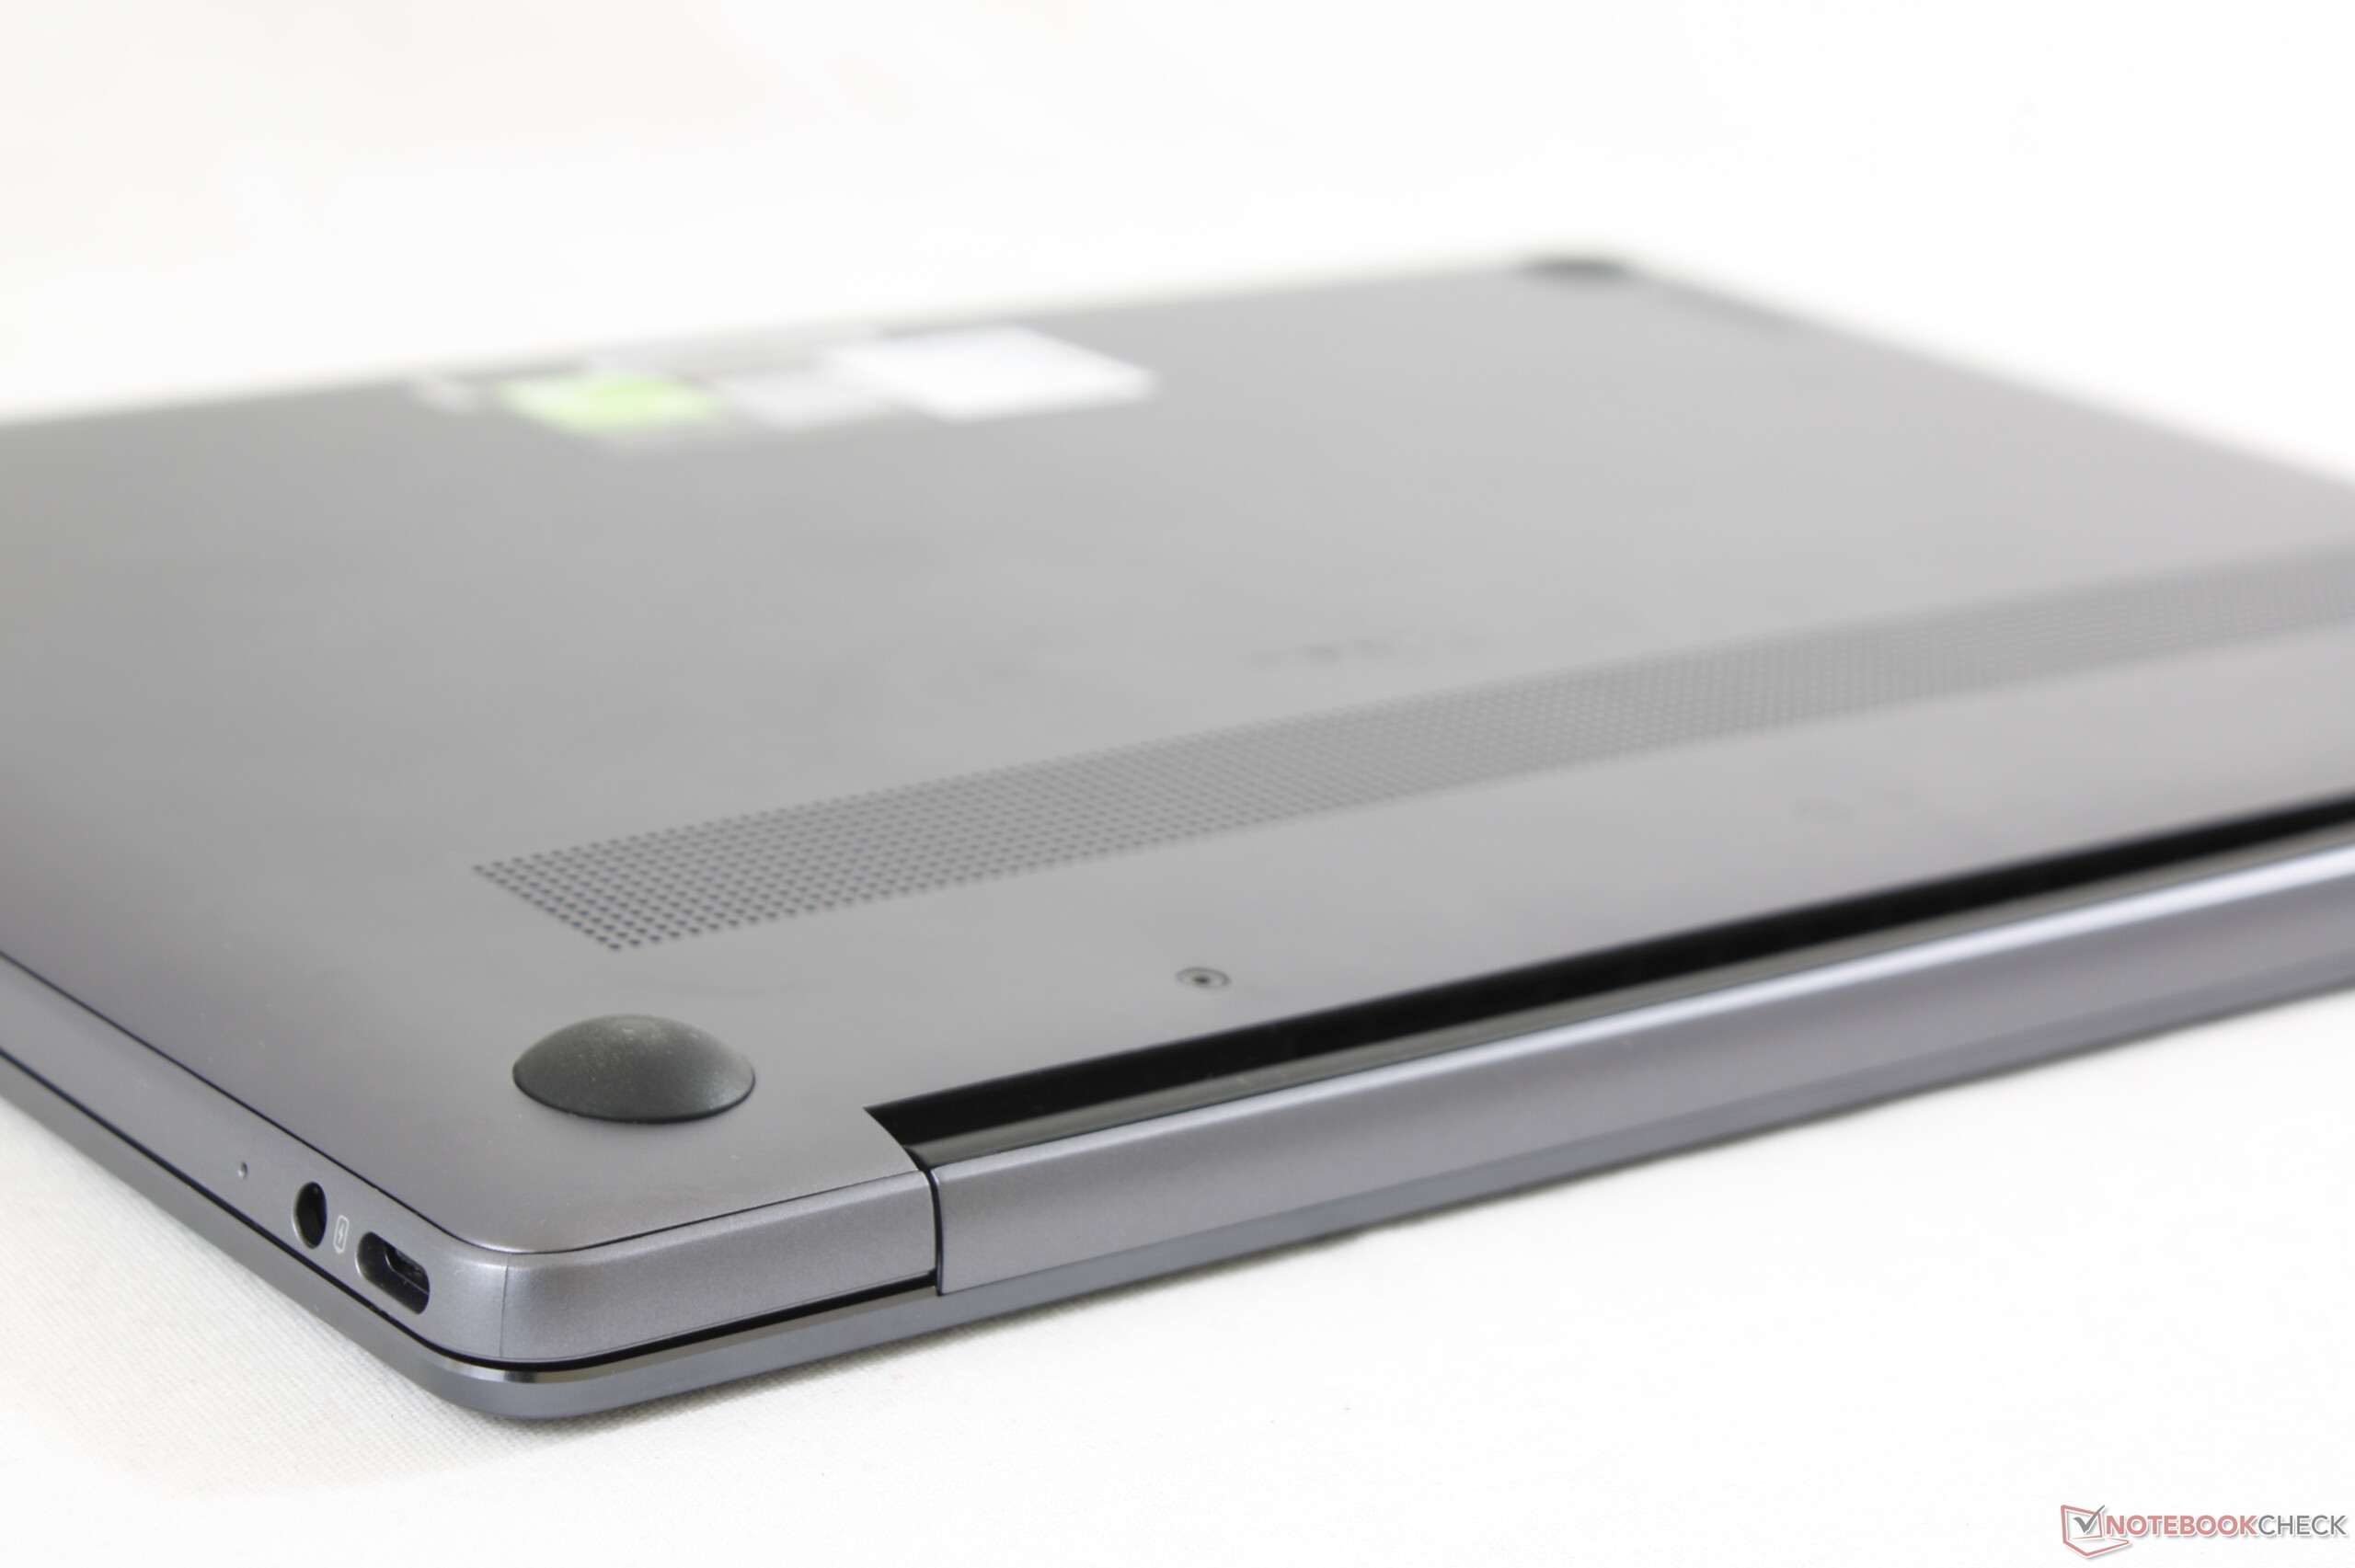
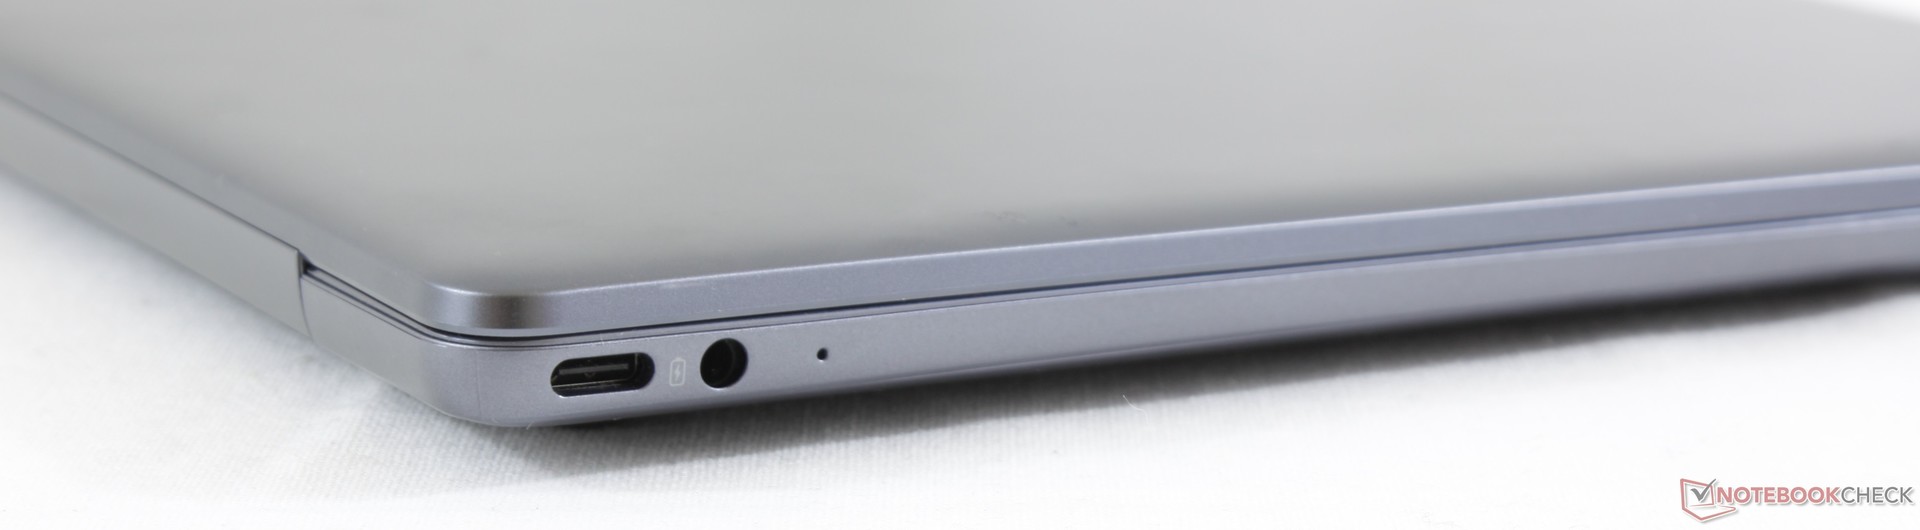
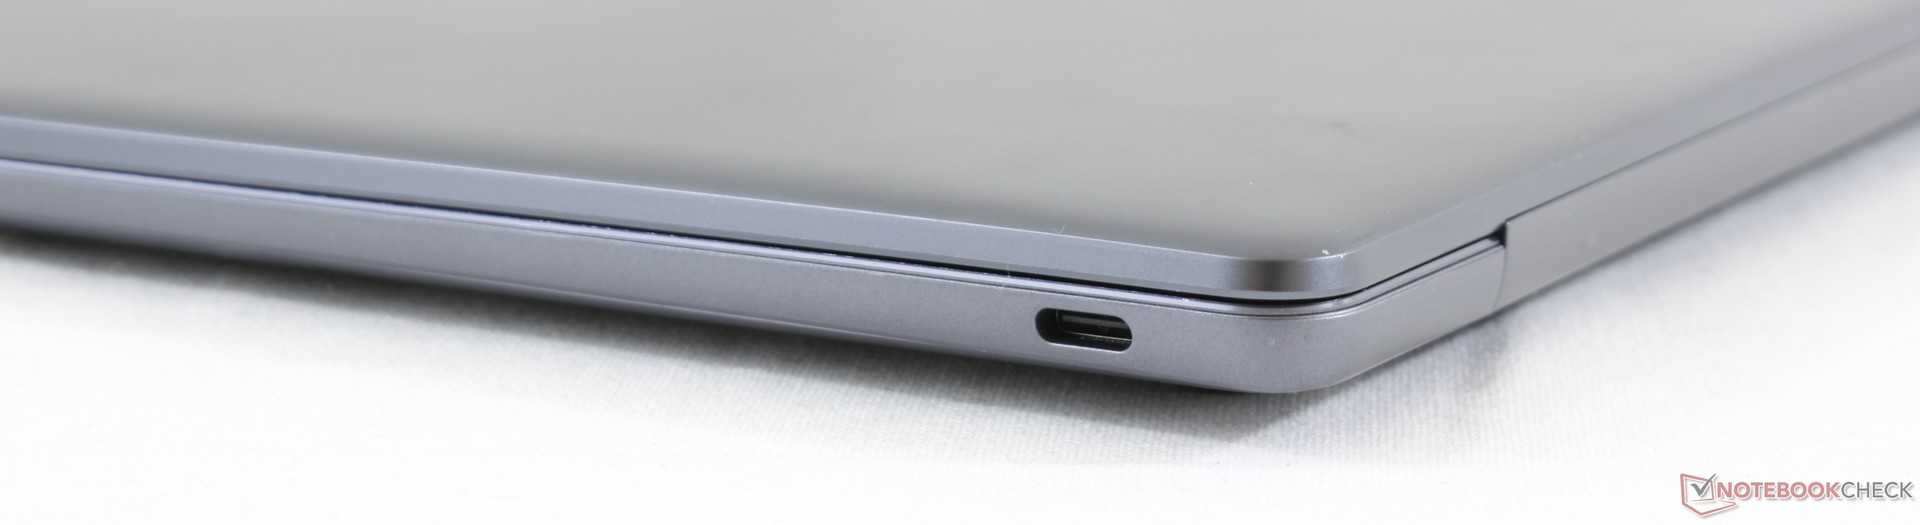
O Huawei MateBook 13 sem uma GPU dedicada oferece um bom desempenho do sistema, mas mantém sua seleção ruim de portas.
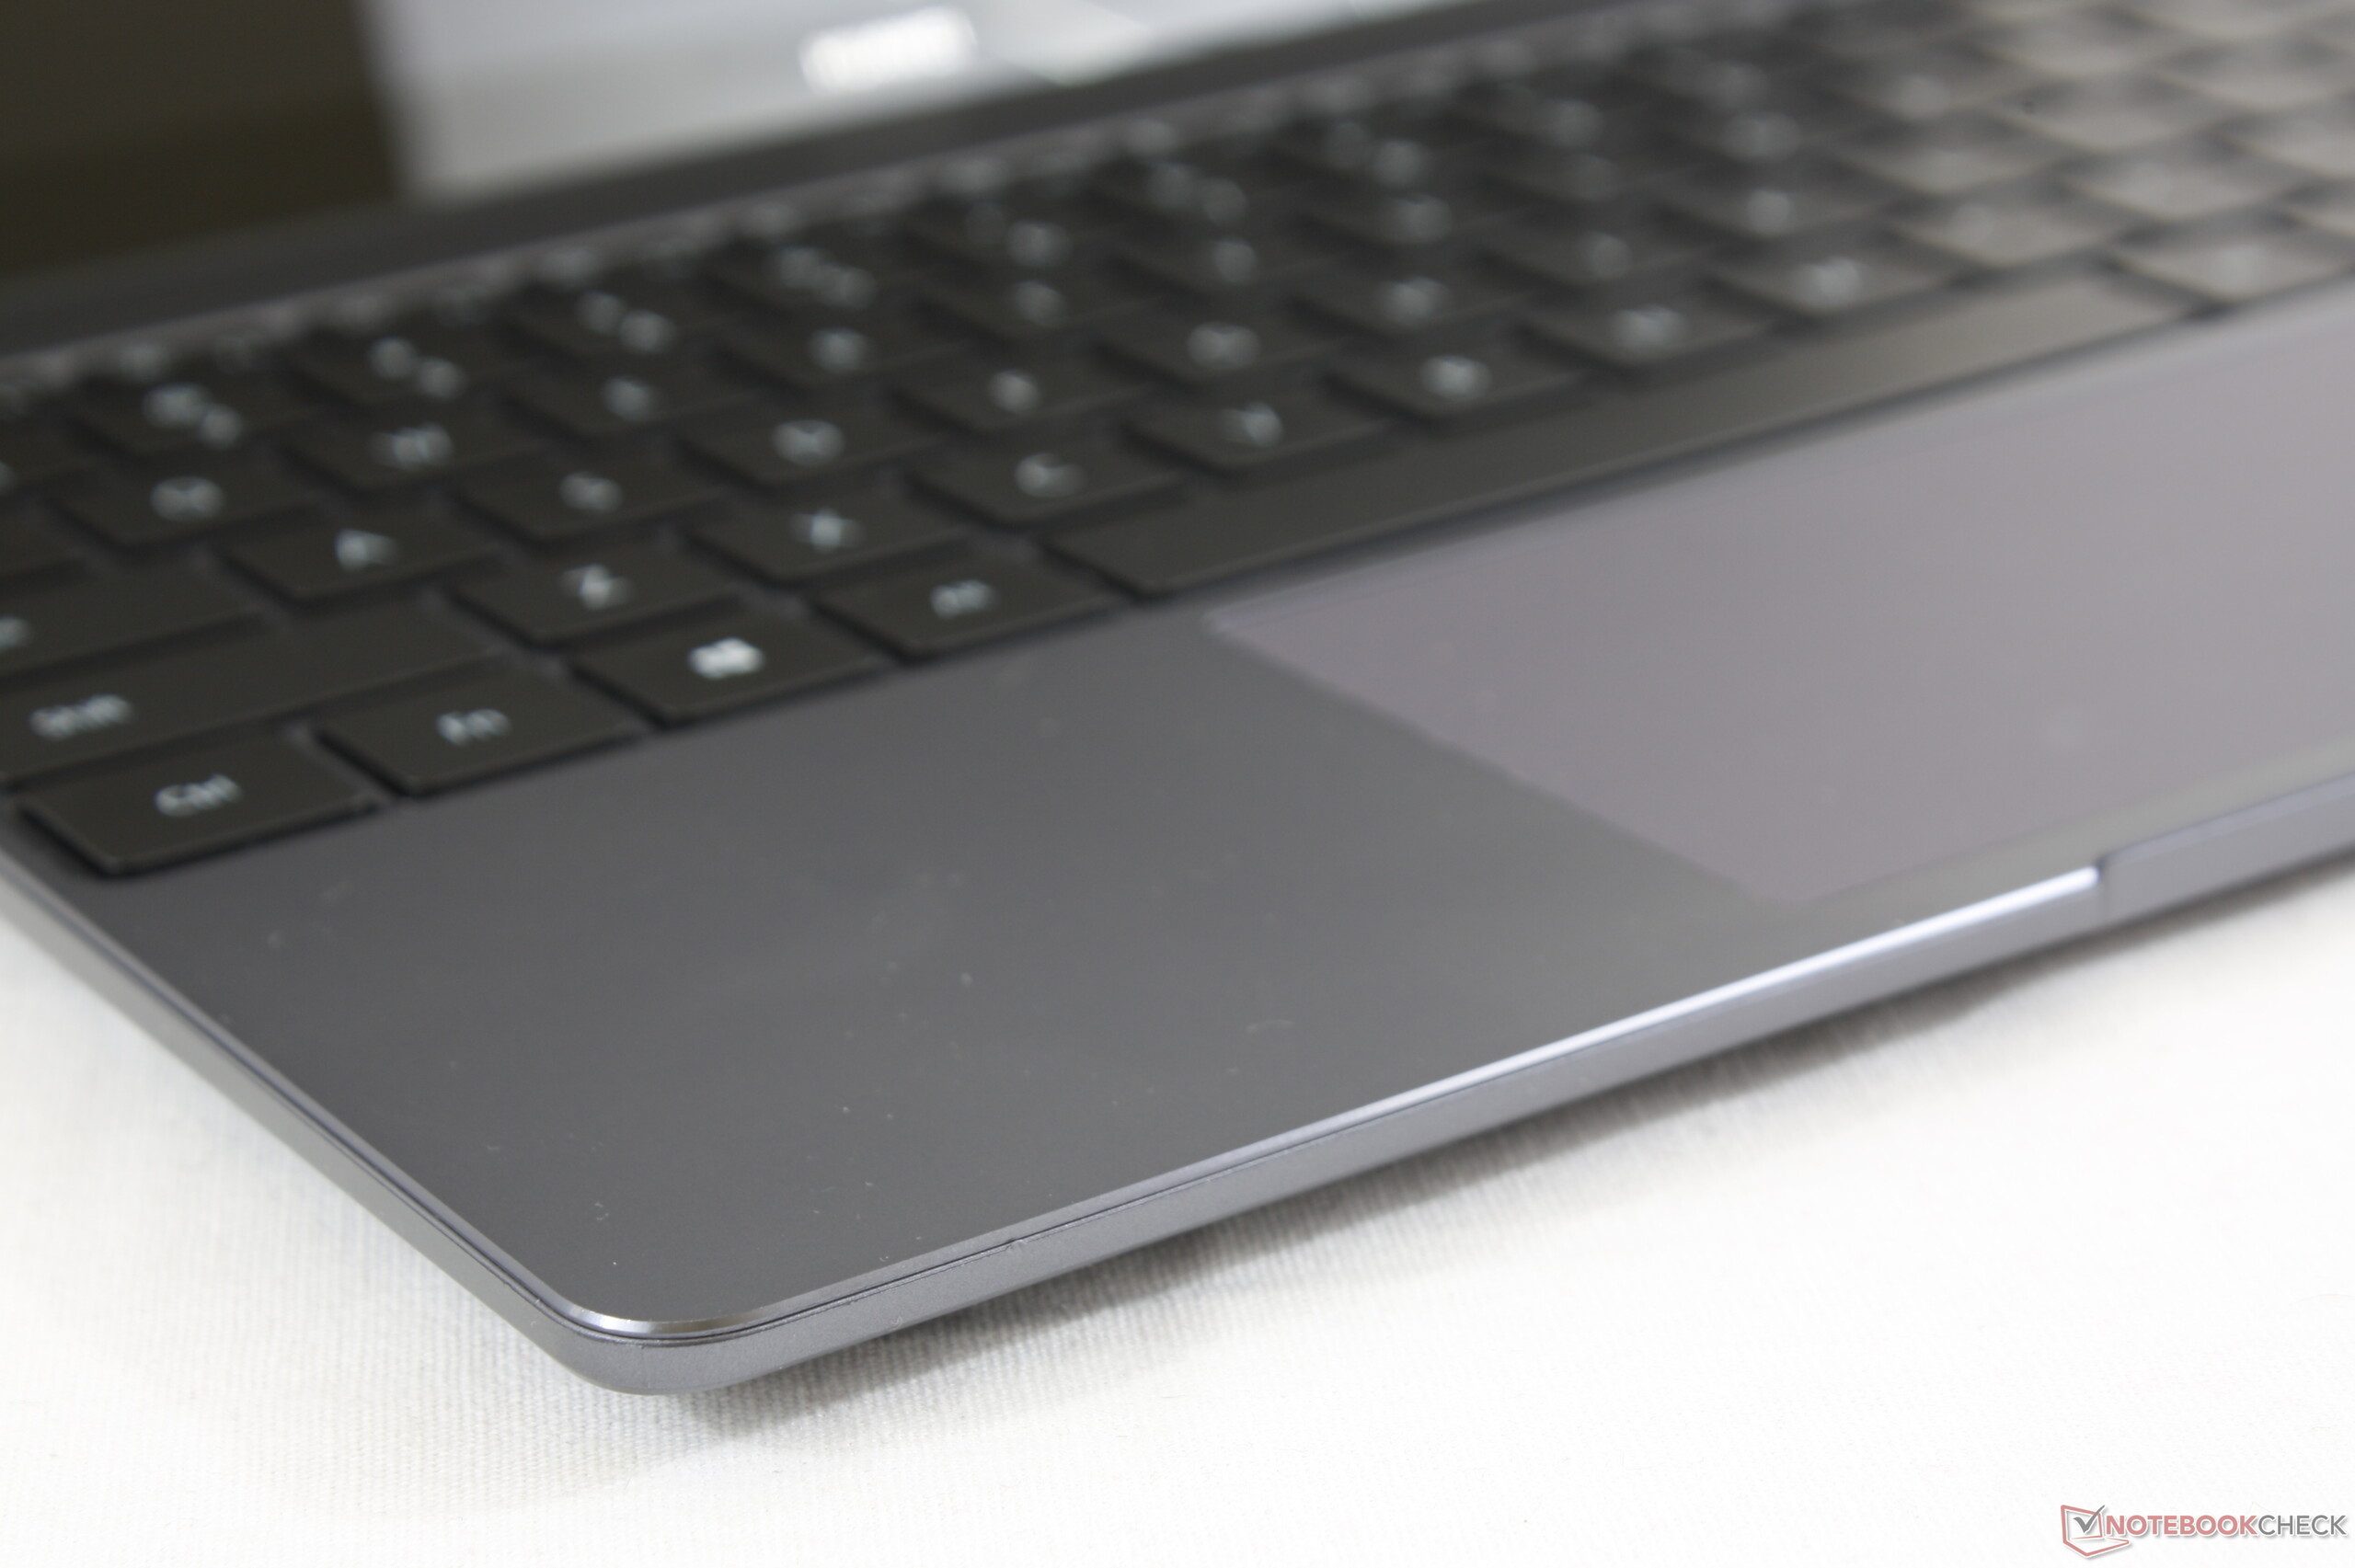
Ambas as versões do Huawei MateBook 13 oferecem uma seleção muito limitada de portas. O MateDock 2 alivia este problema, mas sem a estação docking, os usuários só terão acesso a uma porta USB Type-C e ao fone de ouvido quando o portátil estiver conectado. O teclado grande e o ótimo Touchpad facilitam o uso do MateBook 13. Aqueles que querem um formato 3: 2 e ficarão satisfeitos com 7 horas de duração da bateria ficarão bastante felizes com o Huawei MateBook 13.
Huawei Matebook 13-53010FYW
- 11/13/2019 v7 (old)
Mike Wobker