Breve Análise do Conversível HP EliteBook x360 1030 G3 (i5-8250U, FHD)

| Networking | |
| iperf3 transmit AX12 | |
| Huawei Matebook X Pro i5 | |
| HP EliteBook x360 1030 G3 | |
| Dell XPS 13-9365 2-in-1 | |
| HP EliteBook x360 1030 G2 | |
| iperf3 receive AX12 | |
| Huawei Matebook X Pro i5 | |
| HP EliteBook x360 1030 G3 | |
| HP EliteBook x360 1030 G2 | |
| Dell XPS 13-9365 2-in-1 | |
| |||||||||||||||||||||||||
iluminação: 88 %
iluminação com acumulador: 470.1 cd/m²
Contraste: 1237:1 (Preto: 0.38 cd/m²)
ΔE ColorChecker Calman: 2.47 | ∀{0.5-29.43 Ø4.71}
calibrated: 1.52
ΔE Greyscale Calman: 3.7 | ∀{0.09-98 Ø4.96}
98.2% sRGB (Argyll 1.6.3 3D)
62% AdobeRGB 1998 (Argyll 1.6.3 3D)
67.8% AdobeRGB 1998 (Argyll 3D)
97.8% sRGB (Argyll 3D)
66.1% Display P3 (Argyll 3D)
Gamma: 2.35
CCT: 7373 K
| HP EliteBook x360 1030 G3 Chi Mei CMN1380, IPS, 13.3", 1920x1080 | Lenovo Yoga 730-13IKB B133ZAN02.3, IPS LED, 13.3", 3840x2160 | Apple MacBook Pro 13 2018 Touchbar i5 APPA03E, IPS, 13.3", 2560x1600 | Fujitsu Lifebook U938 Sharp LQ133M1JW28, IPS, 13.3", 1920x1080 | Dell XPS 13-9365 2-in-1 IPS, 13.3", 1920x1080 | HP EliteBook x360 1030 G2 CMN1374, IPS, 13.3", 1920x1080 | |
|---|---|---|---|---|---|---|
| Display | 1% | 27% | 0% | -28% | -5% | |
| Display P3 Coverage (%) | 66.1 | 66.8 1% | 98.5 49% | 67.5 2% | 47.32 -28% | 65.5 -1% |
| sRGB Coverage (%) | 97.8 | 97.7 0% | 99.9 2% | 94.5 -3% | 71.1 -27% | 88.8 -9% |
| AdobeRGB 1998 Coverage (%) | 67.8 | 68.3 1% | 87.3 29% | 68.7 1% | 48.83 -28% | 64.9 -4% |
| Response Times | -30% | -21% | -12% | -25% | -24% | |
| Response Time Grey 50% / Grey 80% * (ms) | 39.2 ? | 54 ? -38% | 46 ? -17% | 43 ? -10% | 48 ? -22% | 55.2 ? -41% |
| Response Time Black / White * (ms) | 25.6 ? | 31.2 ? -22% | 32 ? -25% | 29 ? -13% | 32.8 ? -28% | 27.2 ? -6% |
| PWM Frequency (Hz) | 26040 ? | 118000 ? | 217 ? | 1042 ? | ||
| Screen | -14% | 23% | -5% | -45% | -33% | |
| Brightness middle (cd/m²) | 470.1 | 310 -34% | 519 10% | 344 -27% | 322.6 -31% | 262 -44% |
| Brightness (cd/m²) | 443 | 299 -33% | 504 14% | 320 -28% | 306 -31% | 256 -42% |
| Brightness Distribution (%) | 88 | 93 6% | 95 8% | 77 -12% | 91 3% | 83 -6% |
| Black Level * (cd/m²) | 0.38 | 0.2 47% | 0.33 13% | 0.31 18% | 0.19 50% | 0.25 34% |
| Contrast (:1) | 1237 | 1550 25% | 1573 27% | 1110 -10% | 1698 37% | 1048 -15% |
| Colorchecker dE 2000 * | 2.47 | 4.2 -70% | 1.4 43% | 2.72 -10% | 7.7 -212% | 5.13 -108% |
| Colorchecker dE 2000 max. * | 5.73 | 8 -40% | 2.8 51% | 5.92 -3% | 11.1 -94% | 9.46 -65% |
| Colorchecker dE 2000 calibrated * | 1.52 | 1.4 8% | ||||
| Greyscale dE 2000 * | 3.7 | 6.2 -68% | 2.2 41% | 2.74 26% | 7.9 -114% | 6.23 -68% |
| Gamma | 2.35 94% | 2.1 105% | 2.22 99% | 2.38 92% | 2.88 76% | 2.45 90% |
| CCT | 7373 88% | 6983 93% | 6908 94% | 6794 96% | 7044 92% | 6413 101% |
| Color Space (Percent of AdobeRGB 1998) (%) | 62 | 62.8 1% | 77.3 25% | 61 -2% | 44.1 -29% | 57.84 -7% |
| Color Space (Percent of sRGB) (%) | 98.2 | 97.6 -1% | 99.99 2% | 94 -4% | 69.9 -29% | 88.57 -10% |
| Média Total (Programa/Configurações) | -14% /
-14% | 10% /
18% | -6% /
-5% | -33% /
-39% | -21% /
-26% |
* ... menor é melhor
Exibir tempos de resposta
| ↔ Tempo de resposta preto para branco | ||
|---|---|---|
| 25.6 ms ... ascensão ↗ e queda ↘ combinadas | ↗ 14 ms ascensão | 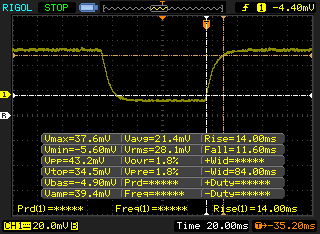 |
| ↘ 11.6 ms queda | ||
| A tela mostra taxas de resposta relativamente lentas em nossos testes e pode ser muito lenta para os jogadores. Em comparação, todos os dispositivos testados variam de 0.1 (mínimo) a 240 (máximo) ms. » 61 % de todos os dispositivos são melhores. Isso significa que o tempo de resposta medido é pior que a média de todos os dispositivos testados (19.8 ms). | ||
| ↔ Tempo de resposta 50% cinza a 80% cinza | ||
| 39.2 ms ... ascensão ↗ e queda ↘ combinadas | ↗ 20.4 ms ascensão | 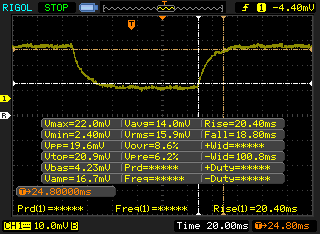 |
| ↘ 18.8 ms queda | ||
| A tela mostra taxas de resposta lentas em nossos testes e será insatisfatória para os jogadores. Em comparação, todos os dispositivos testados variam de 0.165 (mínimo) a 636 (máximo) ms. » 60 % de todos os dispositivos são melhores. Isso significa que o tempo de resposta medido é pior que a média de todos os dispositivos testados (31 ms). | ||
Cintilação da tela / PWM (modulação por largura de pulso)
| Tela tremeluzindo/PWM detectado | 26040 Hz | ≤ 62 % configuração de brilho | 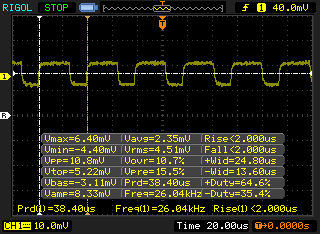 |
A luz de fundo da tela pisca em 26040 Hz (pior caso, por exemplo, utilizando PWM) Cintilação detectada em uma configuração de brilho de 62 % e abaixo. Não deve haver cintilação ou PWM acima desta configuração de brilho. A frequência de 26040 Hz é bastante alta, então a maioria dos usuários sensíveis ao PWM não deve notar nenhuma oscilação. [pwm_comparison] Em comparação: 52 % de todos os dispositivos testados não usam PWM para escurecer a tela. Se PWM foi detectado, uma média de 7754 (mínimo: 5 - máximo: 343500) Hz foi medida. | |||
| PCMark 10 - Score | |
| HP EliteBook x360 1030 G3 | |
| Média Intel Core i5-8250U, Intel UHD Graphics 620 (3358 - 4081, n=67) | |
| Apple MacBook Pro 13 2018 Touchbar i5 | |
| PCMark 8 Home Score Accelerated v2 | 3453 pontos | |
| PCMark 8 Work Score Accelerated v2 | 4336 pontos | |
| PCMark 10 Score | 3695 pontos | |
Ajuda | ||
| HP EliteBook x360 1030 G3 Samsung PM871b MZNLN128HAHQ | Fujitsu Lifebook U938 Micron 1100 MTFDDAV256TBN | Huawei Matebook X Pro i5 Samsung PM961 MZVLW256HEHP | Dell XPS 13-9365 2-in-1 Toshiba NVMe THNSN5256GPUK | HP EliteBook x360 1030 G2 Sandisk SD8TN8U-256G-1006 | Lenovo ThinkPad 25 Samsung SM961 MZVKW512HMJP m.2 PCI-e | |
|---|---|---|---|---|---|---|
| AS SSD | 28% | 189% | 125% | -11% | 224% | |
| Copy Game MB/s (MB/s) | 164.5 | 275.8 68% | 486.3 196% | 726 341% | 178.5 9% | 598 264% |
| Copy Program MB/s (MB/s) | 74.3 | 163.9 121% | 312.3 320% | 263.8 255% | 110.6 49% | 400.6 439% |
| Copy ISO MB/s (MB/s) | 208.1 | 442.4 113% | 739 255% | 950 357% | 255.9 23% | 1272 511% |
| Score Total (Points) | 781 | 885 13% | 2575 230% | 1495 91% | 736 -6% | 2811 260% |
| Score Write (Points) | 268 | 419 56% | 620 131% | 375 40% | 194 -28% | 837 212% |
| Score Read (Points) | 335 | 306 -9% | 1329 297% | 752 124% | 362 8% | 1317 293% |
| Access Time Write * (ms) | 0.048 | 0.057 -19% | 0.036 25% | 0.037 23% | 0.075 -56% | 0.031 35% |
| Access Time Read * (ms) | 0.093 | 0.099 -6% | 0.058 38% | 0.045 52% | 0.143 -54% | 0.04 57% |
| 4K-64 Write (MB/s) | 156.5 | 308.8 97% | 399.6 155% | 204.7 31% | 120.9 -23% | 640 309% |
| 4K-64 Read (MB/s) | 255.1 | 235.7 -8% | 1039 307% | 586 130% | 286.2 12% | 1130 343% |
| 4K Write (MB/s) | 70.8 | 73.8 4% | 103.1 46% | 96.9 37% | 52.6 -26% | 113 60% |
| 4K Read (MB/s) | 31.07 | 24.41 -21% | 48.33 56% | 37.69 21% | 27.37 -12% | 50.4 62% |
| Seq Write (MB/s) | 403.2 | 364.5 -10% | 1170 190% | 735 82% | 201.9 -50% | 840 108% |
| Seq Read (MB/s) | 488.2 | 455.5 -7% | 2416 395% | 1283 163% | 486.9 0% | 1369 180% |
* ... menor é melhor

| 3DMark 11 Performance | 1902 pontos | |
| 3DMark Cloud Gate Standard Score | 8008 pontos | |
Ajuda | ||
| baixo | média | alto | ultra | |
|---|---|---|---|---|
| BioShock Infinite (2013) | 68.6 | 34.9 | 29.5 | 9.4 |
| The Witcher 3 (2015) | 17.2 | 10.7 | 6.5 | |
| Rise of the Tomb Raider (2016) | 20.7 | 13.2 | 6.6 |
Barulho
| Ocioso |
| 28.5 / 28.5 / 28.5 dB |
| HDD |
| 29.5 dB |
| Carga |
| 31.3 / 33.5 dB |
 | ||
30 dB silencioso 40 dB(A) audível 50 dB(A) ruidosamente alto |
||
min: | ||
| HP EliteBook x360 1030 G3 UHD Graphics 620, i5-8250U, Samsung PM871b MZNLN128HAHQ | HP EliteBook x360 1030 G2 HD Graphics 620, i5-7300U, Sandisk SD8TN8U-256G-1006 | Lenovo ThinkPad 25 GeForce 940MX, i7-7500U, Samsung SM961 MZVKW512HMJP m.2 PCI-e | Lenovo Yoga 730-13IKB UHD Graphics 620, i5-8550U, SK Hynix PC401 512GB M.2 (HFS512GD9TNG) | HP Envy x360 15-bq102ng Vega 8, R5 2500U, Samsung PM961 MZVLW256HEHP | |
|---|---|---|---|---|---|
| Noise | -4% | -5% | -11% | -11% | |
| desligado / ambiente * (dB) | 28.5 | 29 -2% | 27.9 2% | 29.7 -4% | 30.13 -6% |
| Idle Minimum * (dB) | 28.5 | 29 -2% | 27.9 2% | 29.7 -4% | 30.13 -6% |
| Idle Average * (dB) | 28.5 | 29 -2% | 27.9 2% | 29.7 -4% | 30.13 -6% |
| Idle Maximum * (dB) | 28.5 | 29 -2% | 30 -5% | 30.7 -8% | 30.13 -6% |
| Load Average * (dB) | 31.3 | 33.6 -7% | 37.6 -20% | 39.3 -26% | 38.8 -24% |
| Load Maximum * (dB) | 33.5 | 35.8 -7% | 37.6 -12% | 39.3 -17% | 38.8 -16% |
| Witcher 3 ultra * (dB) | 37.6 |
* ... menor é melhor
(+) A temperatura máxima no lado superior é 38 °C / 100 F, em comparação com a média de 35.4 °C / 96 F , variando de 19.6 a 60 °C para a classe Convertible.
(-) A parte inferior aquece até um máximo de 45.4 °C / 114 F, em comparação com a média de 36.9 °C / 98 F
(+) Em uso inativo, a temperatura média para o lado superior é 24.7 °C / 76 F, em comparação com a média do dispositivo de 30.3 °C / ### class_avg_f### F.
(+) Os apoios para as mãos e o touchpad são mais frios que a temperatura da pele, com um máximo de 24.6 °C / 76.3 F e, portanto, são frios ao toque.
(+) A temperatura média da área do apoio para as mãos de dispositivos semelhantes foi 28 °C / 82.4 F (+3.4 °C / 6.1 F).
HP EliteBook x360 1030 G3 análise de áudio
(±) | o volume do alto-falante é médio, mas bom (###valor### dB)
Graves 100 - 315Hz
(±) | graves reduzidos - em média 9.6% menor que a mediana
(-) | graves não são lineares (15% delta para frequência anterior)
Médios 400 - 2.000 Hz
(+) | médios equilibrados - apenas 1.8% longe da mediana
(+) | médios são lineares (4.8% delta para frequência anterior)
Altos 2 - 16 kHz
(±) | máximos mais altos - em média 6% maior que a mediana
(±) | a linearidade dos máximos é média (11.7% delta para frequência anterior)
Geral 100 - 16.000 Hz
(+) | o som geral é linear (12.6% diferença em relação à mediana)
Comparado com a mesma classe
» 15% de todos os dispositivos testados nesta classe foram melhores, 2% semelhantes, 83% piores
» O melhor teve um delta de 6%, a média foi 20%, o pior foi 57%
Comparado com todos os dispositivos testados
» 11% de todos os dispositivos testados foram melhores, 3% semelhantes, 86% piores
» O melhor teve um delta de 4%, a média foi 23%, o pior foi 134%
Apple MacBook 12 (Early 2016) 1.1 GHz análise de áudio
(+) | os alto-falantes podem tocar relativamente alto (###valor### dB)
Graves 100 - 315Hz
(±) | graves reduzidos - em média 11.3% menor que a mediana
(±) | a linearidade dos graves é média (14.2% delta para a frequência anterior)
Médios 400 - 2.000 Hz
(+) | médios equilibrados - apenas 2.4% longe da mediana
(+) | médios são lineares (5.5% delta para frequência anterior)
Altos 2 - 16 kHz
(+) | agudos equilibrados - apenas 2% longe da mediana
(+) | os máximos são lineares (4.5% delta da frequência anterior)
Geral 100 - 16.000 Hz
(+) | o som geral é linear (10.2% diferença em relação à mediana)
Comparado com a mesma classe
» 7% de todos os dispositivos testados nesta classe foram melhores, 2% semelhantes, 90% piores
» O melhor teve um delta de 5%, a média foi 18%, o pior foi 53%
Comparado com todos os dispositivos testados
» 5% de todos os dispositivos testados foram melhores, 1% semelhantes, 94% piores
» O melhor teve um delta de 4%, a média foi 23%, o pior foi 134%
| desligado | |
| Ocioso | |
| Carga |
|
Key:
min: | |
| HP EliteBook x360 1030 G3 i5-8250U, UHD Graphics 620, Samsung PM871b MZNLN128HAHQ, IPS, 1920x1080, 13.3" | Fujitsu Lifebook U938 i5-8250U, UHD Graphics 620, Micron 1100 MTFDDAV256TBN, IPS, 1920x1080, 13.3" | Huawei Matebook X Pro i5 i5-8250U, GeForce MX150, Samsung PM961 MZVLW256HEHP, IPS, 3000x2000, 13.9" | Dell XPS 13-9365 2-in-1 i7-7Y75, HD Graphics 615, Toshiba NVMe THNSN5256GPUK, IPS, 1920x1080, 13.3" | HP EliteBook x360 1030 G2 i5-7300U, HD Graphics 620, Sandisk SD8TN8U-256G-1006, IPS, 1920x1080, 13.3" | Lenovo ThinkPad 25 i7-7500U, GeForce 940MX, Samsung SM961 MZVKW512HMJP m.2 PCI-e, IPS, 1920x1080, 14" | |
|---|---|---|---|---|---|---|
| Power Consumption | 19% | -36% | 32% | 9% | -34% | |
| Idle Minimum * (Watt) | 3.8 | 2.4 37% | 3.5 8% | 3.1 18% | 3.2 16% | 4.2 -11% |
| Idle Average * (Watt) | 7.5 | 5.5 27% | 8.9 -19% | 4.3 43% | 5.5 27% | 7.3 3% |
| Idle Maximum * (Watt) | 8.6 | 6 30% | 12.3 -43% | 4.9 43% | 6.5 24% | 7.7 10% |
| Load Average * (Watt) | 33.1 | 31 6% | 54.2 -64% | 24.3 27% | 29.7 10% | 55.4 -67% |
| Load Maximum * (Watt) | 31.8 | 32.6 -3% | 52.1 -64% | 22.8 28% | 41.3 -30% | 64.4 -103% |
| Witcher 3 ultra * (Watt) | 42.4 | 49.1 |
* ... menor é melhor
| HP EliteBook x360 1030 G3 i5-8250U, UHD Graphics 620, 56.2 Wh | Fujitsu Lifebook U938 i5-8250U, UHD Graphics 620, 50 Wh | Huawei Matebook X Pro i5 i5-8250U, GeForce MX150, 57.4 Wh | Dell XPS 13-9365 2-in-1 i7-7Y75, HD Graphics 615, 46 Wh | HP EliteBook x360 1030 G2 i5-7300U, HD Graphics 620, 57 Wh | Apple MacBook Pro 13 2018 Touchbar i5 i5-8259U, Iris Plus Graphics 655, 58 Wh | |
|---|---|---|---|---|---|---|
| Duração da bateria | -22% | -16% | -8% | 11% | -3% | |
| Reader / Idle (h) | 23 | 19.5 -15% | 20.7 -10% | 16.2 -30% | 23.1 0% | |
| WiFi v1.3 (h) | 10 | 8.4 -16% | 9.3 -7% | 11.4 14% | 10.5 5% | 9.7 -3% |
| Load (h) | 3.2 | 2.1 -34% | 2.2 -31% | 2.9 -9% | 4.1 28% | |
| Witcher 3 ultra (h) | 1.6 |
Pro
Contra
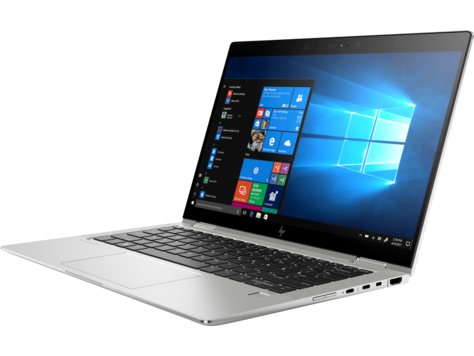
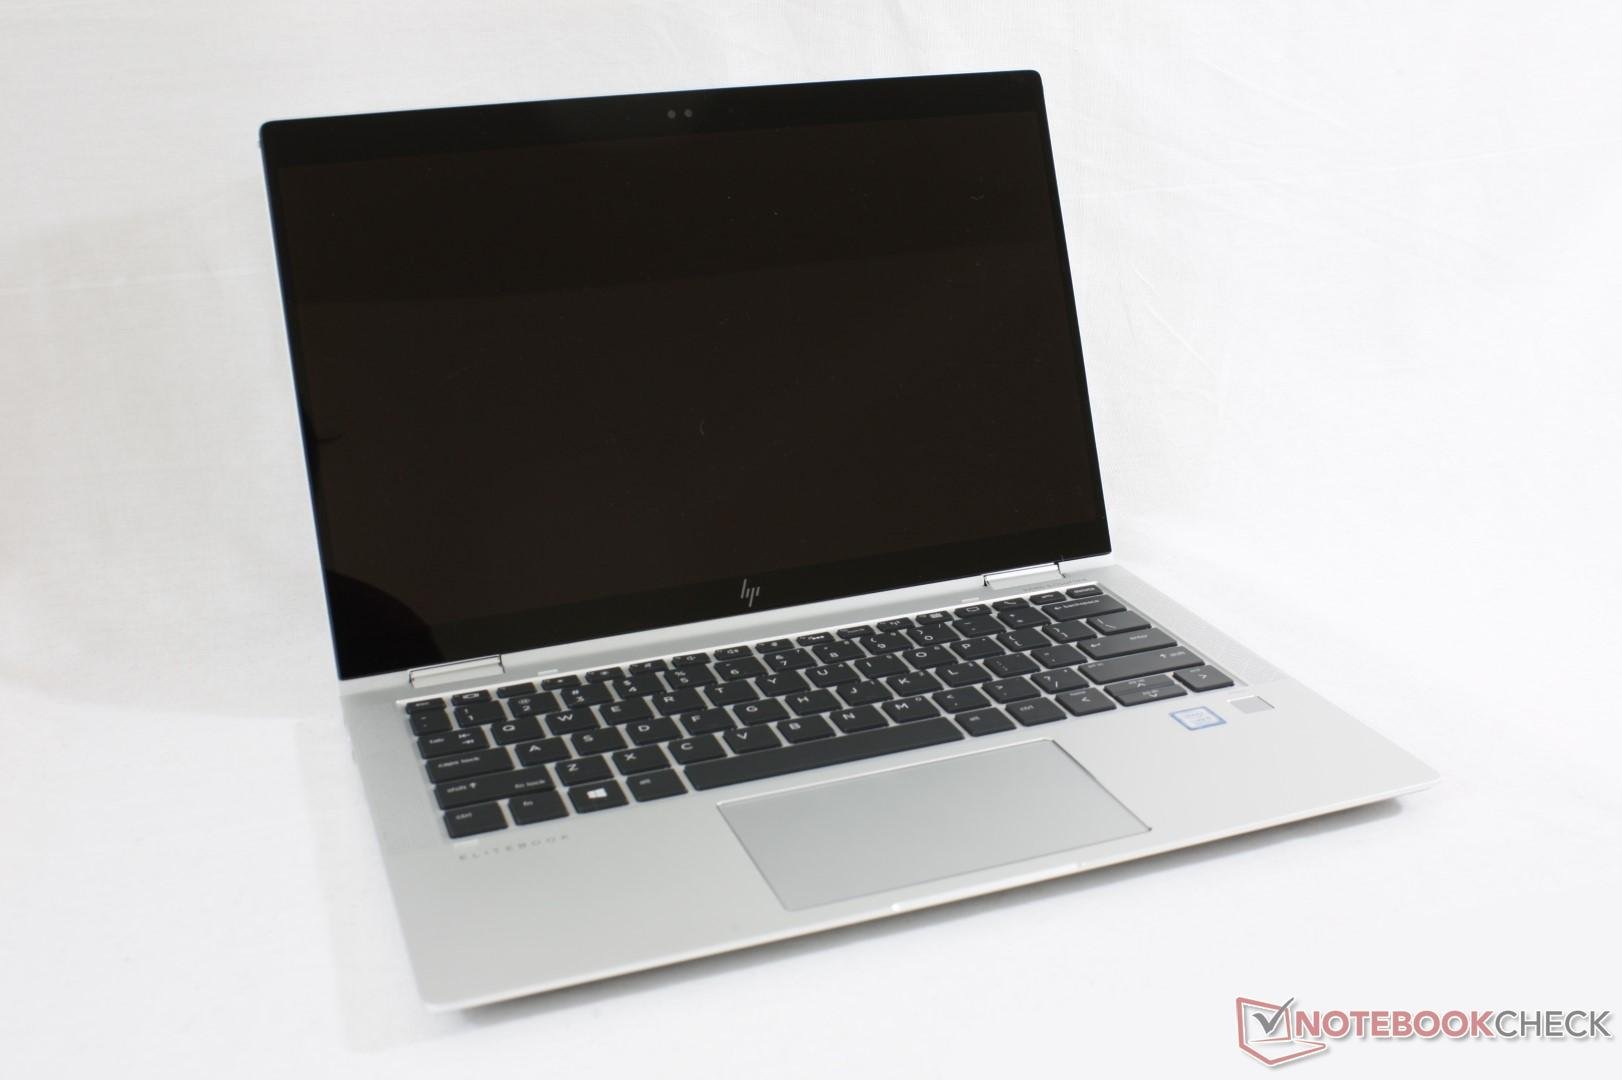
O EliteBook x360 1030 G3 aborda diretamente nossa maior reclamação sobre o 1030 G2: a tela escura. Nossa unidade 1030 G3 é cerca de 75% mais brilhante do que a 1030 G2 e isso nem inclui a opção de 700 nit. Combine isso com o formato menor e marcos mais estreitos e o melhor conversível corporativo de 13 polegadas fica ainda melhor em quase todos os sentidos.
"Quase" é a palavra-chave aqui, porque esta última revisão deixou de lado alguns recursos. Os leitores de MicroSD e Smart Card parecem ter ido embora de vez e é improvável que vejamos as teclas dedicadas do mouse ou do TrackPoint retornar tão cedo. A sustentabilidade do Turbo Boost da CPU poderia ser melhor e o desempenho gráfico é fraco. Caso contrário, todo o resto do 1030 G2 está intacto. É incrível como a HP colocou as opções 4G LTE, NFC, ótimos alto-falantes, Thunderbolt 3 e tela táctil 4K UHD em um conversível de 13 polegadas portátil e relativamente silencioso. É uma pena que o preço inicial de $1.900 USD seja um obstáculo tão alto para a maioria, porque não podemos recomendá-lo o suficiente tanto para os usuários de escritório quanto para os estudantes que estão indo de um lugar para outro.
É uma pena que a HP não ofereça mais opções de Ryzen já que o Vega 8 ou Vega 10 teria impulsionado o desempenho gráfico de forma significativa sobre o UHD Graphics 620 para tarefas de edição leve. Esperamos ver as opções AMD ou Intel Bean Canyon Iris Plus em modelos futuros para expandir ainda mais a versatilidade da série.
É quase o dobro do preço de um Ultrabook sem diferenças no desempenho da CPU ou RAM. Todos esses dólares extras pagam pela longa lista de recursos auxiliares, incluindo NFC, 4G LTE, Thunderbolt 3, quatro alto-falantes, design conversível, bateria de longa duração e uma tela táctil mais brilhante do que todos os outros Ultrabooks no mercado. Este é um sistema cheio de recursos de cima para baixo que não deve ser menosprezado.
HP EliteBook x360 1030 G3
- 10/17/2019 v7 (old)
Allen Ngo
Price comparison
