Breve Análise do Portátil Lenovo Legion Y520-15IKBN (7300HQ, GTX 1050 Ti, FHD)

| |||||||||||||||||||||||||
iluminação: 91 %
iluminação com acumulador: 281 cd/m²
Contraste: 726:1 (Preto: 0.39 cd/m²)
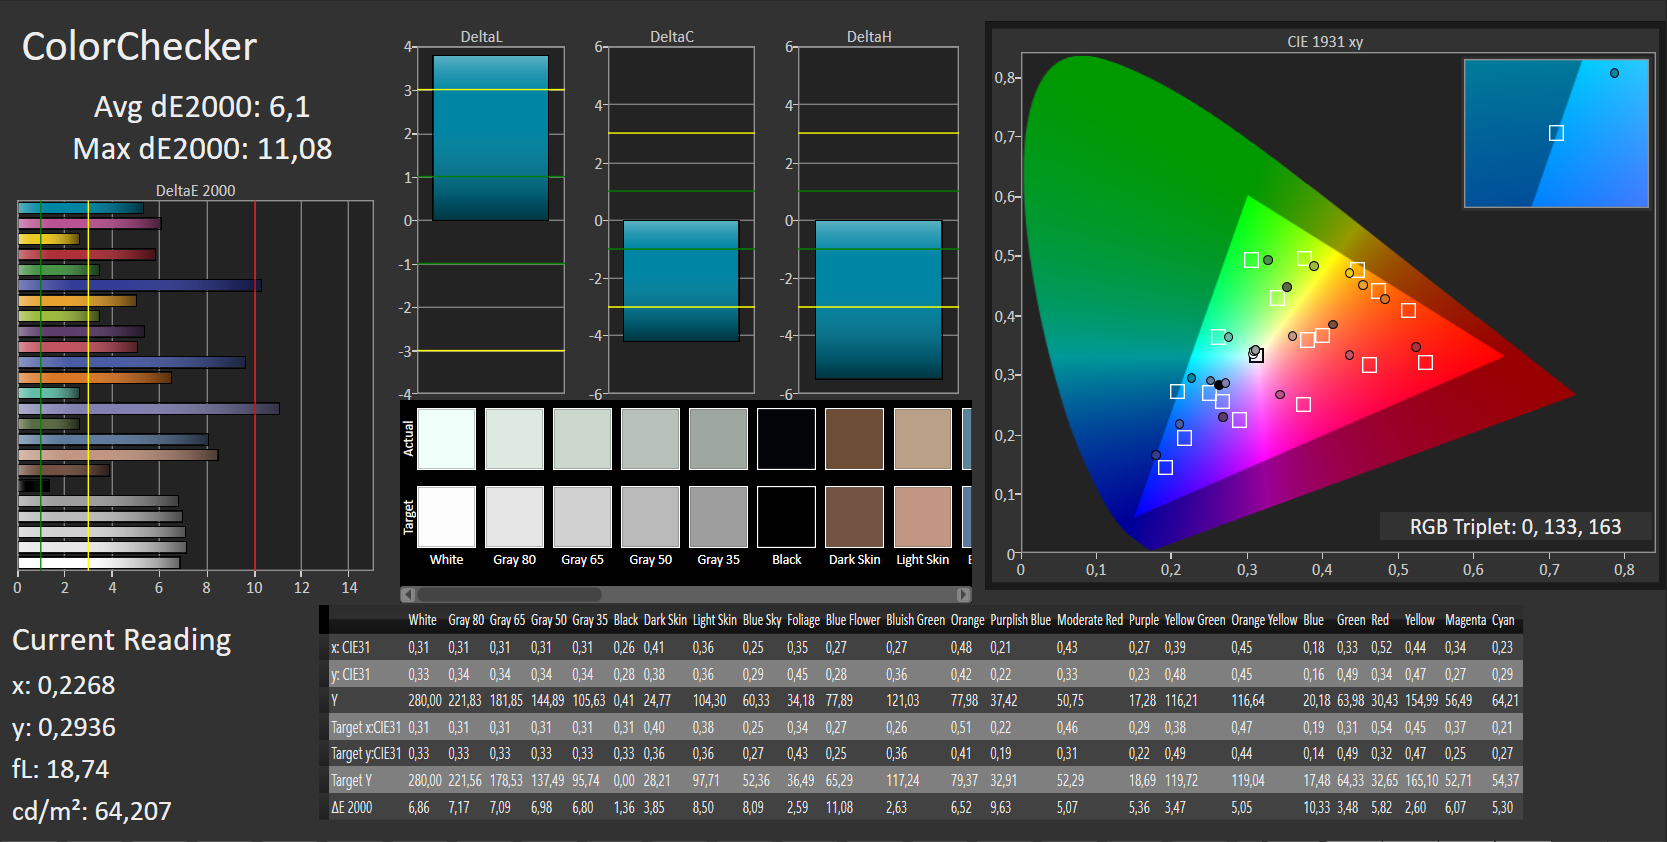
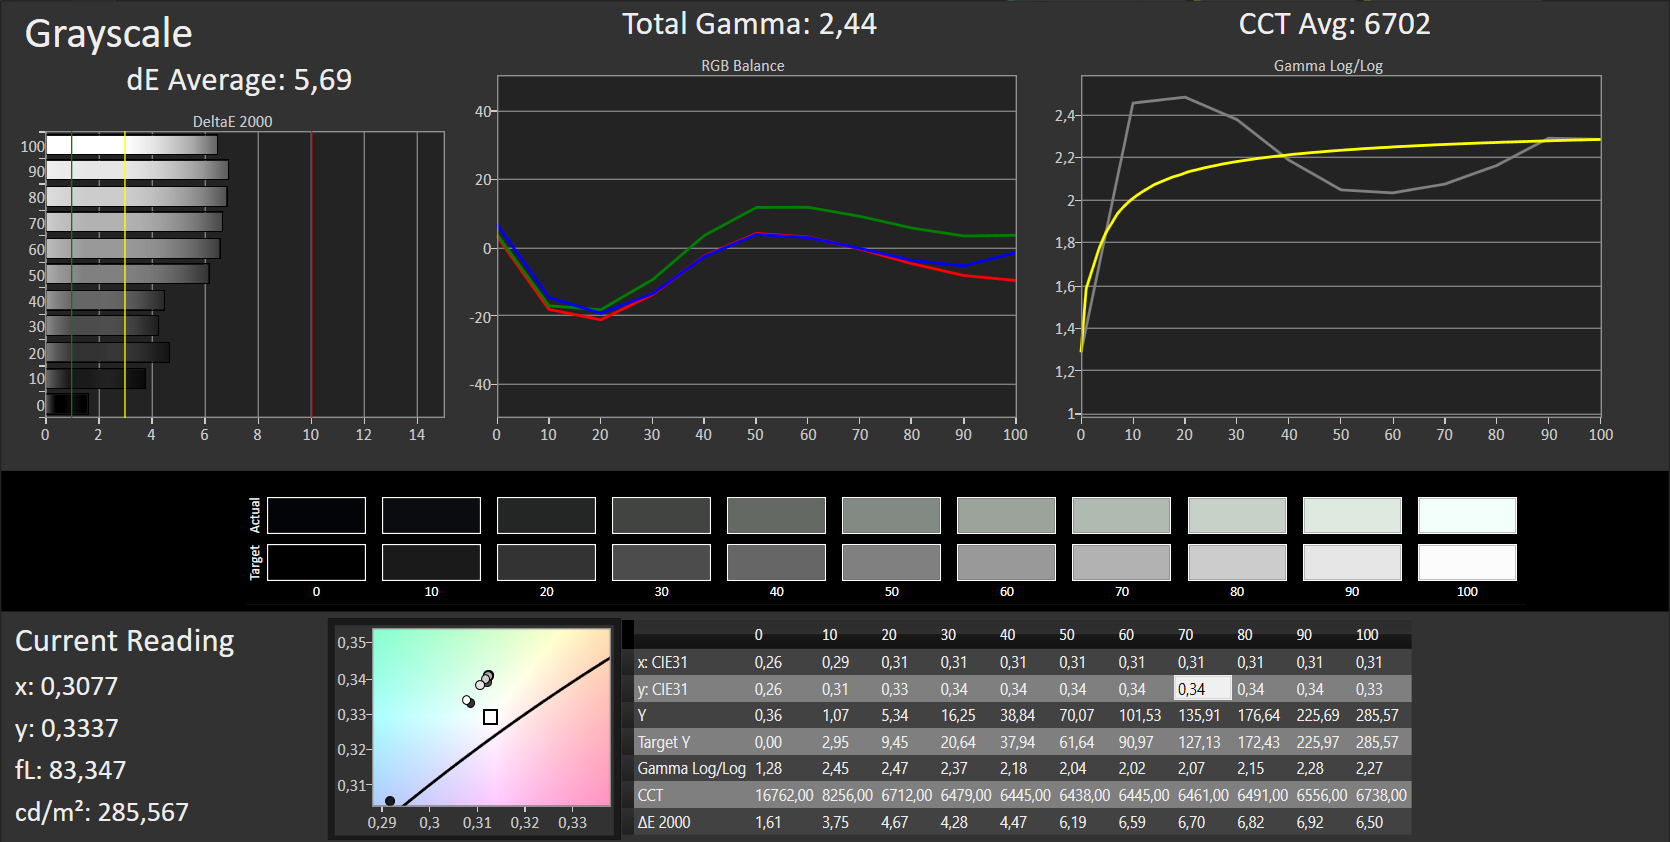
ΔE ColorChecker Calman: 6.1 | ∀{0.5-29.43 Ø4.71}
ΔE Greyscale Calman: 5.69 | ∀{0.09-98 Ø4.96}
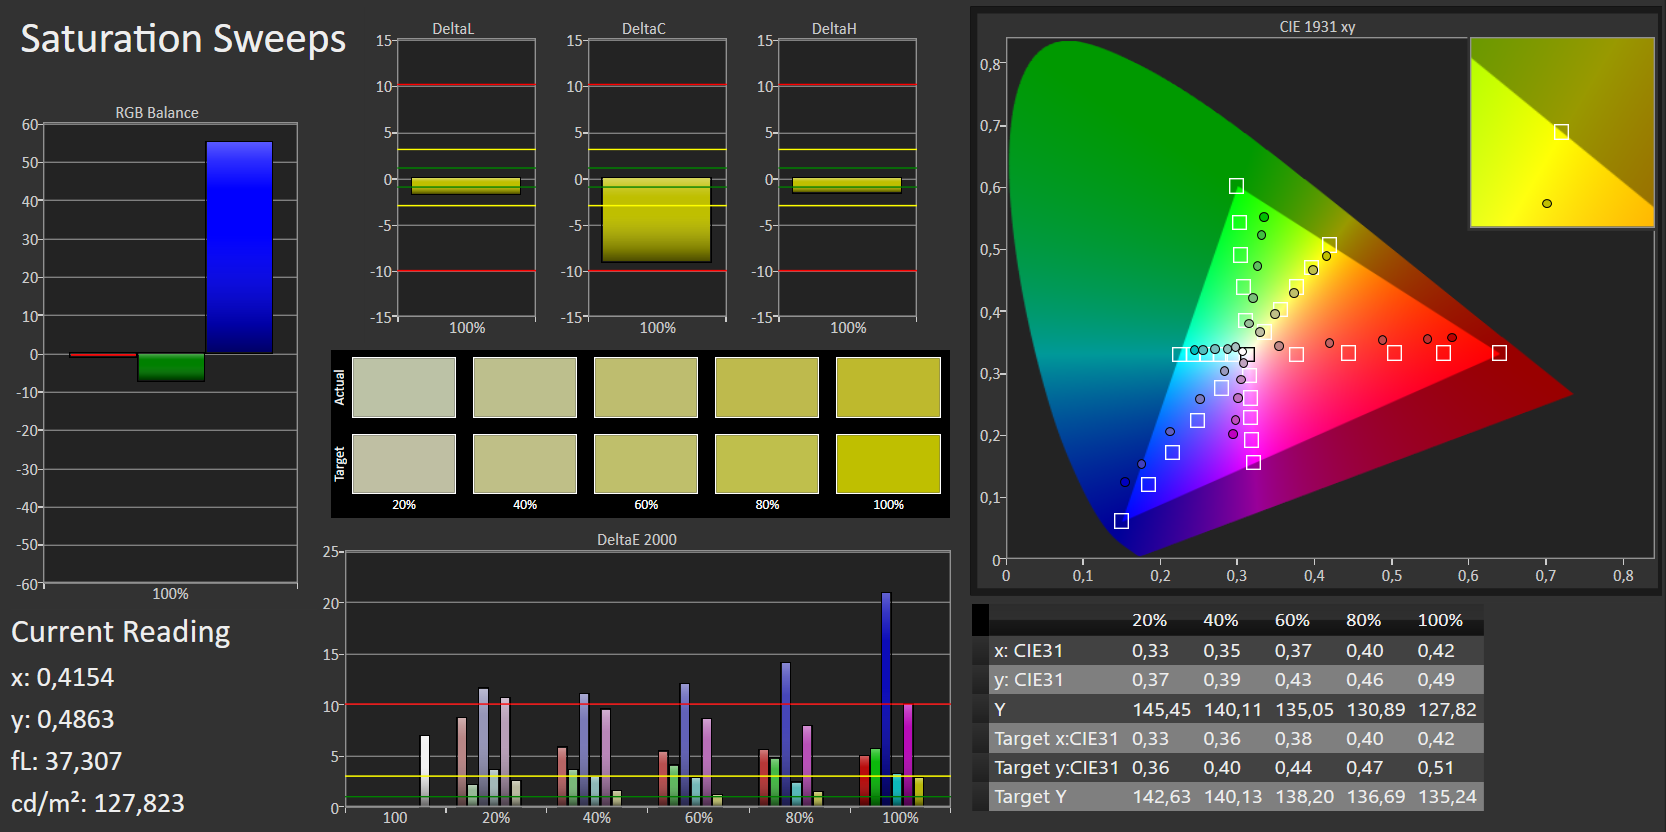
58% sRGB (Argyll 1.6.3 3D)
37% AdobeRGB 1998 (Argyll 1.6.3 3D)
40.34% AdobeRGB 1998 (Argyll 3D)
58.4% sRGB (Argyll 3D)
39.01% Display P3 (Argyll 3D)
Gamma: 2.44
CCT: 6702 K
| Lenovo Legion Y520-15IKBN 80WK0042GE IPS, 1920x1080, 15.6" | Lenovo Legion Y520-15IKBN-80WK001KUS IPS, 1920x1080, 15.6" | HP Omen 15-ax213ng IPS, 1920x1080, 15.6" | Acer Aspire VX5-591G-75C4 VX15 IPS, 1920x1080, 15.6" | Dell Inspiron 15 7000 7567 Gaming (Core i5-7300HQ, GTX 1050) TN, 1920x1080, 15.6" | Asus FX502VM-AS73 TN LED, 1920x1080, 15.6" | Acer Nitro 5 AN515-51-788E IPS, 1920x1080, 15.6" | |
|---|---|---|---|---|---|---|---|
| Display | -1% | 0% | -2% | -2% | 7% | ||
| Display P3 Coverage (%) | 39.01 | 38.59 -1% | 38.88 0% | 38.2 -2% | 38.28 -2% | 41.7 7% | |
| sRGB Coverage (%) | 58.4 | 58 -1% | 58.2 0% | 57.5 -2% | 56.9 -3% | 62.2 7% | |
| AdobeRGB 1998 Coverage (%) | 40.34 | 39.87 -1% | 40.2 0% | 39.47 -2% | 39.47 -2% | 43.17 7% | |
| Response Times | -38% | -3% | 33% | 6% | 25% | 17% | |
| Response Time Grey 50% / Grey 80% * (ms) | 39 ? | 58.8 ? -51% | 42 ? -8% | 22 ? 44% | 36.8 ? 6% | 28.4 ? 27% | 35 ? 10% |
| Response Time Black / White * (ms) | 29 ? | 36 ? -24% | 28 ? 3% | 23 ? 21% | 27.6 ? 5% | 22.4 ? 23% | 22 ? 24% |
| PWM Frequency (Hz) | 21000 ? | 21550 ? | |||||
| Screen | -17% | 17% | 8% | -50% | -18% | 11% | |
| Brightness middle (cd/m²) | 283 | 239 -16% | 230 -19% | 281 -1% | 242.2 -14% | 209.5 -26% | 276 -2% |
| Brightness (cd/m²) | 281 | 244 -13% | 228 -19% | 257 -9% | 235 -16% | 205 -27% | 265 -6% |
| Brightness Distribution (%) | 91 | 88 -3% | 88 -3% | 85 -7% | 88 -3% | 92 1% | 91 0% |
| Black Level * (cd/m²) | 0.39 | 0.35 10% | 0.21 46% | 0.32 18% | 0.69 -77% | 0.69 -77% | 0.25 36% |
| Contrast (:1) | 726 | 683 -6% | 1095 51% | 878 21% | 351 -52% | 304 -58% | 1104 52% |
| Colorchecker dE 2000 * | 6.1 | 7.3 -20% | 4.01 34% | 5.16 15% | 11.6 -90% | 4.7 23% | 5.06 17% |
| Colorchecker dE 2000 max. * | 11.08 | 24.7 -123% | 7.26 34% | 9.09 18% | 19.4 -75% | 19.7 -78% | 10.13 9% |
| Greyscale dE 2000 * | 5.69 | 4.9 14% | 3.18 44% | 4.57 20% | 15.7 -176% | 1.8 68% | 6.25 -10% |
| Gamma | 2.44 90% | 2.19 100% | 2.52 87% | 2.59 85% | 1.57 140% | 2.23 99% | 1.76 125% |
| CCT | 6702 97% | 7332 89% | 6814 95% | 6931 94% | 11662 56% | 6975 93% | 6873 95% |
| Color Space (Percent of AdobeRGB 1998) (%) | 37 | 35 -5% | 37 0% | 37 0% | 39.47 7% | 36.2 -2% | 40 8% |
| Color Space (Percent of sRGB) (%) | 58 | 55 -5% | 58 0% | 58 0% | 57.55 -1% | 56.6 -2% | 62 7% |
| Média Total (Programa/Configurações) | -28% /
-20% | 4% /
11% | 14% /
9% | -15% /
-33% | 2% /
-9% | 12% /
11% |
* ... menor é melhor
Cintilação da tela / PWM (modulação por largura de pulso)
| Tela tremeluzindo/PWM detectado | 21000 Hz | ≤ 90 % configuração de brilho | 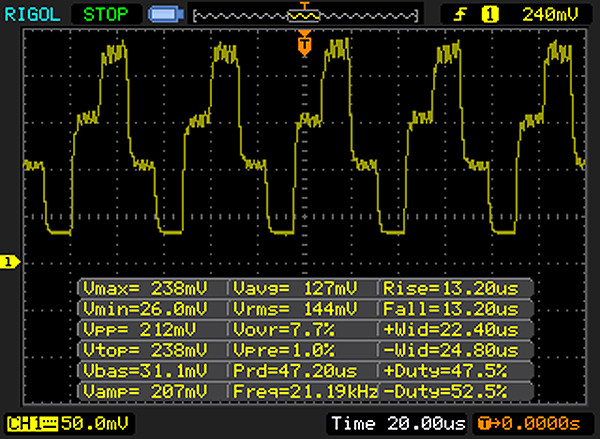 |
A luz de fundo da tela pisca em 21000 Hz (pior caso, por exemplo, utilizando PWM) Cintilação detectada em uma configuração de brilho de 90 % e abaixo. Não deve haver cintilação ou PWM acima desta configuração de brilho. A frequência de 21000 Hz é bastante alta, então a maioria dos usuários sensíveis ao PWM não deve notar nenhuma oscilação. [pwm_comparison] Em comparação: 52 % de todos os dispositivos testados não usam PWM para escurecer a tela. Se PWM foi detectado, uma média de 7757 (mínimo: 5 - máximo: 343500) Hz foi medida. | |||
Exibir tempos de resposta
| ↔ Tempo de resposta preto para branco | ||
|---|---|---|
| 29 ms ... ascensão ↗ e queda ↘ combinadas | ↗ 16 ms ascensão | 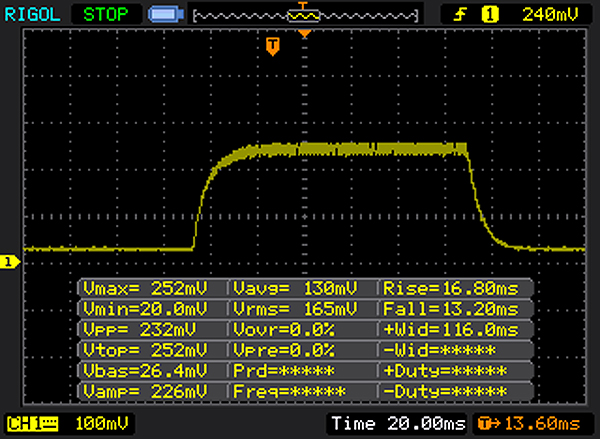 |
| ↘ 13 ms queda | ||
| A tela mostra taxas de resposta relativamente lentas em nossos testes e pode ser muito lenta para os jogadores. Em comparação, todos os dispositivos testados variam de 0.1 (mínimo) a 240 (máximo) ms. » 77 % de todos os dispositivos são melhores. Isso significa que o tempo de resposta medido é pior que a média de todos os dispositivos testados (19.8 ms). | ||
| ↔ Tempo de resposta 50% cinza a 80% cinza | ||
| 39 ms ... ascensão ↗ e queda ↘ combinadas | ↗ 21 ms ascensão | 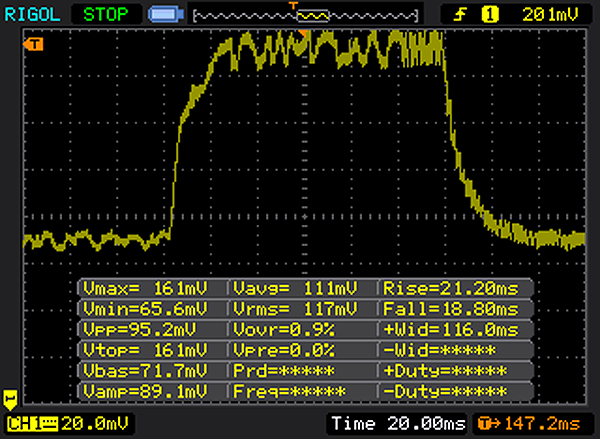 |
| ↘ 18 ms queda | ||
| A tela mostra taxas de resposta lentas em nossos testes e será insatisfatória para os jogadores. Em comparação, todos os dispositivos testados variam de 0.165 (mínimo) a 636 (máximo) ms. » 59 % de todos os dispositivos são melhores. Isso significa que o tempo de resposta medido é pior que a média de todos os dispositivos testados (31 ms). | ||
| Geekbench 3 | |
| 32 Bit Multi-Core Score | |
| Acer Nitro 5 AN515-51-788E | |
| Lenovo Legion Y520-15IKBN 80WK0042GE | |
| Acer Aspire VX15 VX5-591G-589S | |
| 32 Bit Single-Core Score | |
| Acer Nitro 5 AN515-51-788E | |
| Acer Aspire VX15 VX5-591G-589S | |
| Lenovo Legion Y520-15IKBN 80WK0042GE | |
| Geekbench 4.0 | |
| 64 Bit Multi-Core Score | |
| Acer Nitro 5 AN515-51-788E | |
| Lenovo Legion Y520-15IKBN 80WK0042GE | |
| Acer Aspire VX15 VX5-591G-589S | |
| 64 Bit Single-Core Score | |
| Acer Nitro 5 AN515-51-788E | |
| Lenovo Legion Y520-15IKBN 80WK0042GE | |
| Acer Aspire VX15 VX5-591G-589S | |
| Geekbench 4.4 | |
| 64 Bit Multi-Core Score | |
| Acer Nitro 5 AN515-51-788E | |
| Lenovo Legion Y520-15IKBN 80WK0042GE | |
| Acer Aspire VX15 VX5-591G-589S | |
| 64 Bit Single-Core Score | |
| Acer Nitro 5 AN515-51-788E | |
| Lenovo Legion Y520-15IKBN 80WK0042GE | |
| Acer Aspire VX15 VX5-591G-589S | |
| JetStream 1.1 - 1.1 Total | |
| Medion Erazer X6603 (Edge 38.14393.1066.0) | |
| HP Omen 15-ax213ng (Edge 40.15063.0.0) | |
| Lenovo Legion Y520-15IKBN-80WK001KUS | |
| Acer Nitro 5 AN515-51-788E (Edge 40) | |
| Acer Aspire VX15 VX5-591G-589S (Edge 38) | |
| Lenovo Legion Y520-15IKBN 80WK0042GE (Edge 40) | |
| Asus FX502VM-AS73 (Edge 38.14393.0.0) | |
| PCMark 7 Score | 5555 pontos | |
| PCMark 8 Home Score Accelerated v2 | 3651 pontos | |
| PCMark 8 Creative Score Accelerated v2 | 4608 pontos | |
| PCMark 8 Work Score Accelerated v2 | 4746 pontos | |
| PCMark 10 Score | 3995 pontos | |
Ajuda | ||

| Lenovo Legion Y520-15IKBN 80WK0042GE Samsung PM961 NVMe MZVLW128HEGR | Lenovo Legion Y520-15IKBN-80WK001KUS Samsung PM961 MZVLW256HEHP | HP Omen 15-ax213ng Samsung PM961 MZVLW256HEHP | Dell Inspiron 15 7000 7567 Gaming (Core i5-7300HQ, GTX 1050) Toshiba MQ02ABD100H | Asus FX502VM-AS73 SK Hynix HFS256G39TND-N210A | Acer Aspire VX15 VX5-591G-589S Hynix HFS128G39TND | Acer Nitro 5 AN515-51-788E Intel SSD 600p SSDPEKKW256G7 | |
|---|---|---|---|---|---|---|---|
| CrystalDiskMark 3.0 | 74% | 91% | -96% | -46% | -38% | 28% | |
| Read Seq (MB/s) | 2127 | 2170 2% | 1657 -22% | 84.7 -96% | 503 -76% | 510 -76% | 945 -56% |
| Write Seq (MB/s) | 796 | 1202 51% | 1208 52% | 65.4 -92% | 138.2 -83% | 137.6 -83% | 559 -30% |
| Read 512 (MB/s) | 455.6 | 786 73% | 806 77% | 19.86 -96% | 343.5 -25% | 362.1 -21% | 639 40% |
| Write 512 (MB/s) | 196.7 | 822 318% | 807 310% | 28.43 -86% | 137.8 -30% | 137.2 -30% | 561 185% |
| Read 4k (MB/s) | 46.07 | 58.9 28% | 62.6 36% | 0.531 -99% | 29.36 -36% | 35.18 -24% | 24.24 -47% |
| Write 4k (MB/s) | 154.8 | 146.4 -5% | 176.9 14% | 0.481 -100% | 70.9 -54% | 104.8 -32% | 122.7 -21% |
| Read 4k QD32 (MB/s) | 480.9 | 457.7 -5% | 650 35% | 1.105 -100% | 369.9 -23% | 375.8 -22% | 288.5 -40% |
| Write 4k QD32 (MB/s) | 170.6 | 392.9 130% | 557 226% | 0.505 -100% | 99.7 -42% | 138.1 -19% | 504 195% |
| 3DMark 06 Standard Score | 23891 pontos | |
| 3DMark 11 Performance | 8596 pontos | |
| 3DMark Ice Storm Standard Score | 108099 pontos | |
| 3DMark Cloud Gate Standard Score | 16084 pontos | |
| 3DMark Fire Strike Score | 6447 pontos | |
| 3DMark Fire Strike Extreme Score | 3450 pontos | |
| 3DMark Time Spy Score | 2427 pontos | |
Ajuda | ||
| baixo | média | alto | ultra | |
|---|---|---|---|---|
| Tomb Raider (2013) | 309.9 | 288.7 | 198.4 | 93.1 |
| BioShock Infinite (2013) | 222.2 | 188.5 | 165.2 | 70 |
| The Witcher 3 (2015) | 116.7 | 86.1 | 47.8 | 25.6 |
| The Witcher 3 - 1920x1080 High Graphics & Postprocessing (Nvidia HairWorks Off) | |
| HP Omen 15-ax213ng | |
| Lenovo Legion Y520-15IKBN 80WK0042GE | |
| Acer Nitro 5 AN515-51-788E | |
| Acer Aspire VX5-591G-75C4 VX15 | |
| Dell Inspiron 15 7000 7567 Gaming (Core i5-7300HQ, GTX 1050) | |
Barulho
| Ocioso |
| 31.9 / 31.9 / 31.9 dB |
| Carga |
| 34.6 / 41.7 dB |
 | ||
30 dB silencioso 40 dB(A) audível 50 dB(A) ruidosamente alto |
||
min: | ||
| Lenovo Legion Y520-15IKBN 80WK0042GE i5-7300HQ, GeForce GTX 1050 Ti Mobile | Lenovo Legion Y520-15IKBN-80WK001KUS i7-7700HQ, GeForce GTX 1050 Ti Mobile | HP Omen 15-ax213ng i7-7700HQ, GeForce GTX 1050 Ti Mobile | Dell Inspiron 15 7000 7567 Gaming (Core i5-7300HQ, GTX 1050) i5-7300HQ, GeForce GTX 1050 Mobile | Asus FX502VM-AS73 i7-7700HQ, GeForce GTX 1060 Mobile | Acer Aspire VX15 VX5-591G-589S i5-7300HQ, GeForce GTX 1050 Mobile | Acer Nitro 5 AN515-51-788E i7-7700HQ, GeForce GTX 1050 Ti Mobile | |
|---|---|---|---|---|---|---|---|
| Noise | 0% | -15% | -5% | -7% | 6% | -3% | |
| desligado / ambiente * (dB) | 30.6 | 27.7 9% | 30 2% | 28 8% | 28.7 6% | 30 2% | 30.6 -0% |
| Idle Minimum * (dB) | 31.9 | 30.5 4% | 32 -0% | 31.6 1% | 30.6 4% | 30 6% | 30.6 4% |
| Idle Average * (dB) | 31.9 | 30.5 4% | 34 -7% | 31.8 -0% | 30.6 4% | 30 6% | 30.7 4% |
| Idle Maximum * (dB) | 31.9 | 30.6 4% | 36 -13% | 31.8 -0% | 31 3% | 31.1 3% | 30.7 4% |
| Load Average * (dB) | 34.6 | 40 -16% | 48 -39% | 36.3 -5% | 46.2 -34% | 31.3 10% | 43 -24% |
| Witcher 3 ultra * (dB) | 39.3 | 40 -2% | 49 -25% | 46.3 -18% | 39.7 -1% | ||
| Load Maximum * (dB) | 41.7 | 42.6 -2% | 51 -22% | 49 -18% | 52.3 -25% | 38.9 7% | 45.8 -10% |
* ... menor é melhor
(+) A temperatura máxima no lado superior é 39.6 °C / 103 F, em comparação com a média de 40.4 °C / 105 F , variando de 21.2 a 68.8 °C para a classe Gaming.
(+) A parte inferior aquece até um máximo de 38.4 °C / 101 F, em comparação com a média de 43.2 °C / 110 F
(+) Em uso inativo, a temperatura média para o lado superior é 21.1 °C / 70 F, em comparação com a média do dispositivo de 33.9 °C / ### class_avg_f### F.
(±) Jogando The Witcher 3, a temperatura média para o lado superior é 33.5 °C / 92 F, em comparação com a média do dispositivo de 33.9 °C / ## #class_avg_f### F.
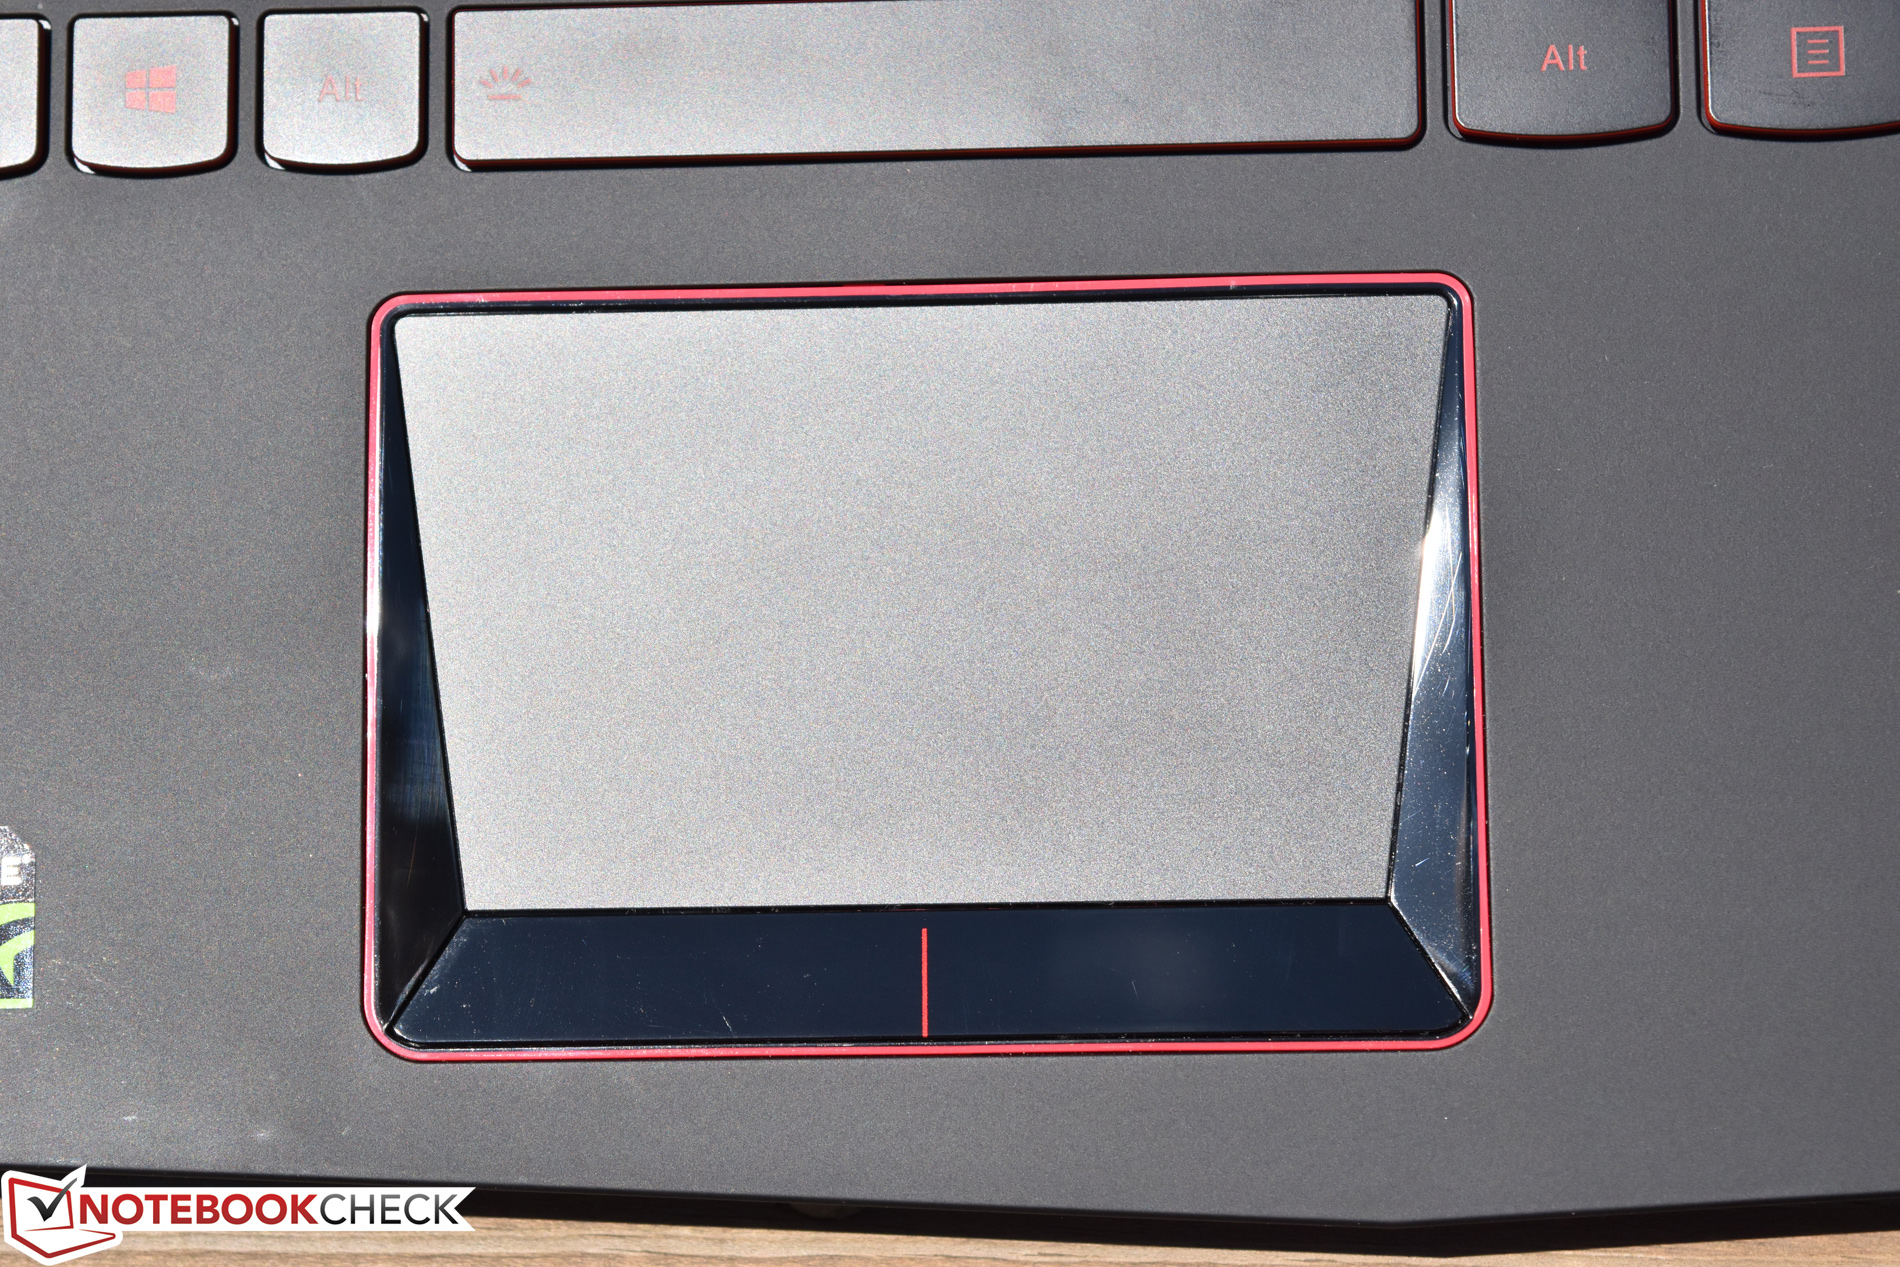
(+) Os apoios para as mãos e o touchpad estão atingindo a temperatura máxima da pele (32.9 °C / 91.2 F) e, portanto, não estão quentes.
(-) A temperatura média da área do apoio para as mãos de dispositivos semelhantes foi 28.8 °C / 83.8 F (-4.1 °C / -7.4 F).
| Lenovo Legion Y520-15IKBN 80WK0042GE i5-7300HQ, GeForce GTX 1050 Ti Mobile | Lenovo Legion Y520-15IKBN-80WK001KUS i7-7700HQ, GeForce GTX 1050 Ti Mobile | HP Omen 15-ax213ng i7-7700HQ, GeForce GTX 1050 Ti Mobile | Dell Inspiron 15 7000 7567 Gaming (Core i5-7300HQ, GTX 1050) i5-7300HQ, GeForce GTX 1050 Mobile | Asus FX502VM-AS73 i7-7700HQ, GeForce GTX 1060 Mobile | Acer Aspire VX15 VX5-591G-589S i5-7300HQ, GeForce GTX 1050 Mobile | Acer Nitro 5 AN515-51-788E i7-7700HQ, GeForce GTX 1050 Ti Mobile | |
|---|---|---|---|---|---|---|---|
| Heat | -28% | -34% | -22% | -38% | -25% | -13% | |
| Maximum Upper Side * (°C) | 39.6 | 46.8 -18% | 52.4 -32% | 47.2 -19% | 53.2 -34% | 47.2 -19% | 41.1 -4% |
| Maximum Bottom * (°C) | 38.4 | 55.8 -45% | 54.2 -41% | 43.2 -13% | 56.8 -48% | 42.2 -10% | 38.8 -1% |
| Idle Upper Side * (°C) | 22.8 | 27.6 -21% | 30.5 -34% | 28.6 -25% | 28.8 -26% | 31.8 -39% | 28.7 -26% |
| Idle Bottom * (°C) | 22.1 | 28.4 -29% | 28.2 -28% | 29 -31% | 31.4 -42% | 29.5 -33% | 26.9 -22% |
* ... menor é melhor
Lenovo Legion Y520-15IKBN 80WK0042GE análise de áudio
(-) | alto-falantes não muito altos (###valor### dB)
Graves 100 - 315Hz
(-) | quase nenhum baixo - em média 16.9% menor que a mediana
(±) | a linearidade dos graves é média (13.9% delta para a frequência anterior)
Médios 400 - 2.000 Hz
(+) | médios equilibrados - apenas 4.6% longe da mediana
(±) | a linearidade dos médios é média (8.8% delta para frequência anterior)
Altos 2 - 16 kHz
(+) | agudos equilibrados - apenas 3.6% longe da mediana
(±) | a linearidade dos máximos é média (12.7% delta para frequência anterior)
Geral 100 - 16.000 Hz
(±) | a linearidade do som geral é média (22.6% diferença em relação à mediana)
Comparado com a mesma classe
» 81% de todos os dispositivos testados nesta classe foram melhores, 5% semelhantes, 14% piores
» O melhor teve um delta de 6%, a média foi 18%, o pior foi 132%
Comparado com todos os dispositivos testados
» 67% de todos os dispositivos testados foram melhores, 6% semelhantes, 28% piores
» O melhor teve um delta de 4%, a média foi 23%, o pior foi 134%
Apple MacBook 12 (Early 2016) 1.1 GHz análise de áudio
(+) | os alto-falantes podem tocar relativamente alto (###valor### dB)
Graves 100 - 315Hz
(±) | graves reduzidos - em média 11.3% menor que a mediana
(±) | a linearidade dos graves é média (14.2% delta para a frequência anterior)
Médios 400 - 2.000 Hz
(+) | médios equilibrados - apenas 2.4% longe da mediana
(+) | médios são lineares (5.5% delta para frequência anterior)
Altos 2 - 16 kHz
(+) | agudos equilibrados - apenas 2% longe da mediana
(+) | os máximos são lineares (4.5% delta da frequência anterior)
Geral 100 - 16.000 Hz
(+) | o som geral é linear (10.2% diferença em relação à mediana)
Comparado com a mesma classe
» 7% de todos os dispositivos testados nesta classe foram melhores, 2% semelhantes, 90% piores
» O melhor teve um delta de 5%, a média foi 18%, o pior foi 53%
Comparado com todos os dispositivos testados
» 5% de todos os dispositivos testados foram melhores, 1% semelhantes, 94% piores
» O melhor teve um delta de 4%, a média foi 23%, o pior foi 134%
| desligado | |
| Ocioso | |
| Carga |
|
Key:
min: | |
| Lenovo Legion Y520-15IKBN 80WK0042GE i5-7300HQ, GeForce GTX 1050 Ti Mobile | Lenovo Legion Y520-15IKBN-80WK001KUS i7-7700HQ, GeForce GTX 1050 Ti Mobile | HP Omen 15-ax213ng i7-7700HQ, GeForce GTX 1050 Ti Mobile | Dell Inspiron 15 7000 7567 Gaming (Core i5-7300HQ, GTX 1050) i5-7300HQ, GeForce GTX 1050 Mobile | Asus FX502VM-AS73 i7-7700HQ, GeForce GTX 1060 Mobile | Acer Aspire VX15 VX5-591G-589S i5-7300HQ, GeForce GTX 1050 Mobile | Acer Nitro 5 AN515-51-788E i7-7700HQ, GeForce GTX 1050 Ti Mobile | |
|---|---|---|---|---|---|---|---|
| Power Consumption | -20% | -33% | -26% | -87% | -30% | -5% | |
| Idle Minimum * (Watt) | 5.2 | 8.5 -63% | 6 -15% | 9.1 -75% | 14.9 -187% | 8.4 -62% | 4.1 21% |
| Idle Average * (Watt) | 8.3 | 9.1 -10% | 11 -33% | 10.3 -24% | 15.1 -82% | 13.1 -58% | 6.9 17% |
| Idle Maximum * (Watt) | 10.1 | 9.7 4% | 18 -78% | 13 -29% | 15.2 -50% | 14.2 -41% | 9.5 6% |
| Load Average * (Watt) | 62.7 | 79.9 -27% | 81 -29% | 75.6 -21% | 105.8 -69% | 50 20% | 83 -32% |
| Witcher 3 ultra * (Watt) | 94 | 97.7 -4% | 90 4% | 83.8 11% | 108 -15% | ||
| Load Maximum * (Watt) | 100 | 121.5 -22% | 146 -46% | 115.2 -15% | 148.8 -49% | 111 -11% | 126 -26% |
* ... menor é melhor
| Lenovo Legion Y520-15IKBN 80WK0042GE i5-7300HQ, GeForce GTX 1050 Ti Mobile, 45 Wh | Lenovo Legion Y520-15IKBN-80WK001KUS i7-7700HQ, GeForce GTX 1050 Ti Mobile, 45 Wh | HP Omen 15-ax213ng i7-7700HQ, GeForce GTX 1050 Ti Mobile, 63.3 Wh | Acer Aspire VX5-591G-75C4 VX15 i7-7700HQ, GeForce GTX 1050 Ti Mobile, 52.5 Wh | Dell Inspiron 15 7000 7567 Gaming (Core i5-7300HQ, GTX 1050) i5-7300HQ, GeForce GTX 1050 Mobile, 74 Wh | Asus FX502VM-AS73 i7-7700HQ, GeForce GTX 1060 Mobile, 64 Wh | Medion Erazer X6603 i7-7700HQ, GeForce GTX 1050 Ti Mobile, 45 Wh | Acer Aspire VX15 VX5-591G-589S i5-7300HQ, GeForce GTX 1050 Mobile, 52.5 Wh | Acer Nitro 5 AN515-51-788E i7-7700HQ, GeForce GTX 1050 Ti Mobile, 48 Wh | |
|---|---|---|---|---|---|---|---|---|---|
| Duração da bateria | -29% | 11% | -18% | 66% | -25% | -31% | 6% | 16% | |
| Reader / Idle (h) | 10.6 | 8.5 -20% | 12.8 21% | 5.4 -49% | 18.2 72% | 6.1 -42% | 5.7 -46% | 14.9 41% | |
| H.264 (h) | 4.5 | 3.3 -27% | 3.8 -16% | 5.2 16% | |||||
| WiFi v1.3 (h) | 5.2 | 4 -23% | 7.1 37% | 5 -4% | 9.5 83% | 4.6 -12% | 4.3 -17% | 5.5 6% | 6.7 29% |
| Load (h) | 1.4 | 0.8 -43% | 1.6 14% | 1.4 0% | 2 43% | 1.1 -21% | 0.8 -43% | 1.1 -21% |
Pro
Contra
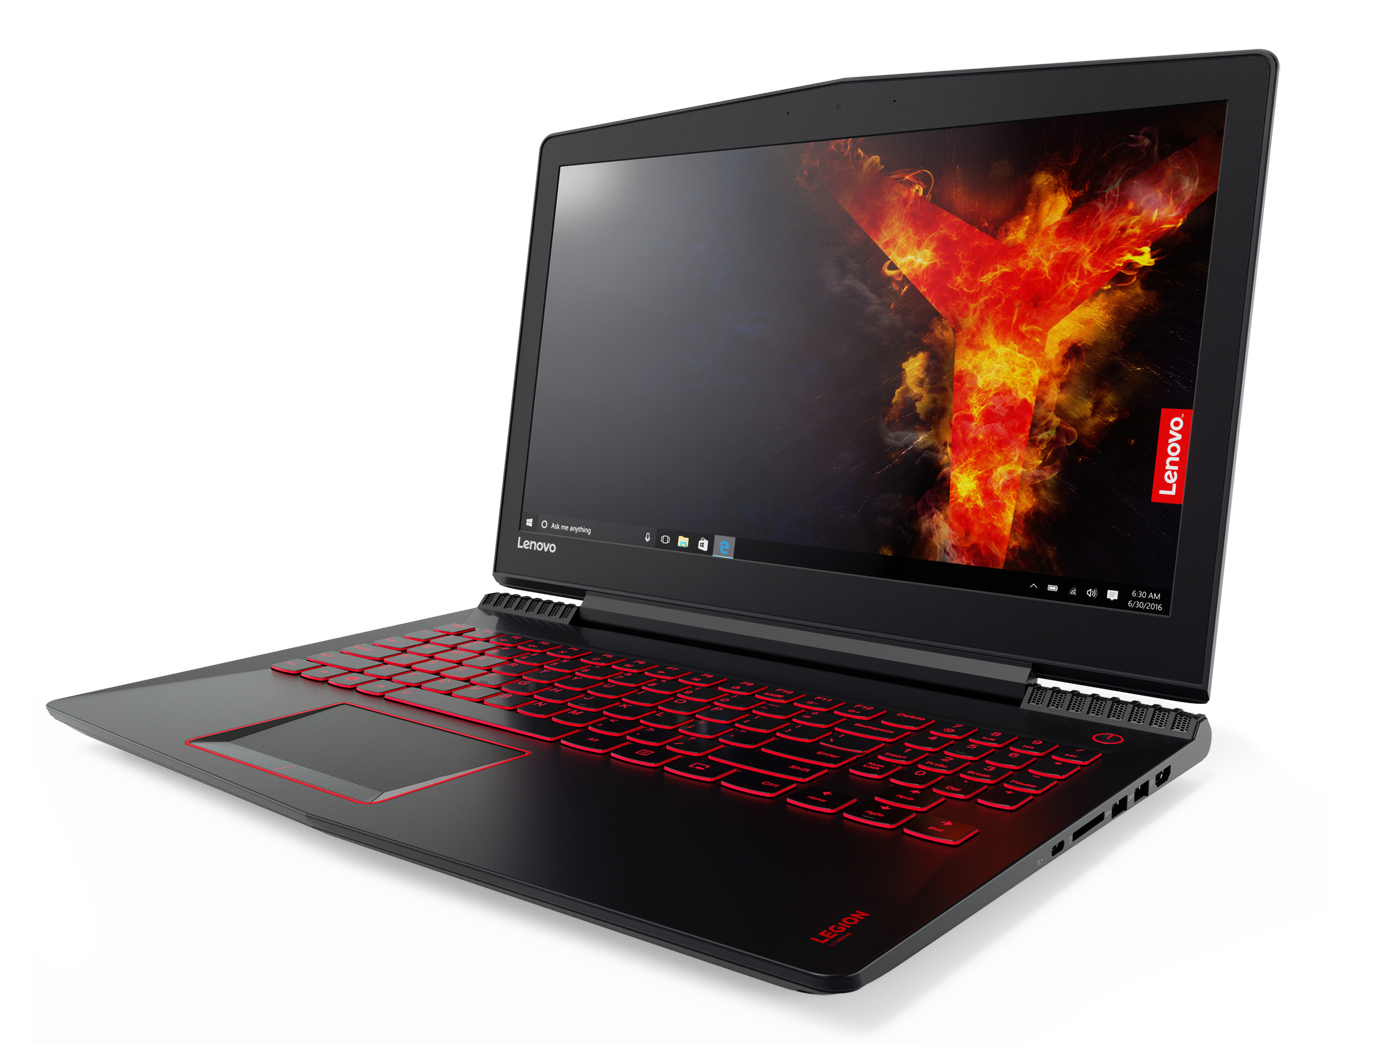
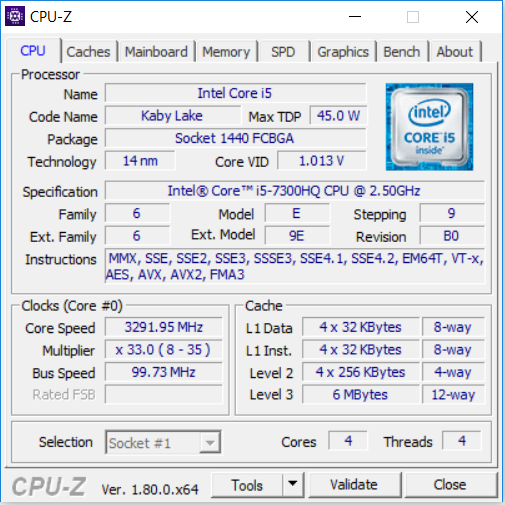
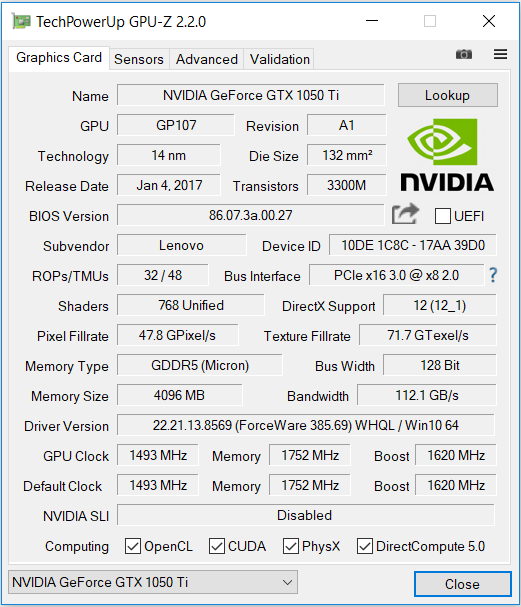
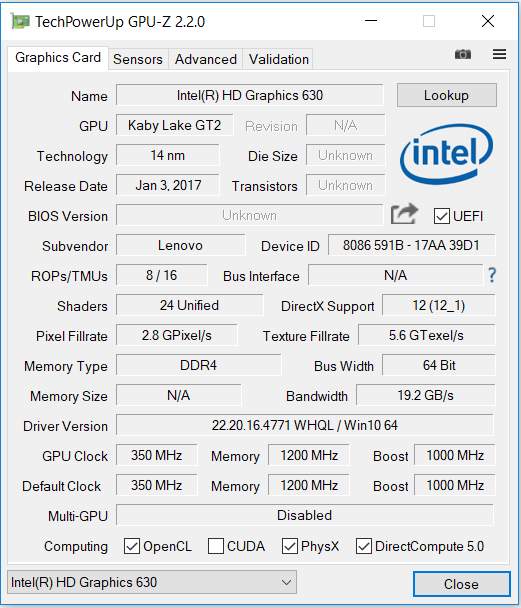
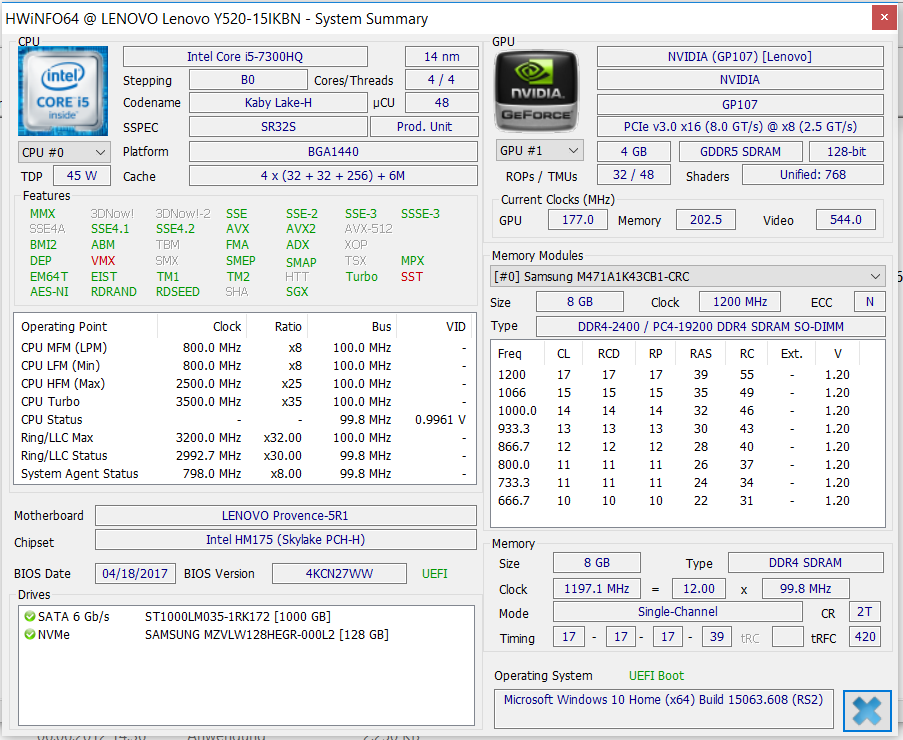
Com o Lenovo Legion Y520 80WK0042GE, você recebe um portátil de 15,6 polegadas que possui um processador quadcore Kaby-Lake e um núcleo gráfico GeForce GTX 1050 Ti integrado. O hardware traz a maioria dos jogos para a tela sem problemas em altas resoluções e em configurações de qualidade médias a altas. Os jogos com muita demanda de energia requerem uma redução da resolução e/ou configurações de qualidade. Em toda a gama de cargas, o computador não aquece demais e funciona silenciosamente, pelo menos durante o modo inativo.
Com o Legion Y520-15IKBN, a Lenovo oferece um gamer de nível de entrada bem equipado.
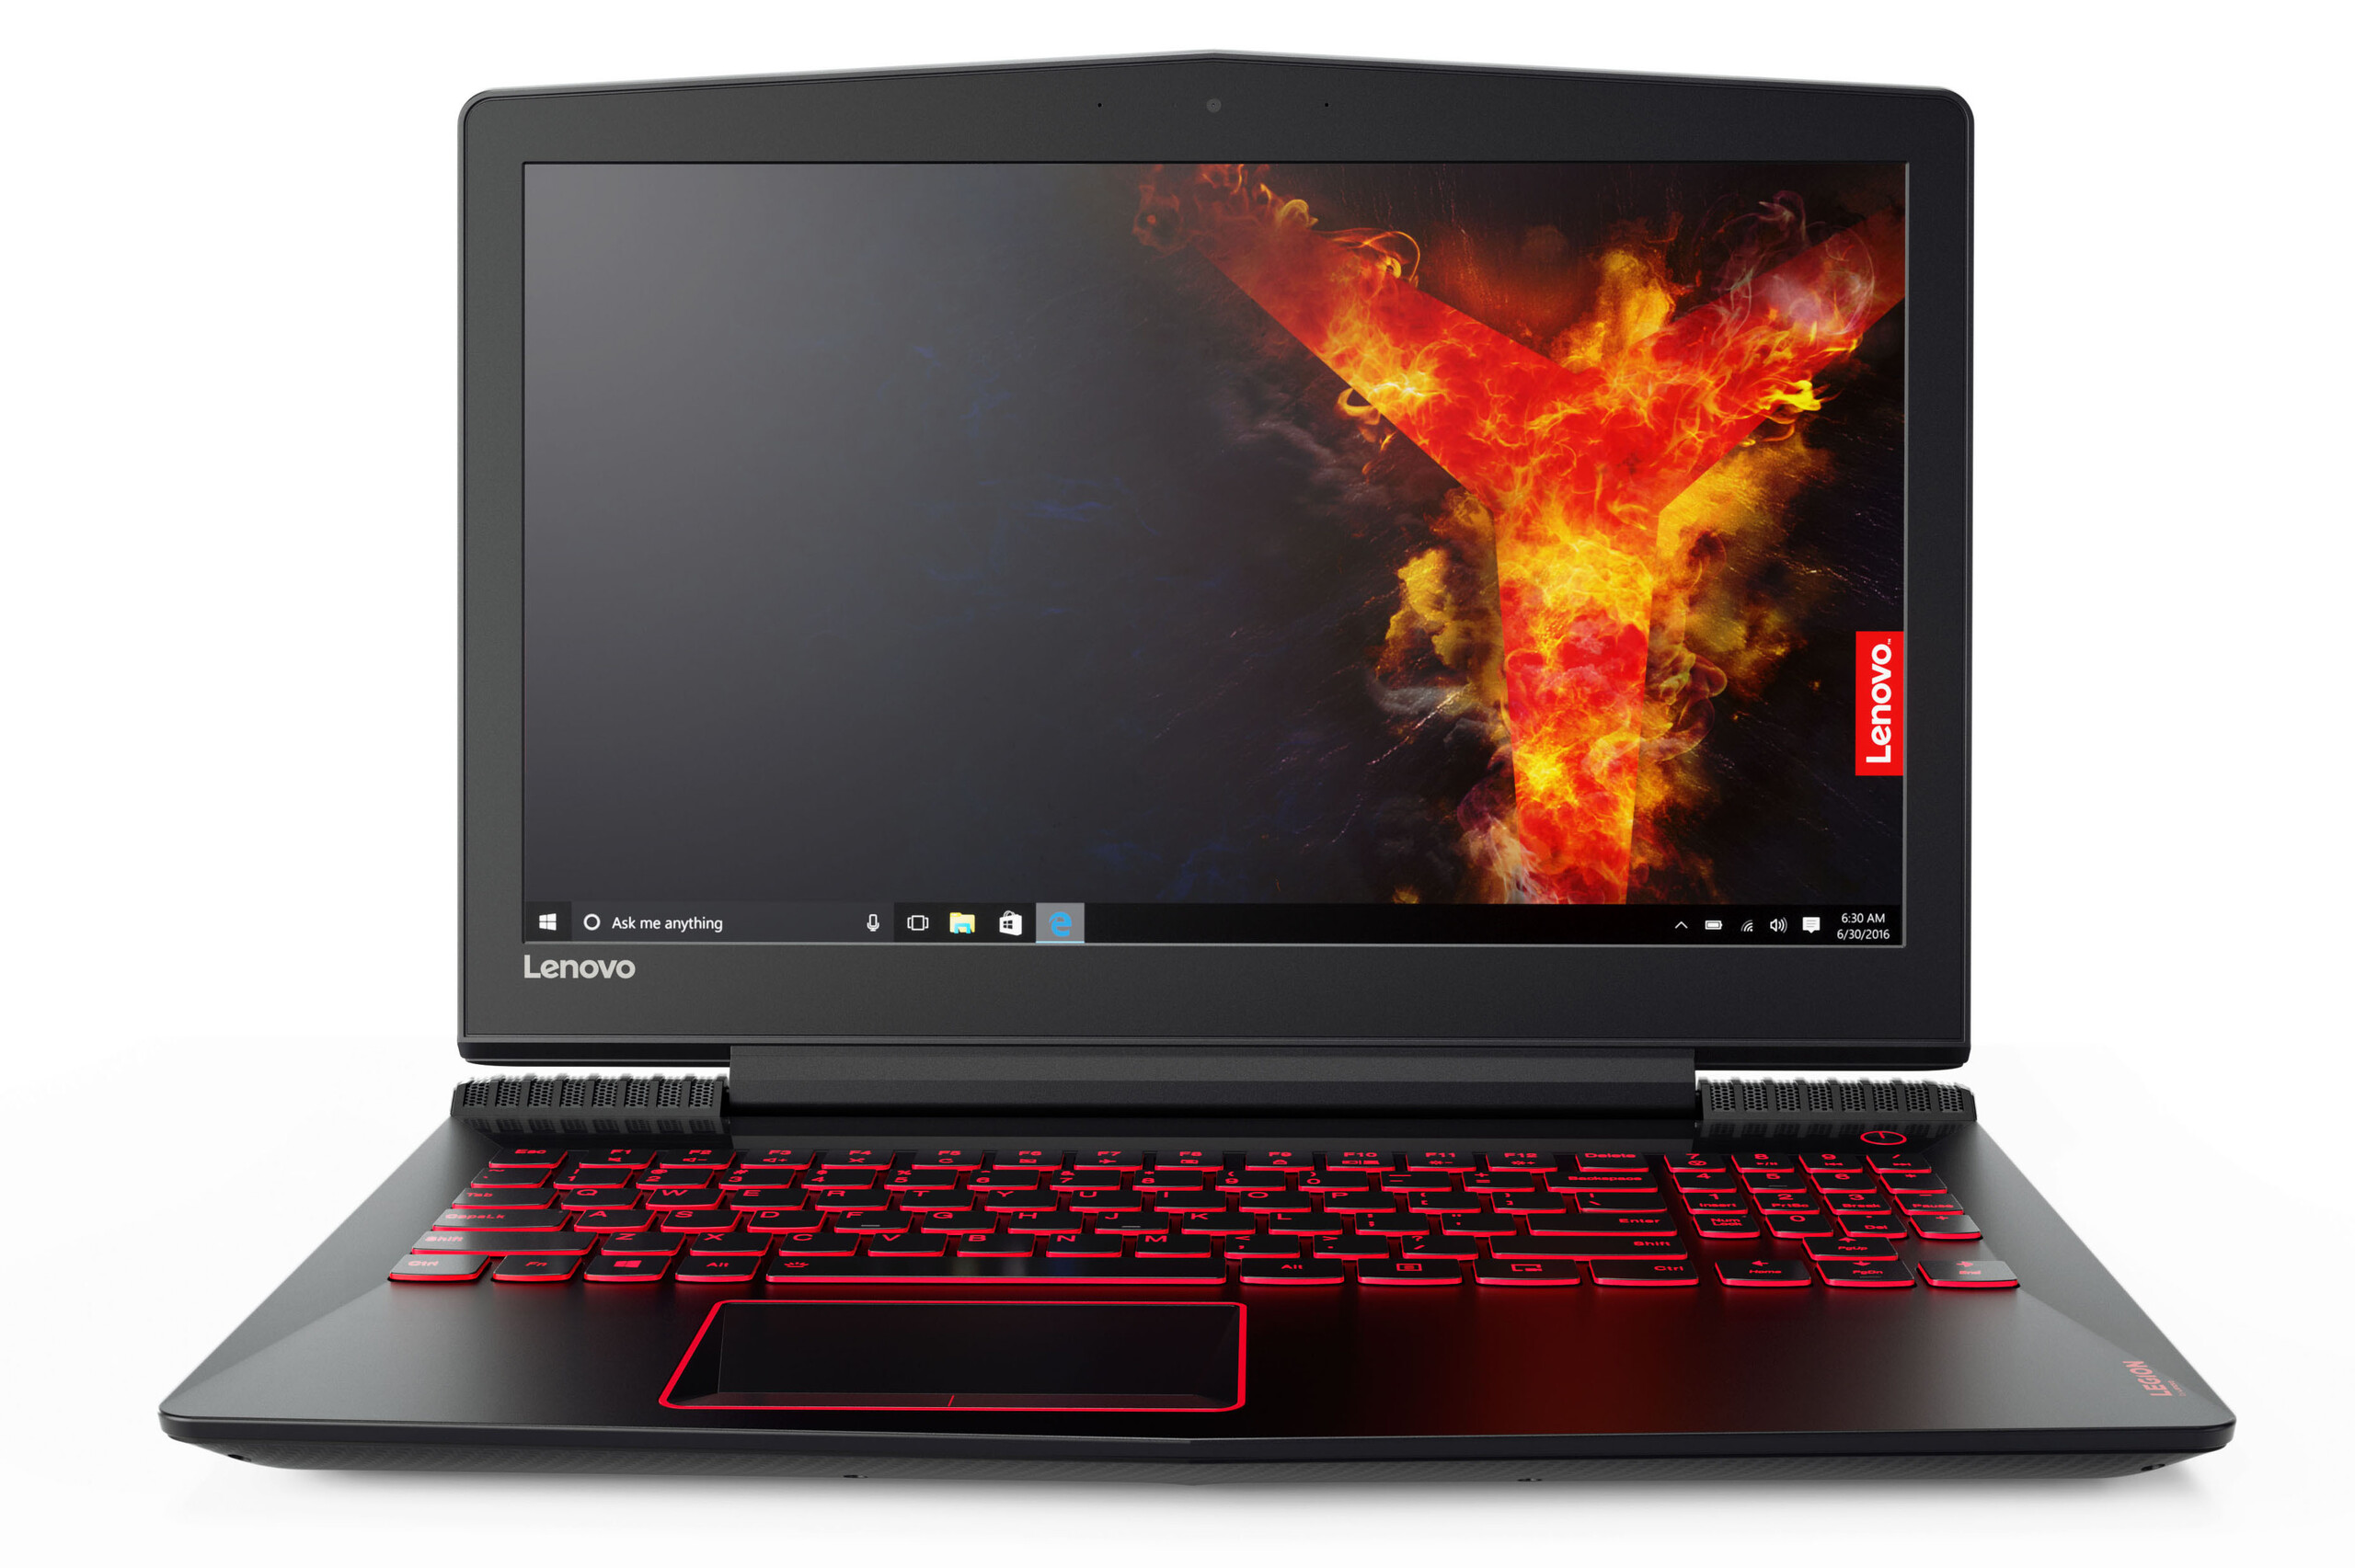
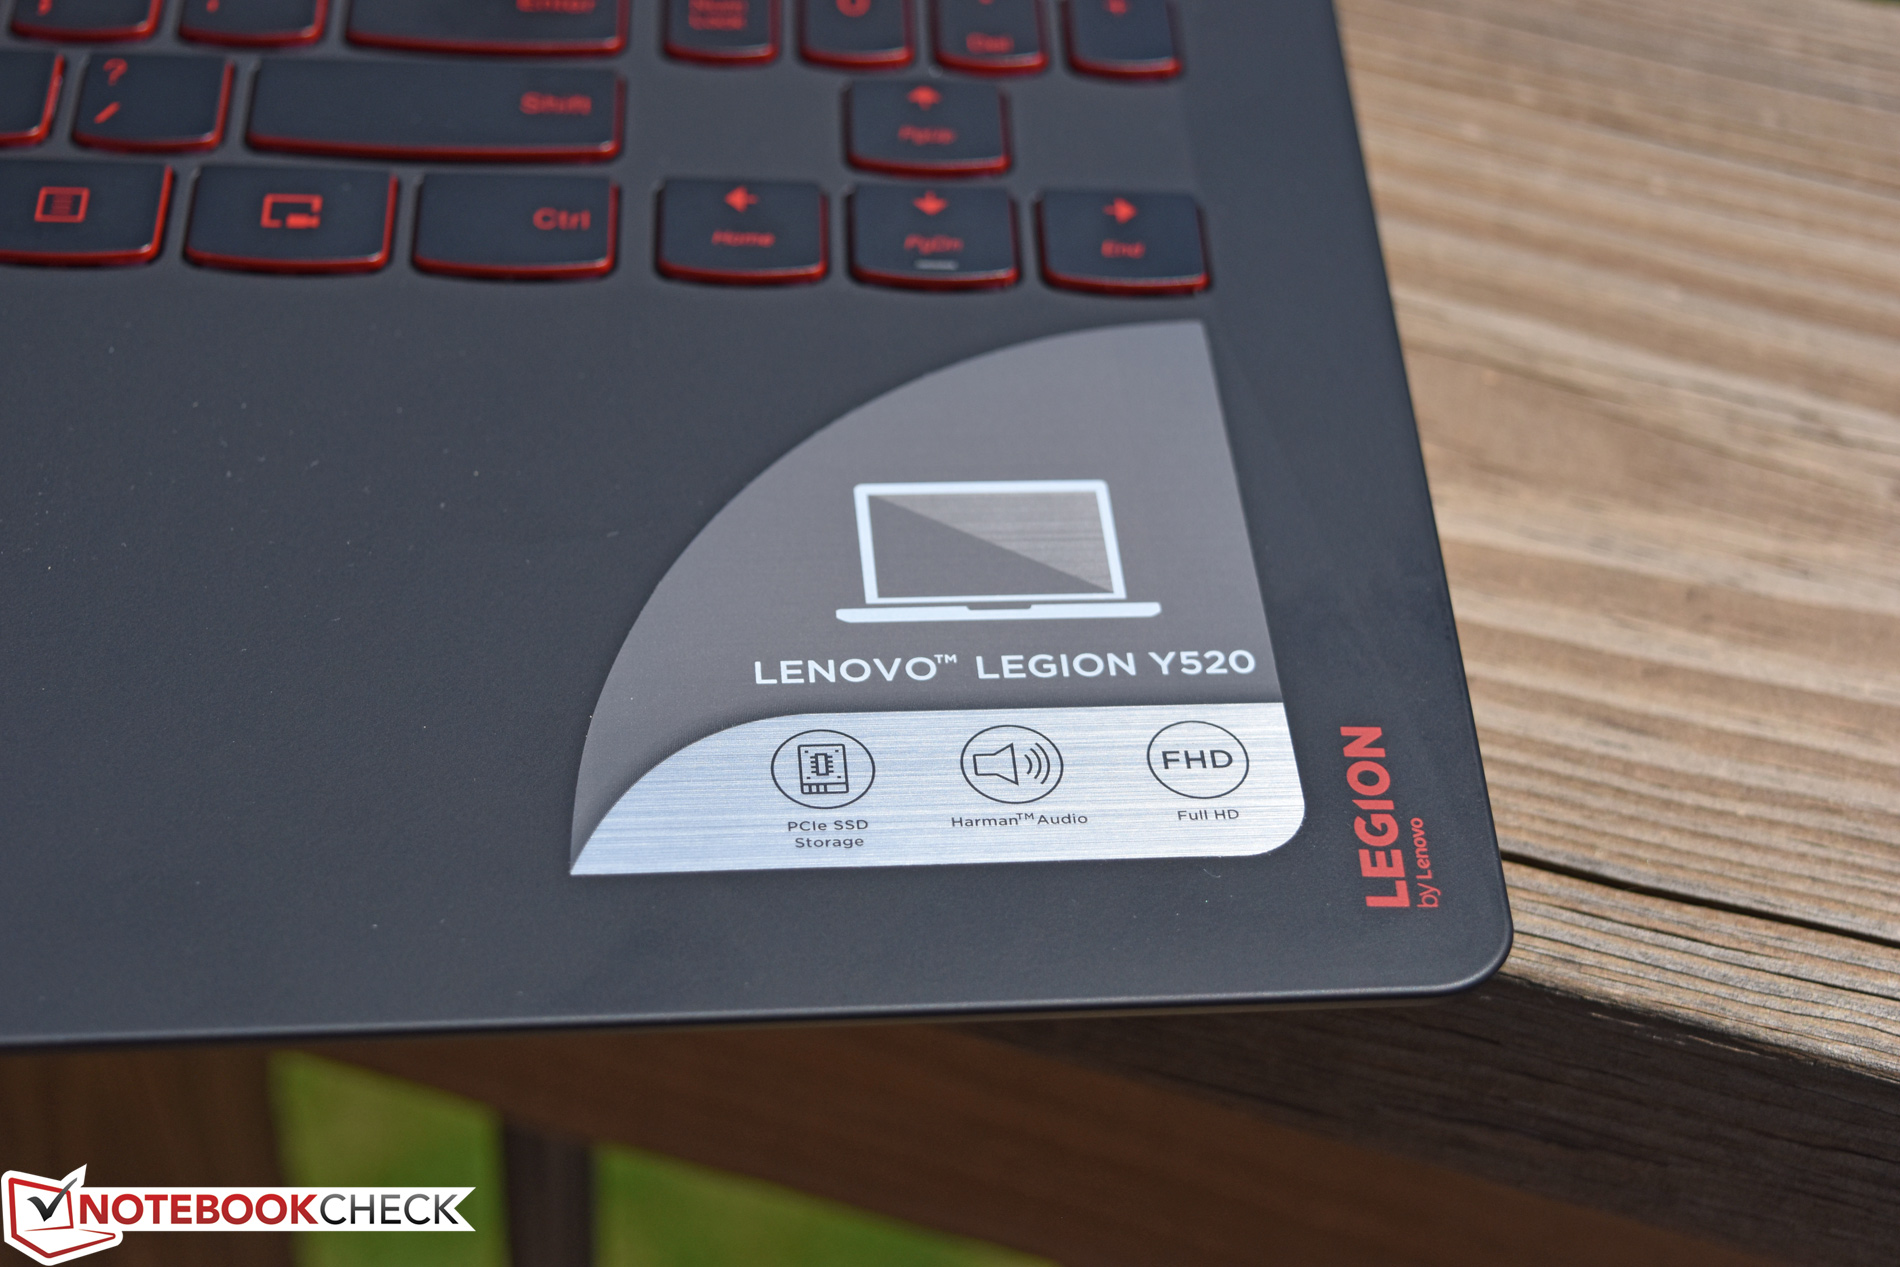
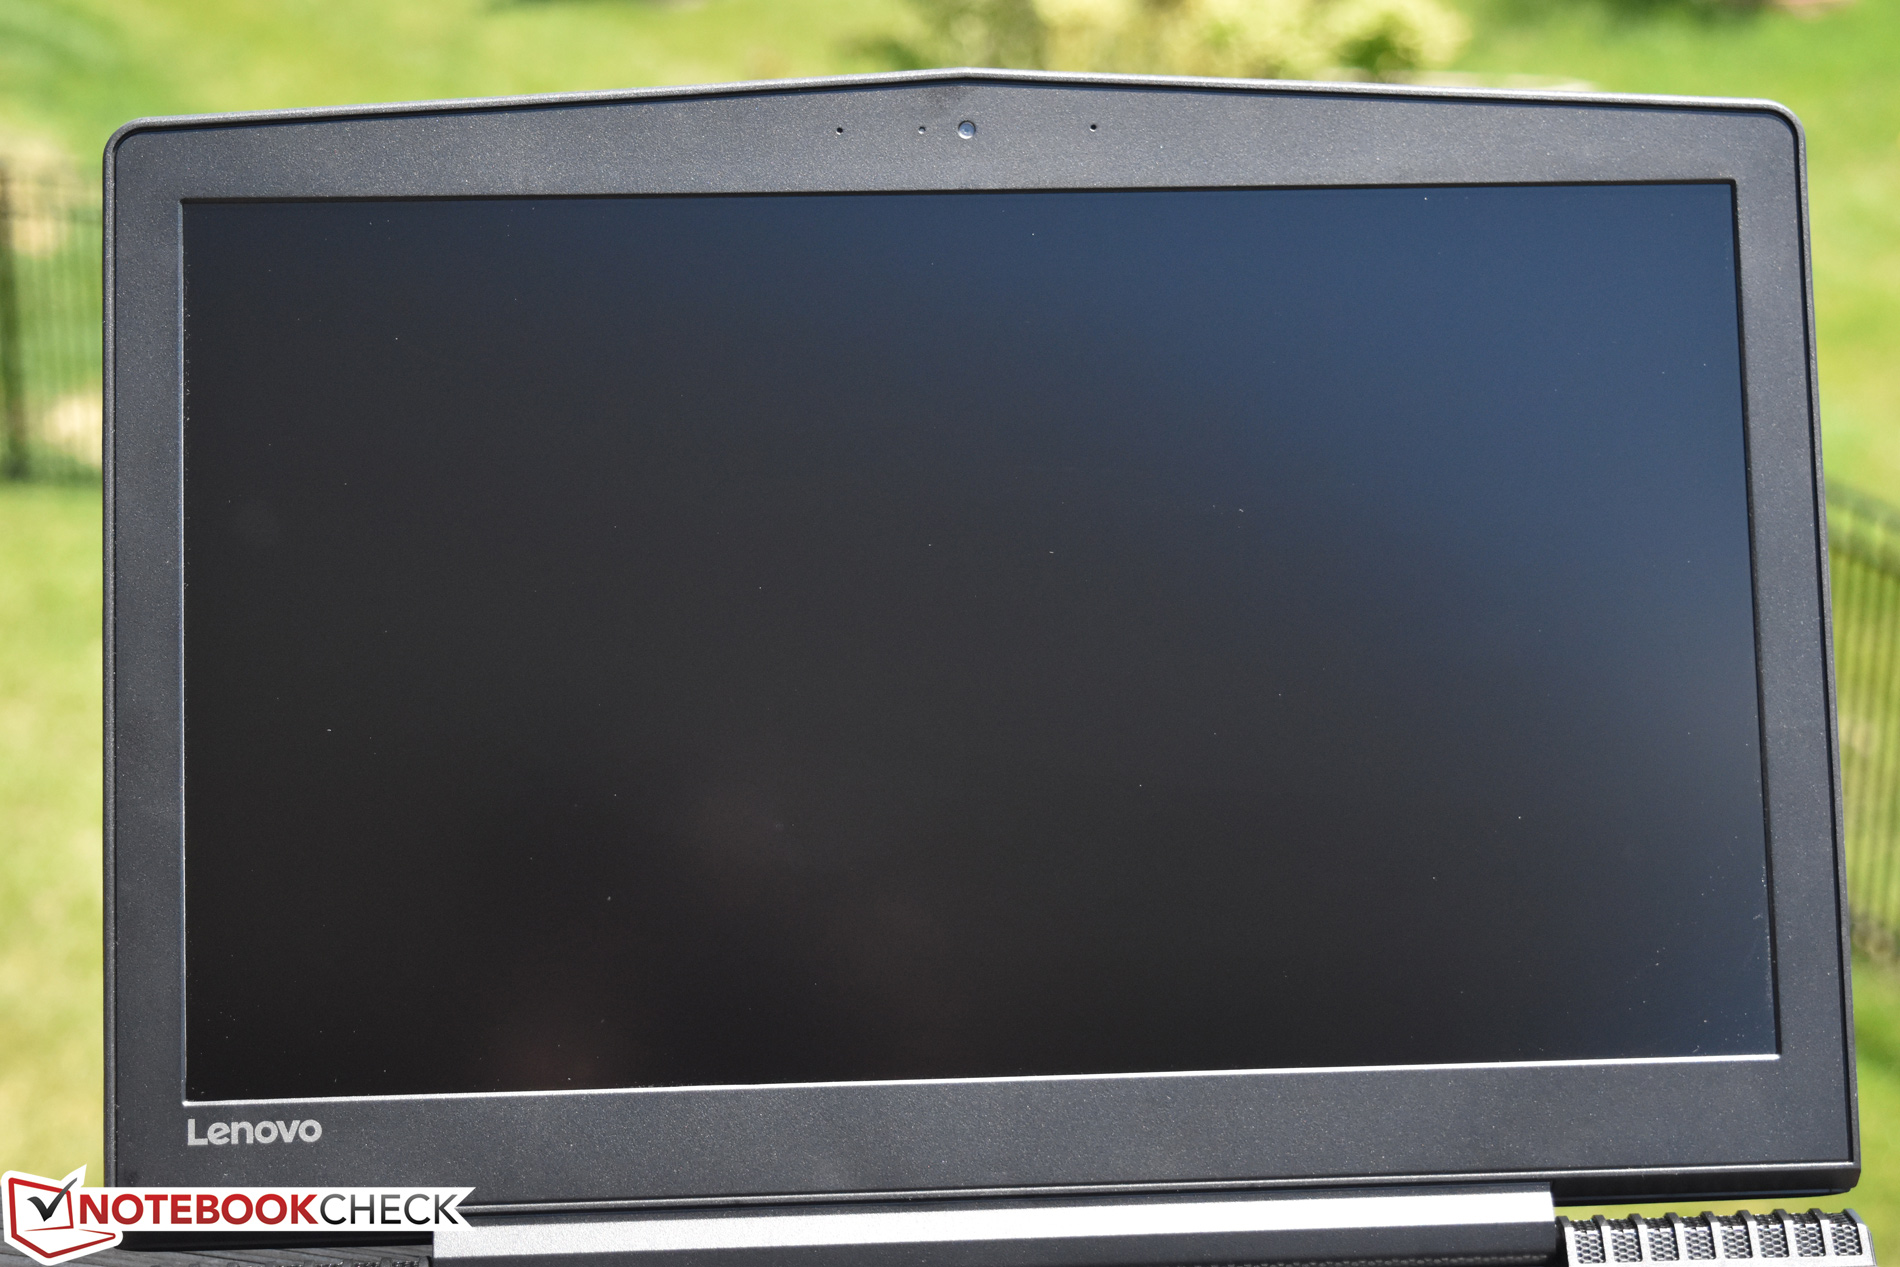
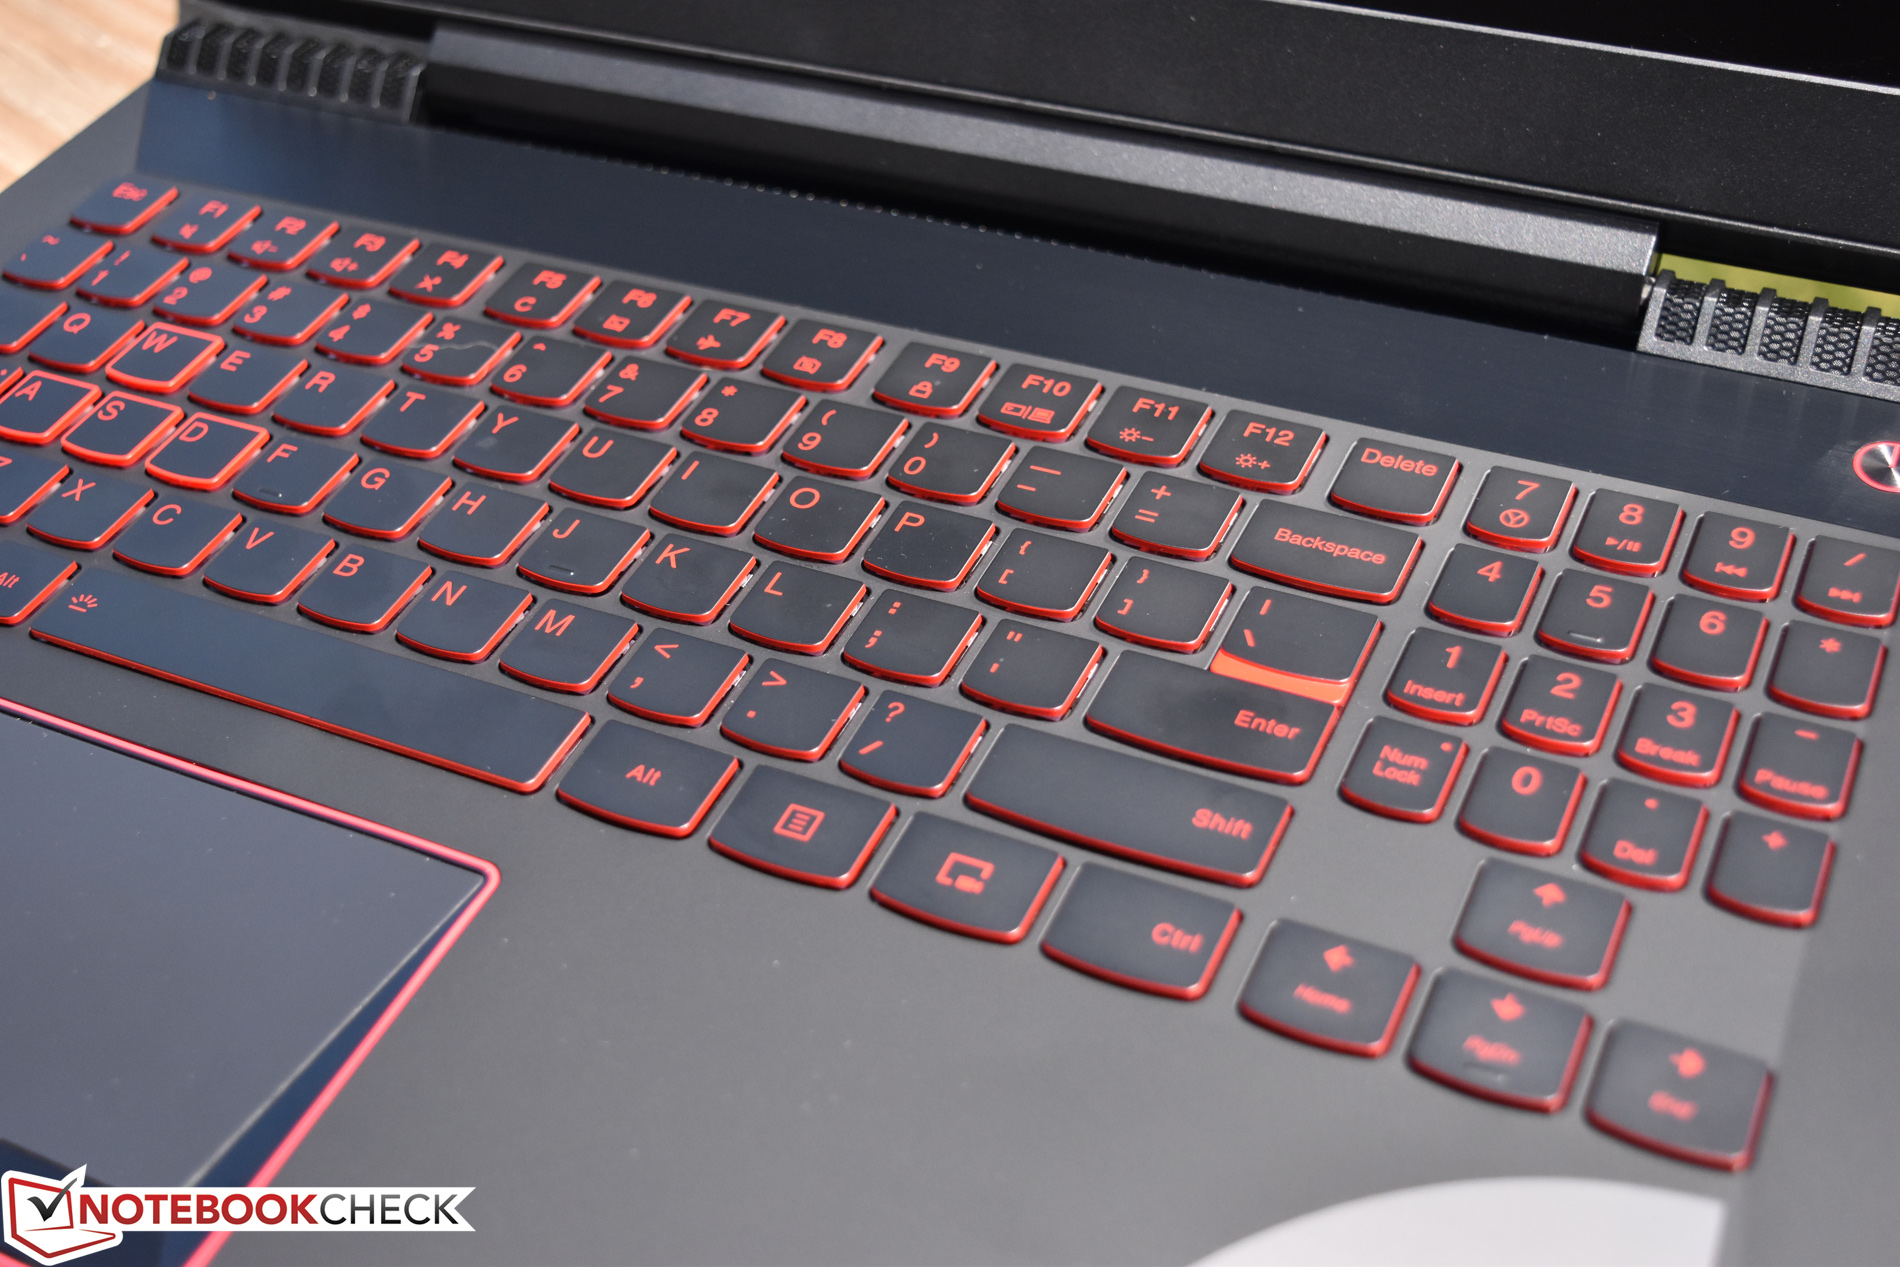
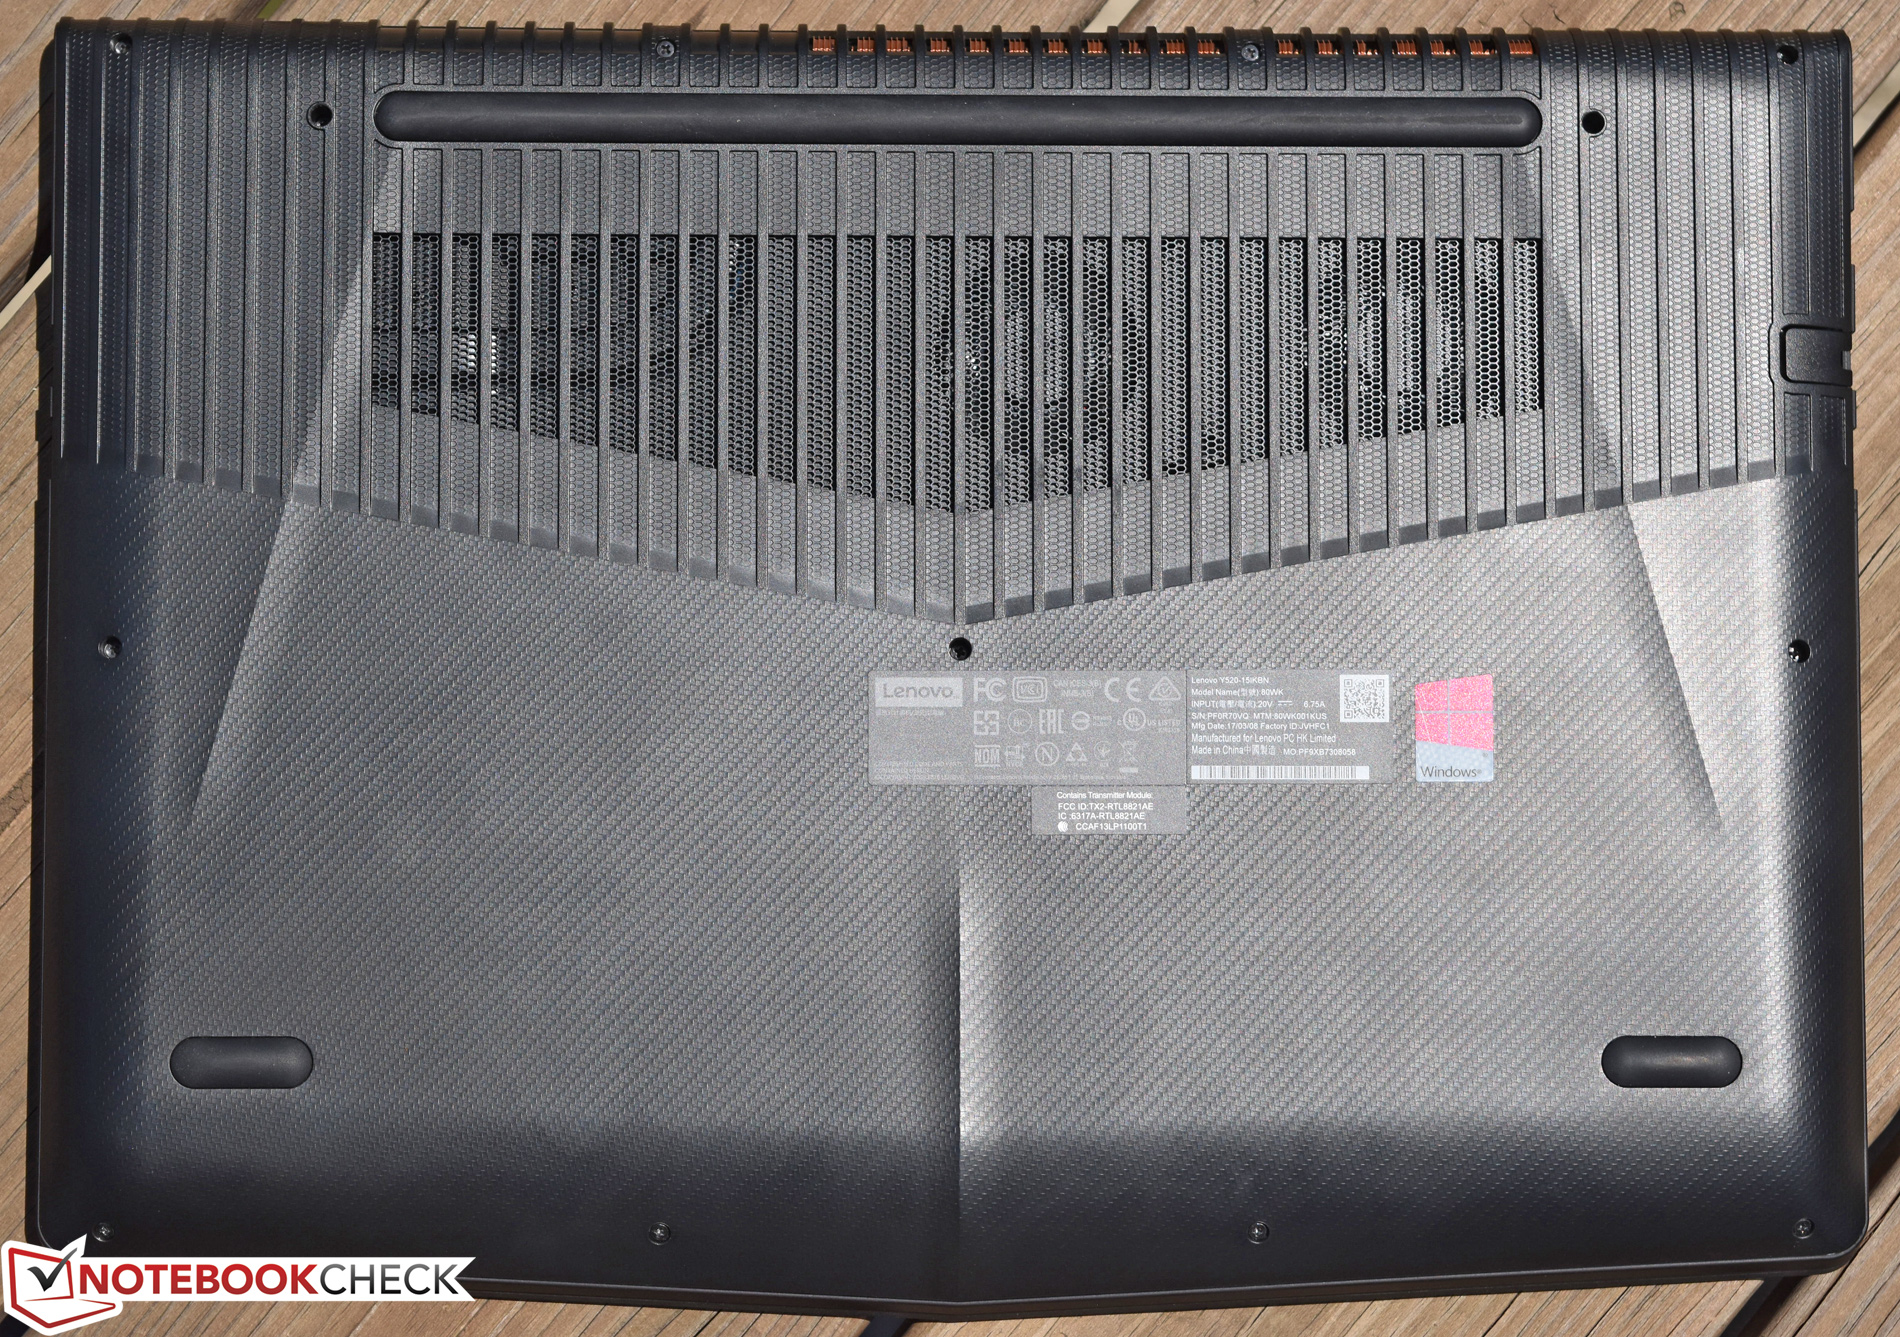
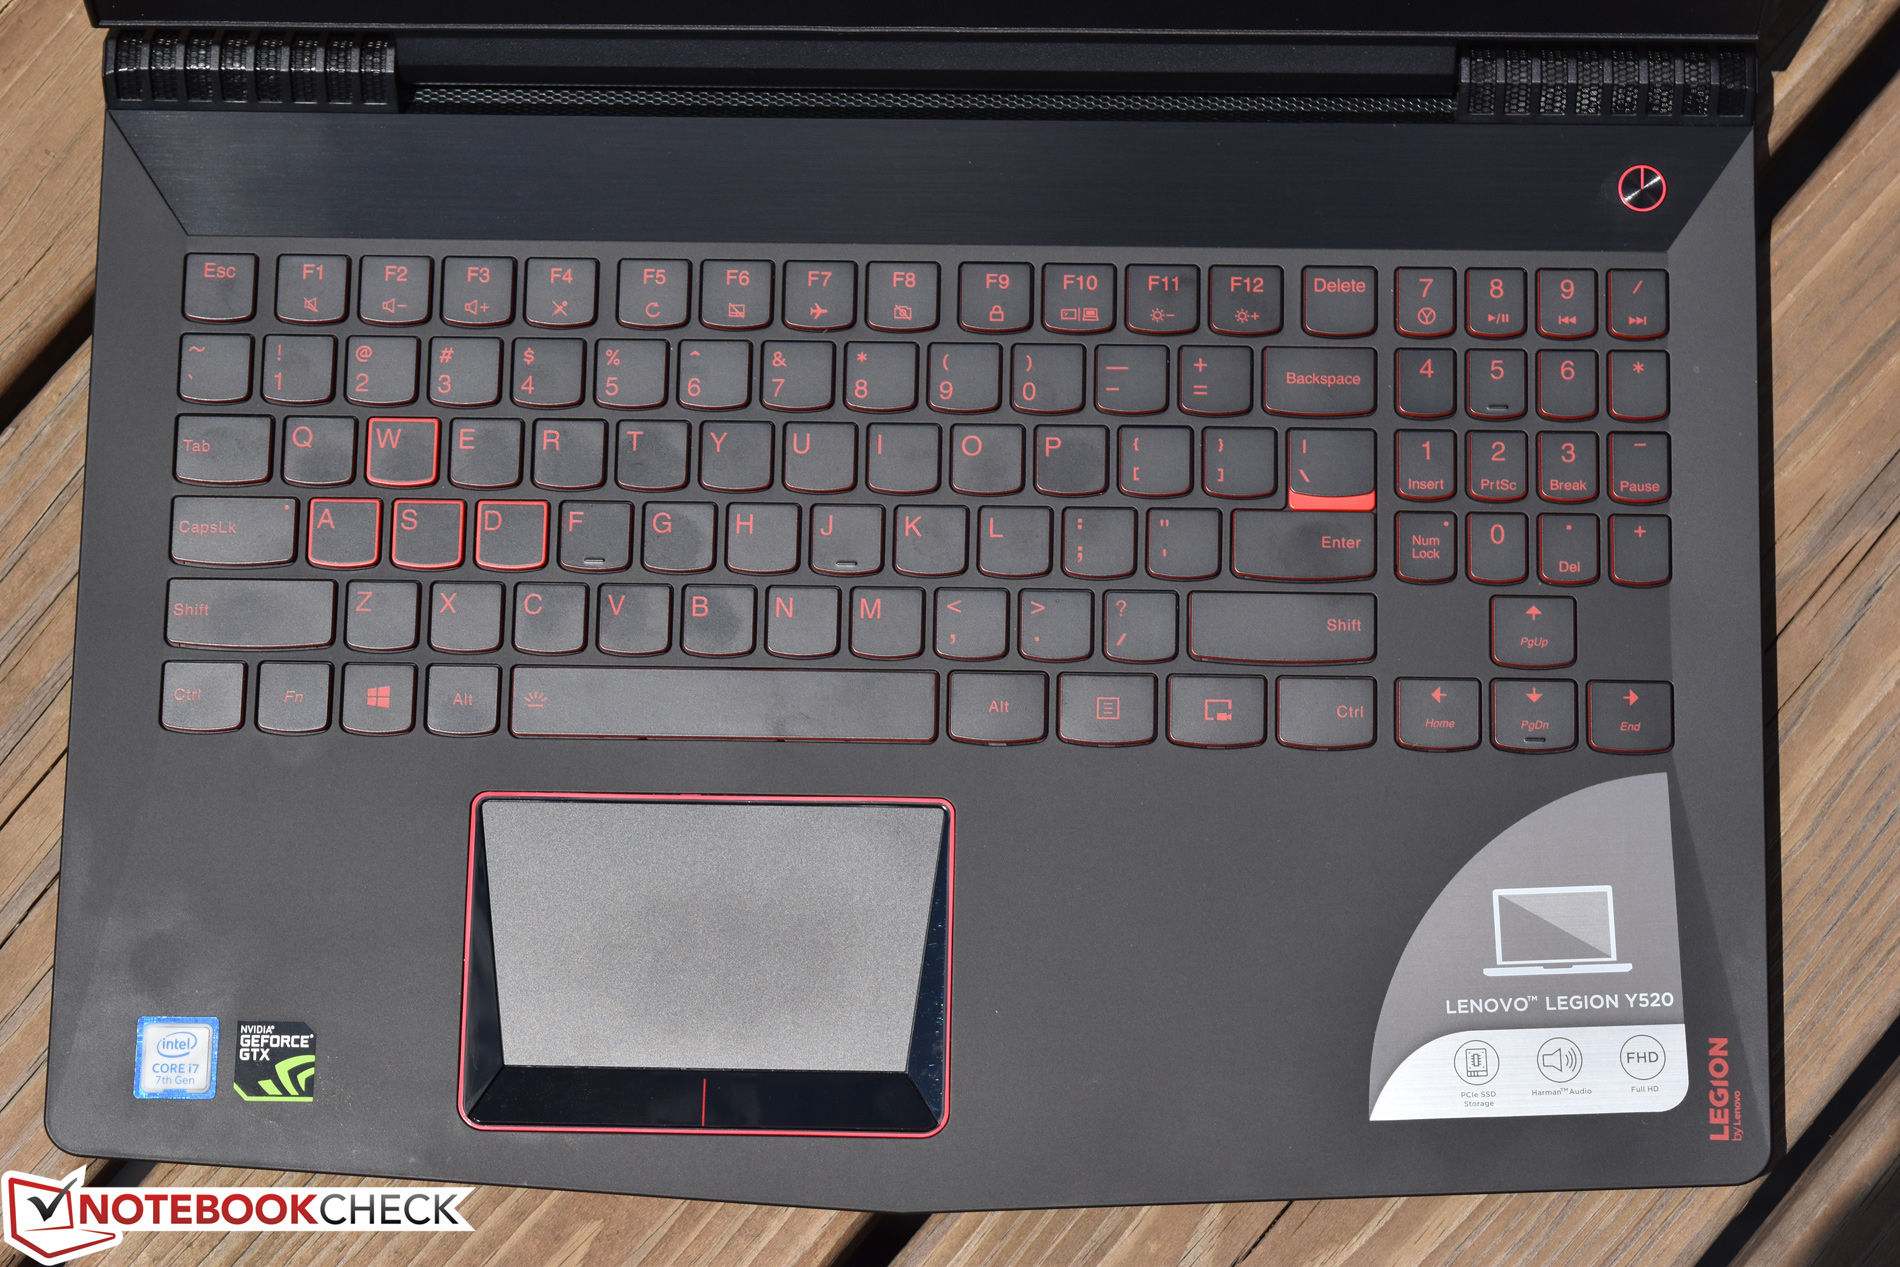
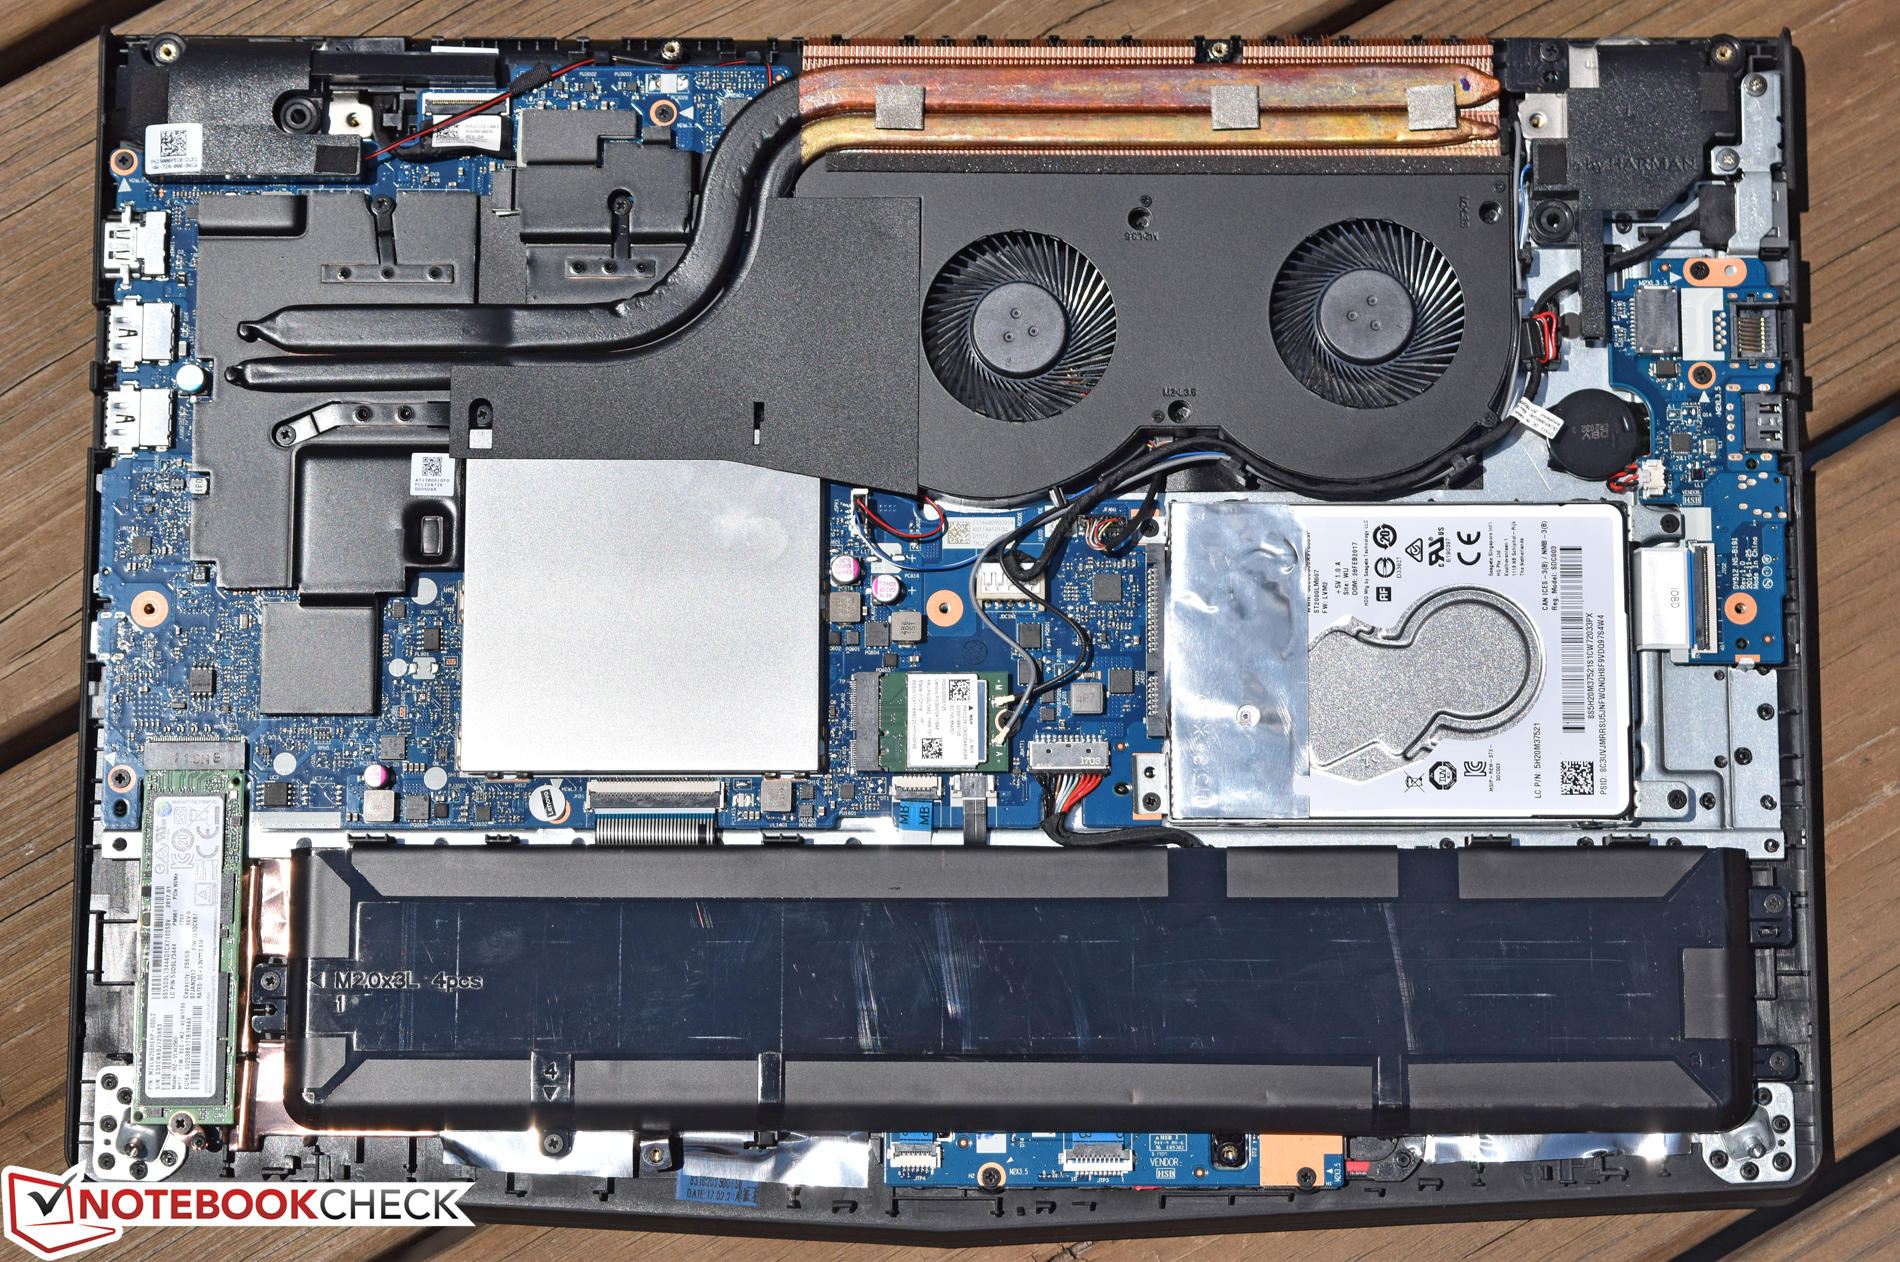
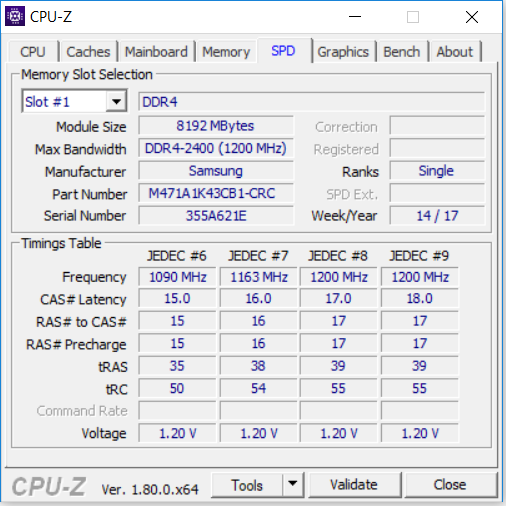
Graças a um bom teclado e à operação silenciosa durante o modo inativo e baixas cargas, o computador também é utilizável no escritório. Um SSD NVMe muito veloz garante um sistema rápido. O armazenamento necessário para um portátil de jogos é fornecido por um disco rígido de 2,5 polegadas que também está instalado. Ambas as unidades podem ser removidas. Para isso, a carcaça teria que ser aberta. O brilho e o contraste da tela IPS Full HD mate são bons, mas poderiam ter sido um pouco melhores, no geral.
Lenovo Legion Y520-15IKBN 80WK0042GE
- 10/02/2017 v6 (old)
Sascha Mölck