Breve Análise do Portátil Asus ROG Chimera G703 (i7-7820HK, GTX 1080, Full HD)
| SD Card Reader | |
| average JPG Copy Test (av. of 3 runs) | |
| Schenker XMG Ultra 17 (Toshiba Exceria Pro SDXC 64 GB UHS-II) | |
| Asus G703 (Toshiba Exceria Pro SDXC 64 GB UHS-II) | |
| Média da turma Gaming (20.9 - 210, n=54, últimos 2 anos) | |
| MSI GT75VR 7RF-012 Titan Pro (Toshiba Exceria Pro SDXC 64 GB UHS-II) | |
| Acer Predator 17 X GX-792-76DL (Toshiba Exceria Pro SDXC 64 GB UHS-II) | |
| maximum AS SSD Seq Read Test (1GB) | |
| Asus G703 (Toshiba Exceria Pro SDXC 64 GB UHS-II) | |
| Schenker XMG Ultra 17 (Toshiba Exceria Pro SDXC 64 GB UHS-II) | |
| Média da turma Gaming (25.5 - 261, n=51, últimos 2 anos) | |
| Acer Predator 17 X GX-792-76DL (Toshiba Exceria Pro SDXC 64 GB UHS-II) | |
| MSI GT75VR 7RF-012 Titan Pro (Toshiba Exceria Pro SDXC 64 GB UHS-II) | |
| |||||||||||||||||||||||||
iluminação: 80 %
iluminação com acumulador: 274 cd/m²
Contraste: 945:1 (Preto: 0.29 cd/m²)
ΔE ColorChecker Calman: 3.99 | ∀{0.5-29.43 Ø4.71}
calibrated: 1.79
ΔE Greyscale Calman: 4.14 | ∀{0.09-98 Ø4.96}
92% sRGB (Argyll 1.6.3 3D)
60% AdobeRGB 1998 (Argyll 1.6.3 3D)
66.6% AdobeRGB 1998 (Argyll 3D)
92.4% sRGB (Argyll 3D)
65.5% Display P3 (Argyll 3D)
Gamma: 2.58
CCT: 7352 K
| Asus G703 AUO B173HAN03.0 (AUO309D), IPS, 1920x1080 | Schenker XMG Ultra 17 AU Optronics B173ZAN01.0 (AUO109B), IPS, 3840x2160 | Acer Predator 17 X GX-792-76DL LP173WF4-SPF5 (LGD056D), IPS, 1920x1080 | MSI GT75VR 7RF-012 Titan Pro CMN N173HHE-G32 (CMN1747), TN LED, 1920x1080 | Alienware 17 R4 TN LED, 2560x1440 | |
|---|---|---|---|---|---|
| Display | 30% | -5% | 25% | -9% | |
| Display P3 Coverage (%) | 65.5 | 86.4 32% | 66 1% | 90.3 38% | 61.2 -7% |
| sRGB Coverage (%) | 92.4 | 100 8% | 83.7 -9% | 99.6 8% | 82.9 -10% |
| AdobeRGB 1998 Coverage (%) | 66.6 | 99.1 49% | 61.2 -8% | 86.8 30% | 60.5 -9% |
| Response Times | -136% | -153% | 37% | -42% | |
| Response Time Grey 50% / Grey 80% * (ms) | 17.6 ? | 44 ? -150% | 45 ? -156% | 11.6 ? 34% | 30 ? -70% |
| Response Time Black / White * (ms) | 11.2 ? | 24.8 ? -121% | 28 ? -150% | 6.8 ? 39% | 12.8 ? -14% |
| PWM Frequency (Hz) | 25000 ? | ||||
| Screen | 15% | 4% | 26% | -16% | |
| Brightness middle (cd/m²) | 274 | 332 21% | 380 39% | 274 0% | 402.3 47% |
| Brightness (cd/m²) | 268 | 313 17% | 362 35% | 262 -2% | 372 39% |
| Brightness Distribution (%) | 80 | 88 10% | 91 14% | 87 9% | 86 8% |
| Black Level * (cd/m²) | 0.29 | 0.28 3% | 0.37 -28% | 0.26 10% | 0.62 -114% |
| Contrast (:1) | 945 | 1186 26% | 1027 9% | 1054 12% | 649 -31% |
| Colorchecker dE 2000 * | 3.99 | 3.86 3% | 4.12 -3% | 1.36 66% | 5.6 -40% |
| Colorchecker dE 2000 max. * | 7.33 | 5.88 20% | 8.19 -12% | 4.1 44% | 9.8 -34% |
| Colorchecker dE 2000 calibrated * | 1.79 | ||||
| Greyscale dE 2000 * | 4.14 | 4.33 -5% | 3.95 5% | 0.64 85% | 4.7 -14% |
| Gamma | 2.58 85% | 2.41 91% | 2.47 89% | 2.19 100% | 2.14 103% |
| CCT | 7352 88% | 6595 99% | 6539 99% | 6551 99% | 7519 86% |
| Color Space (Percent of AdobeRGB 1998) (%) | 60 | 88 47% | 55 -8% | 77 28% | 53.7 -10% |
| Color Space (Percent of sRGB) (%) | 92 | 100 9% | 84 -9% | 100 9% | 82.2 -11% |
| Média Total (Programa/Configurações) | -30% /
-2% | -51% /
-19% | 29% /
27% | -22% /
-18% |
* ... menor é melhor
Exibir tempos de resposta
| ↔ Tempo de resposta preto para branco | ||
|---|---|---|
| 11.2 ms ... ascensão ↗ e queda ↘ combinadas | ↗ 6 ms ascensão | 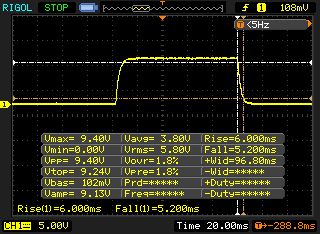 |
| ↘ 5.2 ms queda | ||
| A tela mostra boas taxas de resposta em nossos testes, mas pode ser muito lenta para jogadores competitivos. Em comparação, todos os dispositivos testados variam de 0.1 (mínimo) a 240 (máximo) ms. » 30 % de todos os dispositivos são melhores. Isso significa que o tempo de resposta medido é melhor que a média de todos os dispositivos testados (19.8 ms). | ||
| ↔ Tempo de resposta 50% cinza a 80% cinza | ||
| 17.6 ms ... ascensão ↗ e queda ↘ combinadas | ↗ 8.4 ms ascensão | 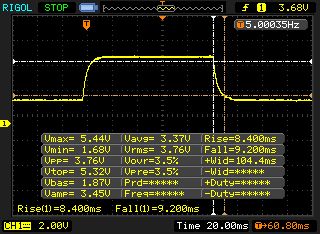 |
| ↘ 9.2 ms queda | ||
| A tela mostra boas taxas de resposta em nossos testes, mas pode ser muito lenta para jogadores competitivos. Em comparação, todos os dispositivos testados variam de 0.165 (mínimo) a 636 (máximo) ms. » 32 % de todos os dispositivos são melhores. Isso significa que o tempo de resposta medido é melhor que a média de todos os dispositivos testados (31 ms). | ||
Cintilação da tela / PWM (modulação por largura de pulso)
| Tela tremeluzindo / PWM não detectado | 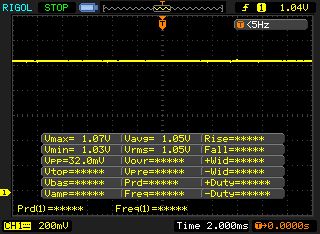 | ||
[pwm_comparison] Em comparação: 52 % de todos os dispositivos testados não usam PWM para escurecer a tela. Se PWM foi detectado, uma média de 7754 (mínimo: 5 - máximo: 343500) Hz foi medida. | |||
| PCMark 8 Home Score Accelerated v2 | 5944 pontos | |
| PCMark 8 Work Score Accelerated v2 | 6016 pontos | |
| PCMark 10 Score | 5035 pontos | |
Ajuda | ||
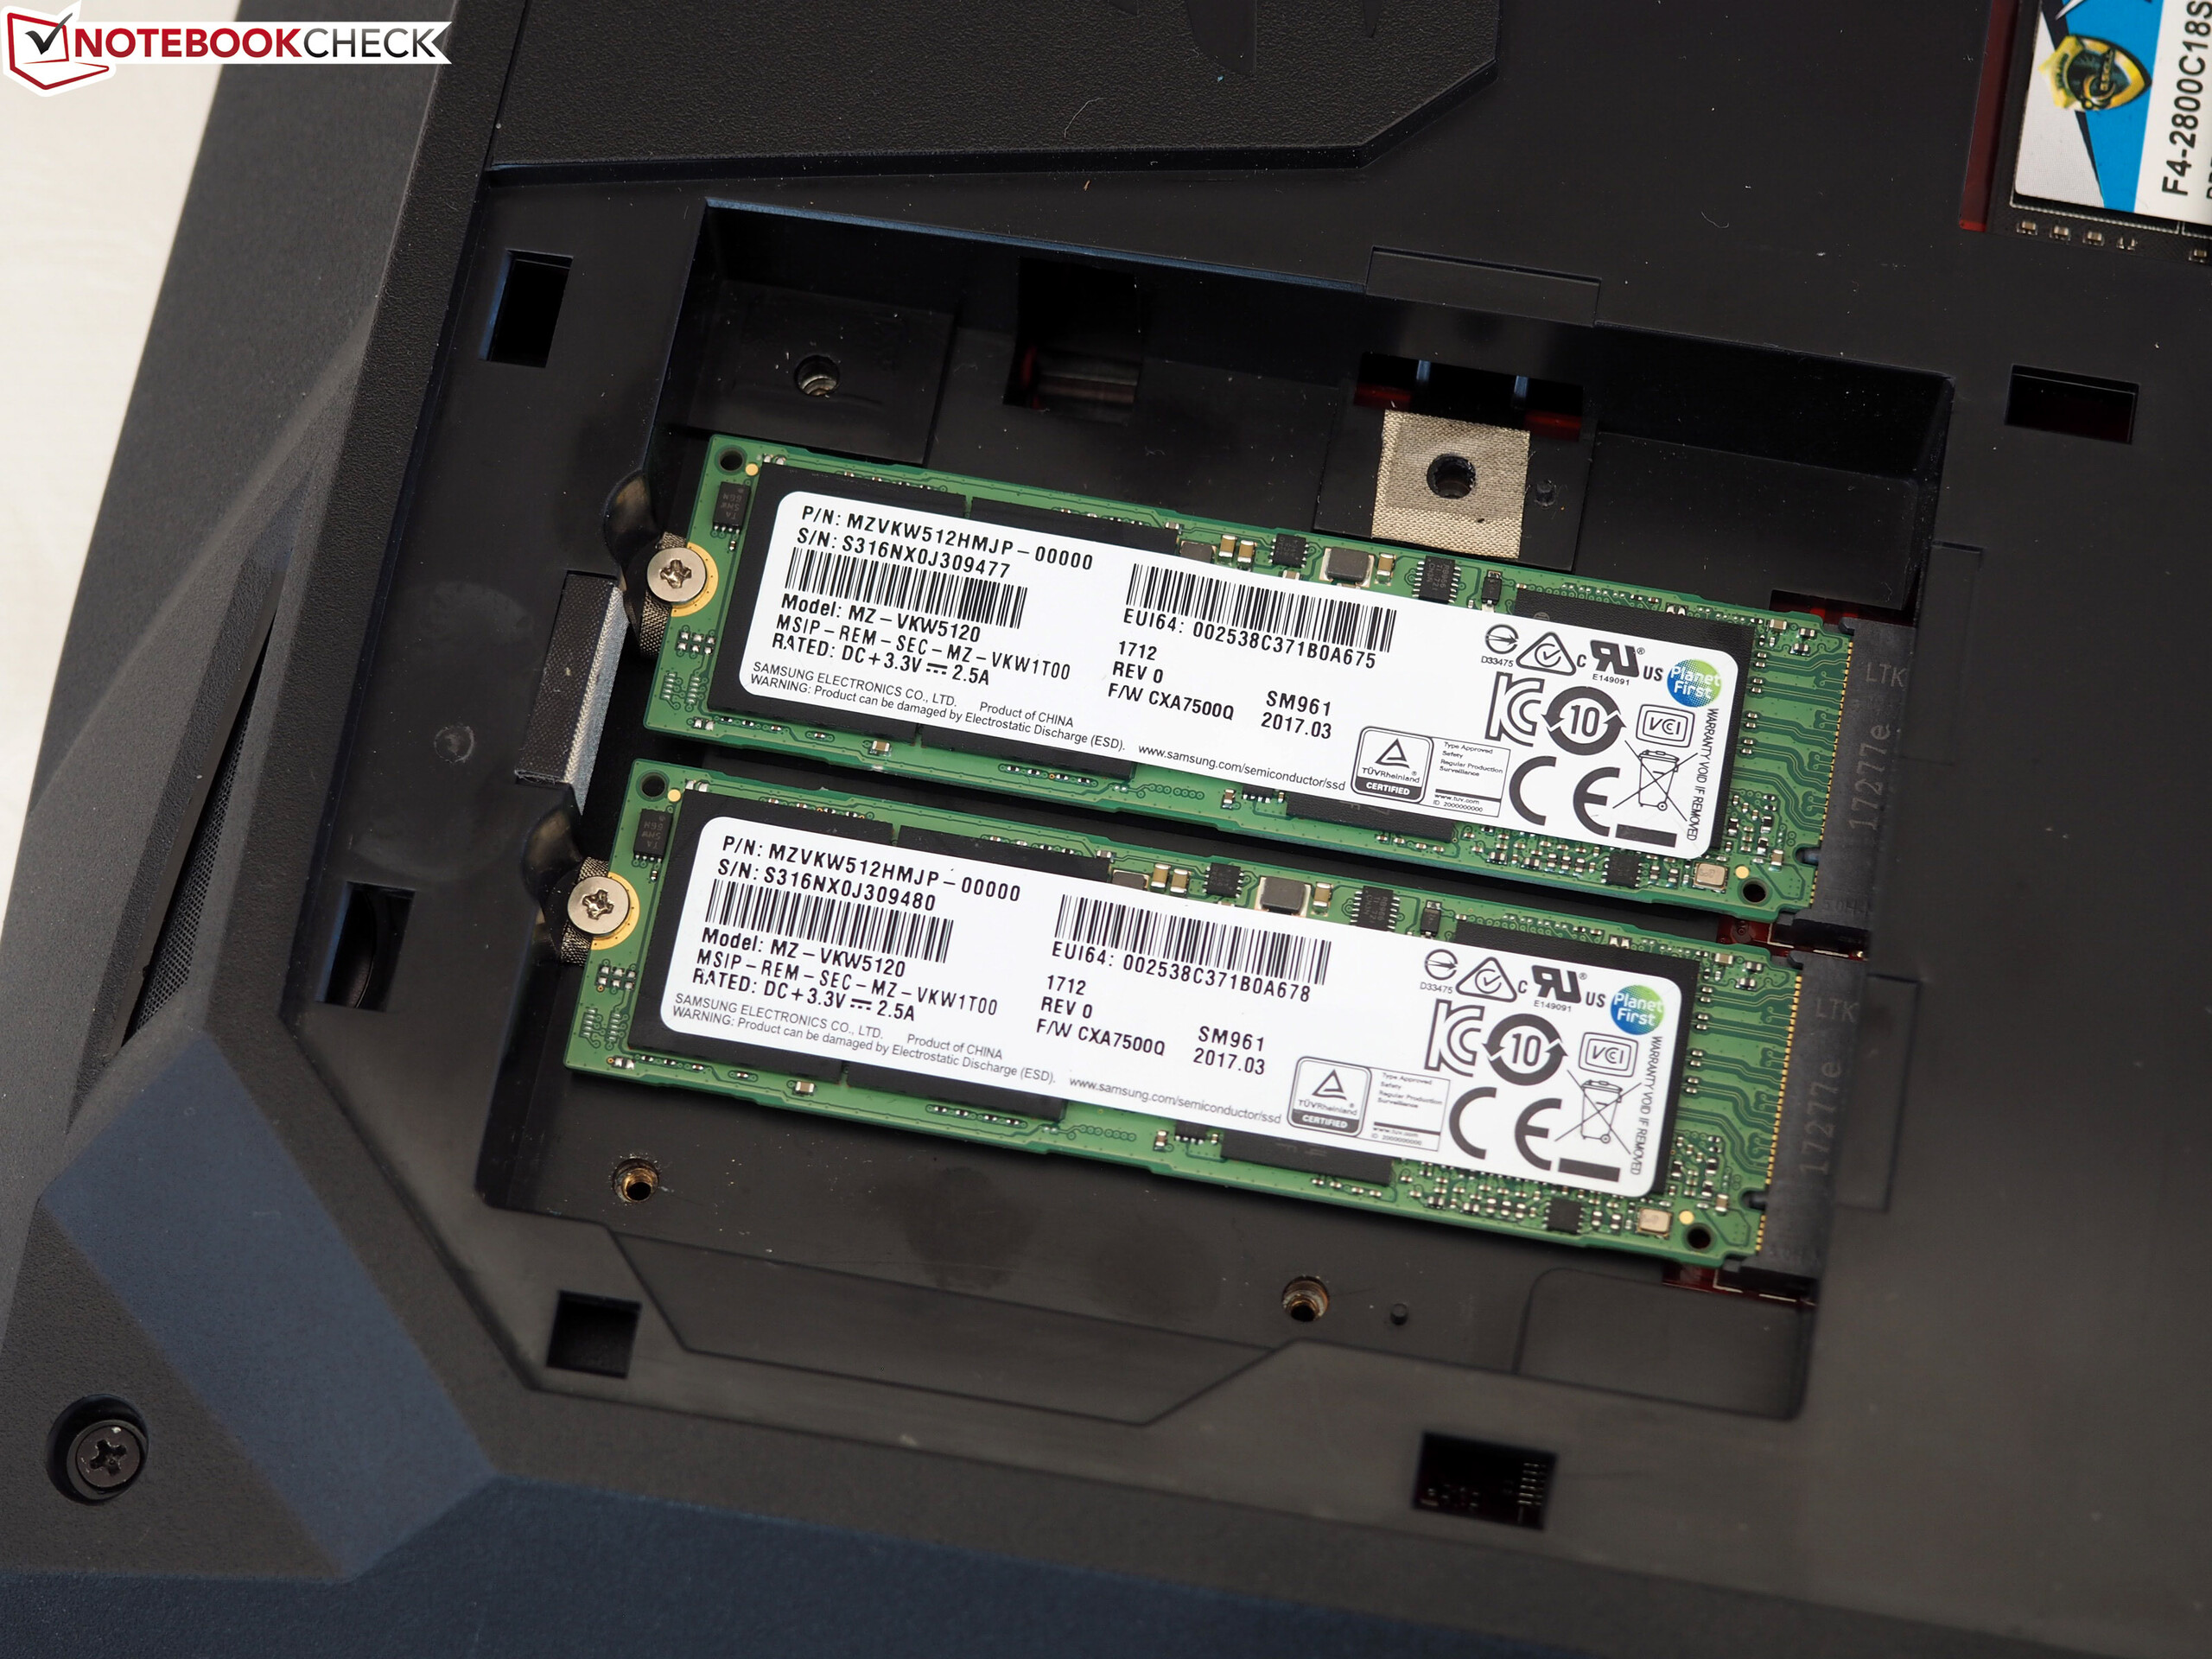
| Asus G703 2x Samsung SM961 MZVKW512HMJP NVMe (RAID 0) | Schenker XMG Ultra 17 Samsung SSD 960 Evo 500GB m.2 NVMe | Acer Predator 17 X GX-792-76DL Toshiba NVMe THNSN5512GPU7 | MSI GT75VR 7RF-012 Titan Pro 2x Samsung SM961 MZVPW256HEGL NVMe (RAID 0) | Alienware 17 R4 SK Hynix PC300 NVMe 512 GB | Média 2x Samsung SM961 MZVKW512HMJP NVMe (RAID 0) | |
|---|---|---|---|---|---|---|
| AS SSD | -7% | -30% | -9% | -44% | 0% | |
| Seq Read (MB/s) | 3177 | 2533 -20% | 2261 -29% | 3137 -1% | 1752 -45% | 3177 ? 0% |
| Seq Write (MB/s) | 2556 | 1771 -31% | 1338 -48% | 2352 -8% | 735 -71% | 2556 ? 0% |
| 4K Read (MB/s) | 47.61 | 43.65 -8% | 39.52 -17% | 50.1 5% | 35.61 -25% | 47.6 ? 0% |
| 4K Write (MB/s) | 148.4 | 139.5 -6% | 133.8 -10% | 128.8 -13% | 113.4 -24% | 148.4 ? 0% |
| Score Read (Points) | 1633 | 1716 5% | 1118 -32% | 1412 -14% | 831 -49% | 1633 ? 0% |
| Score Write (Points) | 1519 | 1615 6% | 930 -39% | 1289 -15% | 858 -44% | 1519 ? 0% |
| Score Total (Points) | 3962 | 4173 5% | 2581 -35% | 3392 -14% | 2072 -48% | 3962 ? 0% |

| 3DMark 11 Performance | 21293 pontos | |
| 3DMark Cloud Gate Standard Score | 35865 pontos | |
| 3DMark Fire Strike Score | 17502 pontos | |
Ajuda | ||
| The Witcher 3 - 1920x1080 Ultra Graphics & Postprocessing (HBAO+) | |
| Média da turma Gaming (104.7 - 240, n=7, últimos 2 anos) | |
| Alienware 17 R4 | |
| Asus G703 | |
| MSI GT75VR 7RF-012 Titan Pro | |
| Schenker XMG Ultra 17 | |
| Média NVIDIA GeForce GTX 1080 Mobile (61.7 - 78.1, n=23) | |
| Acer Predator 17 X GX-792-76DL | |
| baixo | média | alto | ultra | |
|---|---|---|---|---|
| The Witcher 3 (2015) | 148 | 77.9 | ||
| FIFA 18 (2017) | 357 | 348 | ||
| The Evil Within 2 (2017) | 78.3 | 76.1 | ||
| ELEX (2017) | 119 | 104 | ||
| Wolfenstein II: The New Colossus (2017) | 145 | 125 | ||
| Assassin´s Creed Origins (2017) | 98 | 83 | ||
| Call of Duty WWII (2017) | 160 | 136 | ||
| Need for Speed Payback (2017) | 144 | 135 | ||
| Star Wars Battlefront 2 (2017) | 147 | 124 | ||
| Fortnite (2018) | 216 | 159 | ||
| Final Fantasy XV Benchmark (2018) | 80 | |||
| Kingdom Come: Deliverance (2018) | 100 | 76.4 |
Barulho
| Ocioso |
| 35 / 36 / 38 dB |
| Carga |
| 46 / 54 dB |
 | ||
30 dB silencioso 40 dB(A) audível 50 dB(A) ruidosamente alto |
||
min: | ||
| Asus G703 GeForce GTX 1080 Mobile, i7-7820HK | Schenker XMG Ultra 17 GeForce GTX 1080 Mobile, i7-8700 | Acer Predator 17 X GX-792-76DL GeForce GTX 1080 Mobile, i7-7820HK | MSI GT75VR 7RF-012 Titan Pro GeForce GTX 1080 Mobile, i7-7820HK | Alienware 17 R4 GeForce GTX 1080 Mobile, i7-7820HK | |
|---|---|---|---|---|---|
| Noise | -2% | 5% | -2% | 1% | |
| desligado / ambiente * (dB) | 30 | 30 -0% | 30 -0% | 30 -0% | 28.2 6% |
| Idle Minimum * (dB) | 35 | 34 3% | 33 6% | 33 6% | 35.6 -2% |
| Idle Average * (dB) | 36 | 35 3% | 35 3% | 34 6% | 35.6 1% |
| Idle Maximum * (dB) | 38 | 40 -5% | 37 3% | 38 -0% | 35.7 6% |
| Load Average * (dB) | 46 | 45 2% | 40 13% | 44 4% | 50.2 -9% |
| Witcher 3 ultra * (dB) | 48 | 52 -8% | 56 -17% | 50.2 -5% | |
| Load Maximum * (dB) | 54 | 60 -11% | 50 7% | 62 -15% | 50.2 7% |
* ... menor é melhor
(-) A temperatura máxima no lado superior é 55 °C / 131 F, em comparação com a média de 40.4 °C / 105 F , variando de 21.2 a 68.8 °C para a classe Gaming.
(-) A parte inferior aquece até um máximo de 54 °C / 129 F, em comparação com a média de 43.2 °C / 110 F
(+) Em uso inativo, a temperatura média para o lado superior é 27.1 °C / 81 F, em comparação com a média do dispositivo de 33.9 °C / ### class_avg_f### F.
(±) Jogando The Witcher 3, a temperatura média para o lado superior é 36.2 °C / 97 F, em comparação com a média do dispositivo de 33.9 °C / ## #class_avg_f### F.
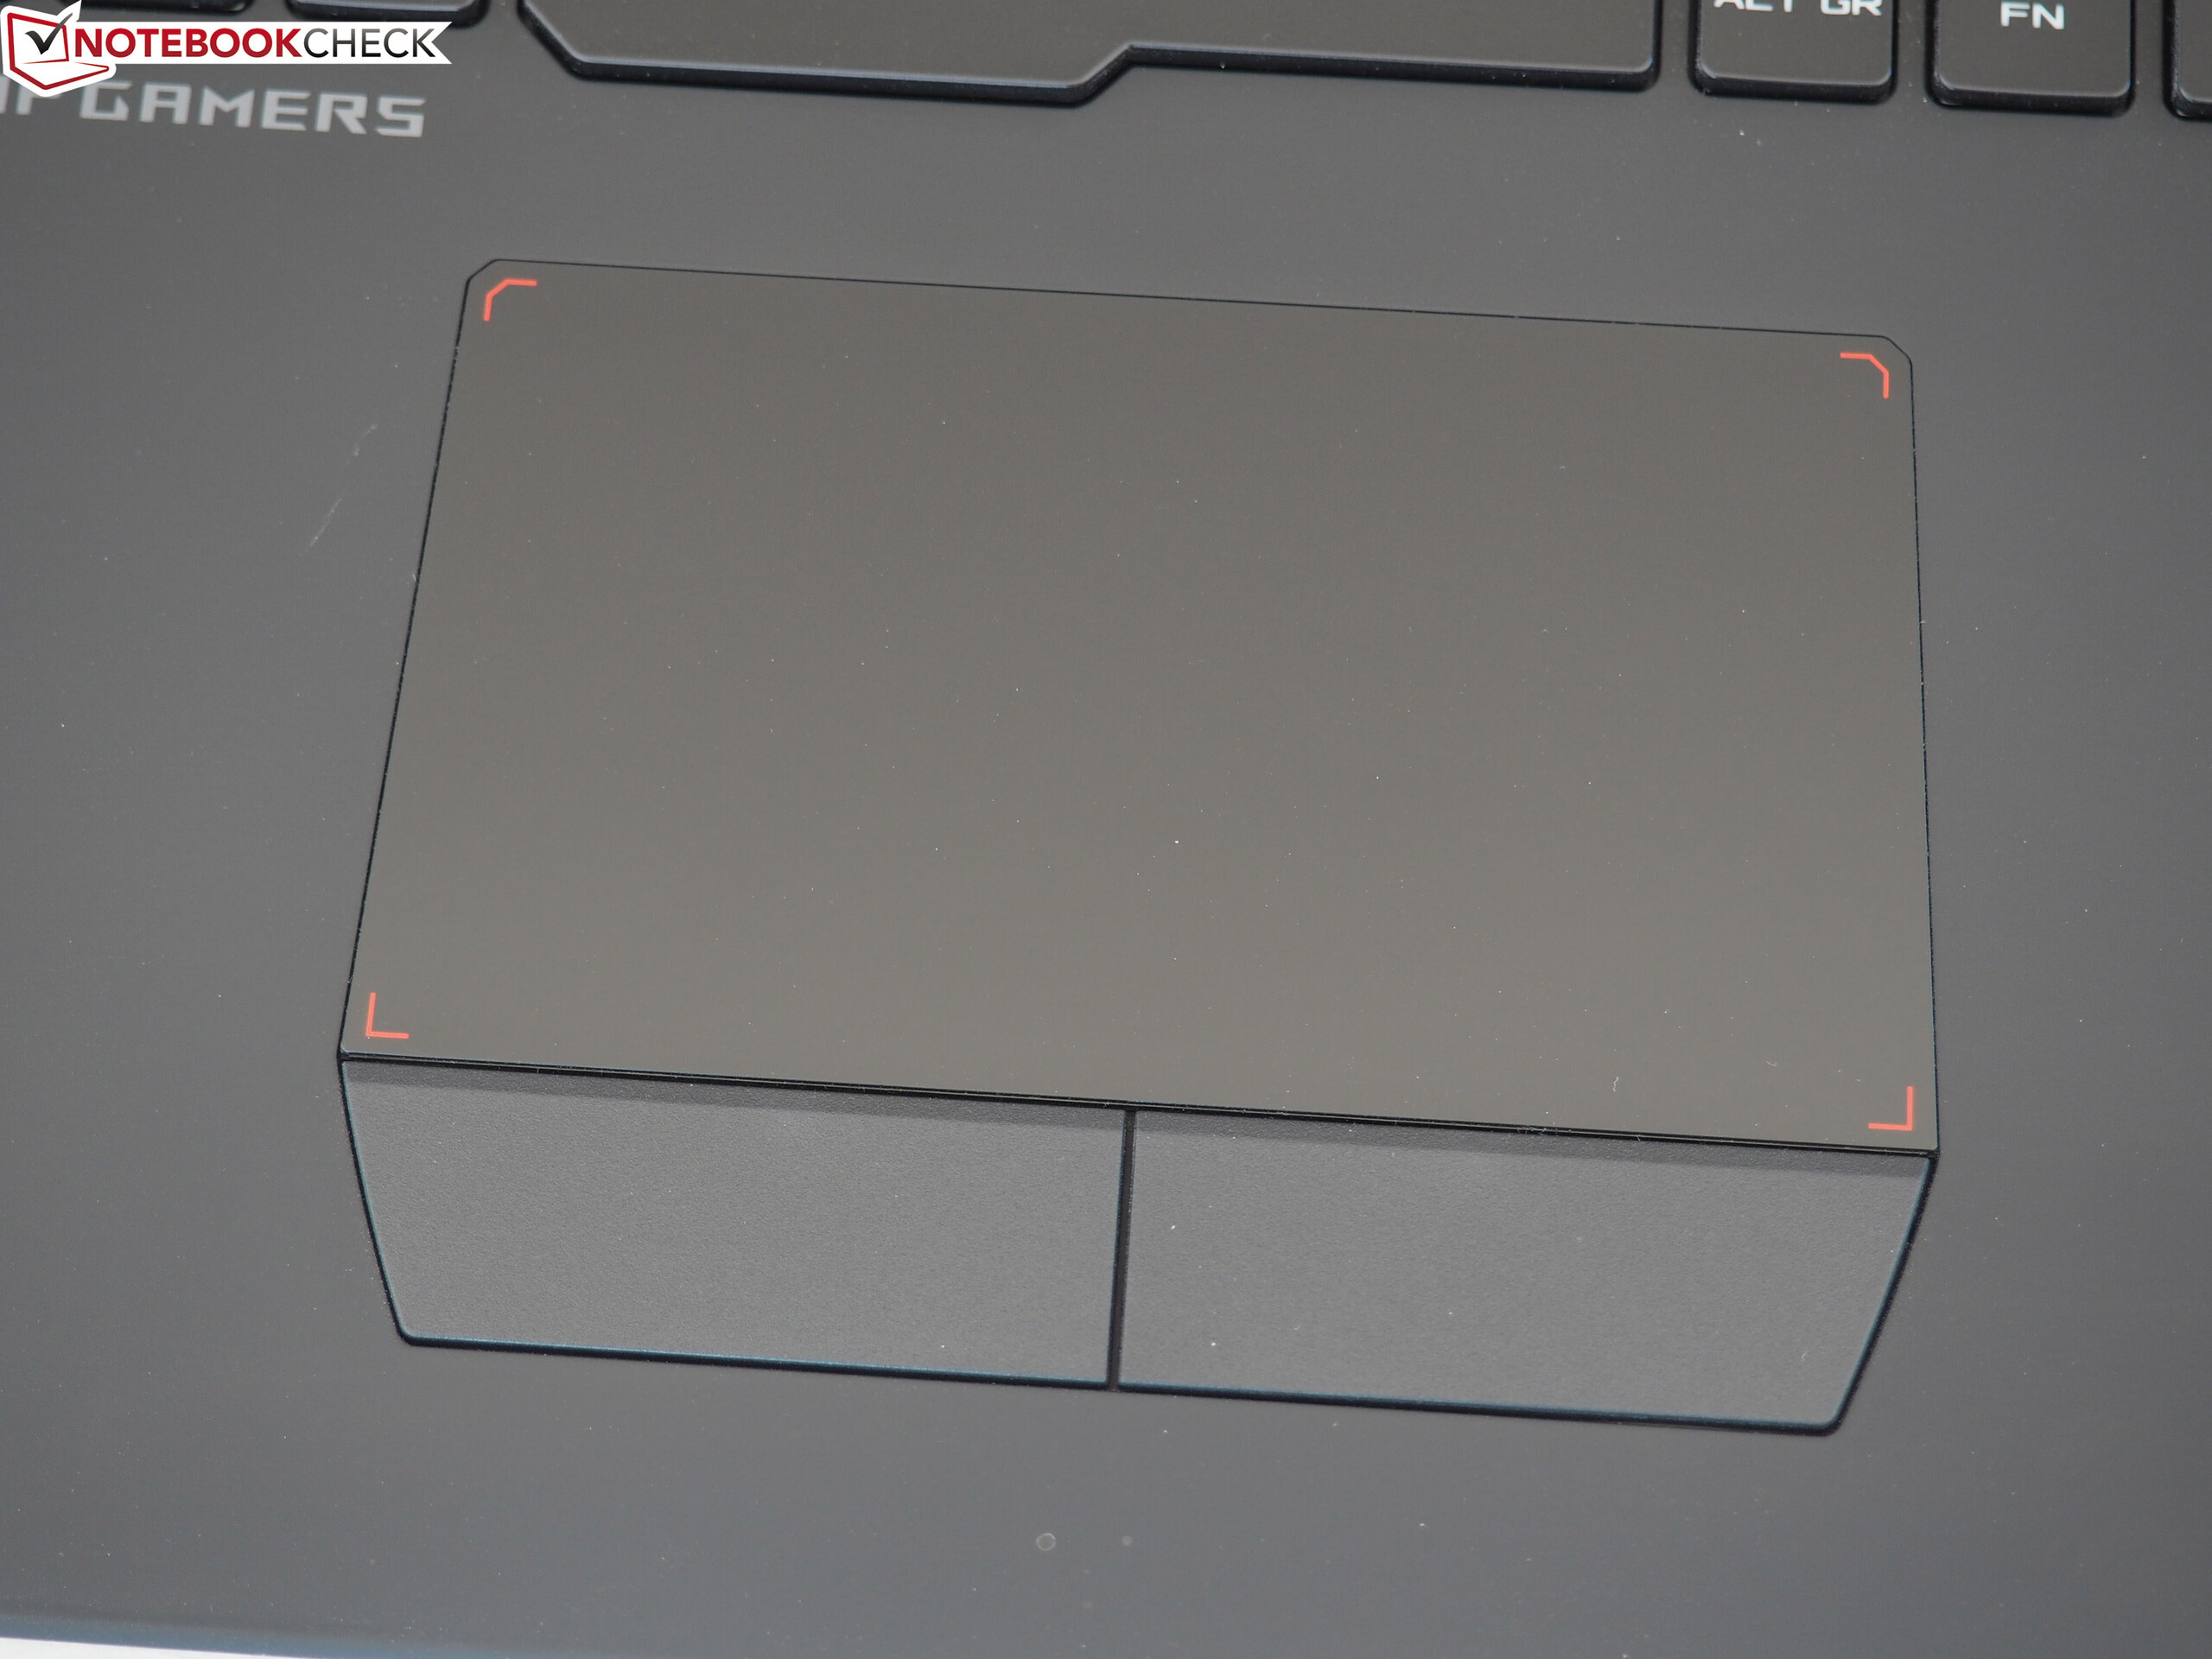
(+) Os apoios para as mãos e o touchpad são mais frios que a temperatura da pele, com um máximo de 28 °C / 82.4 F e, portanto, são frios ao toque.
(±) A temperatura média da área do apoio para as mãos de dispositivos semelhantes foi 28.8 °C / 83.8 F (+0.8 °C / 1.4 F).
| Asus G703 GeForce GTX 1080 Mobile, i7-7820HK | Schenker XMG Ultra 17 GeForce GTX 1080 Mobile, i7-8700 | Acer Predator 17 X GX-792-76DL GeForce GTX 1080 Mobile, i7-7820HK | MSI GT75VR 7RF-012 Titan Pro GeForce GTX 1080 Mobile, i7-7820HK | Alienware 17 R4 GeForce GTX 1080 Mobile, i7-7820HK | |
|---|---|---|---|---|---|
| Heat | 6% | 7% | -4% | 3% | |
| Maximum Upper Side * (°C) | 55 | 41 25% | 44.2 20% | 46 16% | 49.6 10% |
| Maximum Bottom * (°C) | 54 | 48 11% | 43 20% | 57 -6% | 56 -4% |
| Idle Upper Side * (°C) | 29 | 30 -3% | 32.4 -12% | 34 -17% | 29.6 -2% |
| Idle Bottom * (°C) | 32 | 35 -9% | 32.8 -2% | 35 -9% | 29.2 9% |
* ... menor é melhor
Asus G703 análise de áudio
(+) | os alto-falantes podem tocar relativamente alto (###valor### dB)
Graves 100 - 315Hz
(±) | graves reduzidos - em média 7.5% menor que a mediana
(+) | o baixo é linear (5.9% delta para a frequência anterior)
Médios 400 - 2.000 Hz
(+) | médios equilibrados - apenas 4.8% longe da mediana
(+) | médios são lineares (5% delta para frequência anterior)
Altos 2 - 16 kHz
(±) | máximos reduzidos - em média 5.4% menor que a mediana
(+) | os máximos são lineares (6.8% delta da frequência anterior)
Geral 100 - 16.000 Hz
(+) | o som geral é linear (11.1% diferença em relação à mediana)
Comparado com a mesma classe
» 8% de todos os dispositivos testados nesta classe foram melhores, 3% semelhantes, 89% piores
» O melhor teve um delta de 6%, a média foi 18%, o pior foi 132%
Comparado com todos os dispositivos testados
» 7% de todos os dispositivos testados foram melhores, 2% semelhantes, 91% piores
» O melhor teve um delta de 4%, a média foi 23%, o pior foi 134%
Schenker XMG Ultra 17 análise de áudio
(±) | o volume do alto-falante é médio, mas bom (###valor### dB)
Graves 100 - 315Hz
(+) | bons graves - apenas 4.1% longe da mediana
(±) | a linearidade dos graves é média (12.2% delta para a frequência anterior)
Médios 400 - 2.000 Hz
(±) | médios mais altos - em média 5.5% maior que a mediana
(+) | médios são lineares (6.5% delta para frequência anterior)
Altos 2 - 16 kHz
(+) | agudos equilibrados - apenas 1.4% longe da mediana
(+) | os máximos são lineares (2% delta da frequência anterior)
Geral 100 - 16.000 Hz
(+) | o som geral é linear (11% diferença em relação à mediana)
Comparado com a mesma classe
» 7% de todos os dispositivos testados nesta classe foram melhores, 3% semelhantes, 89% piores
» O melhor teve um delta de 6%, a média foi 18%, o pior foi 132%
Comparado com todos os dispositivos testados
» 6% de todos os dispositivos testados foram melhores, 2% semelhantes, 92% piores
» O melhor teve um delta de 4%, a média foi 23%, o pior foi 134%
| desligado | |
| Ocioso | |
| Carga |
|
Key:
min: | |
| Asus G703 GeForce GTX 1080 Mobile, i7-7820HK | Schenker XMG Ultra 17 GeForce GTX 1080 Mobile, i7-8700 | Acer Predator 17 X GX-792-76DL GeForce GTX 1080 Mobile, i7-7820HK | MSI GT75VR 7RF-012 Titan Pro GeForce GTX 1080 Mobile, i7-7820HK | Alienware 17 R4 GeForce GTX 1080 Mobile, i7-7820HK | |
|---|---|---|---|---|---|
| Power Consumption | -7% | 4% | -14% | -4% | |
| Idle Minimum * (Watt) | 26 | 32 -23% | 27 -4% | 34 -31% | 37.5 -44% |
| Idle Average * (Watt) | 30 | 38 -27% | 32 -7% | 41 -37% | 37.6 -25% |
| Idle Maximum * (Watt) | 37 | 45 -22% | 41 -11% | 50 -35% | 37.6 -2% |
| Load Average * (Watt) | 123 | 96 22% | 102 17% | 106 14% | 122.4 -0% |
| Witcher 3 ultra * (Watt) | 257 | 237 8% | 257 -0% | 180.3 30% | |
| Load Maximum * (Watt) | 341 | 331 3% | 248 27% | 320 6% | 277.4 19% |
* ... menor é melhor
| Asus G703 GeForce GTX 1080 Mobile, i7-7820HK, 71 Wh | Schenker XMG Ultra 17 GeForce GTX 1080 Mobile, i7-8700, 82 Wh | Acer Predator 17 X GX-792-76DL GeForce GTX 1080 Mobile, i7-7820HK, 88.8 Wh | MSI GT75VR 7RF-012 Titan Pro GeForce GTX 1080 Mobile, i7-7820HK, 75 Wh | Alienware 17 R4 GeForce GTX 1080 Mobile, i7-7820HK, 99 Wh | Média da turma Gaming | |
|---|---|---|---|---|---|---|
| Duração da bateria | 4% | 59% | 3% | 31% | 162% | |
| Reader / Idle (h) | 3.3 | 2.7 -18% | 5.2 58% | 3 -9% | 4.6 39% | 8.27 ? 151% |
| H.264 (h) | 2.4 | 2.5 4% | 3.4 42% | 2.5 4% | 8.32 ? 247% | |
| WiFi v1.3 (h) | 2.5 | 2.4 -4% | 4.2 68% | 2.4 -4% | 3 20% | 7.11 ? 184% |
| Load (h) | 0.9 | 1.2 33% | 1.5 67% | 1.1 22% | 1.2 33% | 1.502 ? 67% |
Pro
Contra
No que diz respeito aos substitutos de desktop poderosos, o ROG Chimera G703 pode ocupar um lugar no pódio dos vencedores sem qualquer problema.
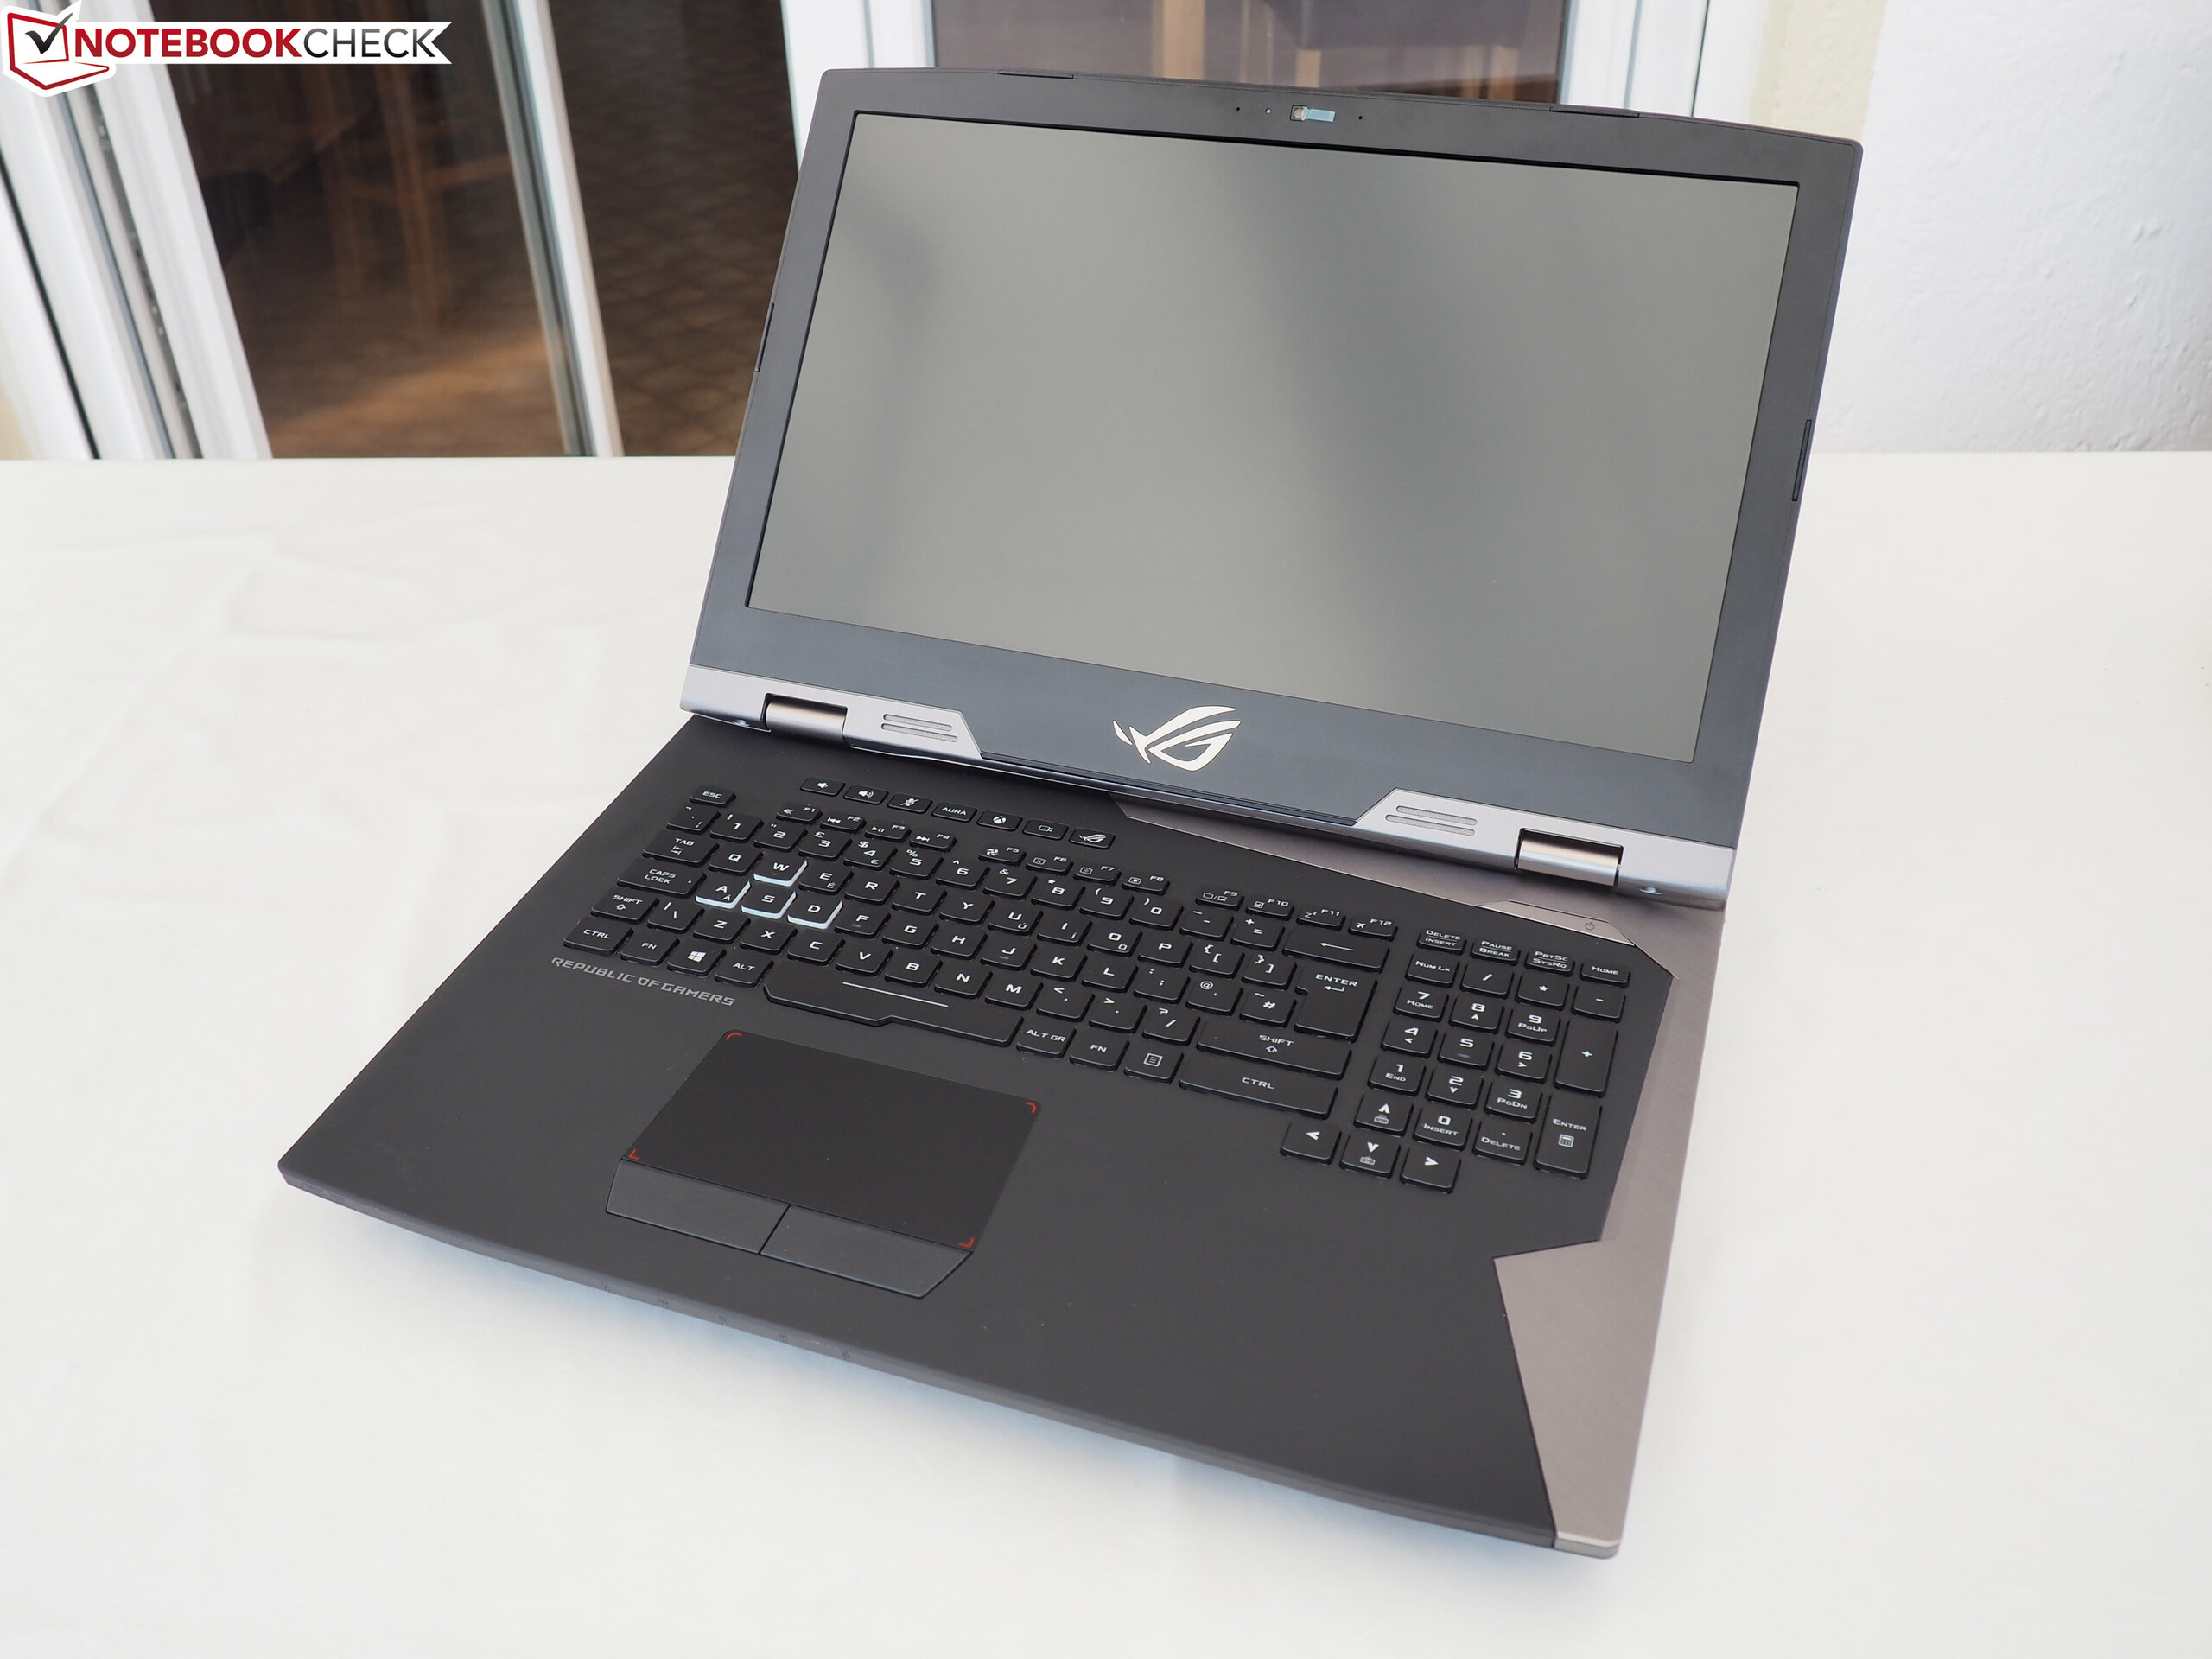
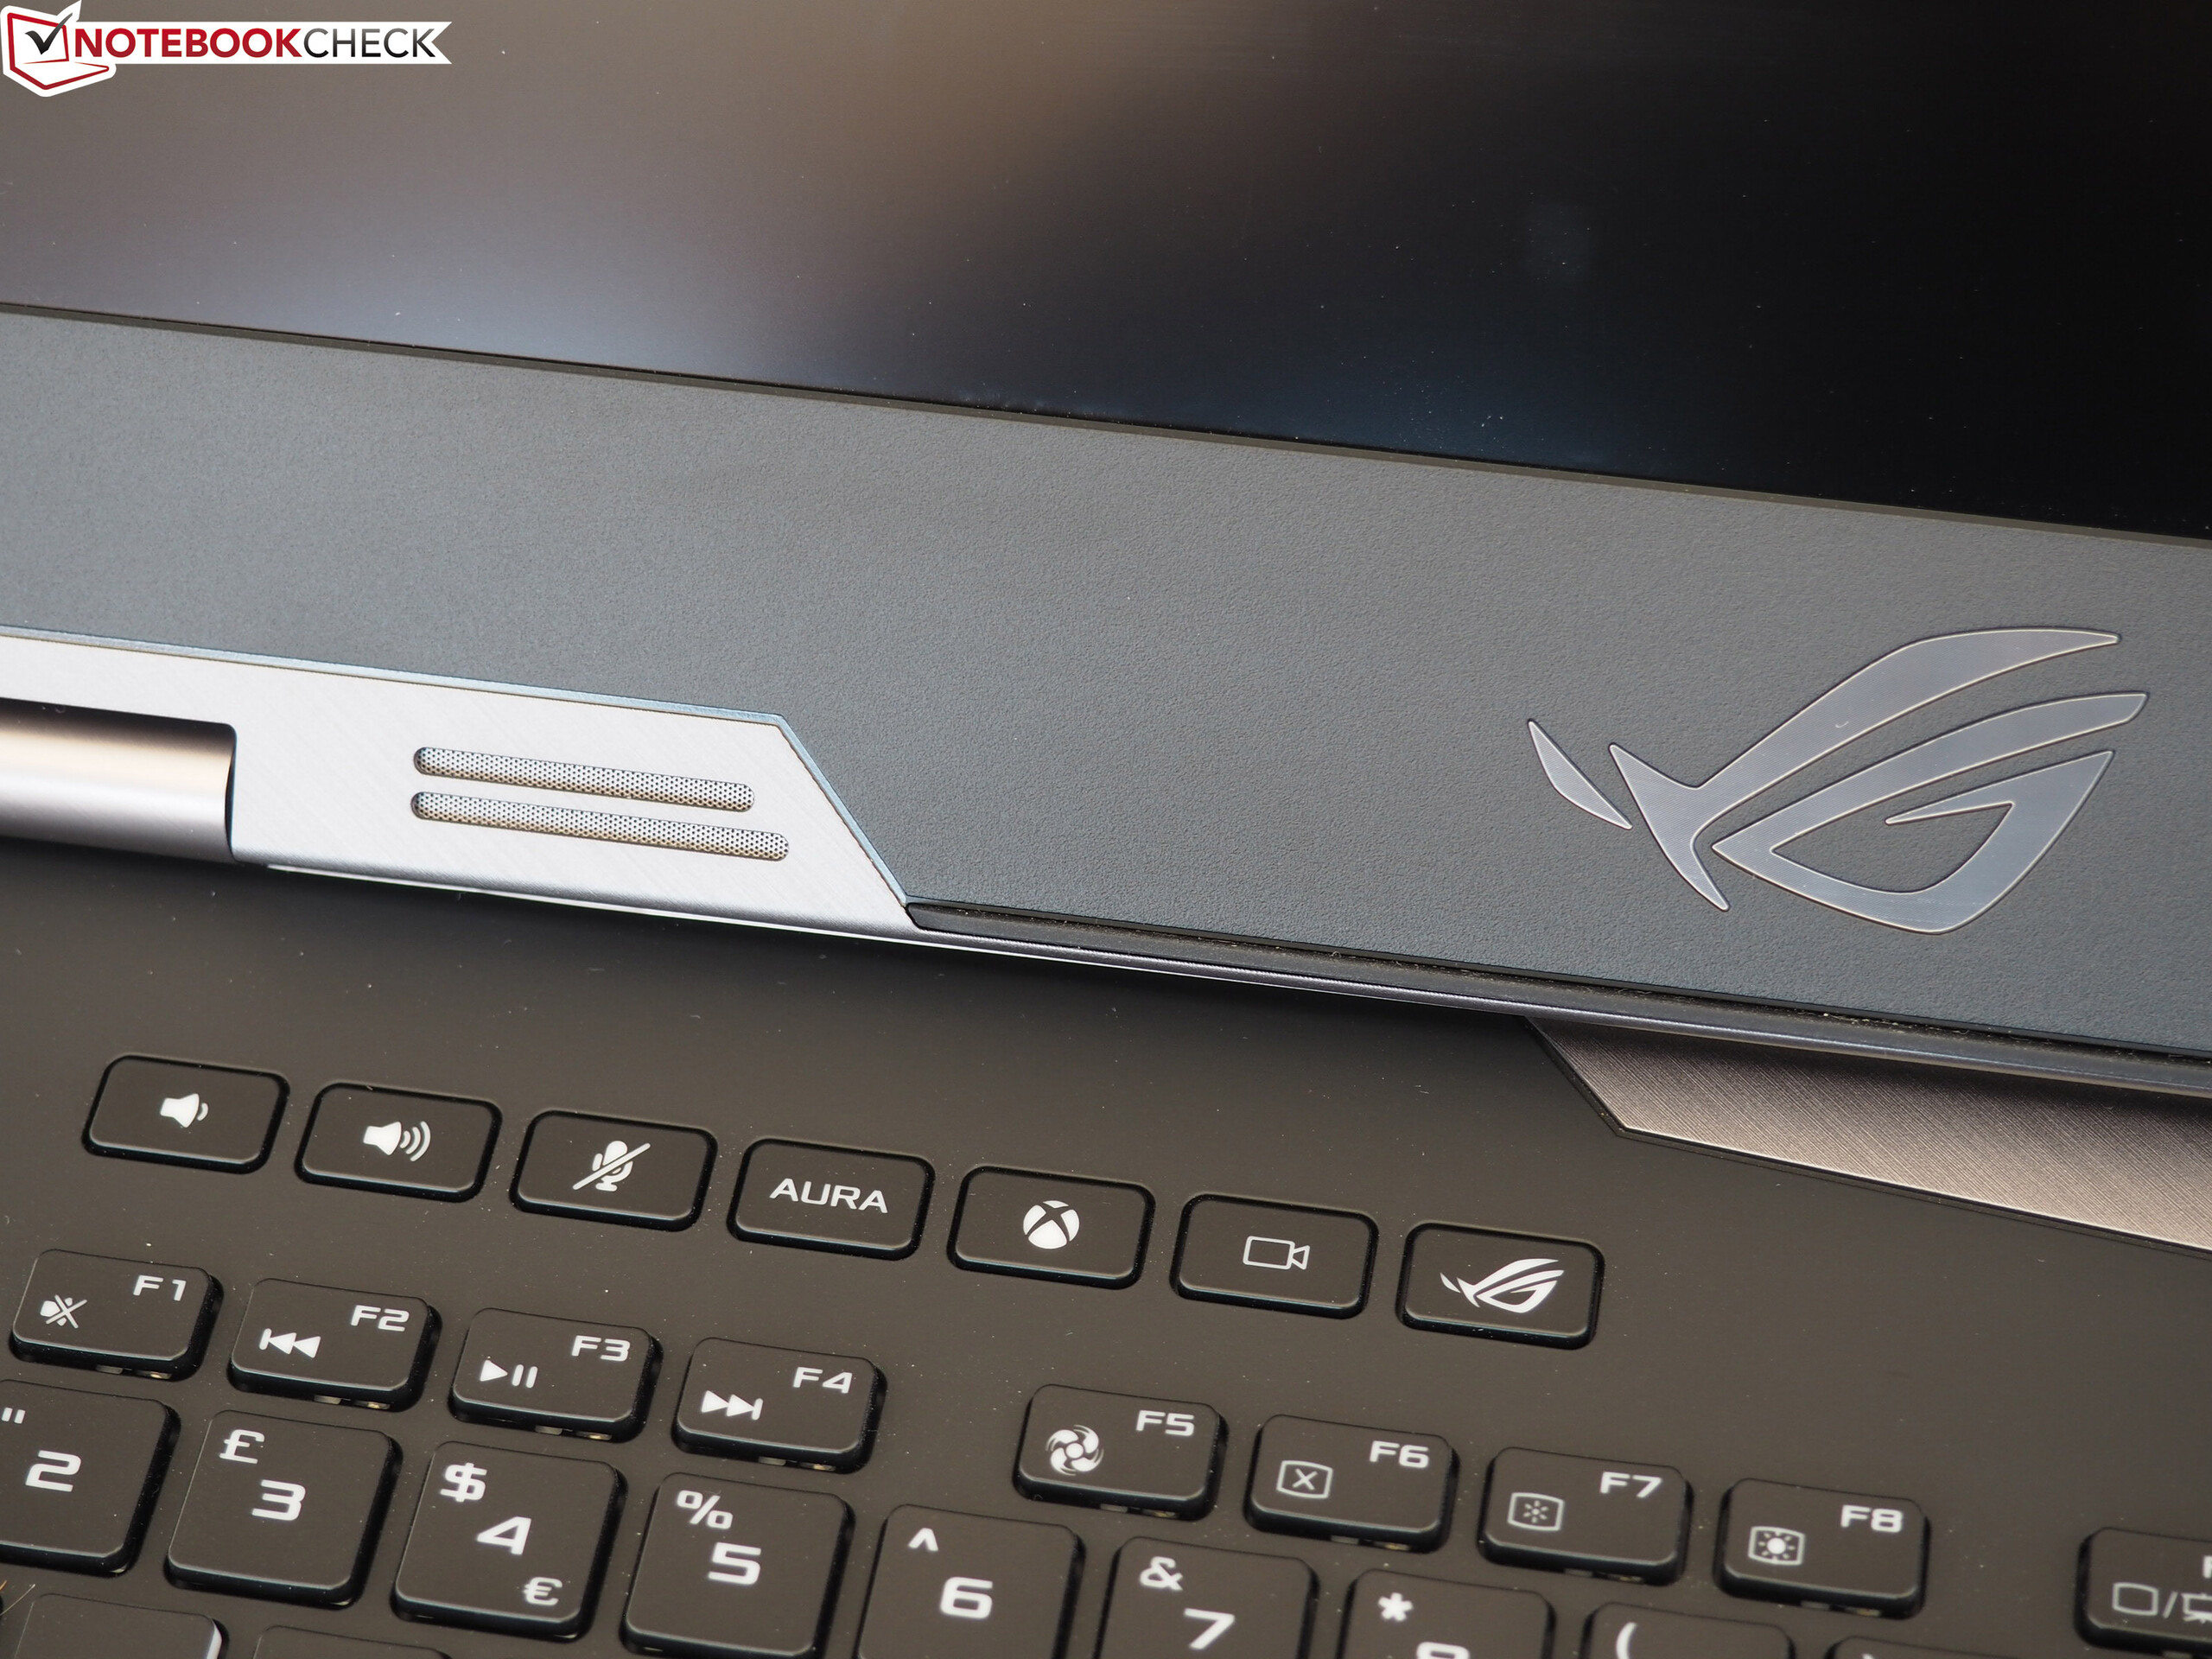
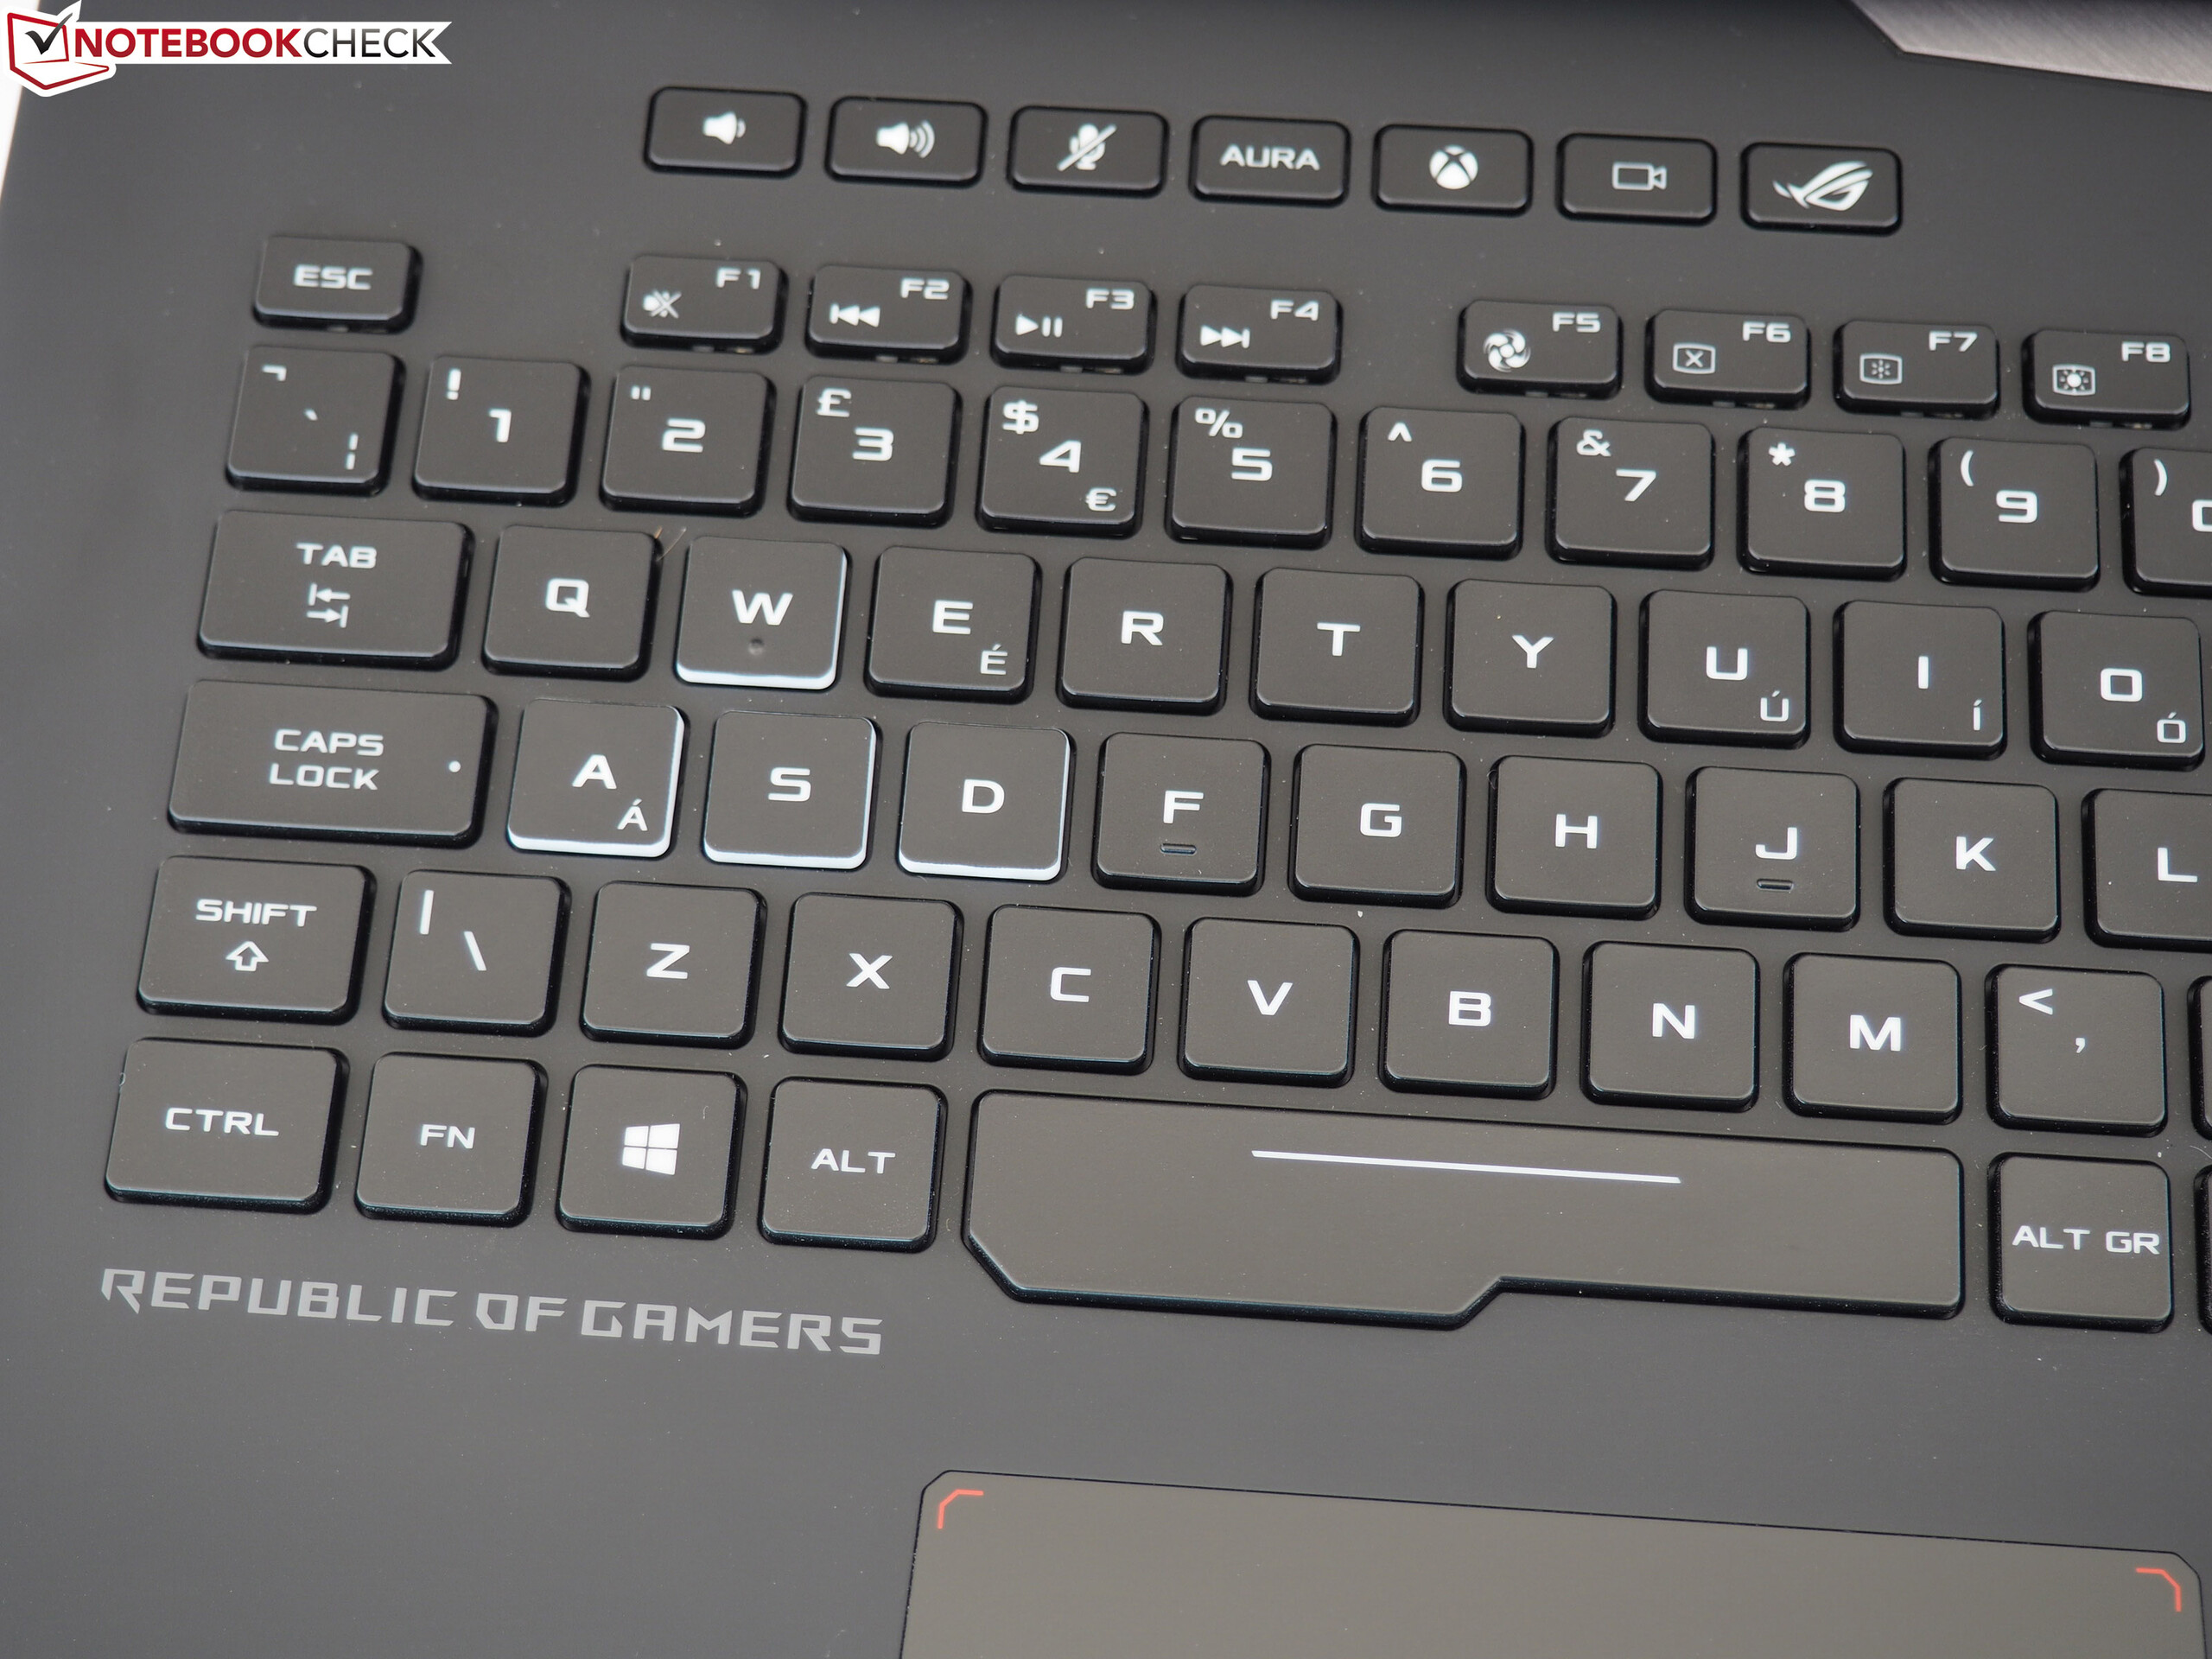
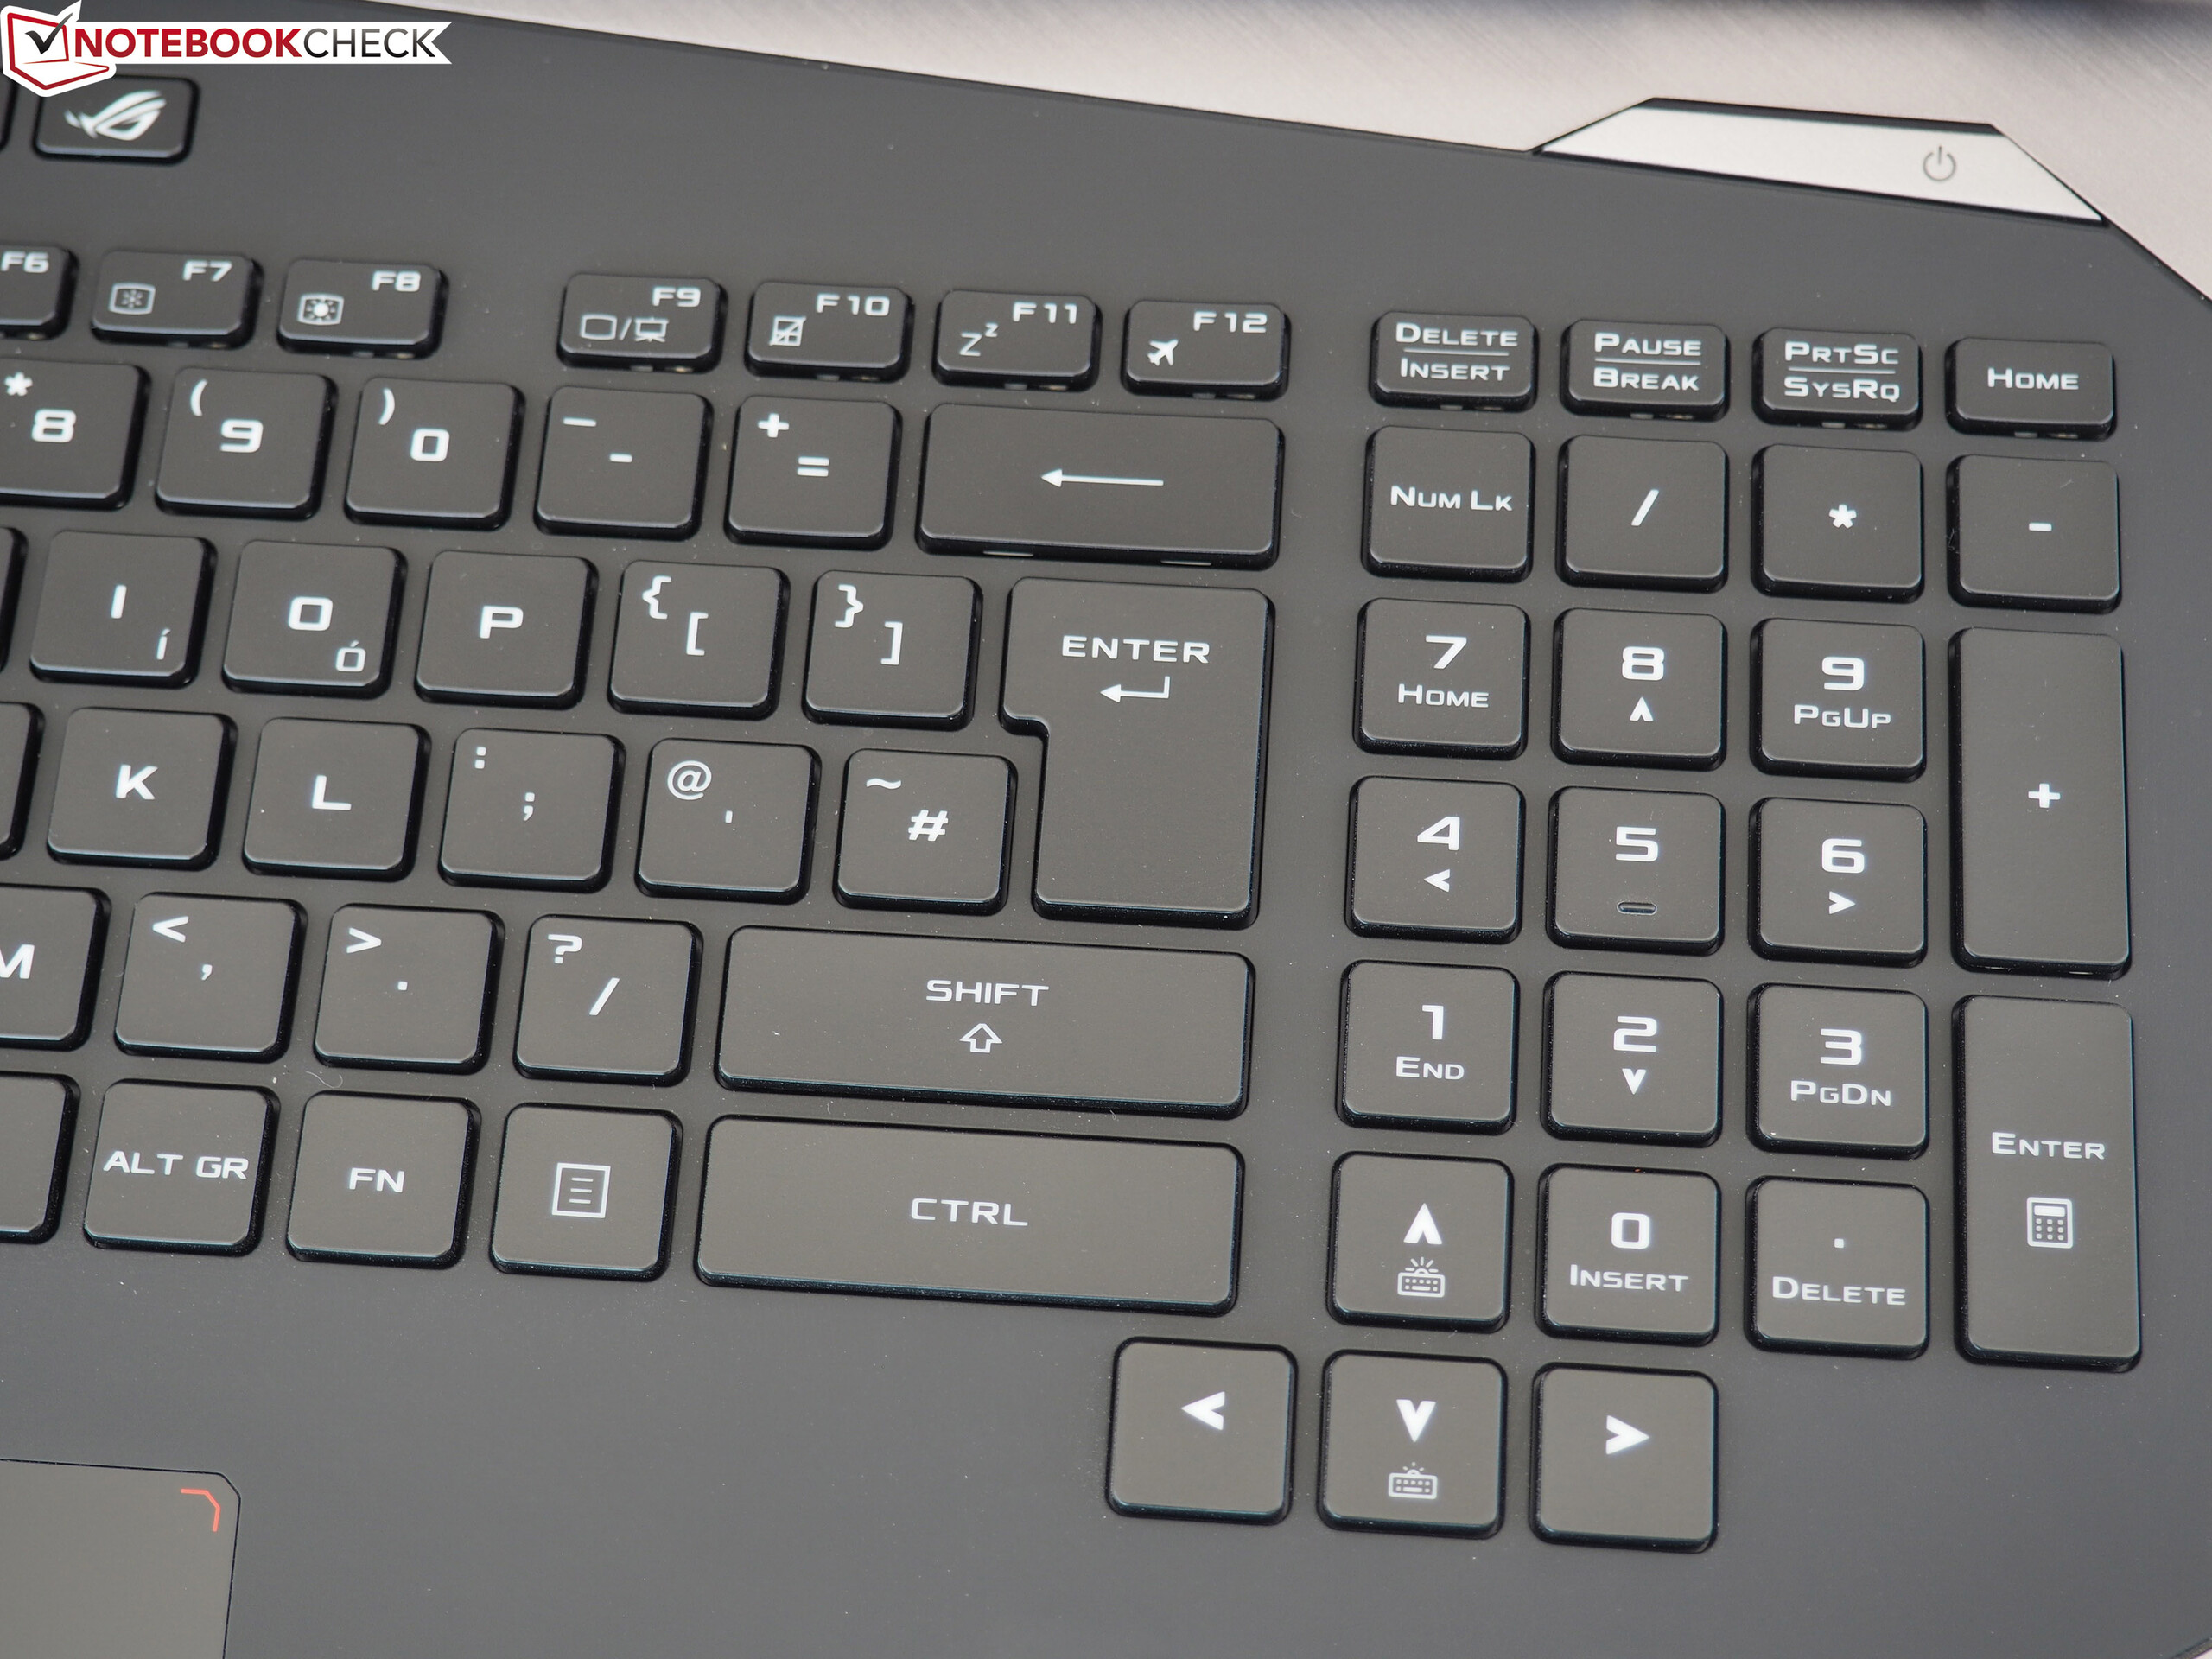
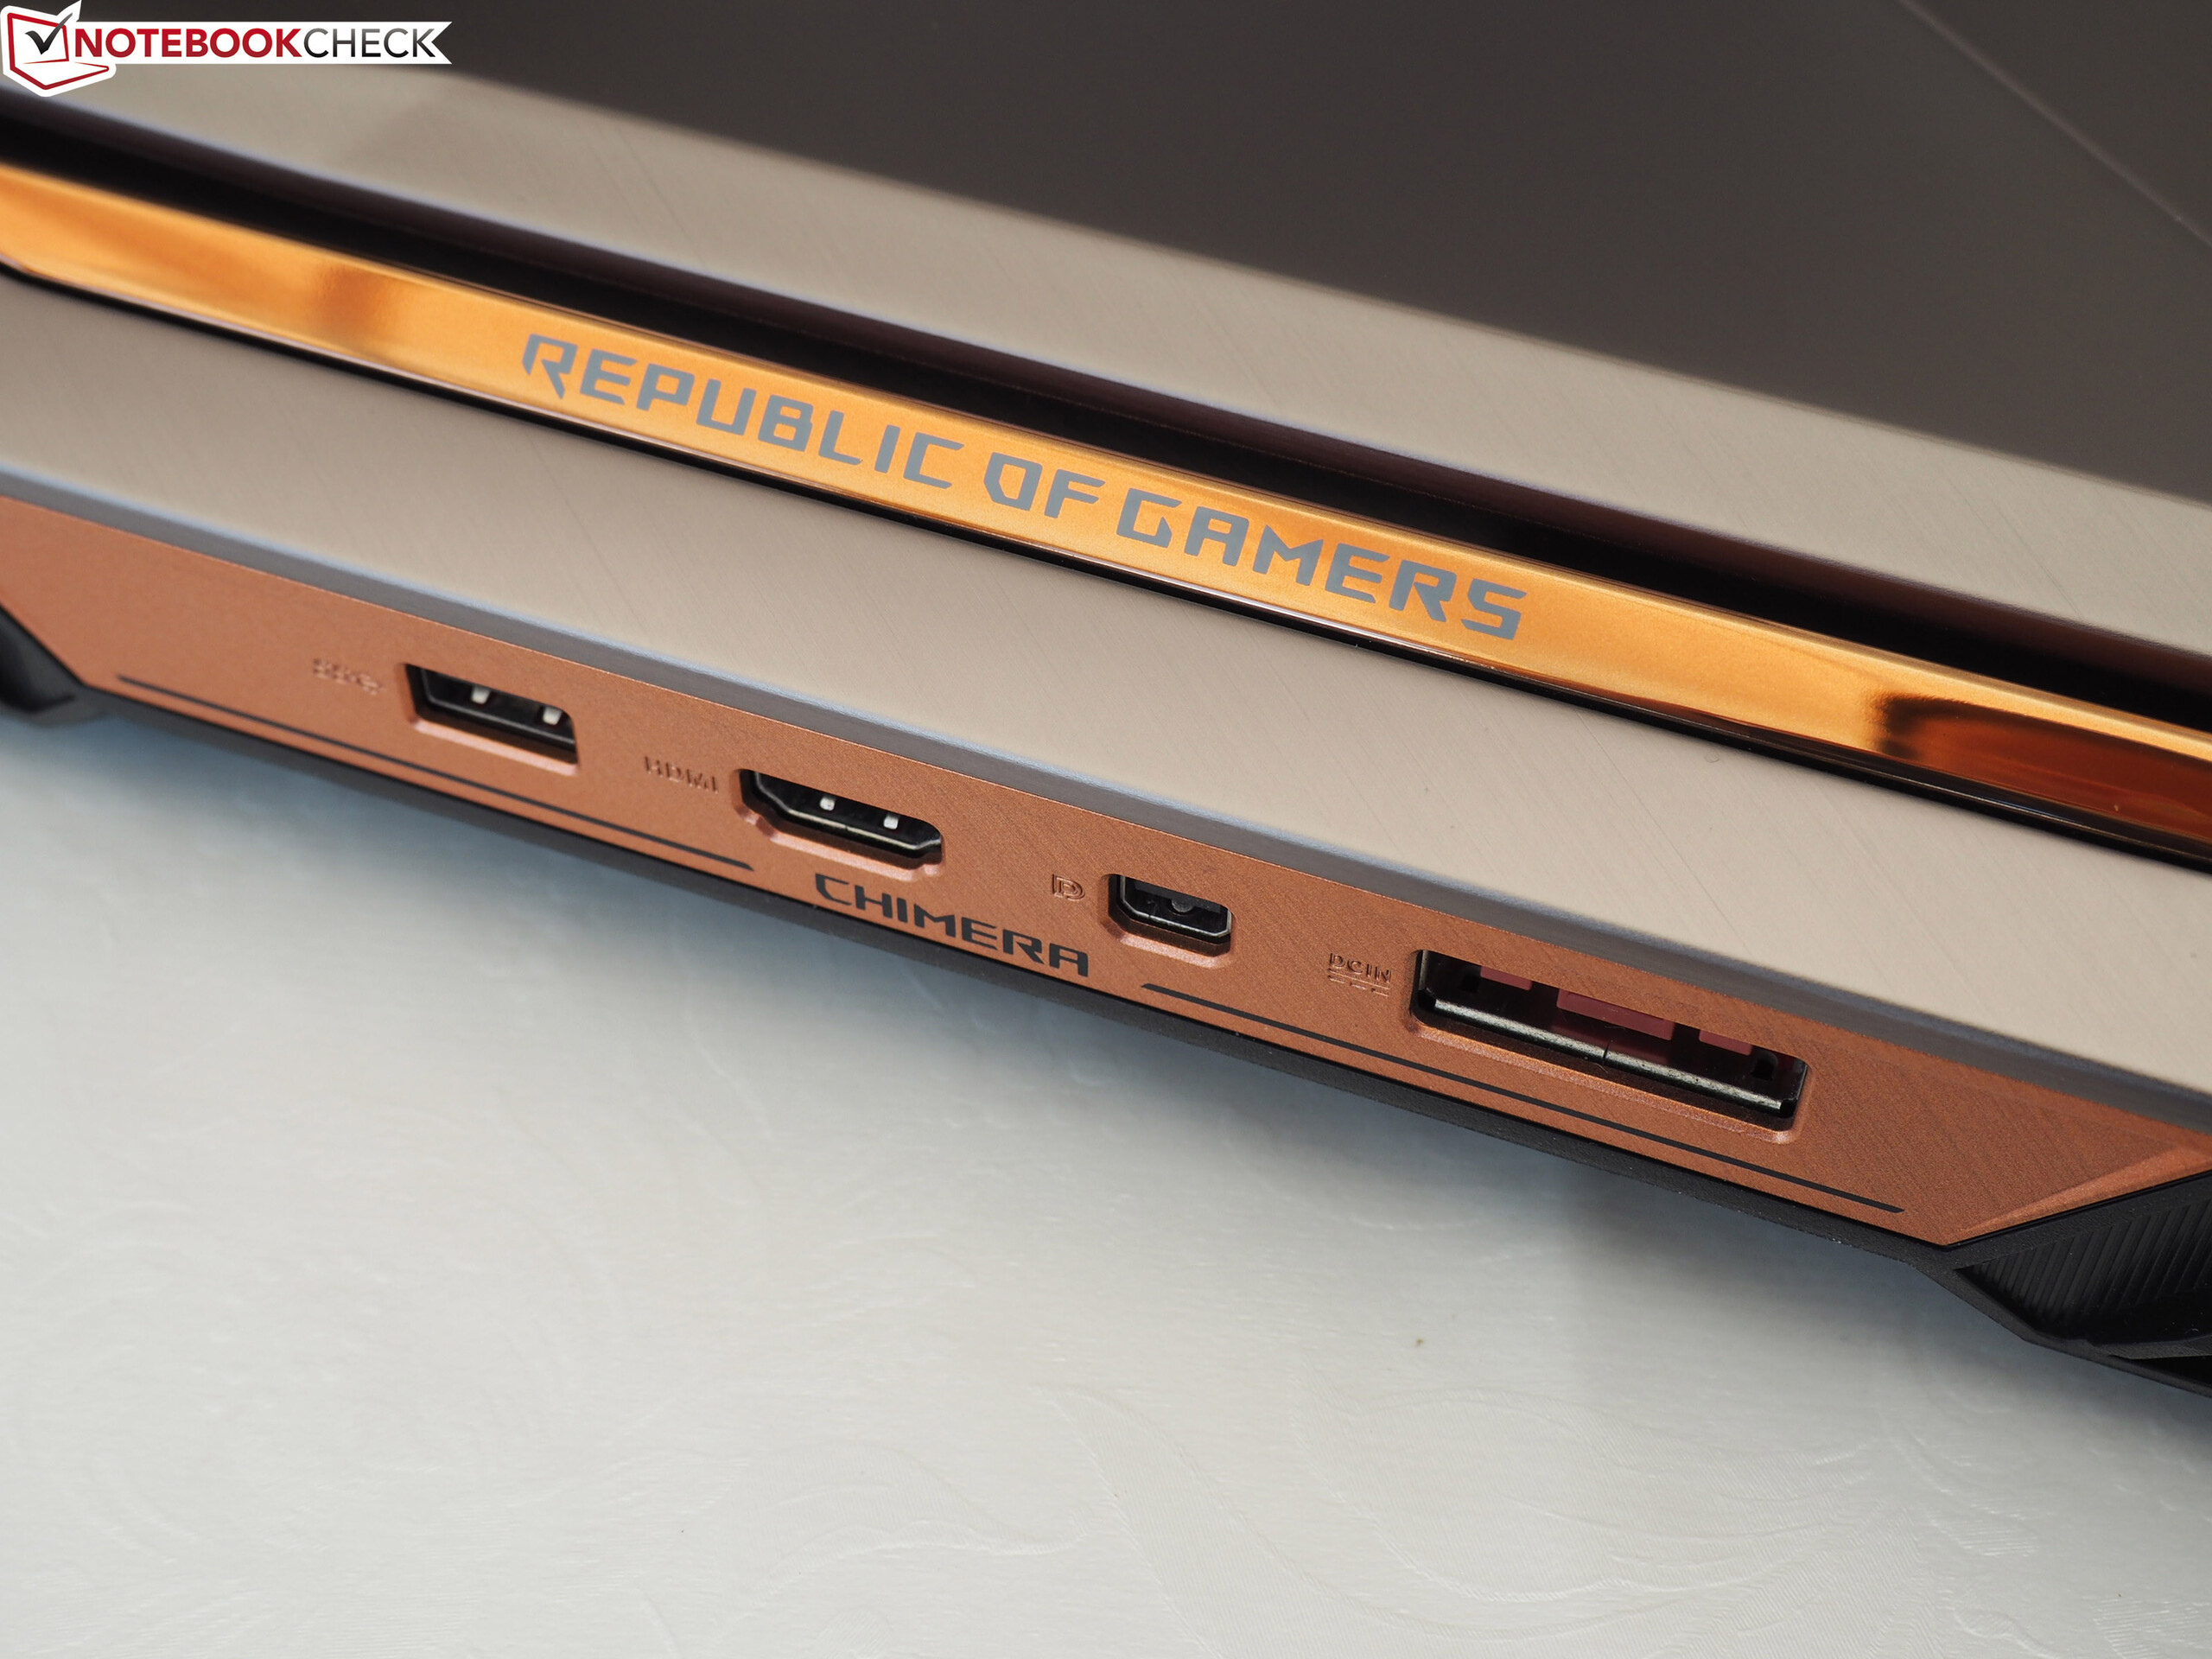
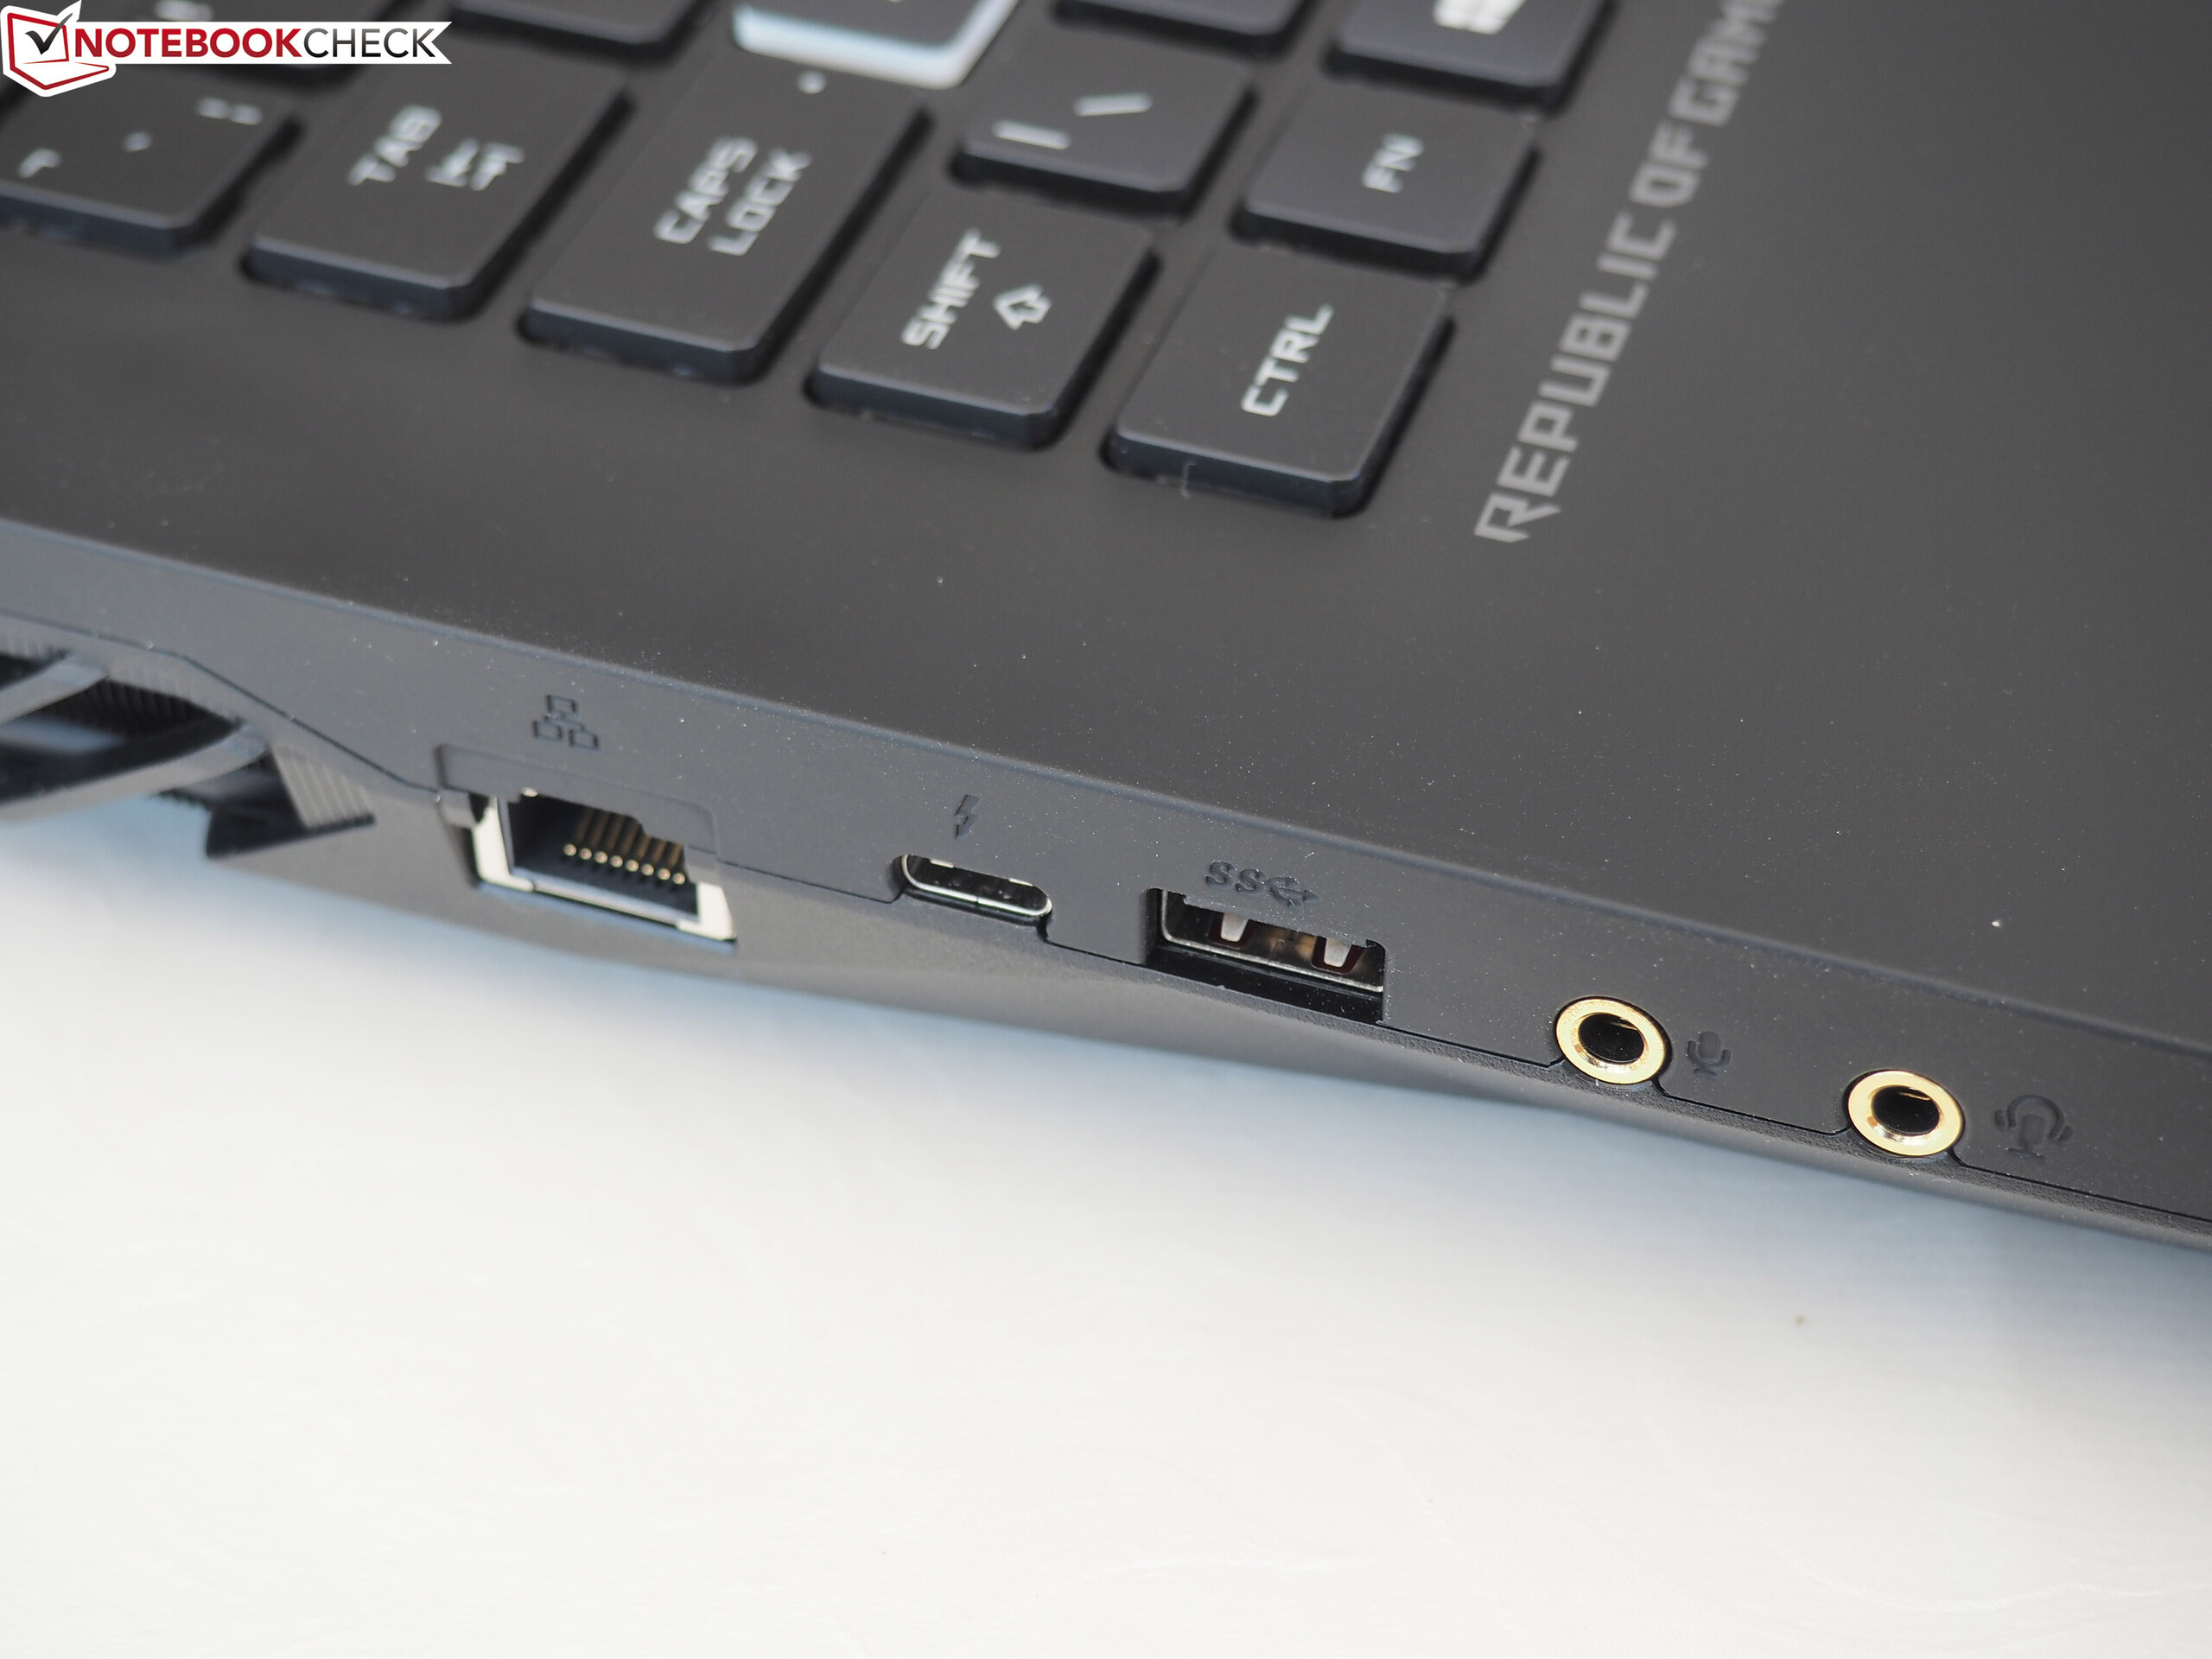
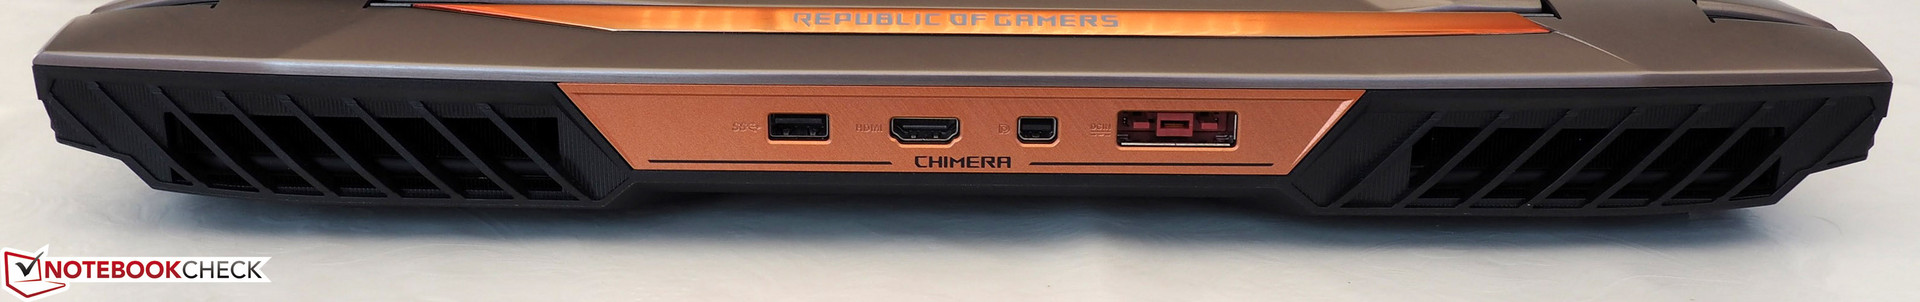
A Asus montou um pacote bem sucedido aqui, que não permite erros maiores. Não só lembremos positivamente os dispositivos de entrada de primeira categoria (teclado, incluindo iluminação RGB), mas também as muitas conexões (como o Thunderbolt 3). A tela e a qualidade do som também sabem como convencer. Particularmente, a tela IPS com sua combinação de 144 Hz e G-Sync representa um argumento real para compra.
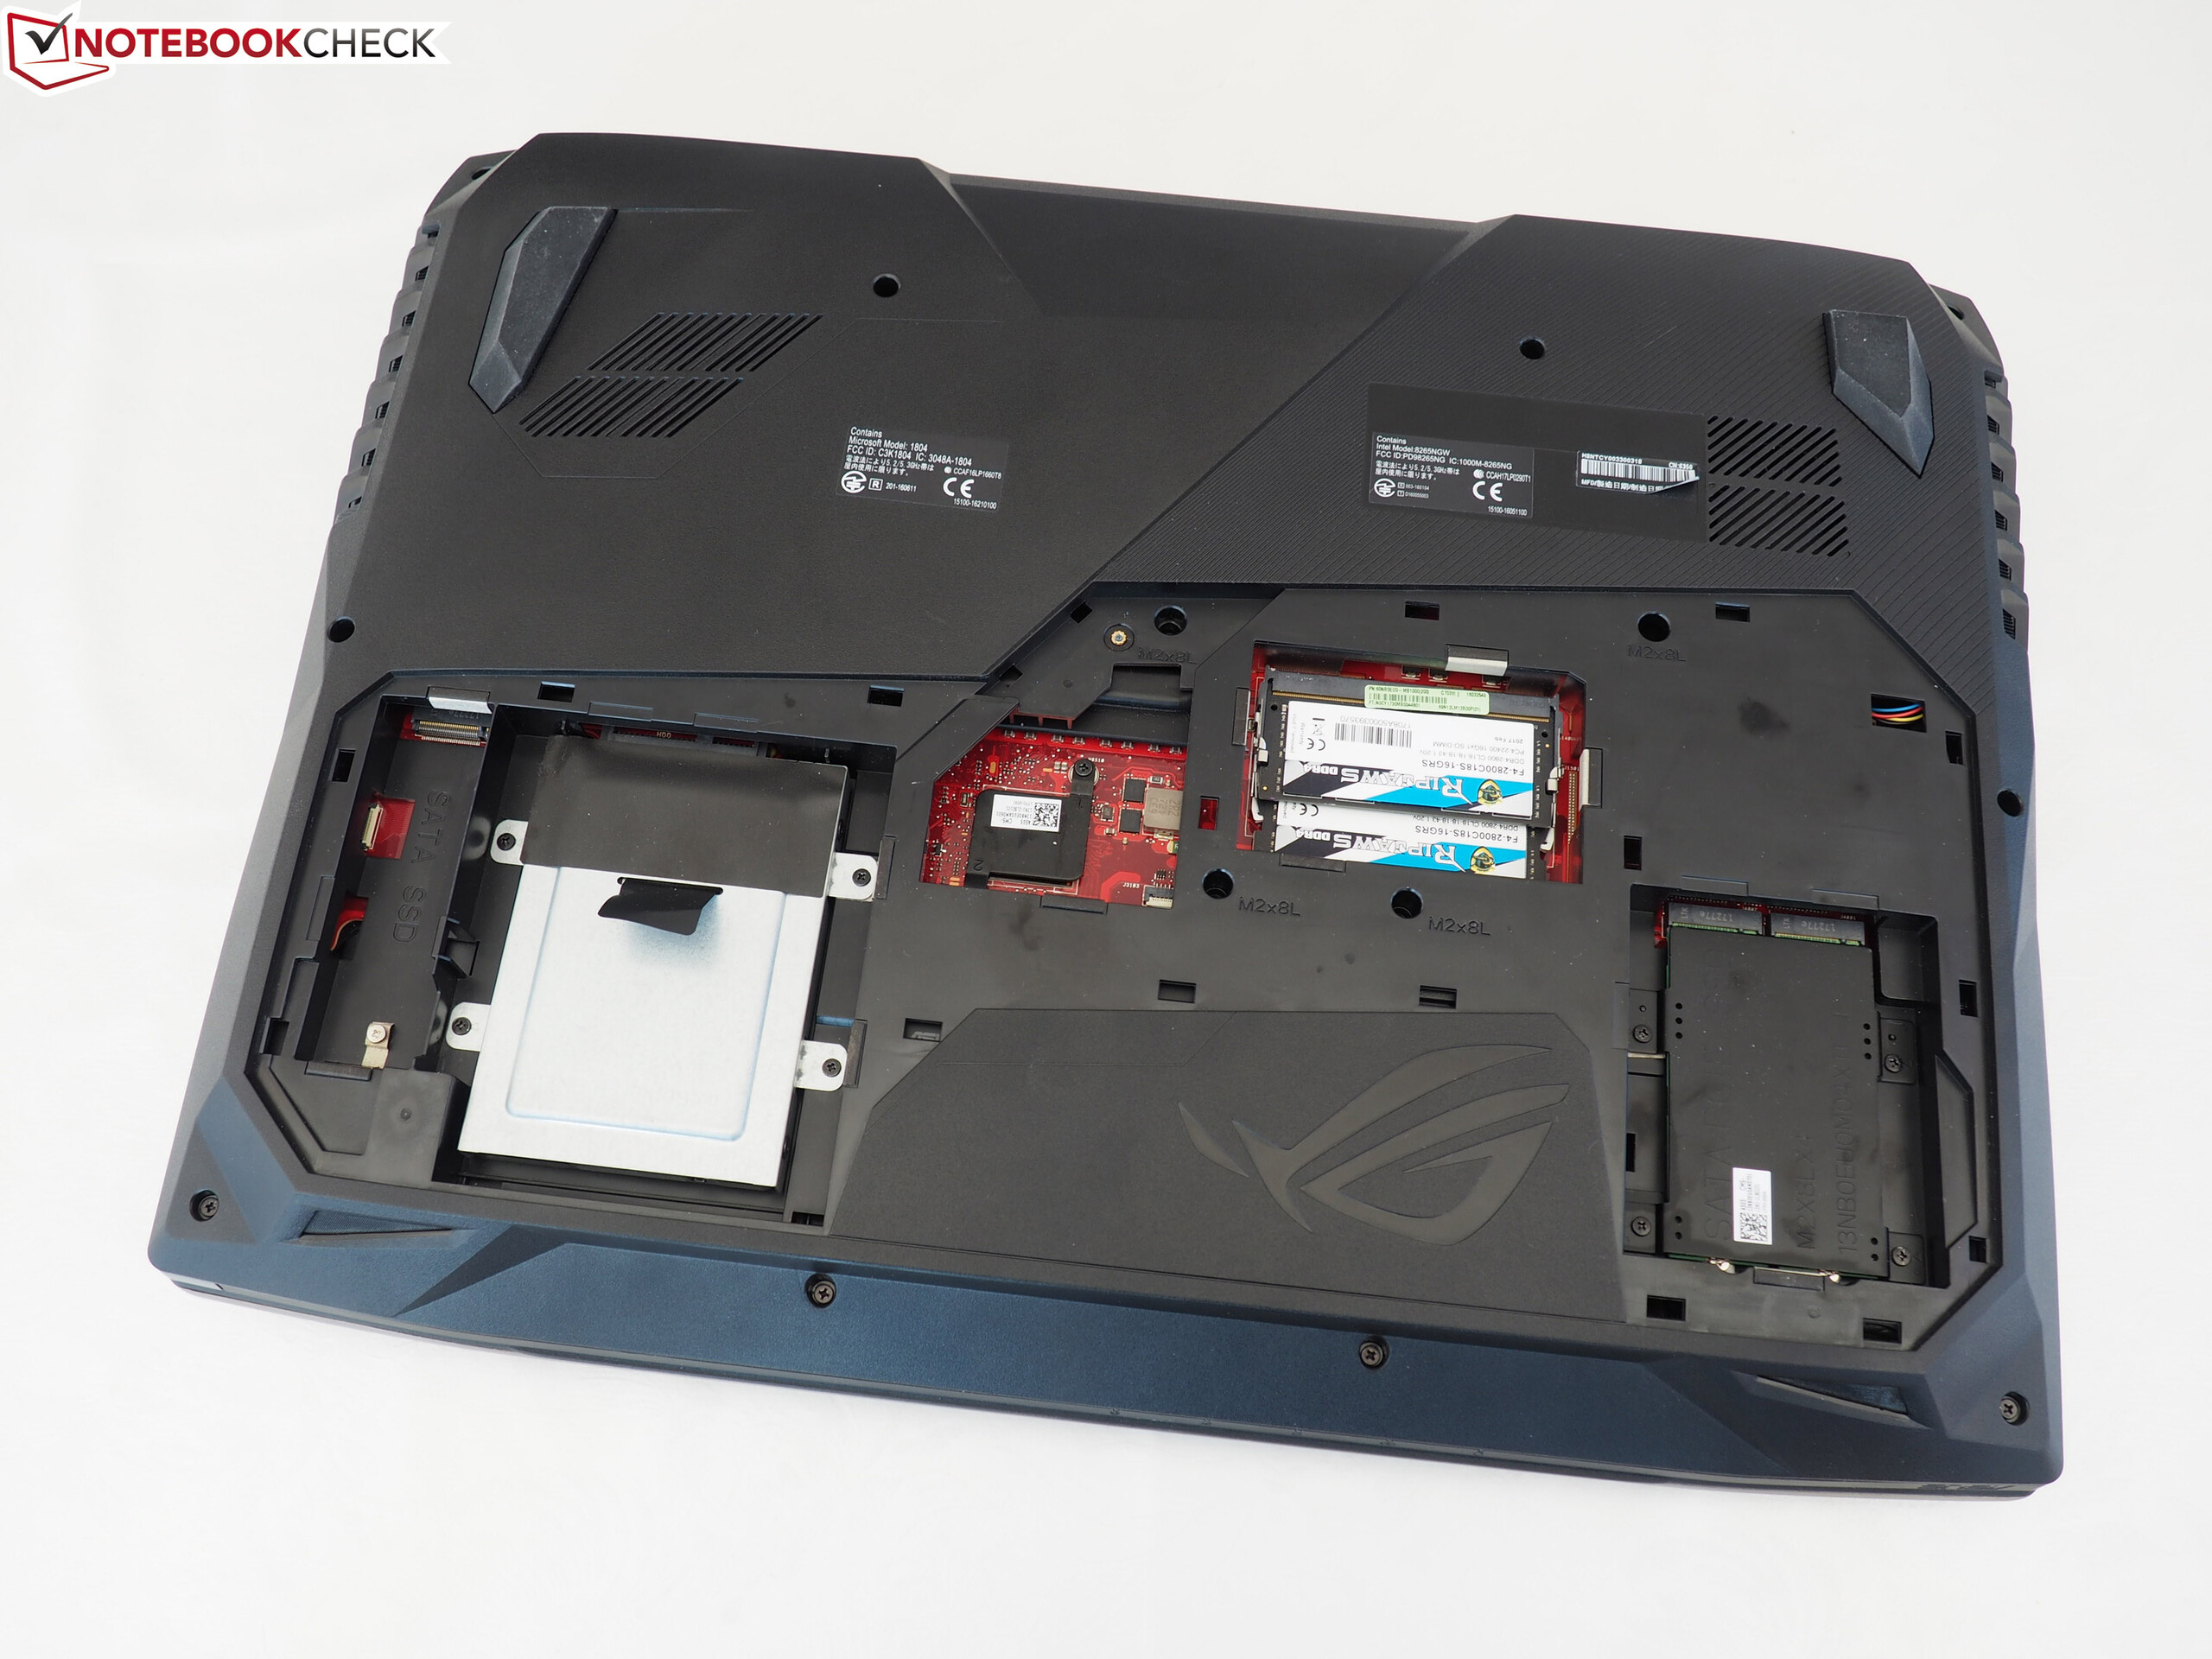
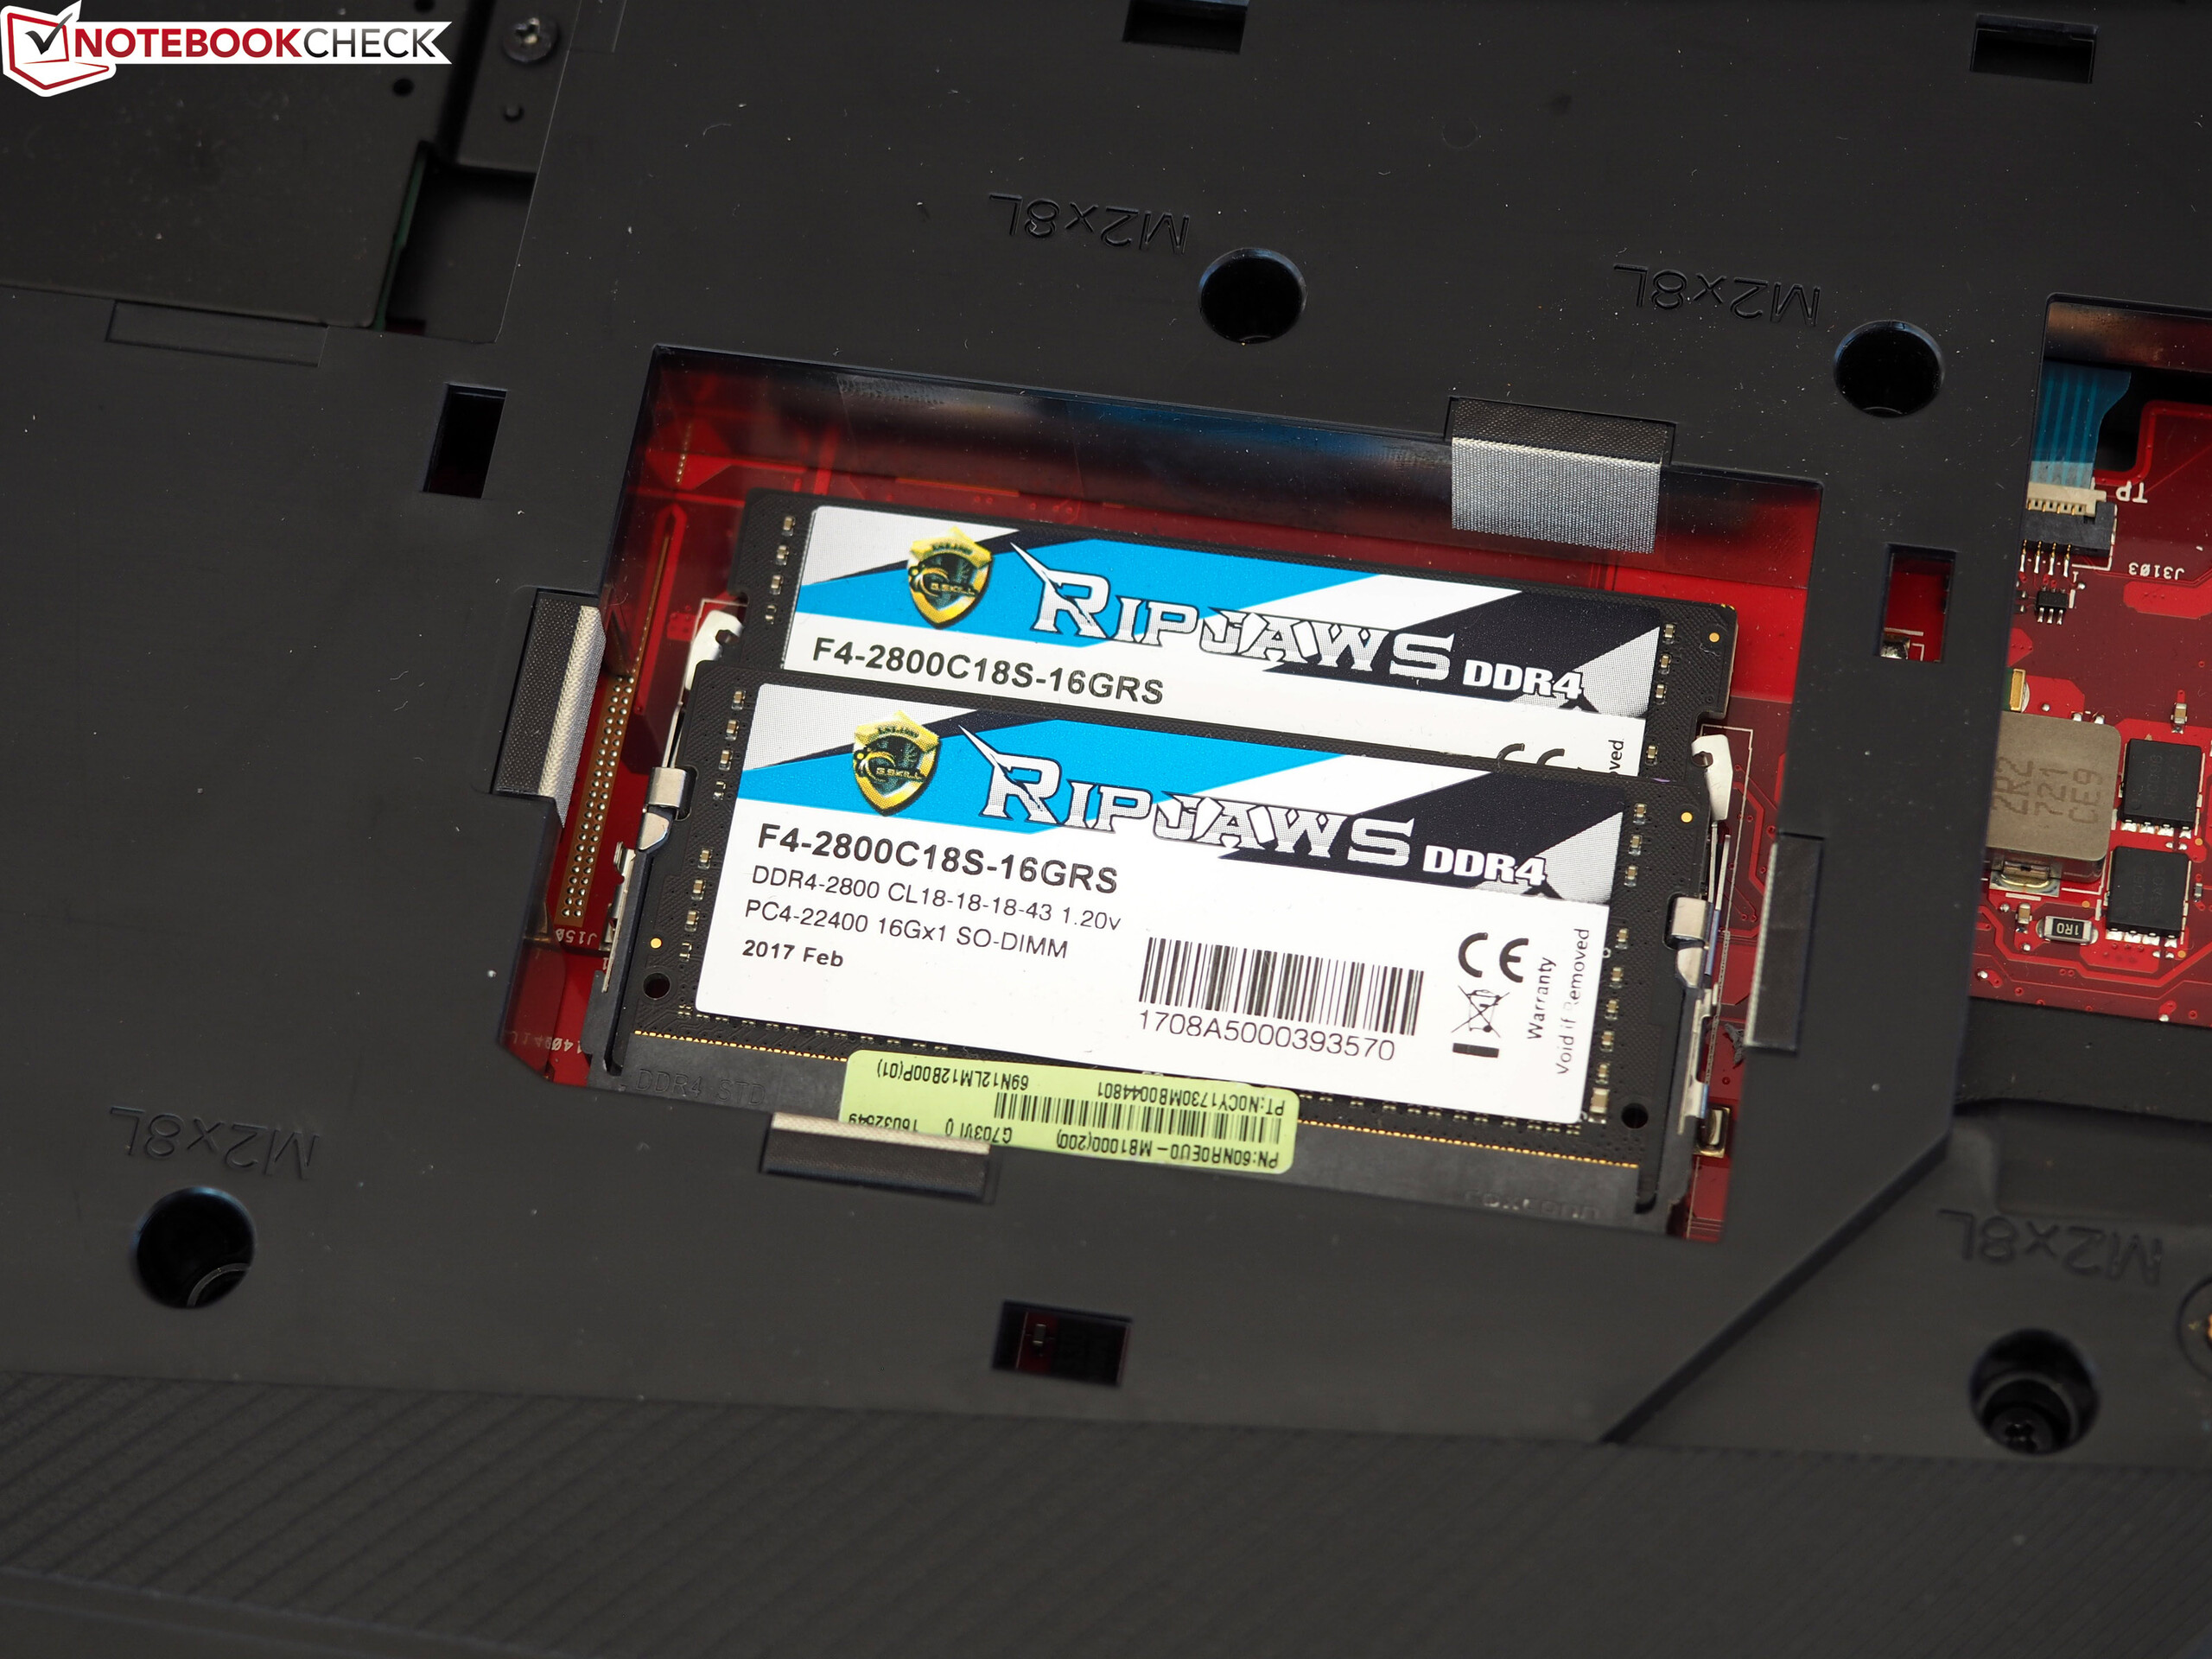
O desempenho também está além de qualquer reprovação. Para justificar o alto preço de compra, a Asus equipou o aparelho de 17 polegadas com uma abundância de componentes de gama alta, seja ele o GeForce GTX 1080 ou o Core i7-7820HK, que podem oferecer o seu maior desempenho graças ao overclocking. Também vale a pena notar o SSD-RAID e a quantidade de RAM.
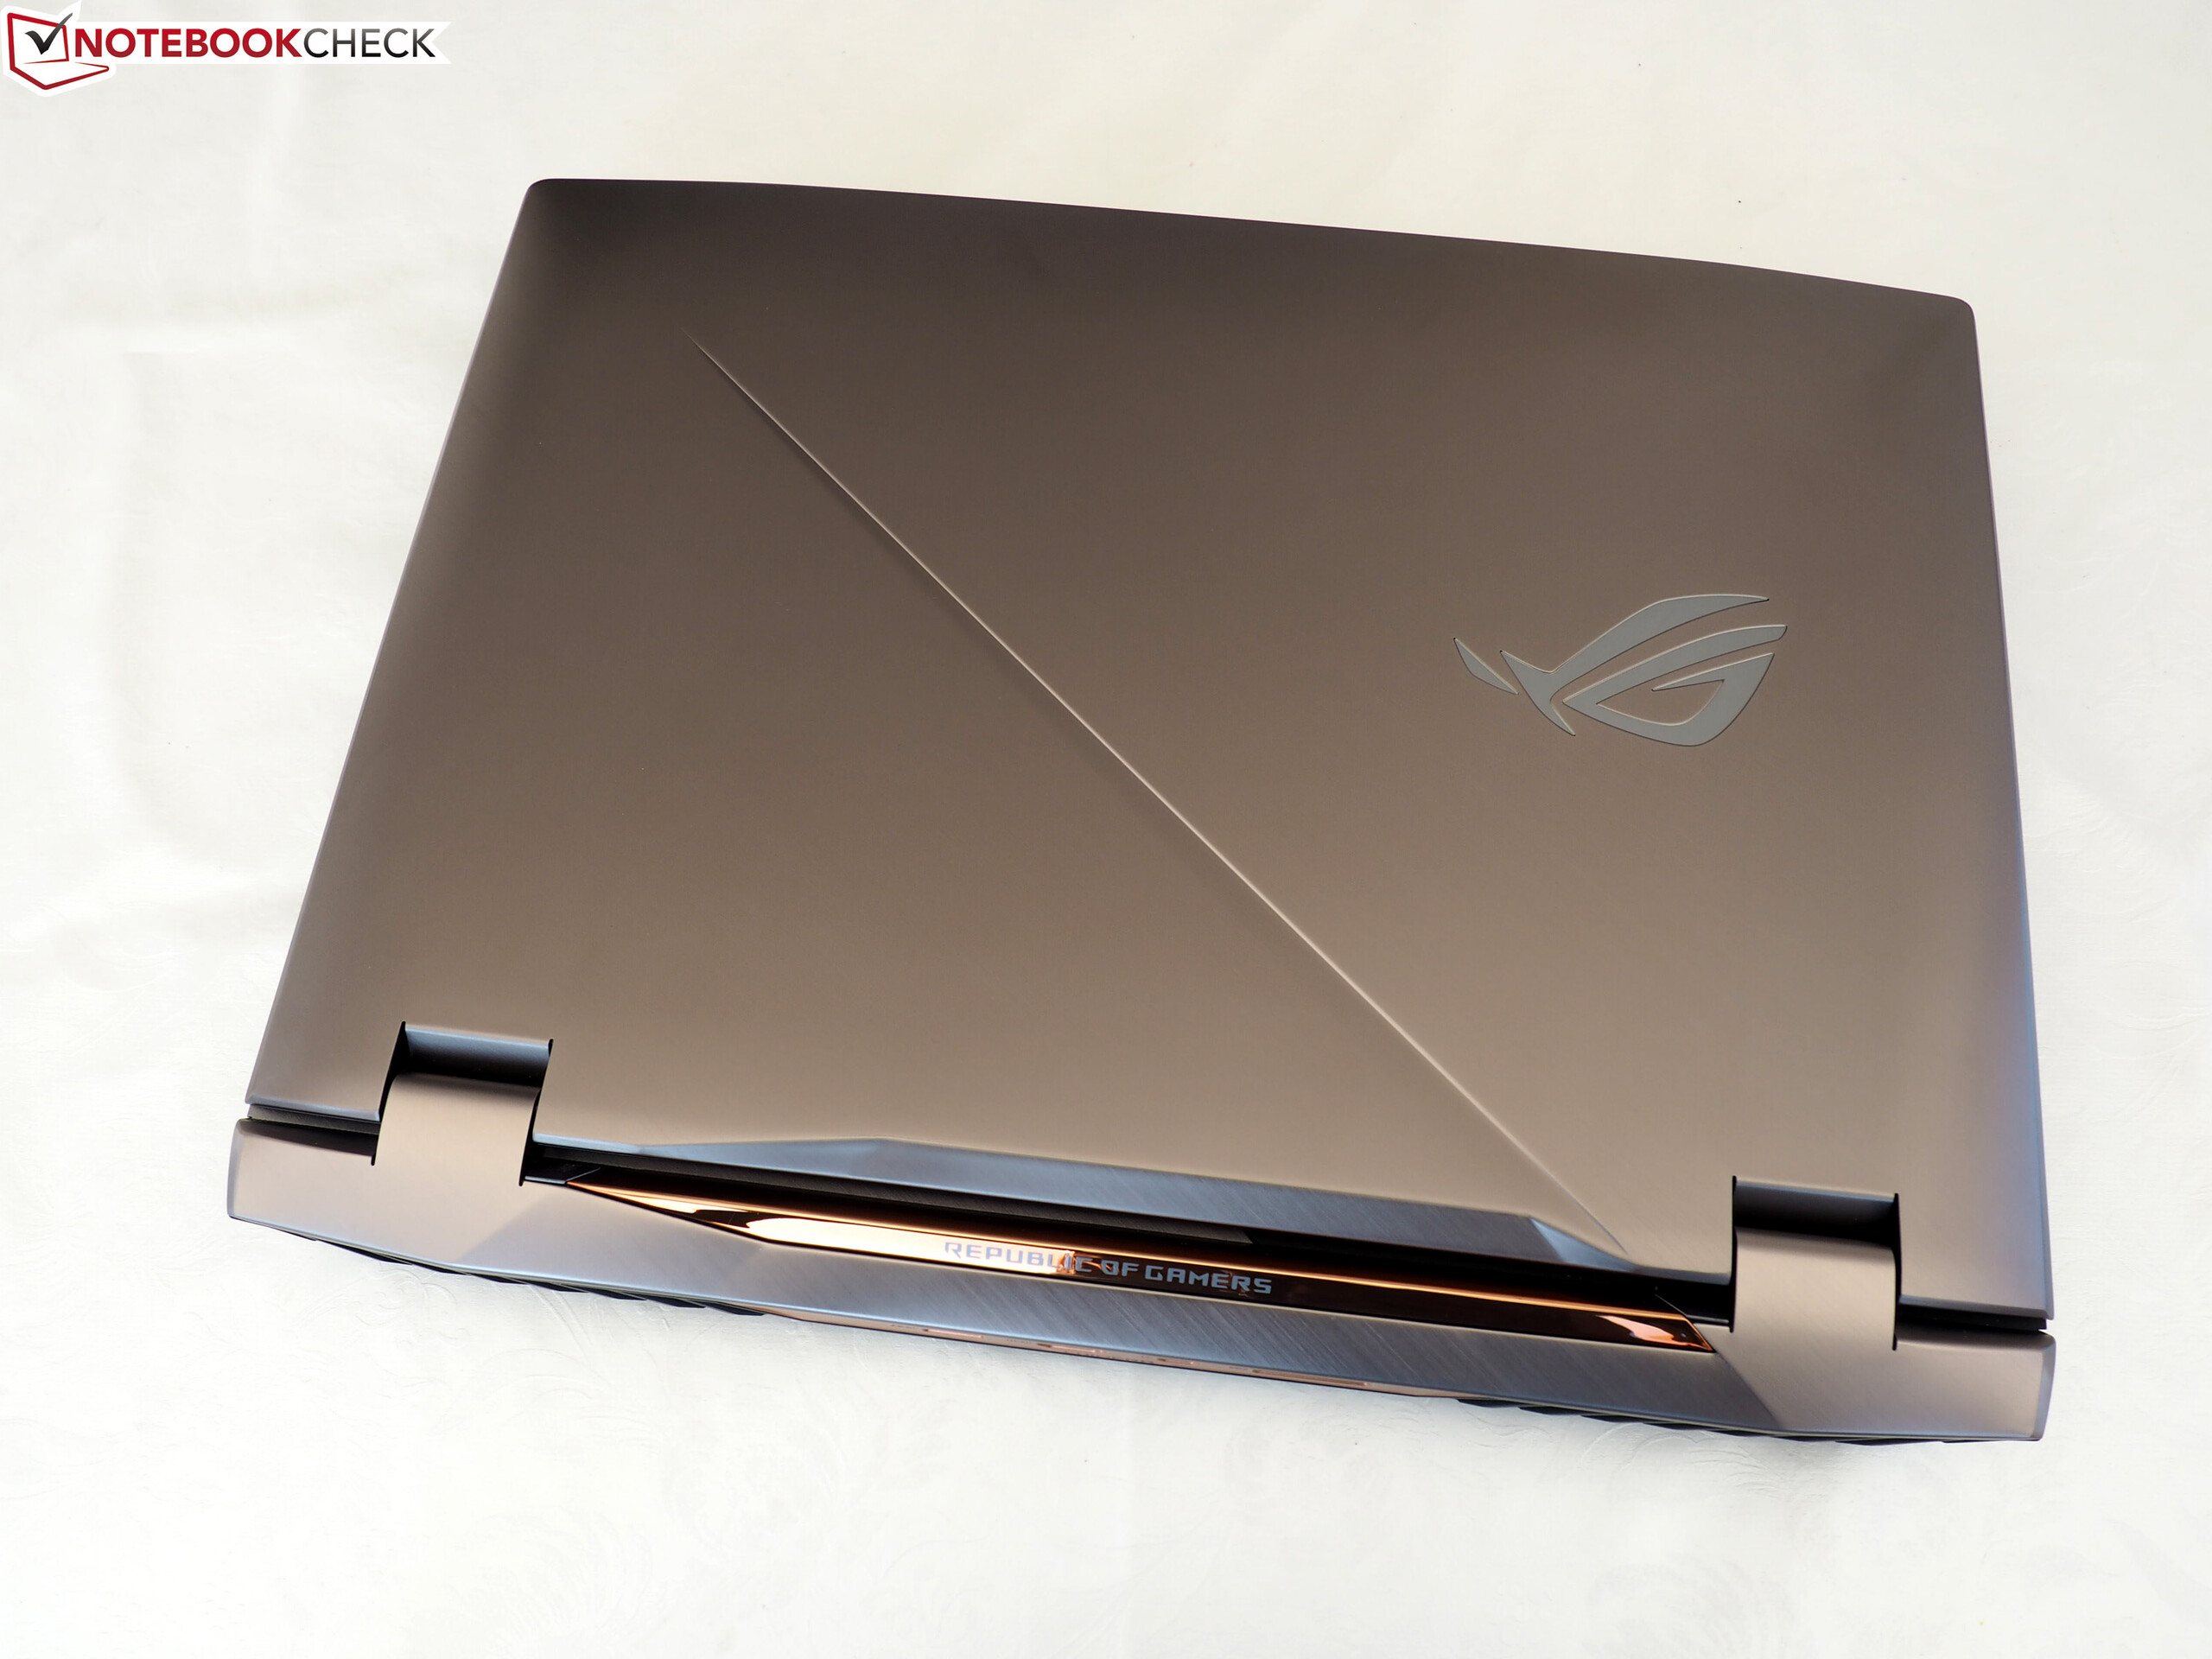
Do lado negativo, temos que mencionar o seu alto peso, o design grosso, a baixa duração da bateria e o ruído de fundo na operação 3D (pelo menos quando a função OC está ativa) do G703.
Apesar dessas fraquezas, o ROG Chimera vai pousar em um lugar muito alto em nossa lista Top 10 de Portáteis para Jogos.
Asus G703
- 02/27/2018 v6 (old)
Florian Glaser
Price comparison