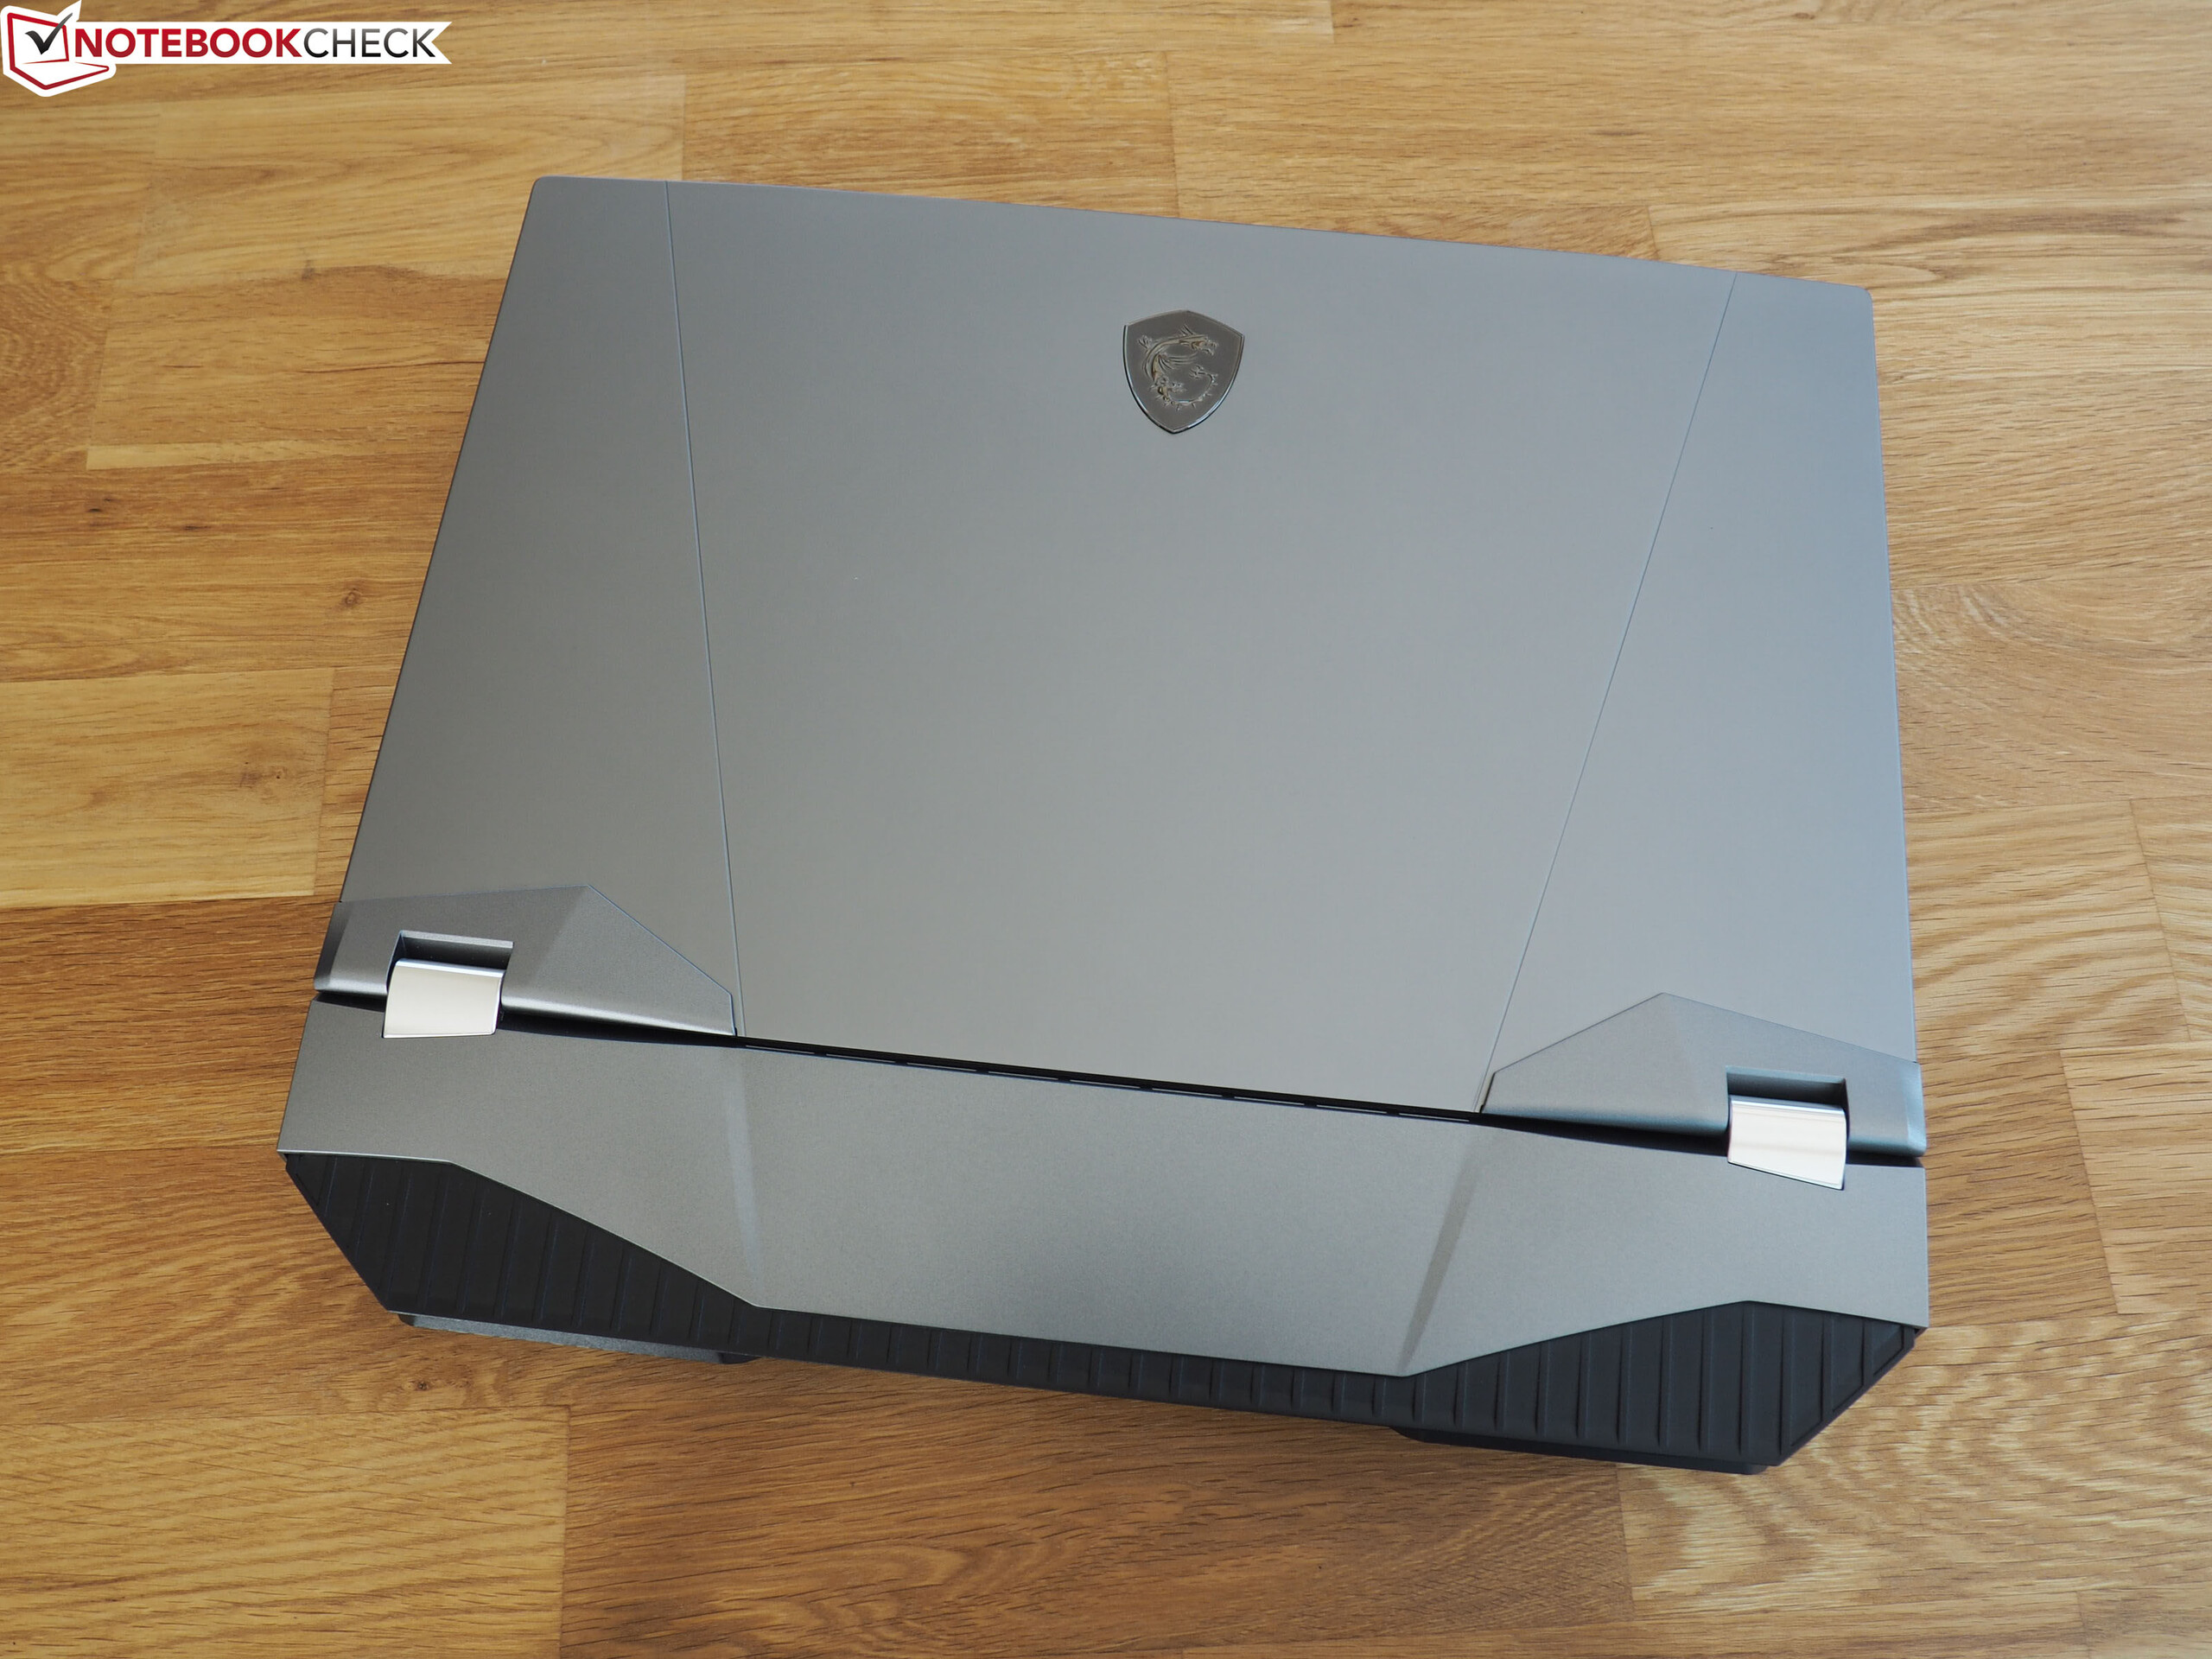
Breve Análise do Portátil MSI GT76 9SG: O Titã dos Portáteis de Jogos
| |||||||||||||||||||||||||
iluminação: 89 %
iluminação com acumulador: 396 cd/m²
Contraste: 1200:1 (Preto: 0.33 cd/m²)
ΔE ColorChecker Calman: 2.04 | ∀{0.5-29.43 Ø4.73}
calibrated: 0.82
ΔE Greyscale Calman: 2.83 | ∀{0.09-98 Ø4.97}
94% sRGB (Argyll 1.6.3 3D)
59% AdobeRGB 1998 (Argyll 1.6.3 3D)
64.3% AdobeRGB 1998 (Argyll 3D)
93.4% sRGB (Argyll 3D)
62.3% Display P3 (Argyll 3D)
Gamma: 2.49
CCT: 7113 K
| MSI GT76 Titan DT 9SG Chi Mei N173HCE-G33 (CMN175C), IPS, 1920x1080 | Alienware Area-51m i9-9900K RTX 2080 LG Philips 173WFG, IPS, 1920x1080 | Schenker XMG Ultra 17 Turing AU Optronics B173ZAN01.0 (AUO109B), IPS, 3840x2160 | MSI GE75 9SG Chi Mei N173HCE-G33, AHVA, 1920x1080 | Asus ROG G703GX AU Optronics B173HAN03.2 (AUO329D), IPS, 1920x1080 | |
|---|---|---|---|---|---|
| Display | 4% | 33% | -1% | 2% | |
| Display P3 Coverage (%) | 62.3 | 66.3 6% | 86.3 39% | 61.5 -1% | 64.1 3% |
| sRGB Coverage (%) | 93.4 | 96.9 4% | 100 7% | 92 -1% | 93.3 0% |
| AdobeRGB 1998 Coverage (%) | 64.3 | 66.5 3% | 99.1 54% | 63.5 -1% | 65.6 2% |
| Response Times | -37% | -268% | 22% | 7% | |
| Response Time Grey 50% / Grey 80% * (ms) | 8 ? | 13.2 ? -65% | 41.6 ? -420% | 7.2 ? 10% | 7.2 ? 10% |
| Response Time Black / White * (ms) | 10 ? | 10.8 ? -8% | 21.6 ? -116% | 6.6 ? 34% | 9.6 ? 4% |
| PWM Frequency (Hz) | 26040 ? | 26040 ? | |||
| Screen | -31% | -33% | 2% | -44% | |
| Brightness middle (cd/m²) | 396 | 335.2 -15% | 343 -13% | 400.7 1% | 296 -25% |
| Brightness (cd/m²) | 373 | 297 -20% | 328 -12% | 372 0% | 279 -25% |
| Brightness Distribution (%) | 89 | 82 -8% | 82 -8% | 89 0% | 85 -4% |
| Black Level * (cd/m²) | 0.33 | 0.66 -100% | 0.31 6% | 0.34 -3% | 0.25 24% |
| Contrast (:1) | 1200 | 508 -58% | 1106 -8% | 1179 -2% | 1184 -1% |
| Colorchecker dE 2000 * | 2.04 | 2.02 1% | 5.03 -147% | 1.33 35% | 4.77 -134% |
| Colorchecker dE 2000 max. * | 3.85 | 7.23 -88% | 7.91 -105% | 3.51 9% | 9.08 -136% |
| Colorchecker dE 2000 calibrated * | 0.82 | 1.17 -43% | 0.86 -5% | 1.39 -70% | 1.46 -78% |
| Greyscale dE 2000 * | 2.83 | 3.2 -13% | 6.29 -122% | 1.3 54% | 5.83 -106% |
| Gamma | 2.49 88% | 2.16 102% | 2.38 92% | 2.24 98% | 2.47 89% |
| CCT | 7113 91% | 6746 96% | 6389 102% | 6735 97% | 8076 80% |
| Color Space (Percent of AdobeRGB 1998) (%) | 59 | 61.3 4% | 88 49% | 58.2 -1% | 60 2% |
| Color Space (Percent of sRGB) (%) | 94 | 96.9 3% | 100 6% | 92.1 -2% | 93 -1% |
| Média Total (Programa/Configurações) | -21% /
-25% | -89% /
-50% | 8% /
4% | -12% /
-29% |
* ... menor é melhor
Exibir tempos de resposta
| ↔ Tempo de resposta preto para branco | ||
|---|---|---|
| 10 ms ... ascensão ↗ e queda ↘ combinadas | ↗ 5.2 ms ascensão | 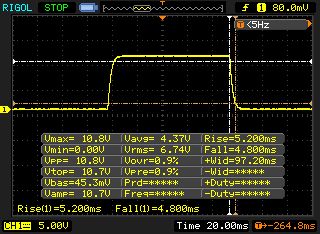 |
| ↘ 4.8 ms queda | ||
| A tela mostra boas taxas de resposta em nossos testes, mas pode ser muito lenta para jogadores competitivos. Em comparação, todos os dispositivos testados variam de 0.1 (mínimo) a 240 (máximo) ms. » 27 % de todos os dispositivos são melhores. Isso significa que o tempo de resposta medido é melhor que a média de todos os dispositivos testados (19.9 ms). | ||
| ↔ Tempo de resposta 50% cinza a 80% cinza | ||
| 8 ms ... ascensão ↗ e queda ↘ combinadas | ↗ 4.4 ms ascensão | 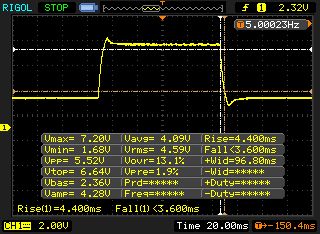 |
| ↘ 3.6 ms queda | ||
| A tela mostra taxas de resposta rápidas em nossos testes e deve ser adequada para jogos. Em comparação, todos os dispositivos testados variam de 0.165 (mínimo) a 636 (máximo) ms. » 21 % de todos os dispositivos são melhores. Isso significa que o tempo de resposta medido é melhor que a média de todos os dispositivos testados (31.1 ms). | ||
Cintilação da tela / PWM (modulação por largura de pulso)
| Tela tremeluzindo/PWM detectado | 26040 Hz | ≤ 20 % configuração de brilho | 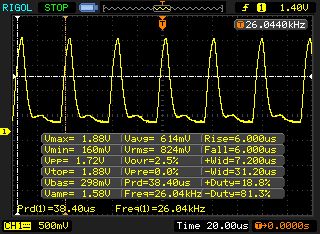 |
A luz de fundo da tela pisca em 26040 Hz (pior caso, por exemplo, utilizando PWM) Cintilação detectada em uma configuração de brilho de 20 % e abaixo. Não deve haver cintilação ou PWM acima desta configuração de brilho. A frequência de 26040 Hz é bastante alta, então a maioria dos usuários sensíveis ao PWM não deve notar nenhuma oscilação. [pwm_comparison] Em comparação: 52 % de todos os dispositivos testados não usam PWM para escurecer a tela. Se PWM foi detectado, uma média de 7801 (mínimo: 5 - máximo: 343500) Hz foi medida. | |||
| Cinebench R20 | |
| CPU (Single Core) | |
| Média da turma Gaming (442 - 895, n=112, últimos 2 anos) | |
| MSI GT76 Titan DT 9SG | |
| MSI GE75 9SG | |
| CPU (Multi Core) | |
| Média da turma Gaming (4029 - 16108, n=112, últimos 2 anos) | |
| MSI GT76 Titan DT 9SG | |
| MSI GE75 9SG | |
| MSI GT76 Titan DT 9SG 2x Samsung PM961 MZVLW256HEHP (RAID 0) | Alienware Area-51m i9-9900K RTX 2080 2x SK Hynix PC400 512GB (RAID 0) | Schenker XMG Ultra 17 Turing Samsung SSD 970 EVO Plus 500GB | MSI GE75 9SG Samsung SSD PM981 MZVLB1T0HALR | Asus ROG G703GX Samsung SSD PM981 MZVLB512HAJQ | |
|---|---|---|---|---|---|
| CrystalDiskMark 5.2 / 6 | 20% | 25% | -3% | -15% | |
| Write 4K (MB/s) | 101.4 | 111.1 10% | 183.2 81% | 116.1 14% | 90.4 -11% |
| Read 4K (MB/s) | 40.57 | 45.47 12% | 52.4 29% | 44.98 11% | 39.19 -3% |
| Write Seq (MB/s) | 2229 | 2454 10% | 1790 -20% | 2370 6% | 1863 -16% |
| Read Seq (MB/s) | 2528 | 2212 -12% | 1743 -31% | 1465 -42% | 2100 -17% |
| Write 4K Q32T1 (MB/s) | 379.6 | 622 64% | 550 45% | 337.5 -11% | 260.2 -31% |
| Read 4K Q32T1 (MB/s) | 421.9 | 695 65% | 648 54% | 453.6 8% | 297 -30% |
| Write Seq Q32T1 (MB/s) | 2439 | 2675 10% | 3236 33% | 2399 -2% | 1870 -23% |
| Read Seq Q32T1 (MB/s) | 3199 | 3184 0% | 3538 11% | 3087 -4% | 3471 9% |
| 3DMark Cloud Gate Standard Score | 58737 pontos | |
| 3DMark Fire Strike Score | 21988 pontos | |
| 3DMark Time Spy Score | 10290 pontos | |
Ajuda | ||
| The Witcher 3 - 1920x1080 Ultra Graphics & Postprocessing (HBAO+) | |
| Média da turma Gaming (95 - 240, n=8, últimos 2 anos) | |
| Alienware Area-51m i9-9900K RTX 2080 | |
| MSI GT76 Titan DT 9SG | |
| Asus ROG G703GX | |
| MSI GE75 9SG | |
| Schenker XMG Ultra 17 Turing | |
| baixo | média | alto | ultra | QHD | 4K | |
|---|---|---|---|---|---|---|
| The Witcher 3 (2015) | 186 | 100 | 66.9 | |||
| Apex Legends (2019) | 144 | 144 | 144 | 128 | 75 | |
| Far Cry New Dawn (2019) | 128 | 121 | 108 | 96 | 57 | |
| Metro Exodus (2019) | 109 | 82.2 | 68.3 | 54.4 | 35.6 | |
| Anthem (2019) | 130 | 120 | 112 | 83.7 | 48.6 | |
| Dirt Rally 2.0 (2019) | 212 | 171 | 101 | 79.2 | ||
| The Division 2 (2019) | 169 | 136 | 103 | 72 | 40 | |
| Anno 1800 (2019) | 115 | 92.2 | 54.3 | 47.8 | 34.9 | |
| Rage 2 (2019) | 144 | 122 | 119 | 78.1 | 39.1 |
Barulho
| Ocioso |
| 33 / 34 / 44 dB |
| Carga |
| 47 / 59 dB |
 | ||
30 dB silencioso 40 dB(A) audível 50 dB(A) ruidosamente alto |
||
min: | ||
| MSI GT76 Titan DT 9SG i9-9900K, GeForce RTX 2080 Mobile | Alienware Area-51m i9-9900K RTX 2080 i9-9900K, GeForce RTX 2080 Mobile | Schenker XMG Ultra 17 Turing i9-9900K, GeForce RTX 2080 Mobile | MSI GE75 9SG i9-9880H, GeForce RTX 2080 Mobile | Asus ROG G703GX i7-8750H, GeForce RTX 2080 Mobile | Média da turma Gaming | |
|---|---|---|---|---|---|---|
| Noise | 4% | 5% | 10% | 5% | 18% | |
| desligado / ambiente * (dB) | 30 | 28.1 6% | 30 -0% | 28.2 6% | 30 -0% | 24.1 ? 20% |
| Idle Minimum * (dB) | 33 | 28.1 15% | 30 9% | 30.4 8% | 30 9% | 25.8 ? 22% |
| Idle Average * (dB) | 34 | 28.6 16% | 33 3% | 30.4 11% | 35 -3% | 27.5 ? 19% |
| Idle Maximum * (dB) | 44 | 51 -16% | 35 20% | 33.4 24% | 41 7% | 30 ? 32% |
| Load Average * (dB) | 47 | 51 -9% | 44 6% | 37.1 21% | 44 6% | 43.1 ? 8% |
| Witcher 3 ultra * (dB) | 53 | 51 4% | 55 -4% | 54.2 -2% | 51 4% | |
| Load Maximum * (dB) | 59 | 51 14% | 58 2% | 56.4 4% | 52 12% | 54 ? 8% |
* ... menor é melhor
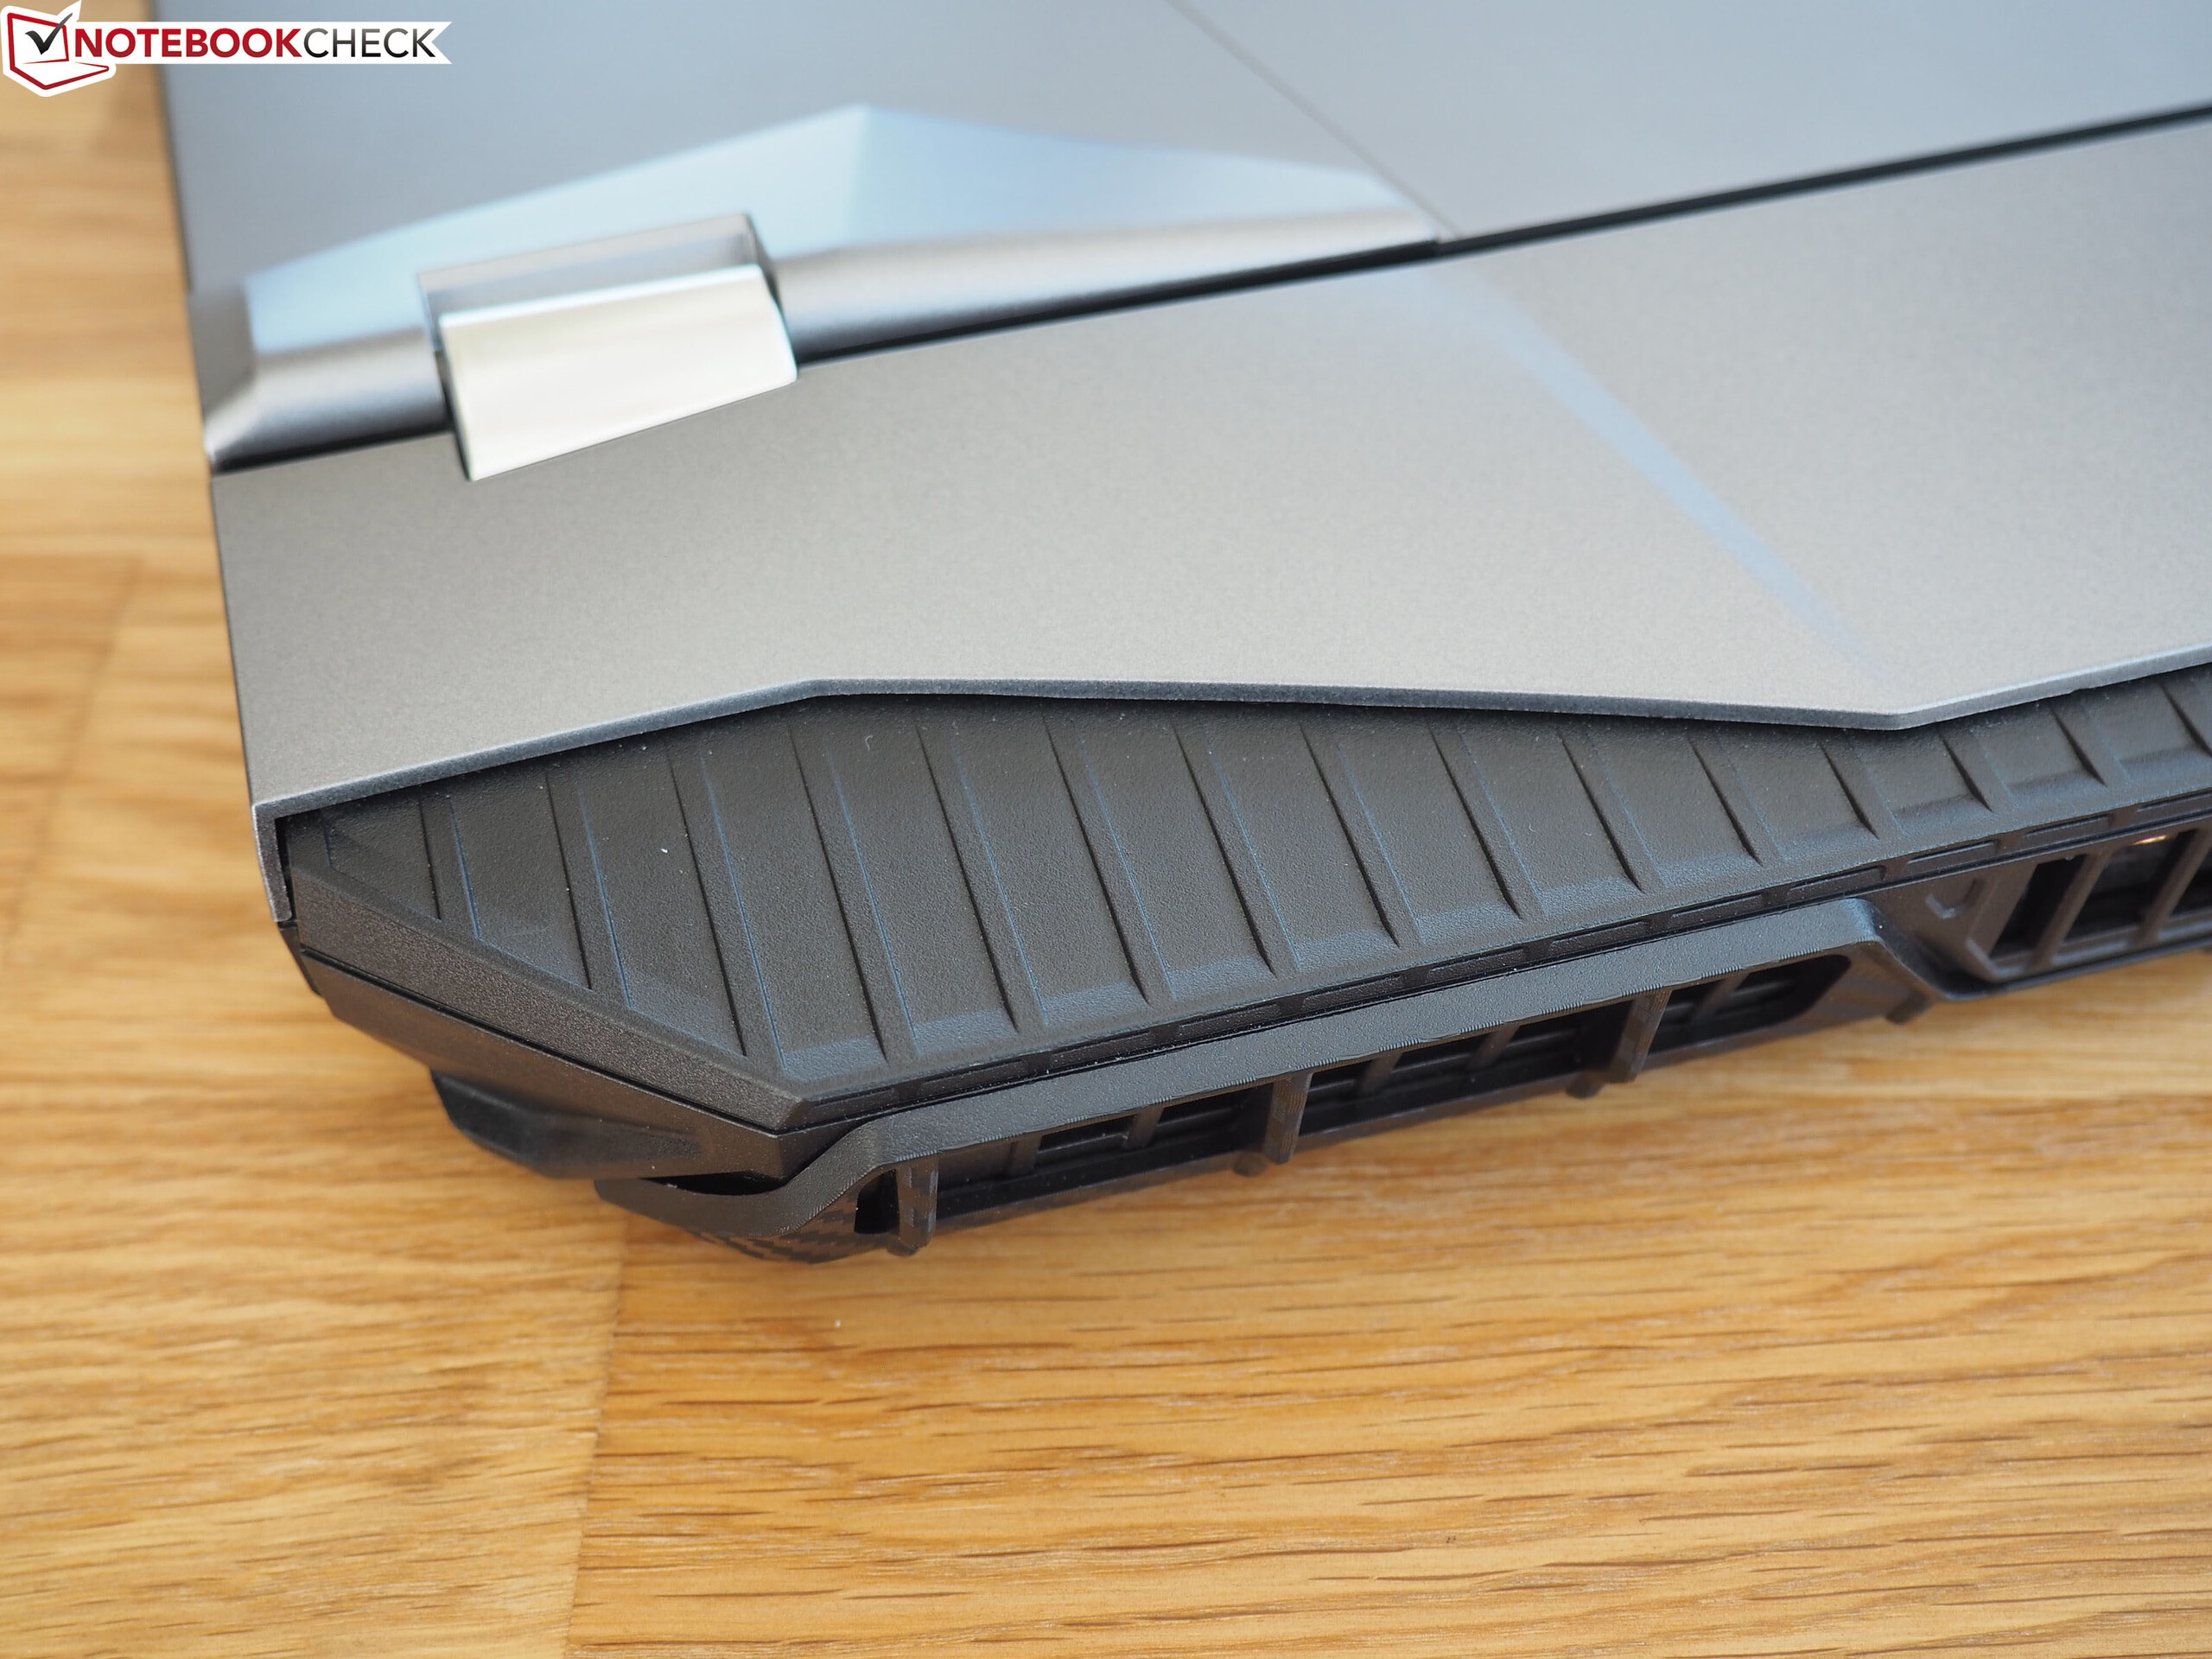
(-) A temperatura máxima no lado superior é 51 °C / 124 F, em comparação com a média de 40.4 °C / 105 F , variando de 21.2 a 68.8 °C para a classe Gaming.
(-) A parte inferior aquece até um máximo de 57 °C / 135 F, em comparação com a média de 43.2 °C / 110 F
(+) Em uso inativo, a temperatura média para o lado superior é 25.3 °C / 78 F, em comparação com a média do dispositivo de 33.9 °C / ### class_avg_f### F.
(-) Jogando The Witcher 3, a temperatura média para o lado superior é 41.4 °C / 107 F, em comparação com a média do dispositivo de 33.9 °C / ## #class_avg_f### F.
(±) Os apoios para as mãos e o touchpad podem ficar muito quentes ao toque, com um máximo de 37 °C / 98.6 F.
(-) A temperatura média da área do apoio para as mãos de dispositivos semelhantes foi 28.8 °C / 83.8 F (-8.2 °C / -14.8 F).
| MSI GT76 Titan DT 9SG i9-9900K, GeForce RTX 2080 Mobile | Alienware Area-51m i9-9900K RTX 2080 i9-9900K, GeForce RTX 2080 Mobile | Schenker XMG Ultra 17 Turing i9-9900K, GeForce RTX 2080 Mobile | MSI GE75 9SG i9-9880H, GeForce RTX 2080 Mobile | Asus ROG G703GX i7-8750H, GeForce RTX 2080 Mobile | Média da turma Gaming | |
|---|---|---|---|---|---|---|
| Heat | -10% | -6% | -21% | -5% | -4% | |
| Maximum Upper Side * (°C) | 51 | 47 8% | 45 12% | 48.8 4% | 50 2% | 45.2 ? 11% |
| Maximum Bottom * (°C) | 57 | 58.8 -3% | 45 21% | 52 9% | 50 12% | 48.2 ? 15% |
| Idle Upper Side * (°C) | 26 | 31 -19% | 36 -38% | 36.2 -39% | 30 -15% | 31.1 ? -20% |
| Idle Bottom * (°C) | 28 | 35 -25% | 33 -18% | 44.4 -59% | 33 -18% | 34.3 ? -22% |
* ... menor é melhor
MSI GT76 Titan DT 9SG análise de áudio
(+) | os alto-falantes podem tocar relativamente alto (###valor### dB)
Graves 100 - 315Hz
(±) | graves reduzidos - em média 7.6% menor que a mediana
(±) | a linearidade dos graves é média (11% delta para a frequência anterior)
Médios 400 - 2.000 Hz
(±) | médios mais altos - em média 7% maior que a mediana
(±) | a linearidade dos médios é média (7.2% delta para frequência anterior)
Altos 2 - 16 kHz
(+) | agudos equilibrados - apenas 3.8% longe da mediana
(+) | os máximos são lineares (4.5% delta da frequência anterior)
Geral 100 - 16.000 Hz
(+) | o som geral é linear (13.1% diferença em relação à mediana)
Comparado com a mesma classe
» 18% de todos os dispositivos testados nesta classe foram melhores, 4% semelhantes, 78% piores
» O melhor teve um delta de 6%, a média foi 18%, o pior foi 132%
Comparado com todos os dispositivos testados
» 13% de todos os dispositivos testados foram melhores, 3% semelhantes, 84% piores
» O melhor teve um delta de 4%, a média foi 24%, o pior foi 134%
MSI GT75 8RG-090 Titan análise de áudio
(+) | os alto-falantes podem tocar relativamente alto (###valor### dB)
Graves 100 - 315Hz
(±) | graves reduzidos - em média 9.4% menor que a mediana
(±) | a linearidade dos graves é média (8.7% delta para a frequência anterior)
Médios 400 - 2.000 Hz
(±) | médios mais altos - em média 6.8% maior que a mediana
(±) | a linearidade dos médios é média (8.4% delta para frequência anterior)
Altos 2 - 16 kHz
(±) | máximos mais altos - em média 5% maior que a mediana
(±) | a linearidade dos máximos é média (7.8% delta para frequência anterior)
Geral 100 - 16.000 Hz
(+) | o som geral é linear (14.4% diferença em relação à mediana)
Comparado com a mesma classe
» 27% de todos os dispositivos testados nesta classe foram melhores, 7% semelhantes, 66% piores
» O melhor teve um delta de 6%, a média foi 18%, o pior foi 132%
Comparado com todos os dispositivos testados
» 18% de todos os dispositivos testados foram melhores, 4% semelhantes, 78% piores
» O melhor teve um delta de 4%, a média foi 24%, o pior foi 134%
| desligado | |
| Ocioso | |
| Carga |
|
Key:
min: | |
| MSI GT76 Titan DT 9SG i9-9900K, GeForce RTX 2080 Mobile | Alienware Area-51m i9-9900K RTX 2080 i9-9900K, GeForce RTX 2080 Mobile | Schenker XMG Ultra 17 Turing i9-9900K, GeForce RTX 2080 Mobile | MSI GE75 9SG i9-9880H, GeForce RTX 2080 Mobile | Asus ROG G703GX i7-8750H, GeForce RTX 2080 Mobile | Média da turma Gaming | |
|---|---|---|---|---|---|---|
| Power Consumption | -42% | -74% | 8% | -4% | 8% | |
| Idle Minimum * (Watt) | 14 | 23.3 -66% | 39 -179% | 13.9 1% | 5 64% | 13.3 ? 5% |
| Idle Average * (Watt) | 18 | 33.5 -86% | 45 -150% | 18.8 -4% | 24 -33% | 19 ? -6% |
| Idle Maximum * (Watt) | 23 | 38.4 -67% | 55 -139% | 23.1 -0% | 42 -83% | 24.5 ? -7% |
| Load Average * (Watt) | 114 | 114.1 -0% | 122 -7% | 112.3 1% | 112 2% | 108.1 ? 5% |
| Witcher 3 ultra * (Watt) | 283 | 339.5 -20% | 259 8% | 231 18% | 284 -0% | |
| Load Maximum * (Watt) | 443 | 485.1 -10% | 346 22% | 291.5 34% | 320 28% | 254 ? 43% |
* ... menor é melhor
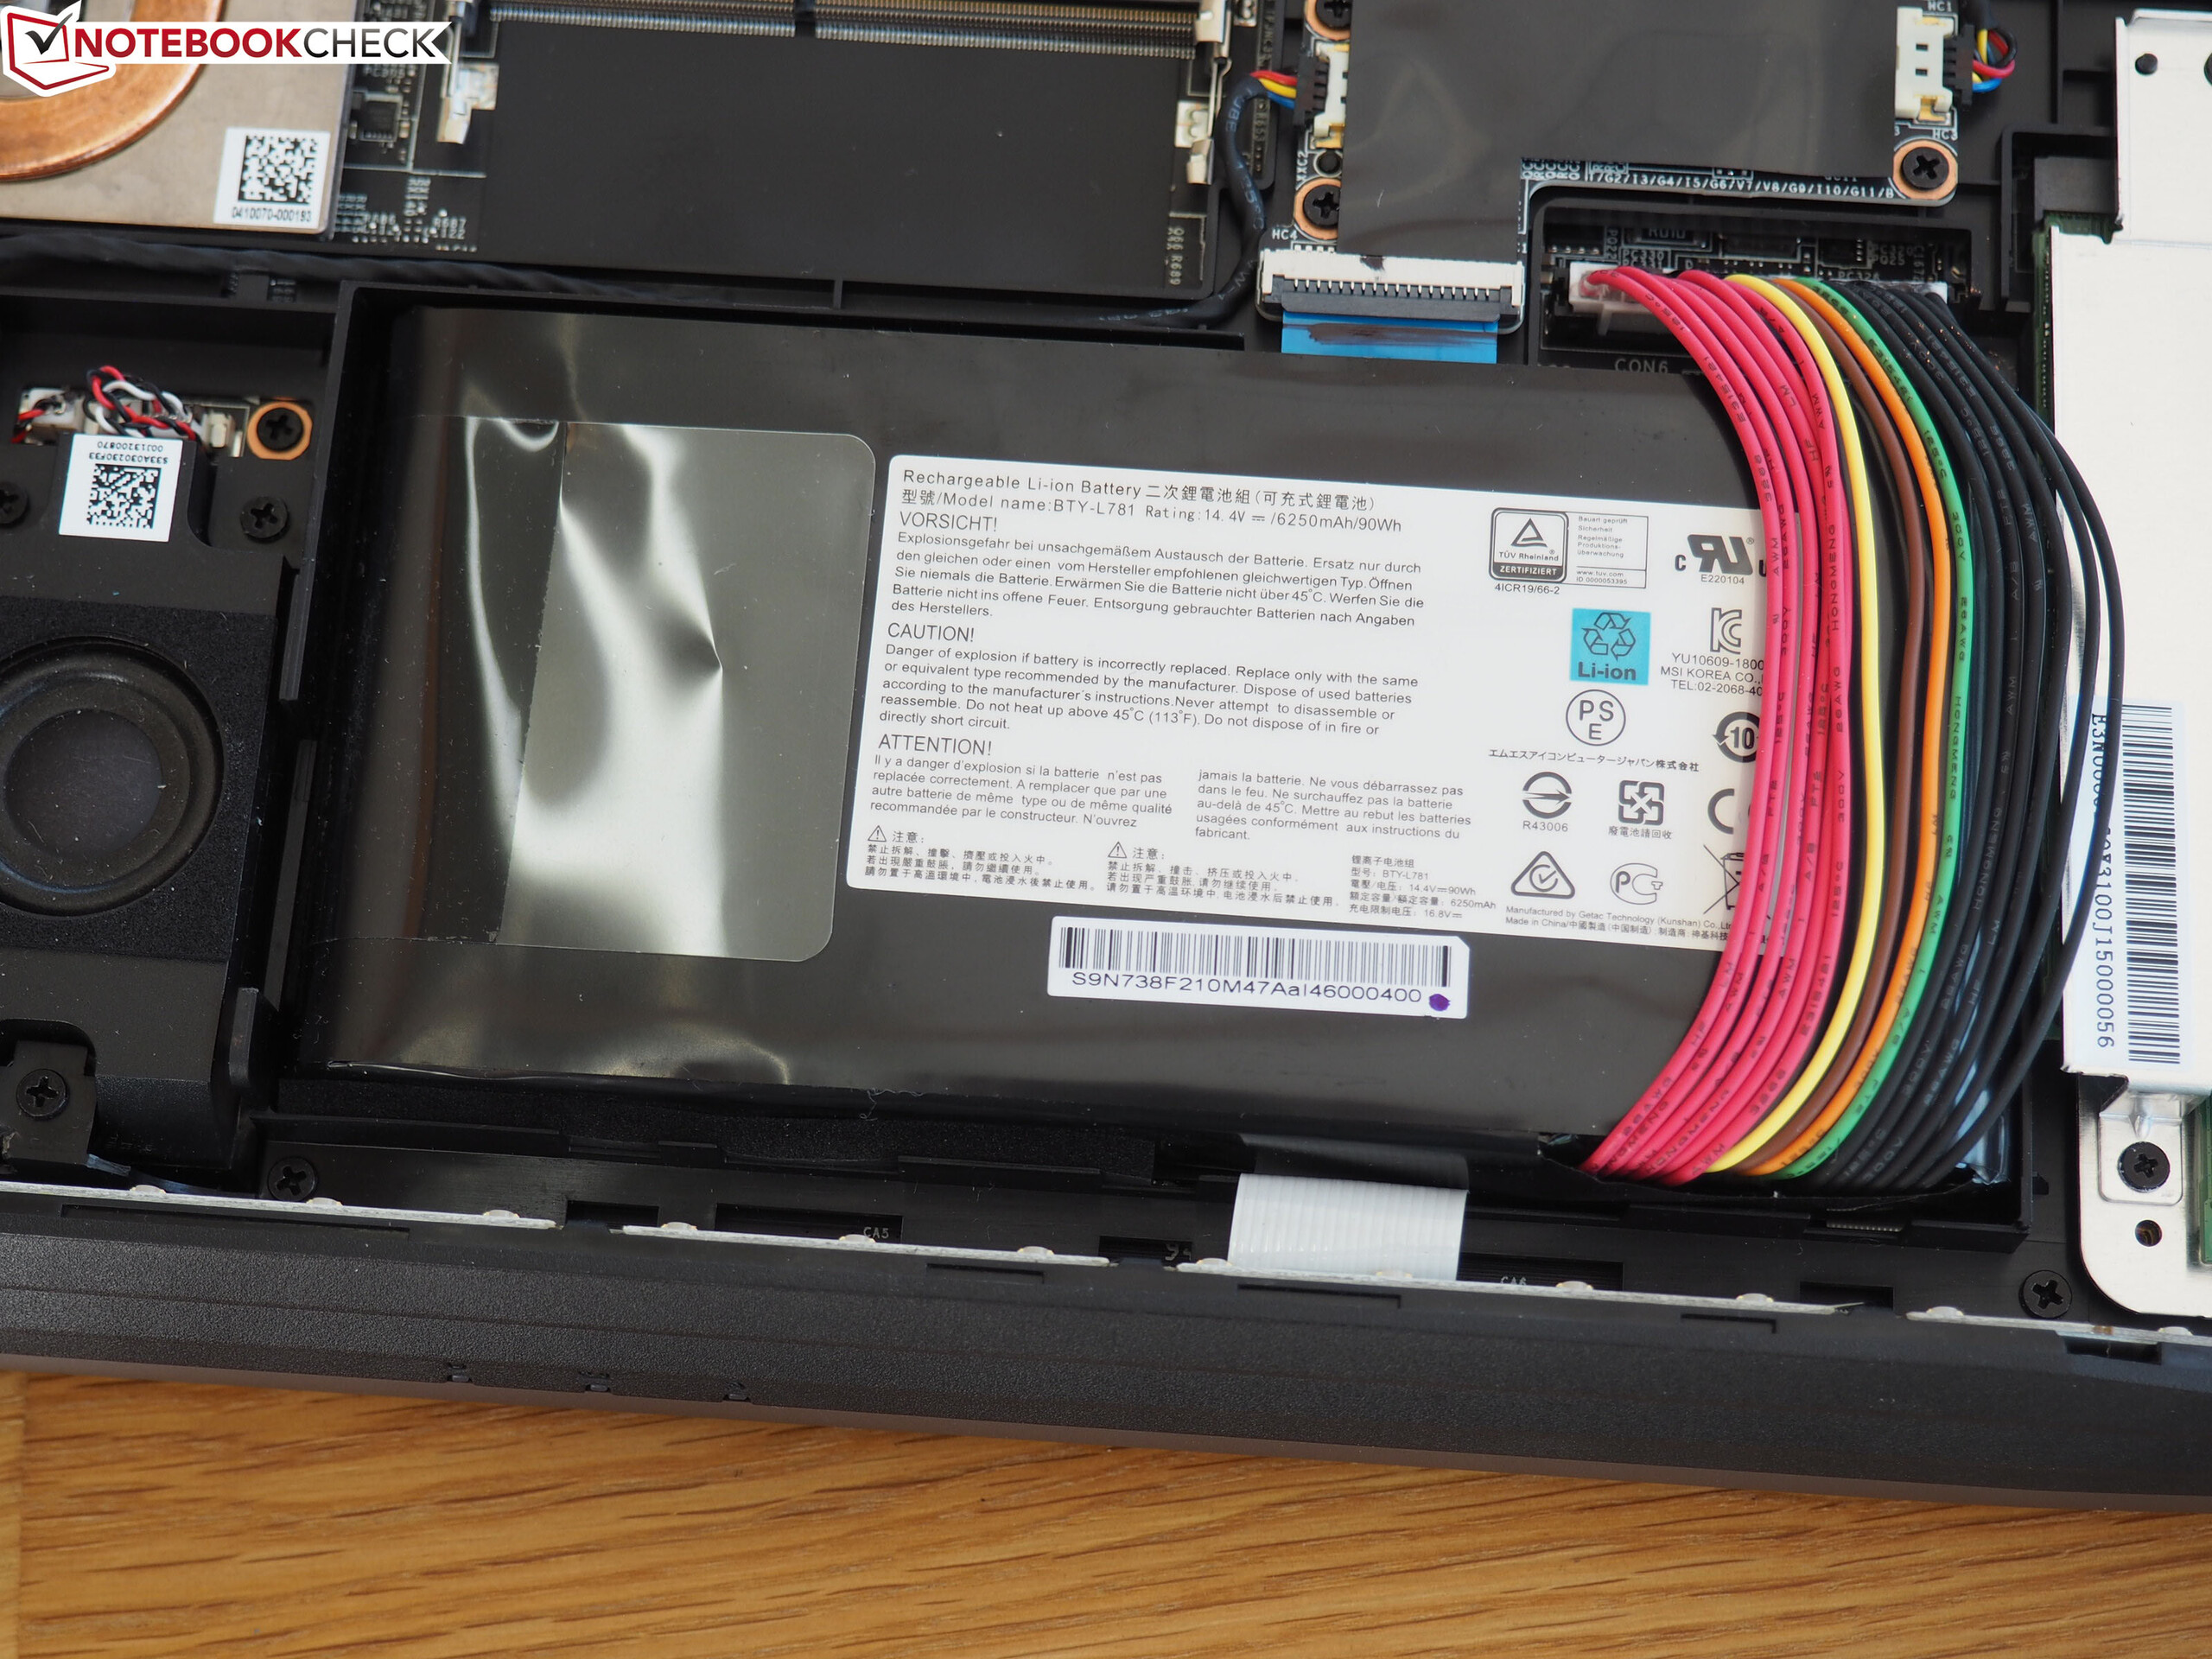
| MSI GT76 Titan DT 9SG i9-9900K, GeForce RTX 2080 Mobile, 90 Wh | Alienware Area-51m i9-9900K RTX 2080 i9-9900K, GeForce RTX 2080 Mobile, 90 Wh | Schenker XMG Ultra 17 Turing i9-9900K, GeForce RTX 2080 Mobile, 82 Wh | MSI GE75 9SG i9-9880H, GeForce RTX 2080 Mobile, 65 Wh | Asus ROG G703GX i7-8750H, GeForce RTX 2080 Mobile, 96 Wh | Média da turma Gaming | |
|---|---|---|---|---|---|---|
| Duração da bateria | -33% | -30% | -2% | -1% | 44% | |
| Reader / Idle (h) | 6.8 | 2.6 -62% | 2.8 -59% | 5 -26% | 8.71 ? 28% | |
| WiFi v1.3 (h) | 5 | 2.1 -58% | 2.3 -54% | 4.9 -2% | 4 -20% | 7.01 ? 40% |
| Load (h) | 0.9 | 1.1 22% | 1.1 22% | 1.3 44% | 1.47 ? 63% | |
| H.264 (h) | 2.3 | 3.8 | 8.26 ? |
Pro
Contra
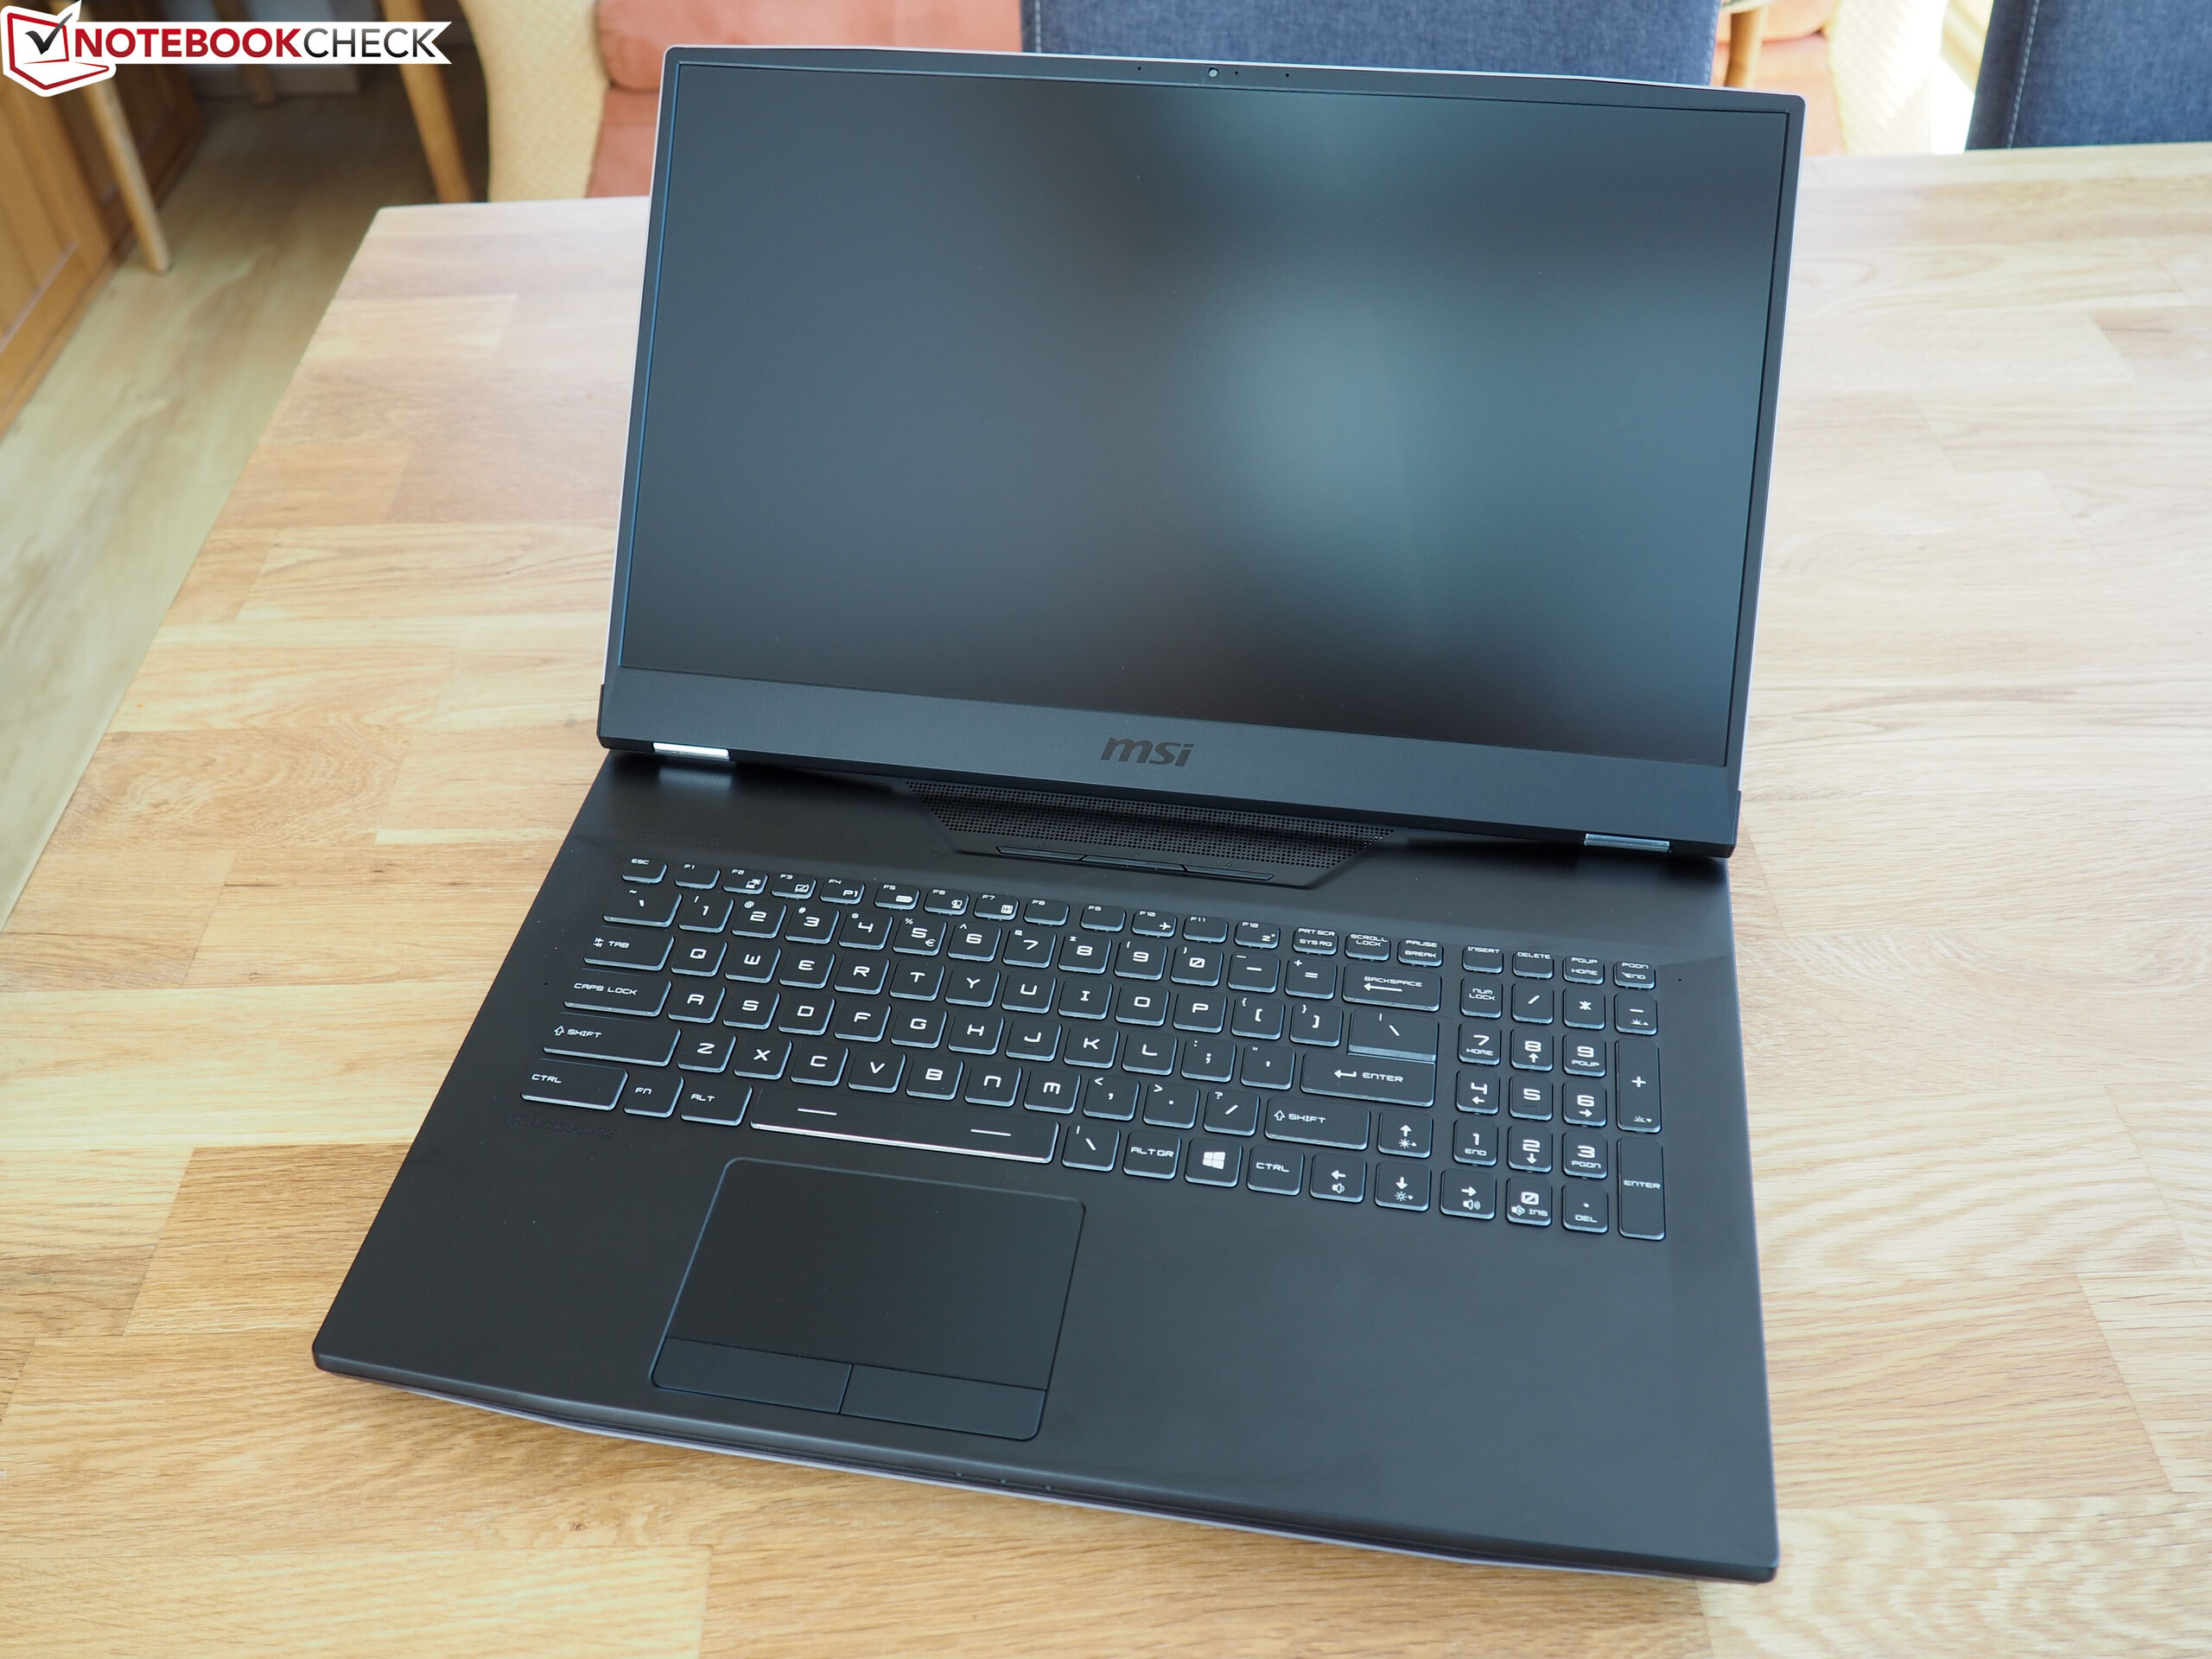
O GT76 9SG Titan DT é um portátil extraordinário, pelo menos no que diz respeito ao preço e desempenho. O GT76 9SG Titan DT é um portátil extraordinário, pelo menos no que diz respeito ao preço e desempenho.
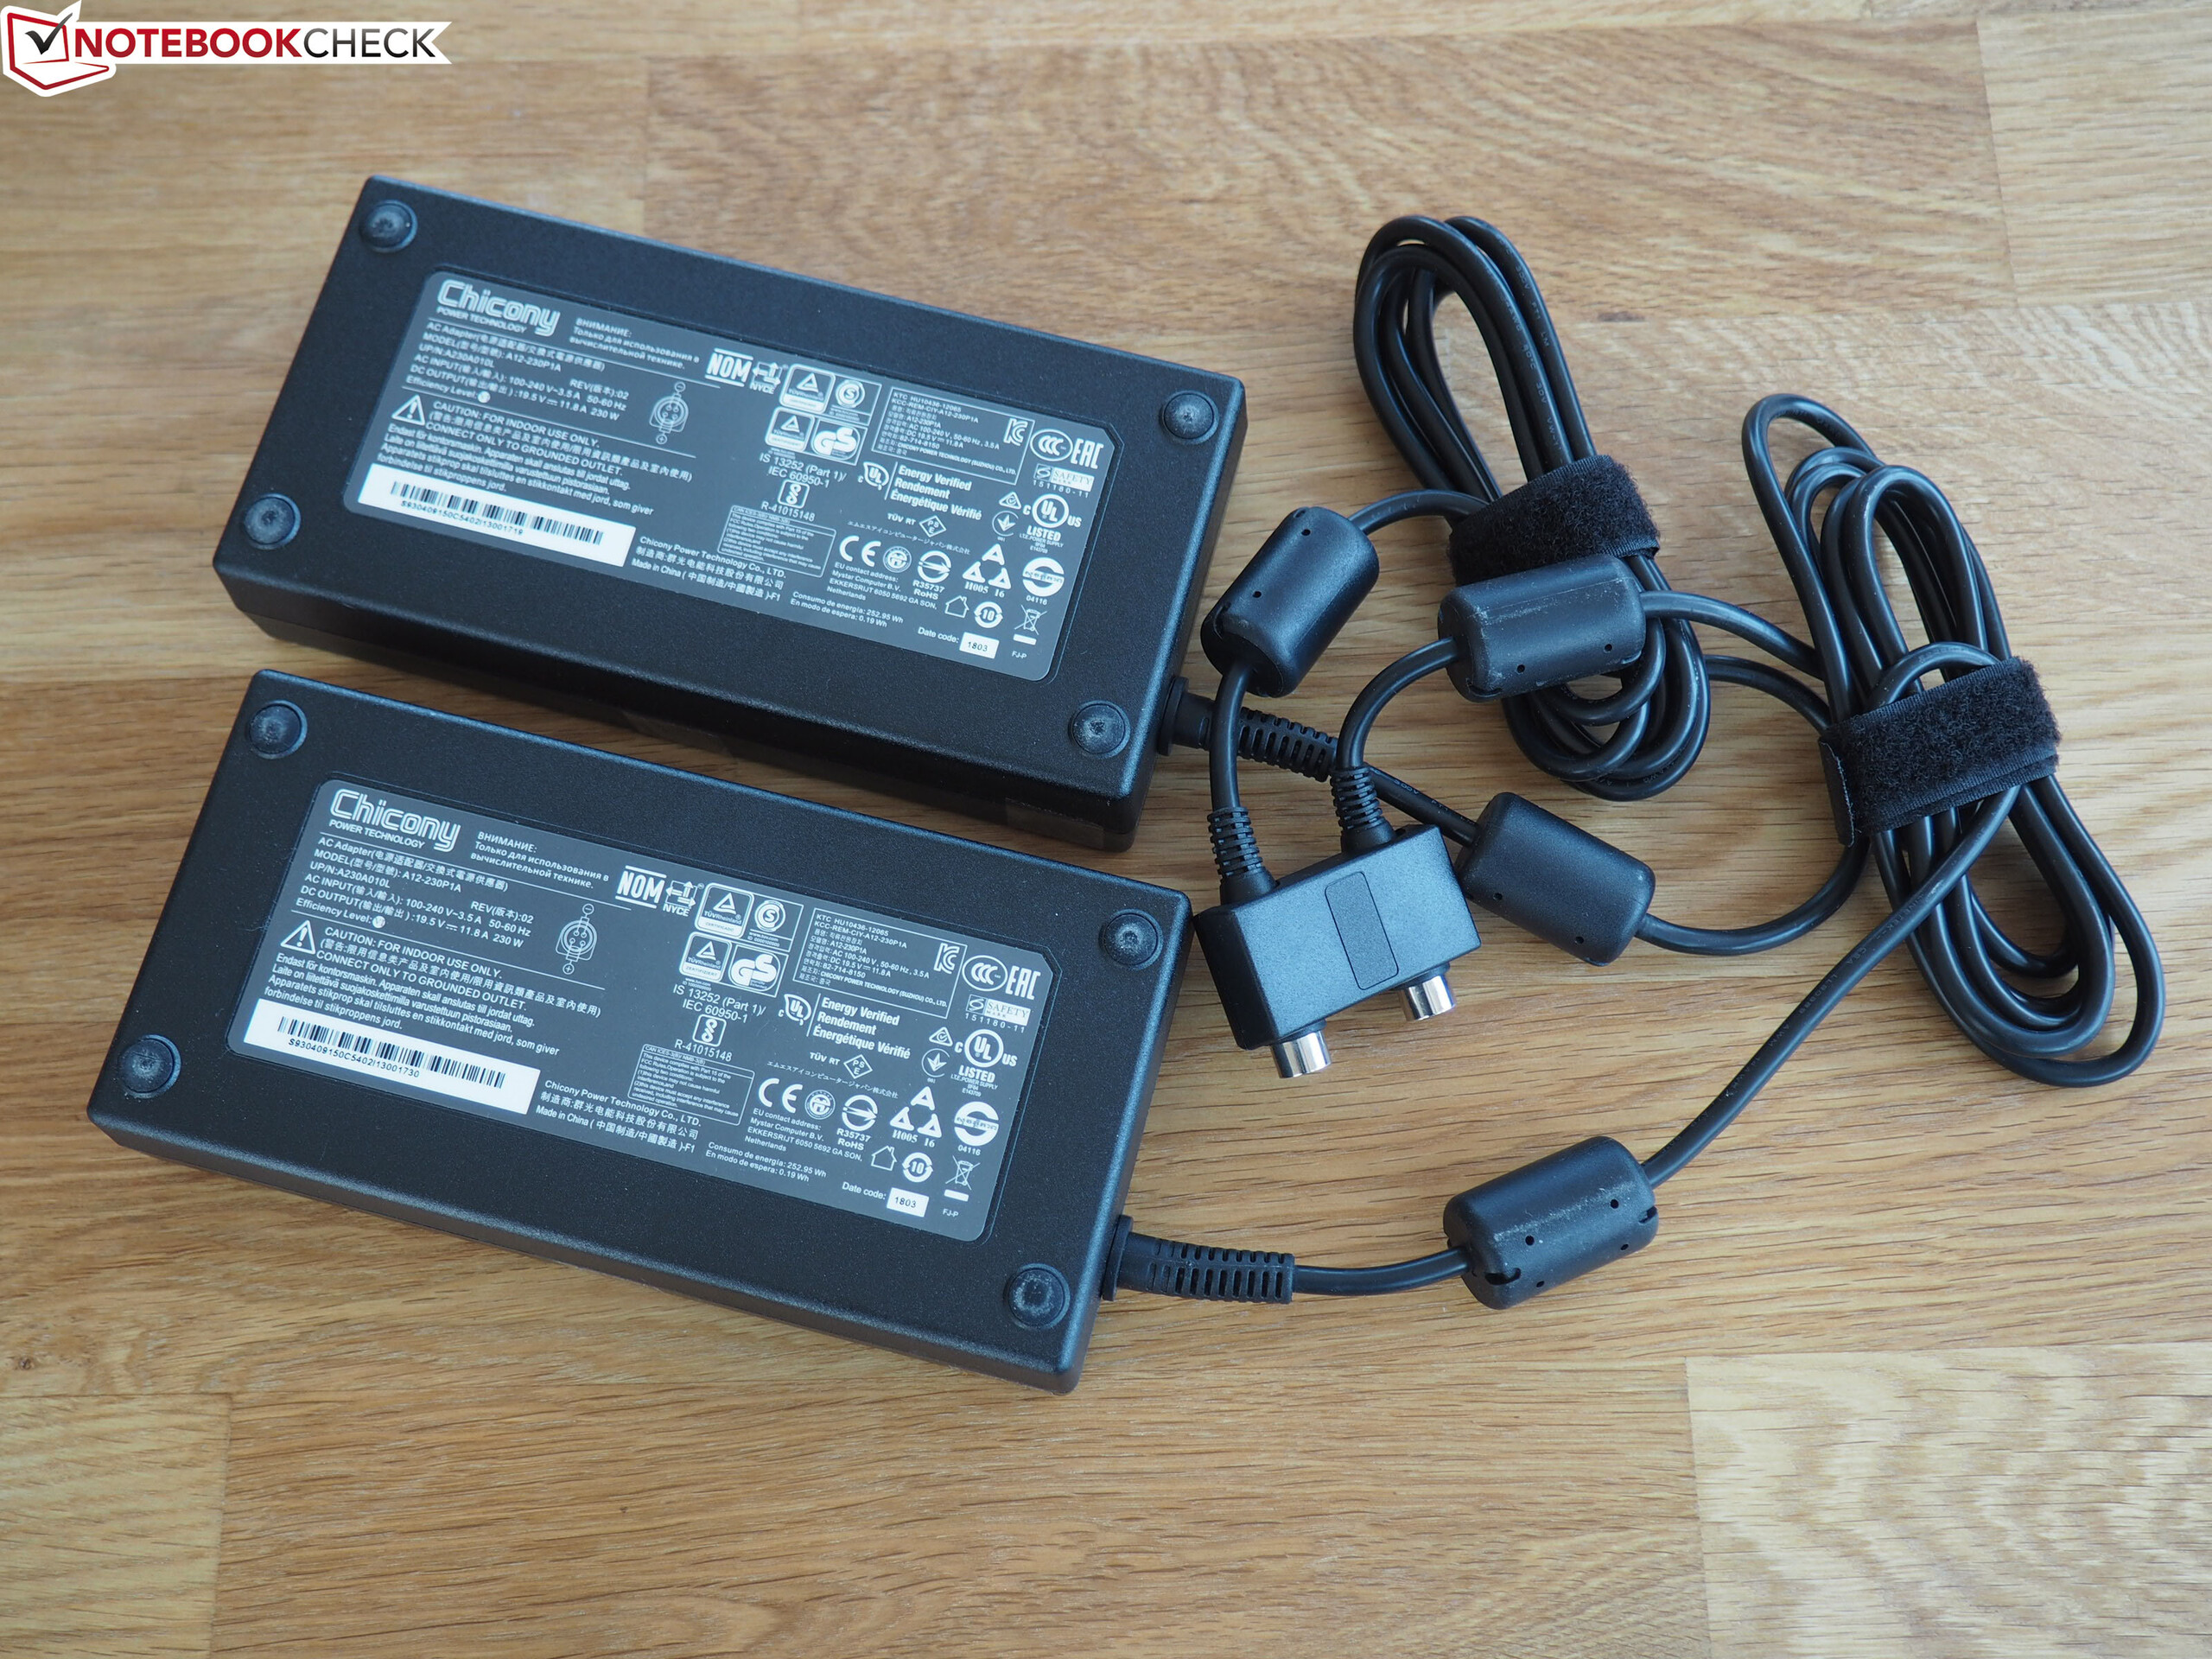
O desempenho de primeira classe é comprado às custas da quietude, o que pode assustar alguns clientes (recomendamos usar fones de ouvido quando estiver jogando no GT76). Uma vez que você põe ao lado o peso pesado, a parte traseira grande e os dois adaptadores de poder, realmente não há muito para reclamar.
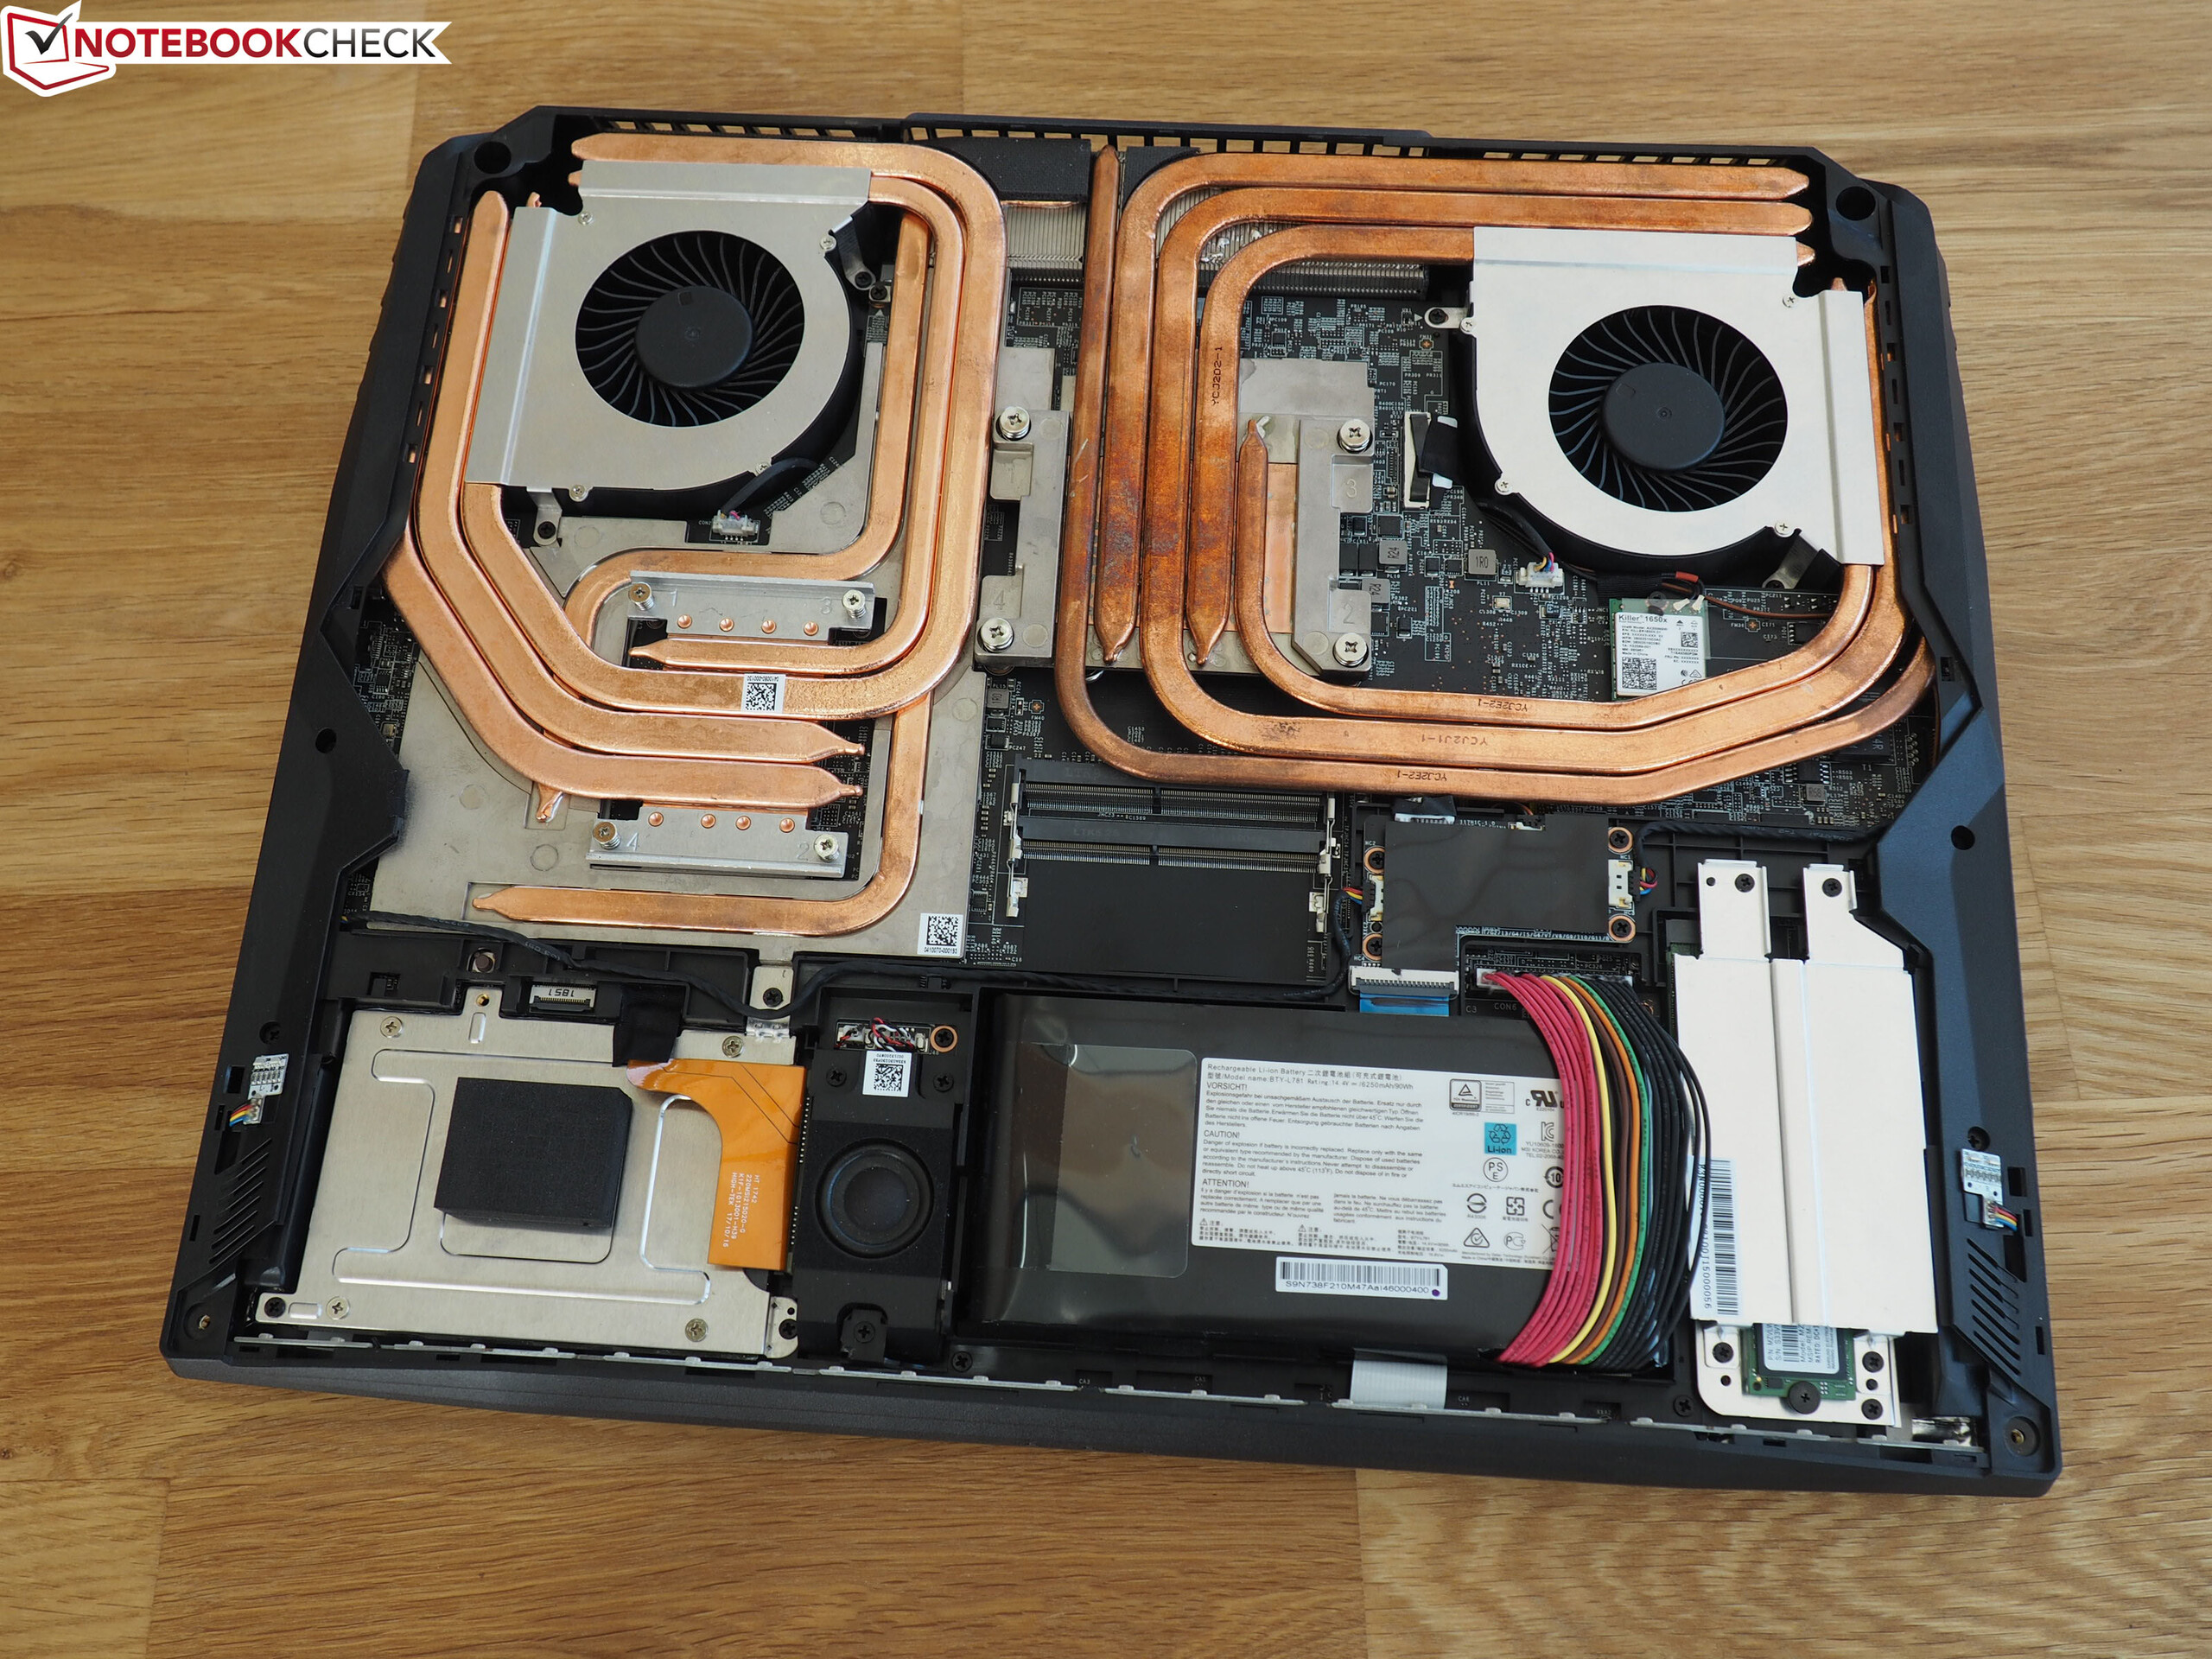
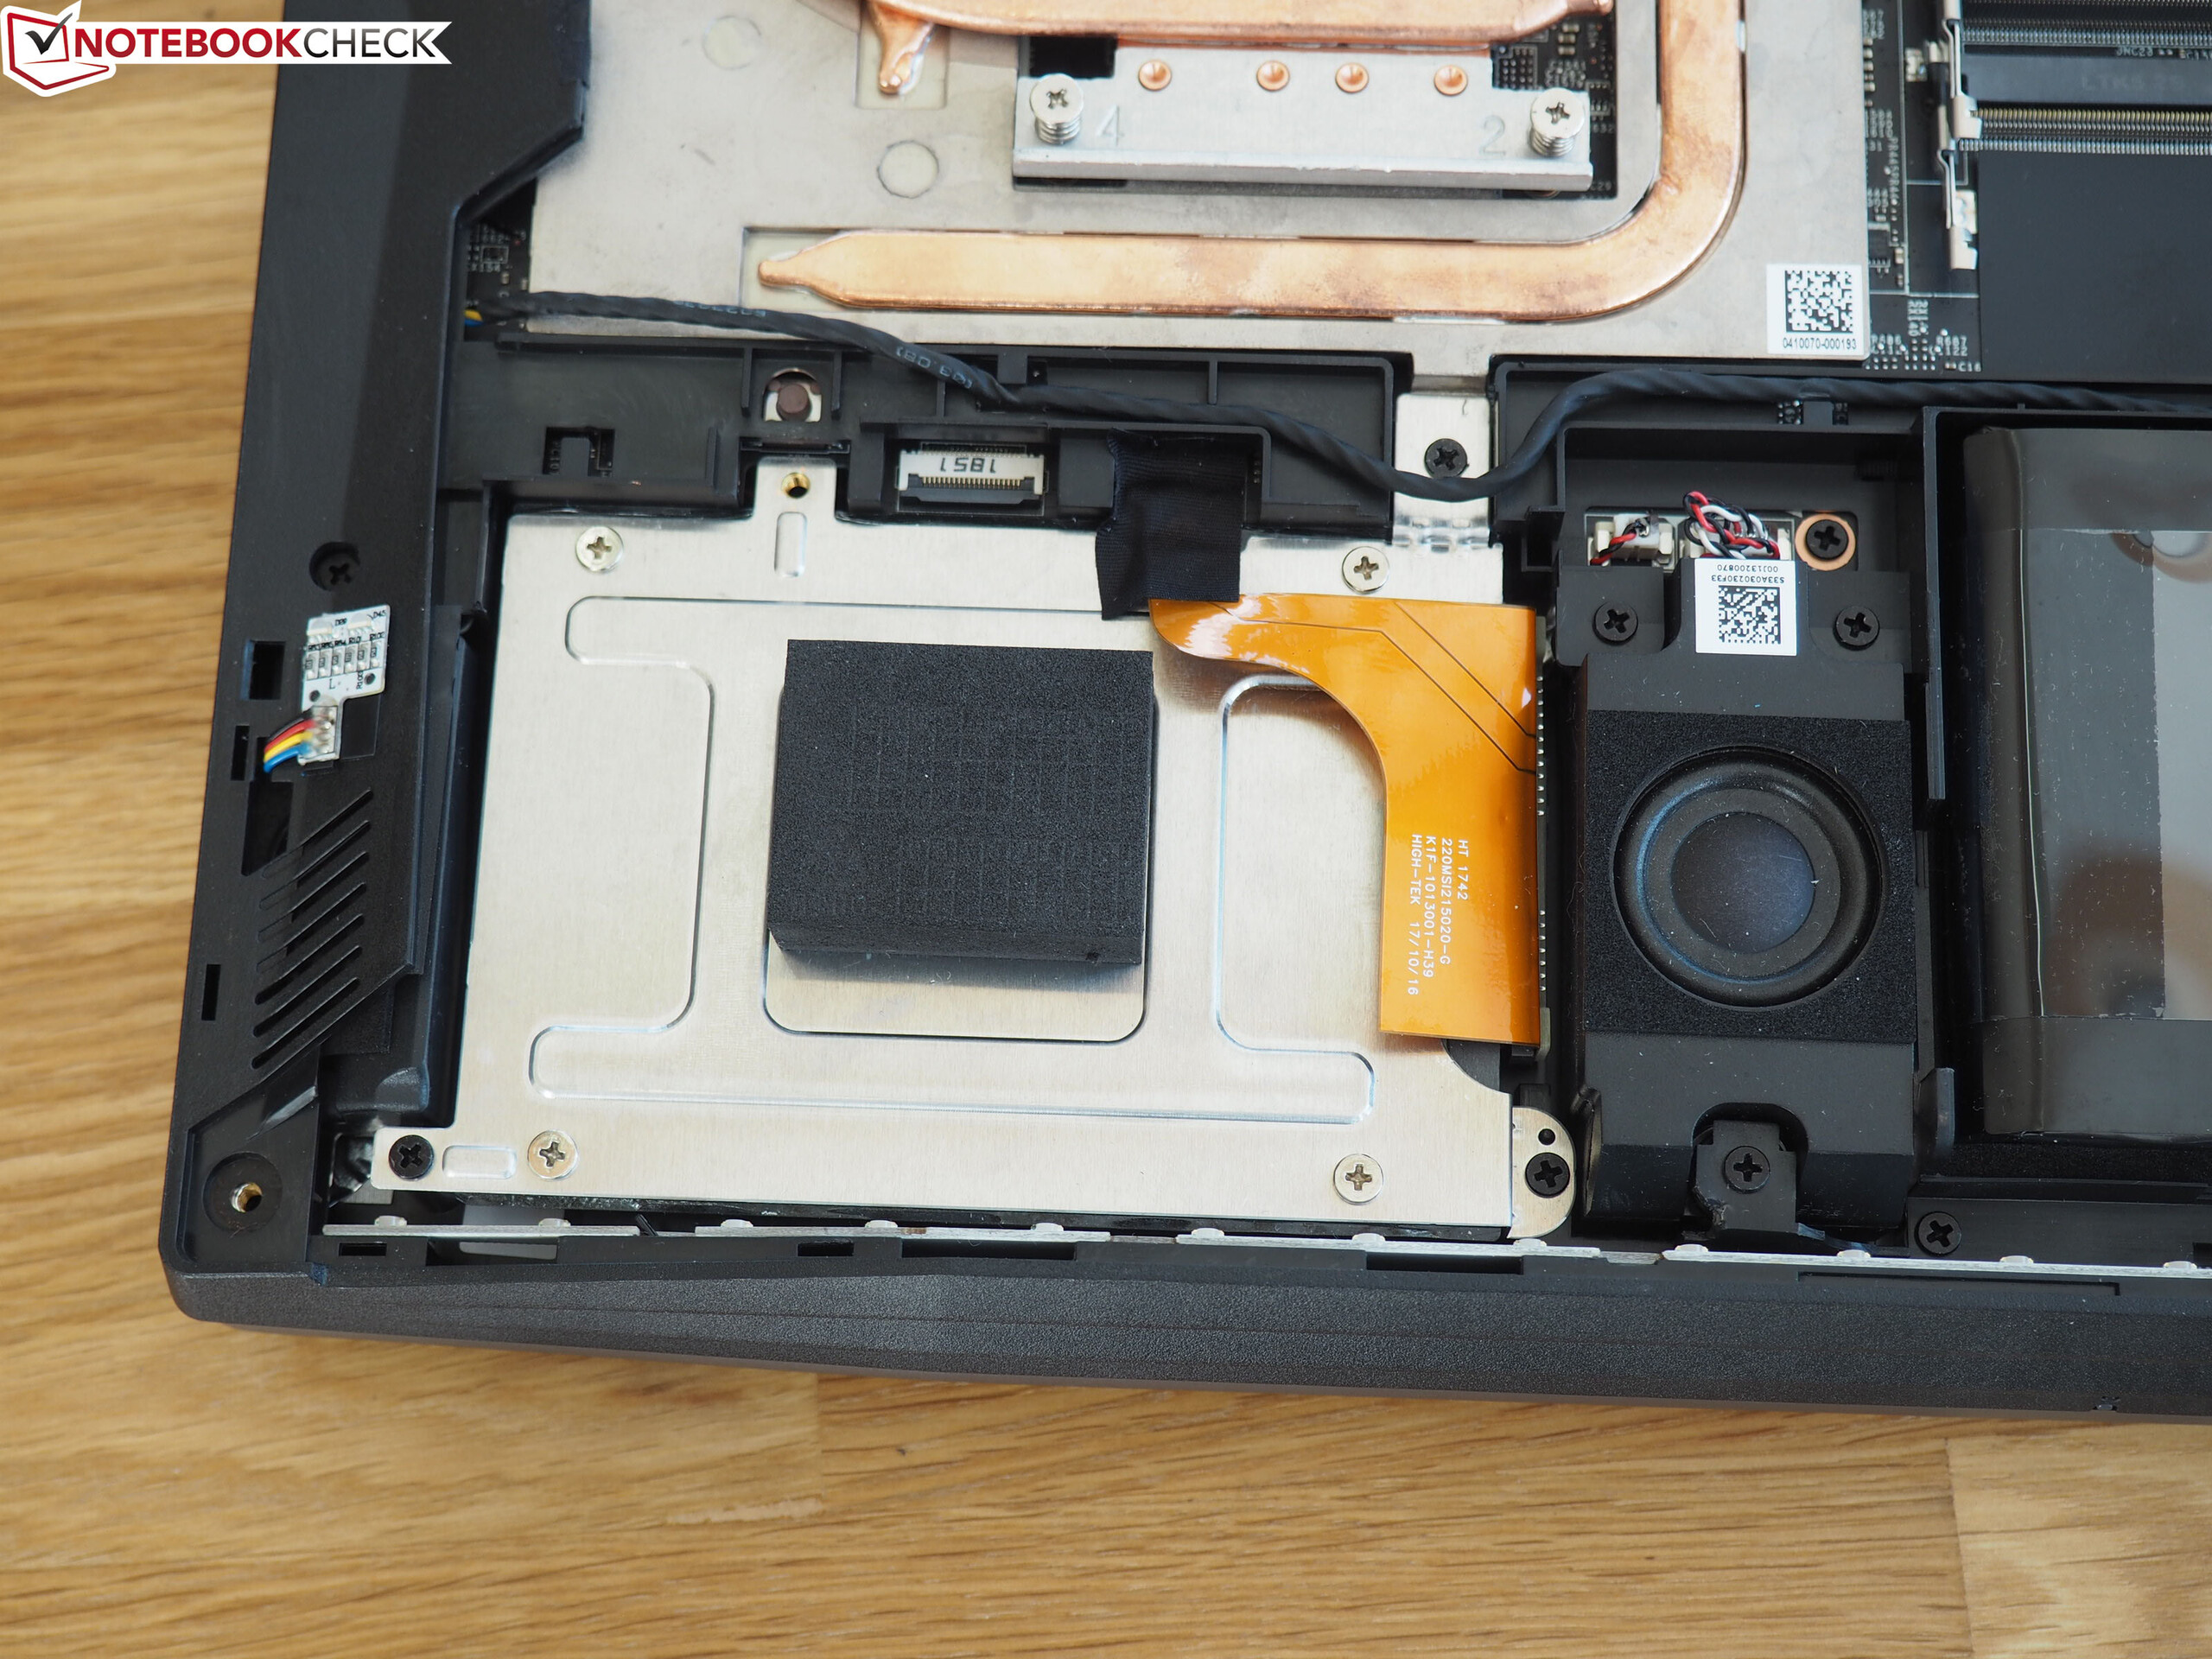
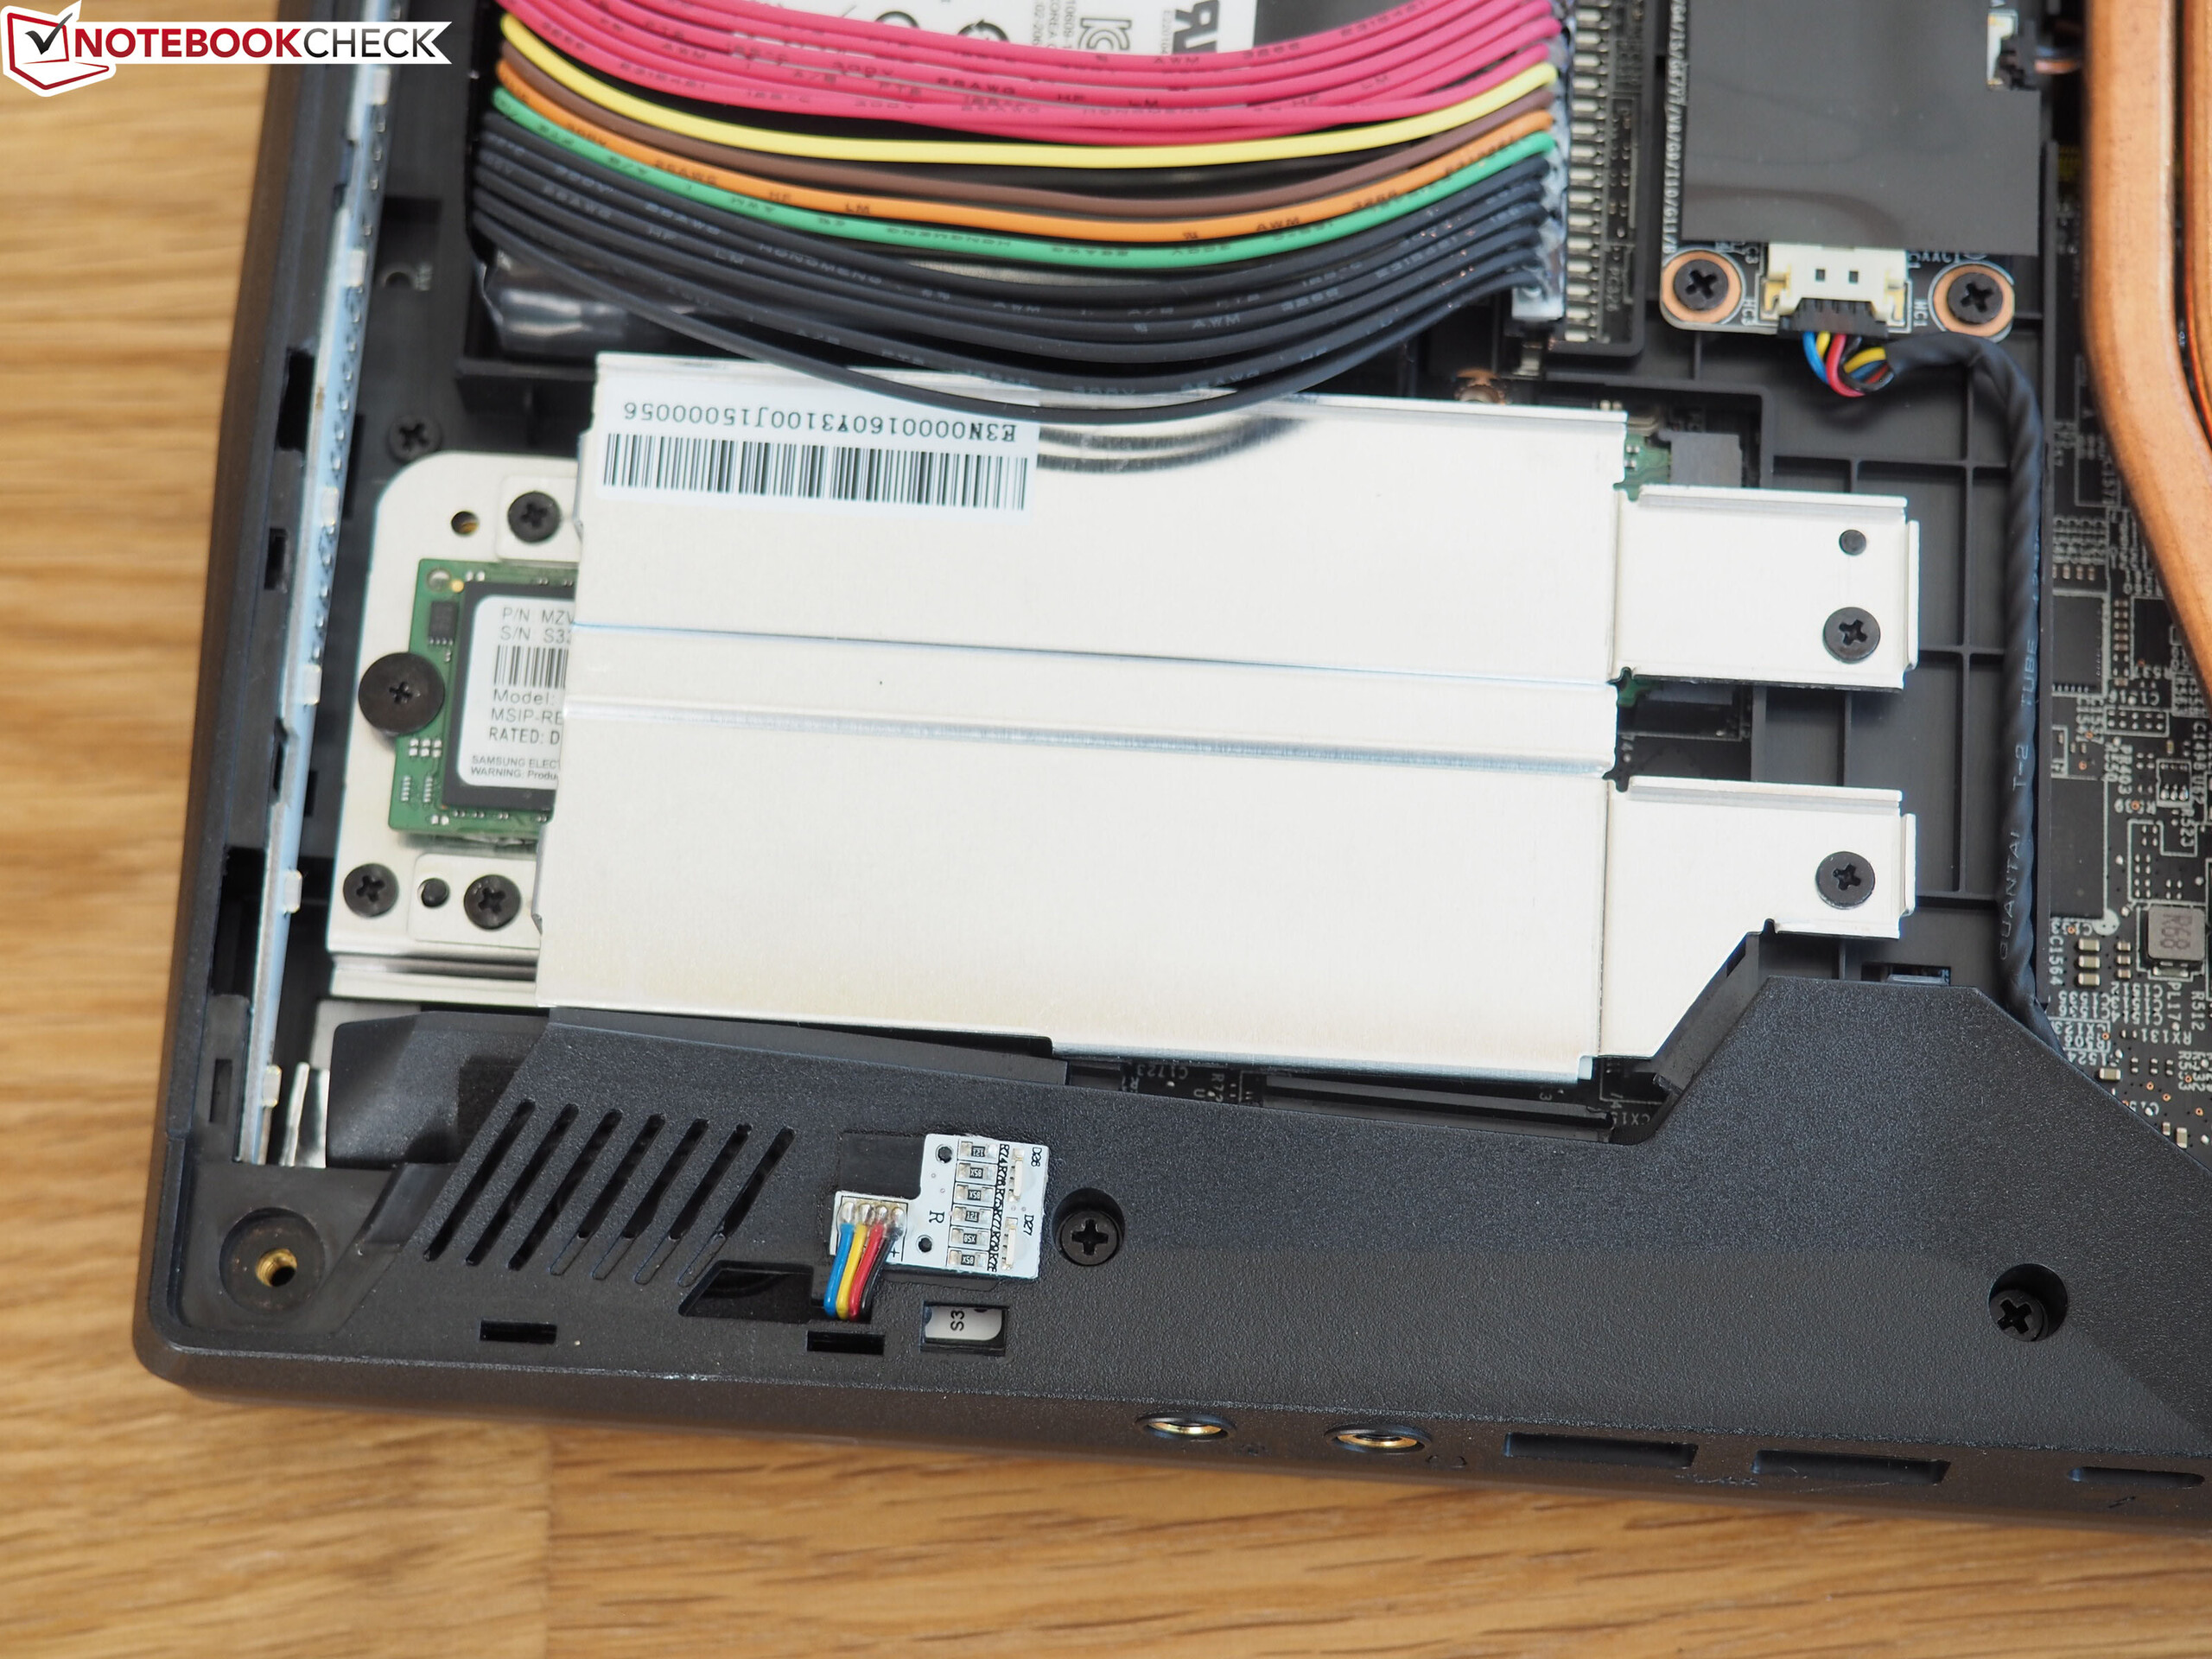
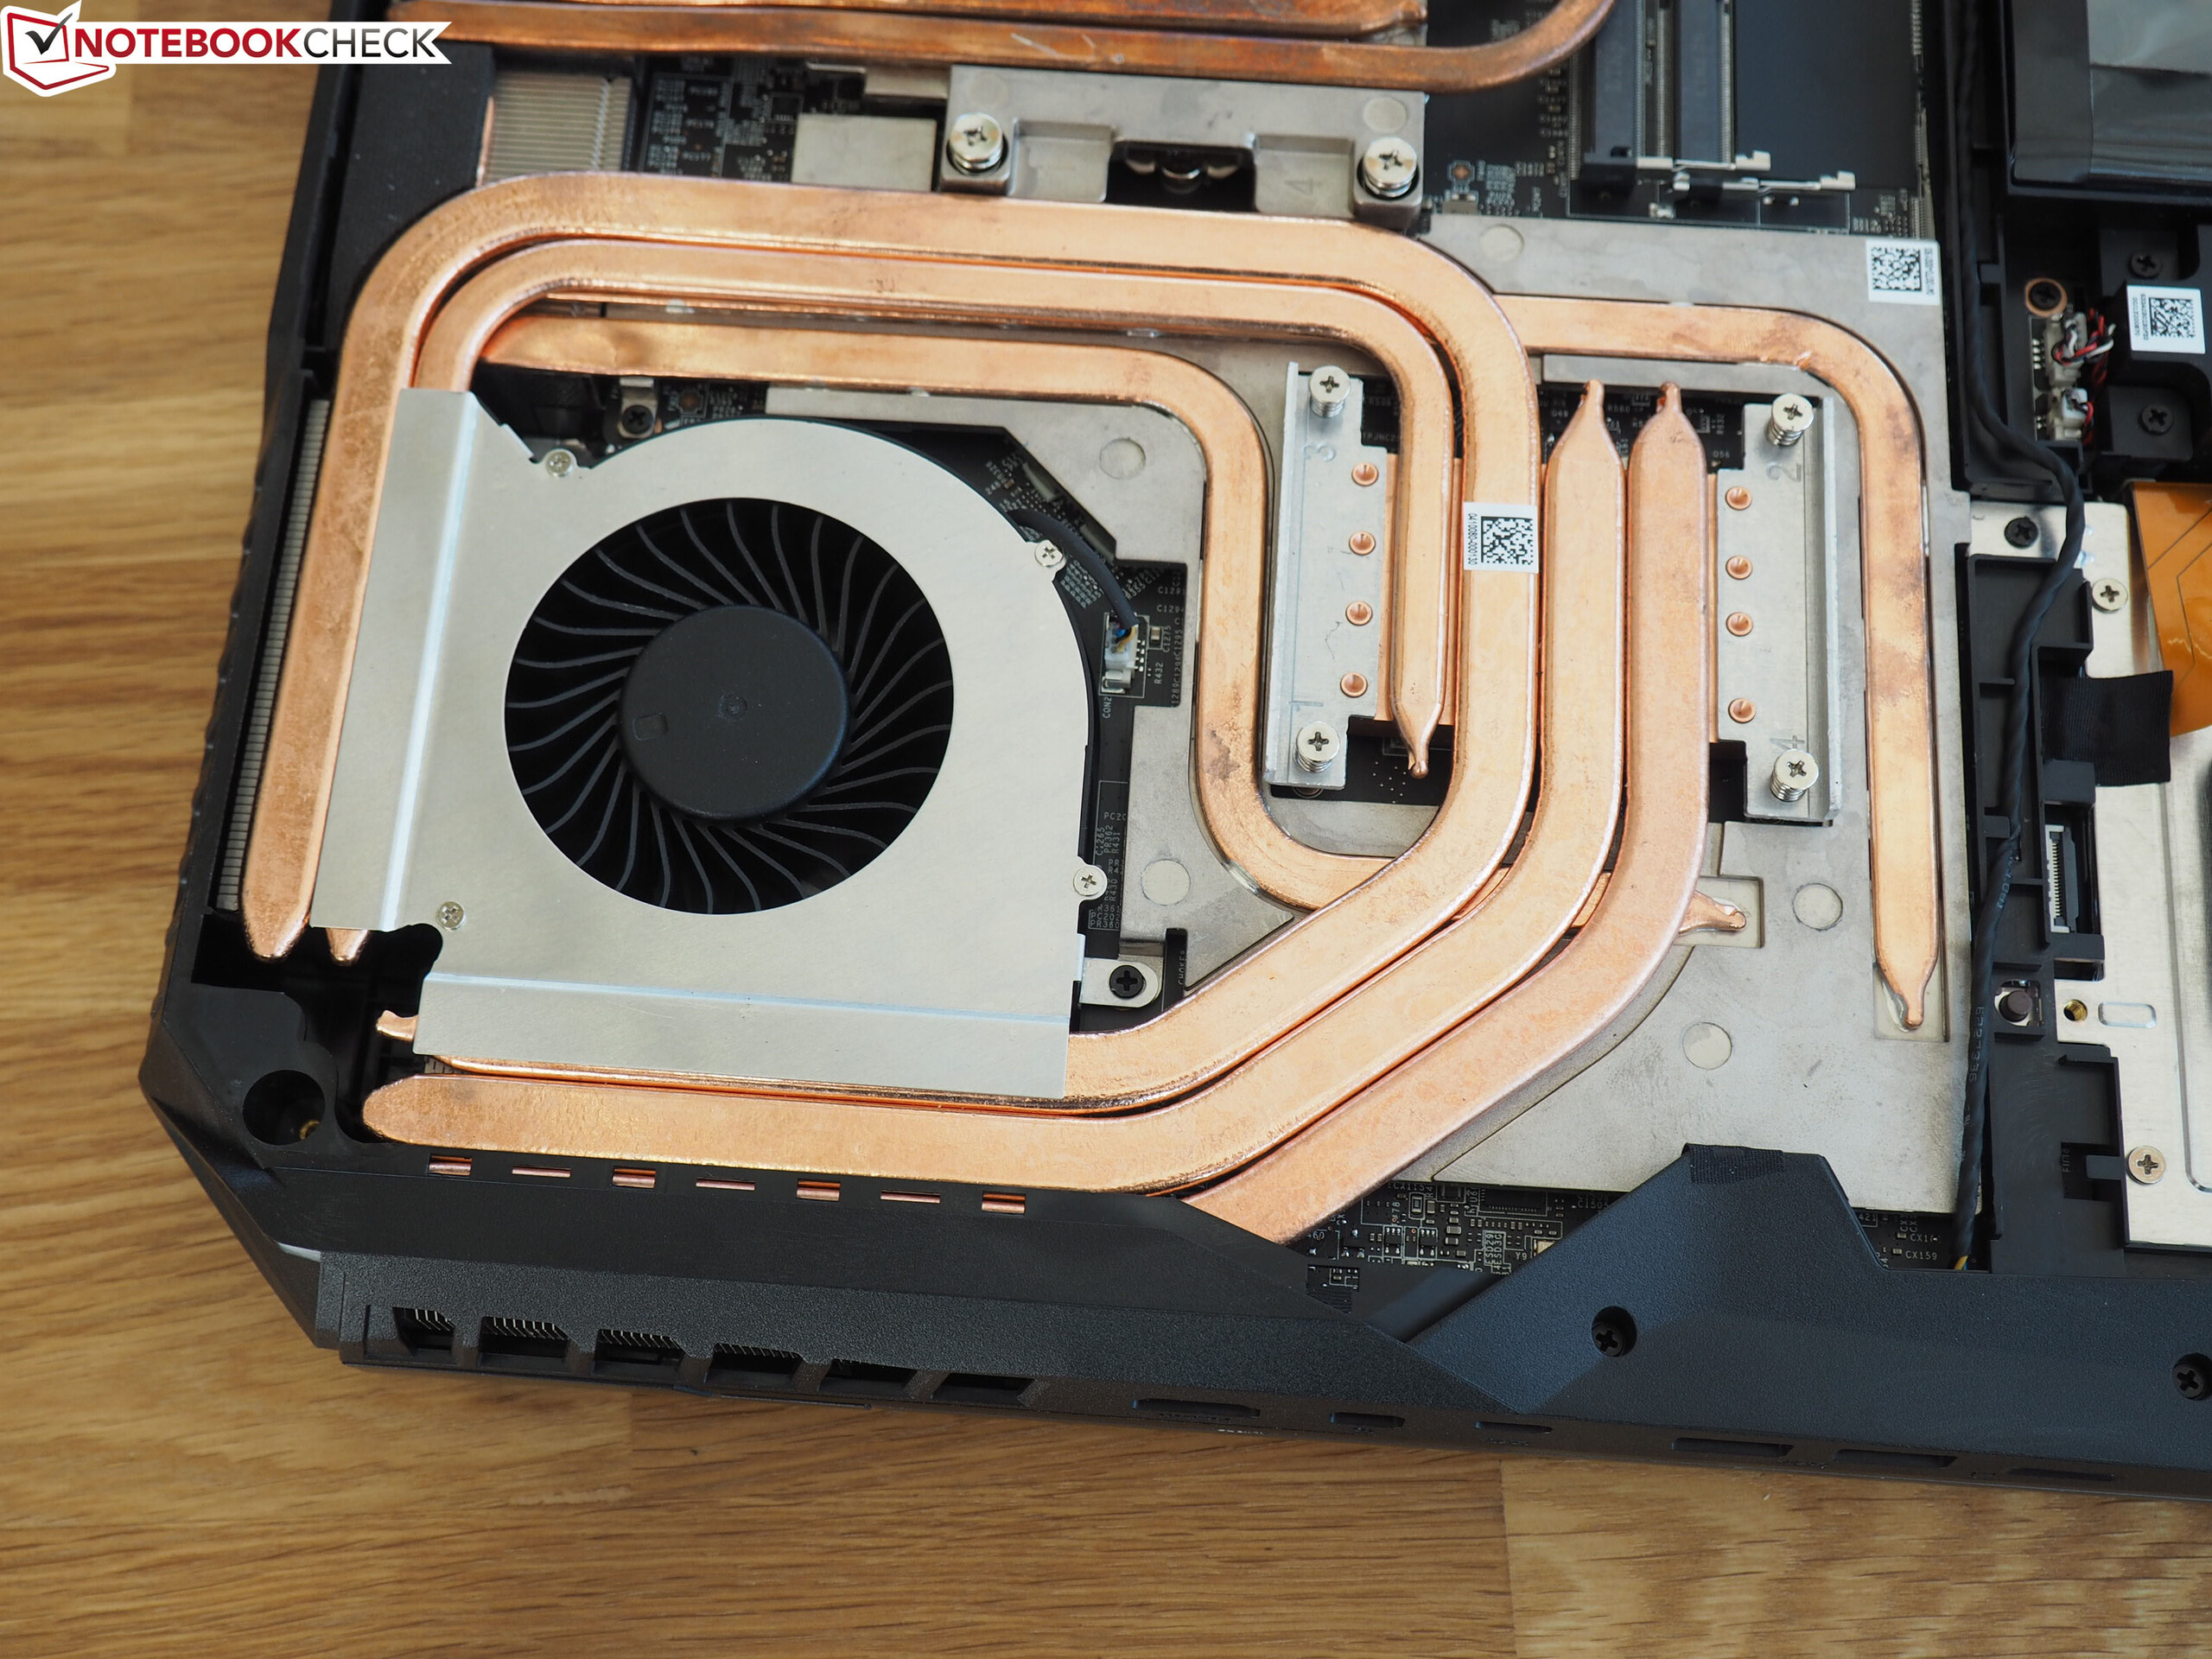
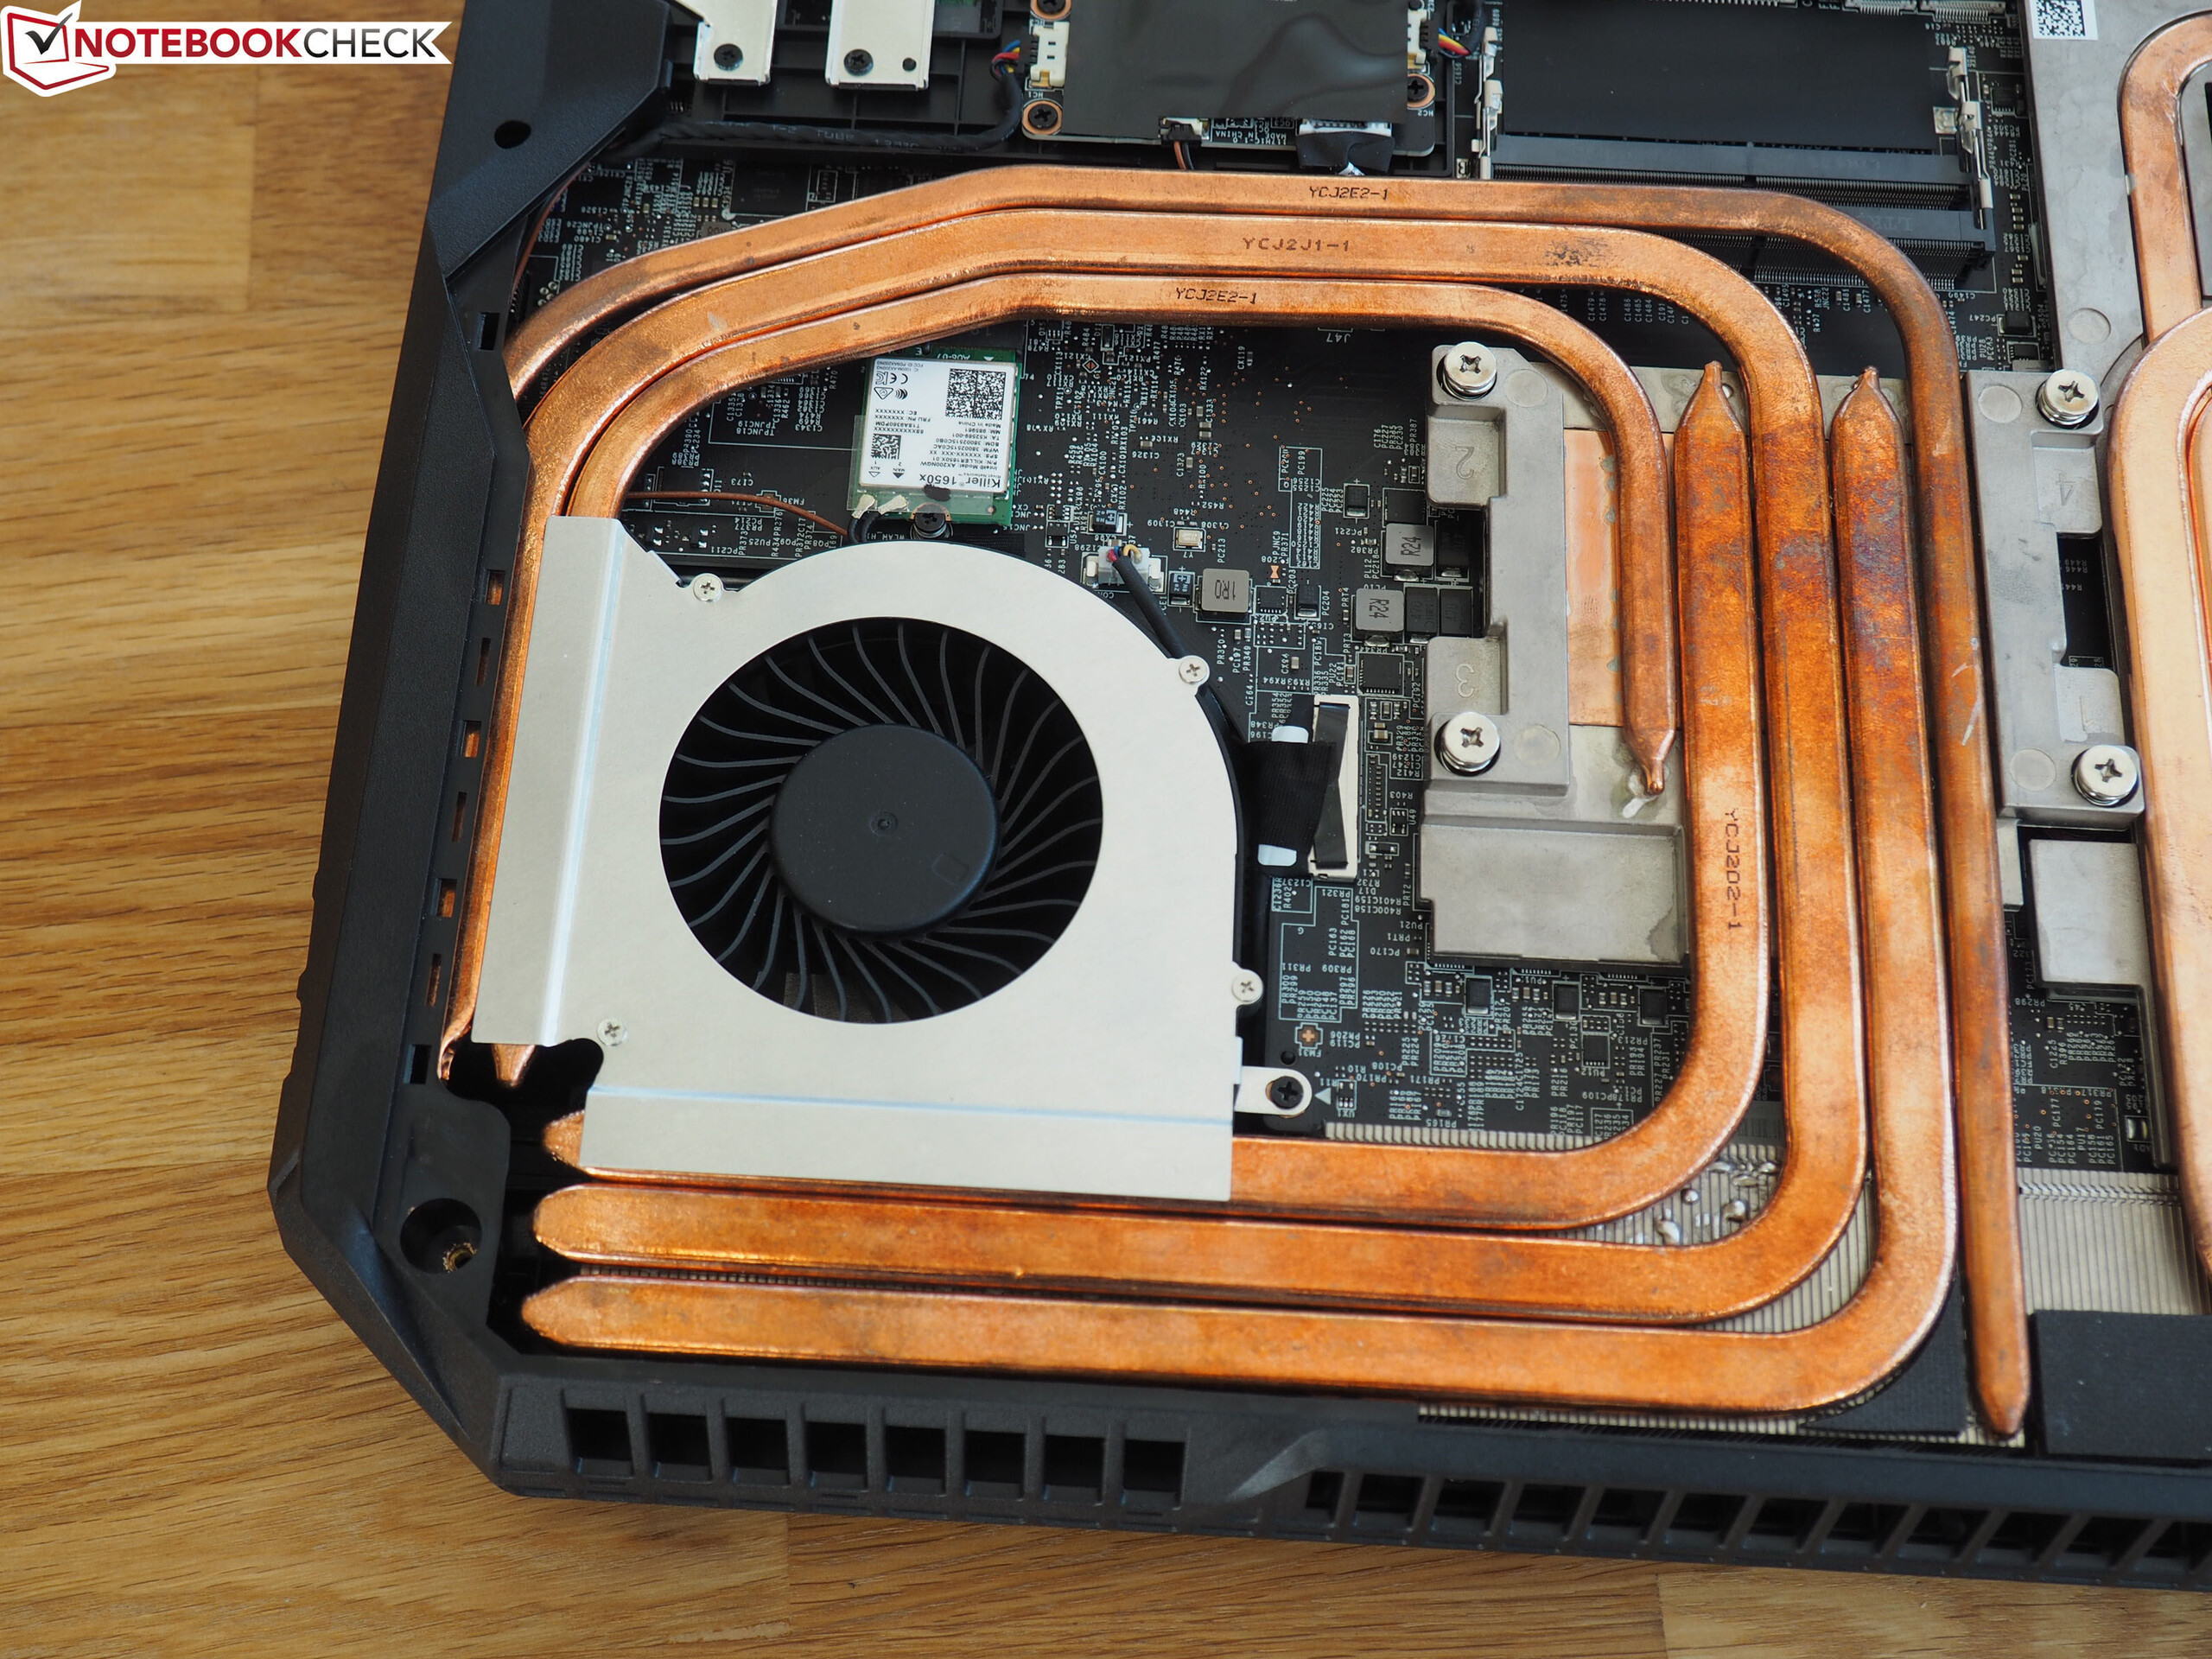
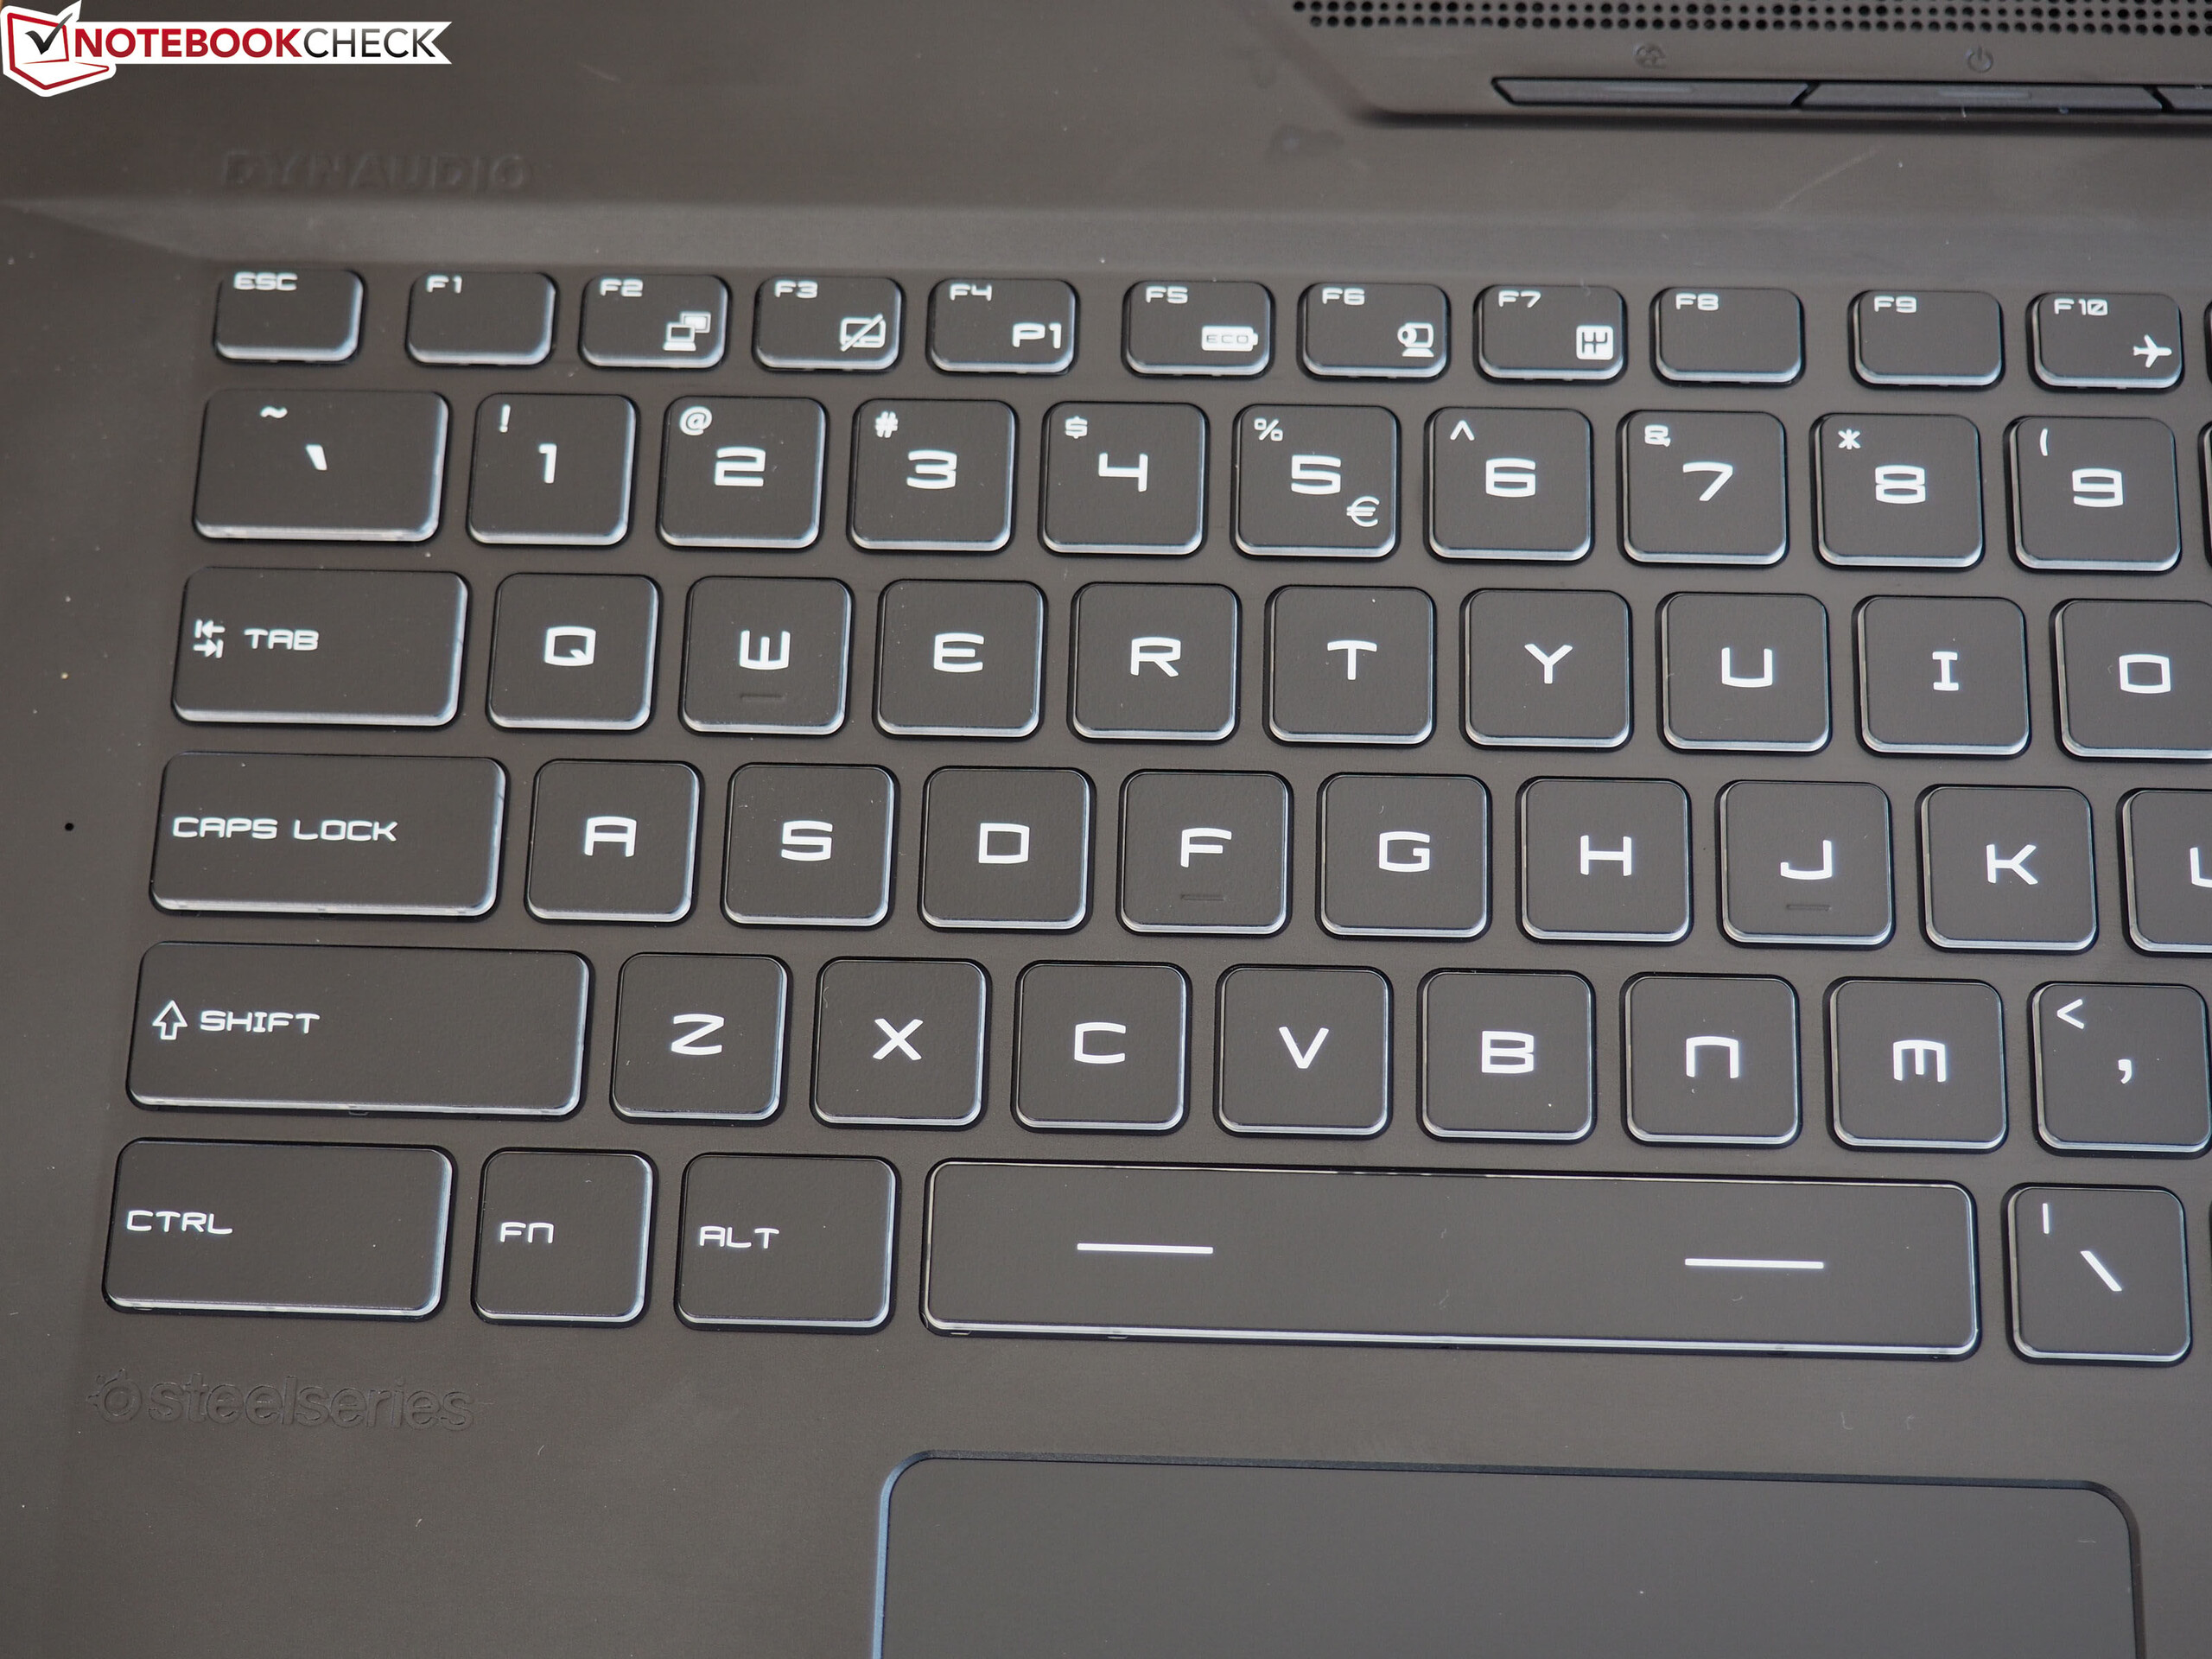
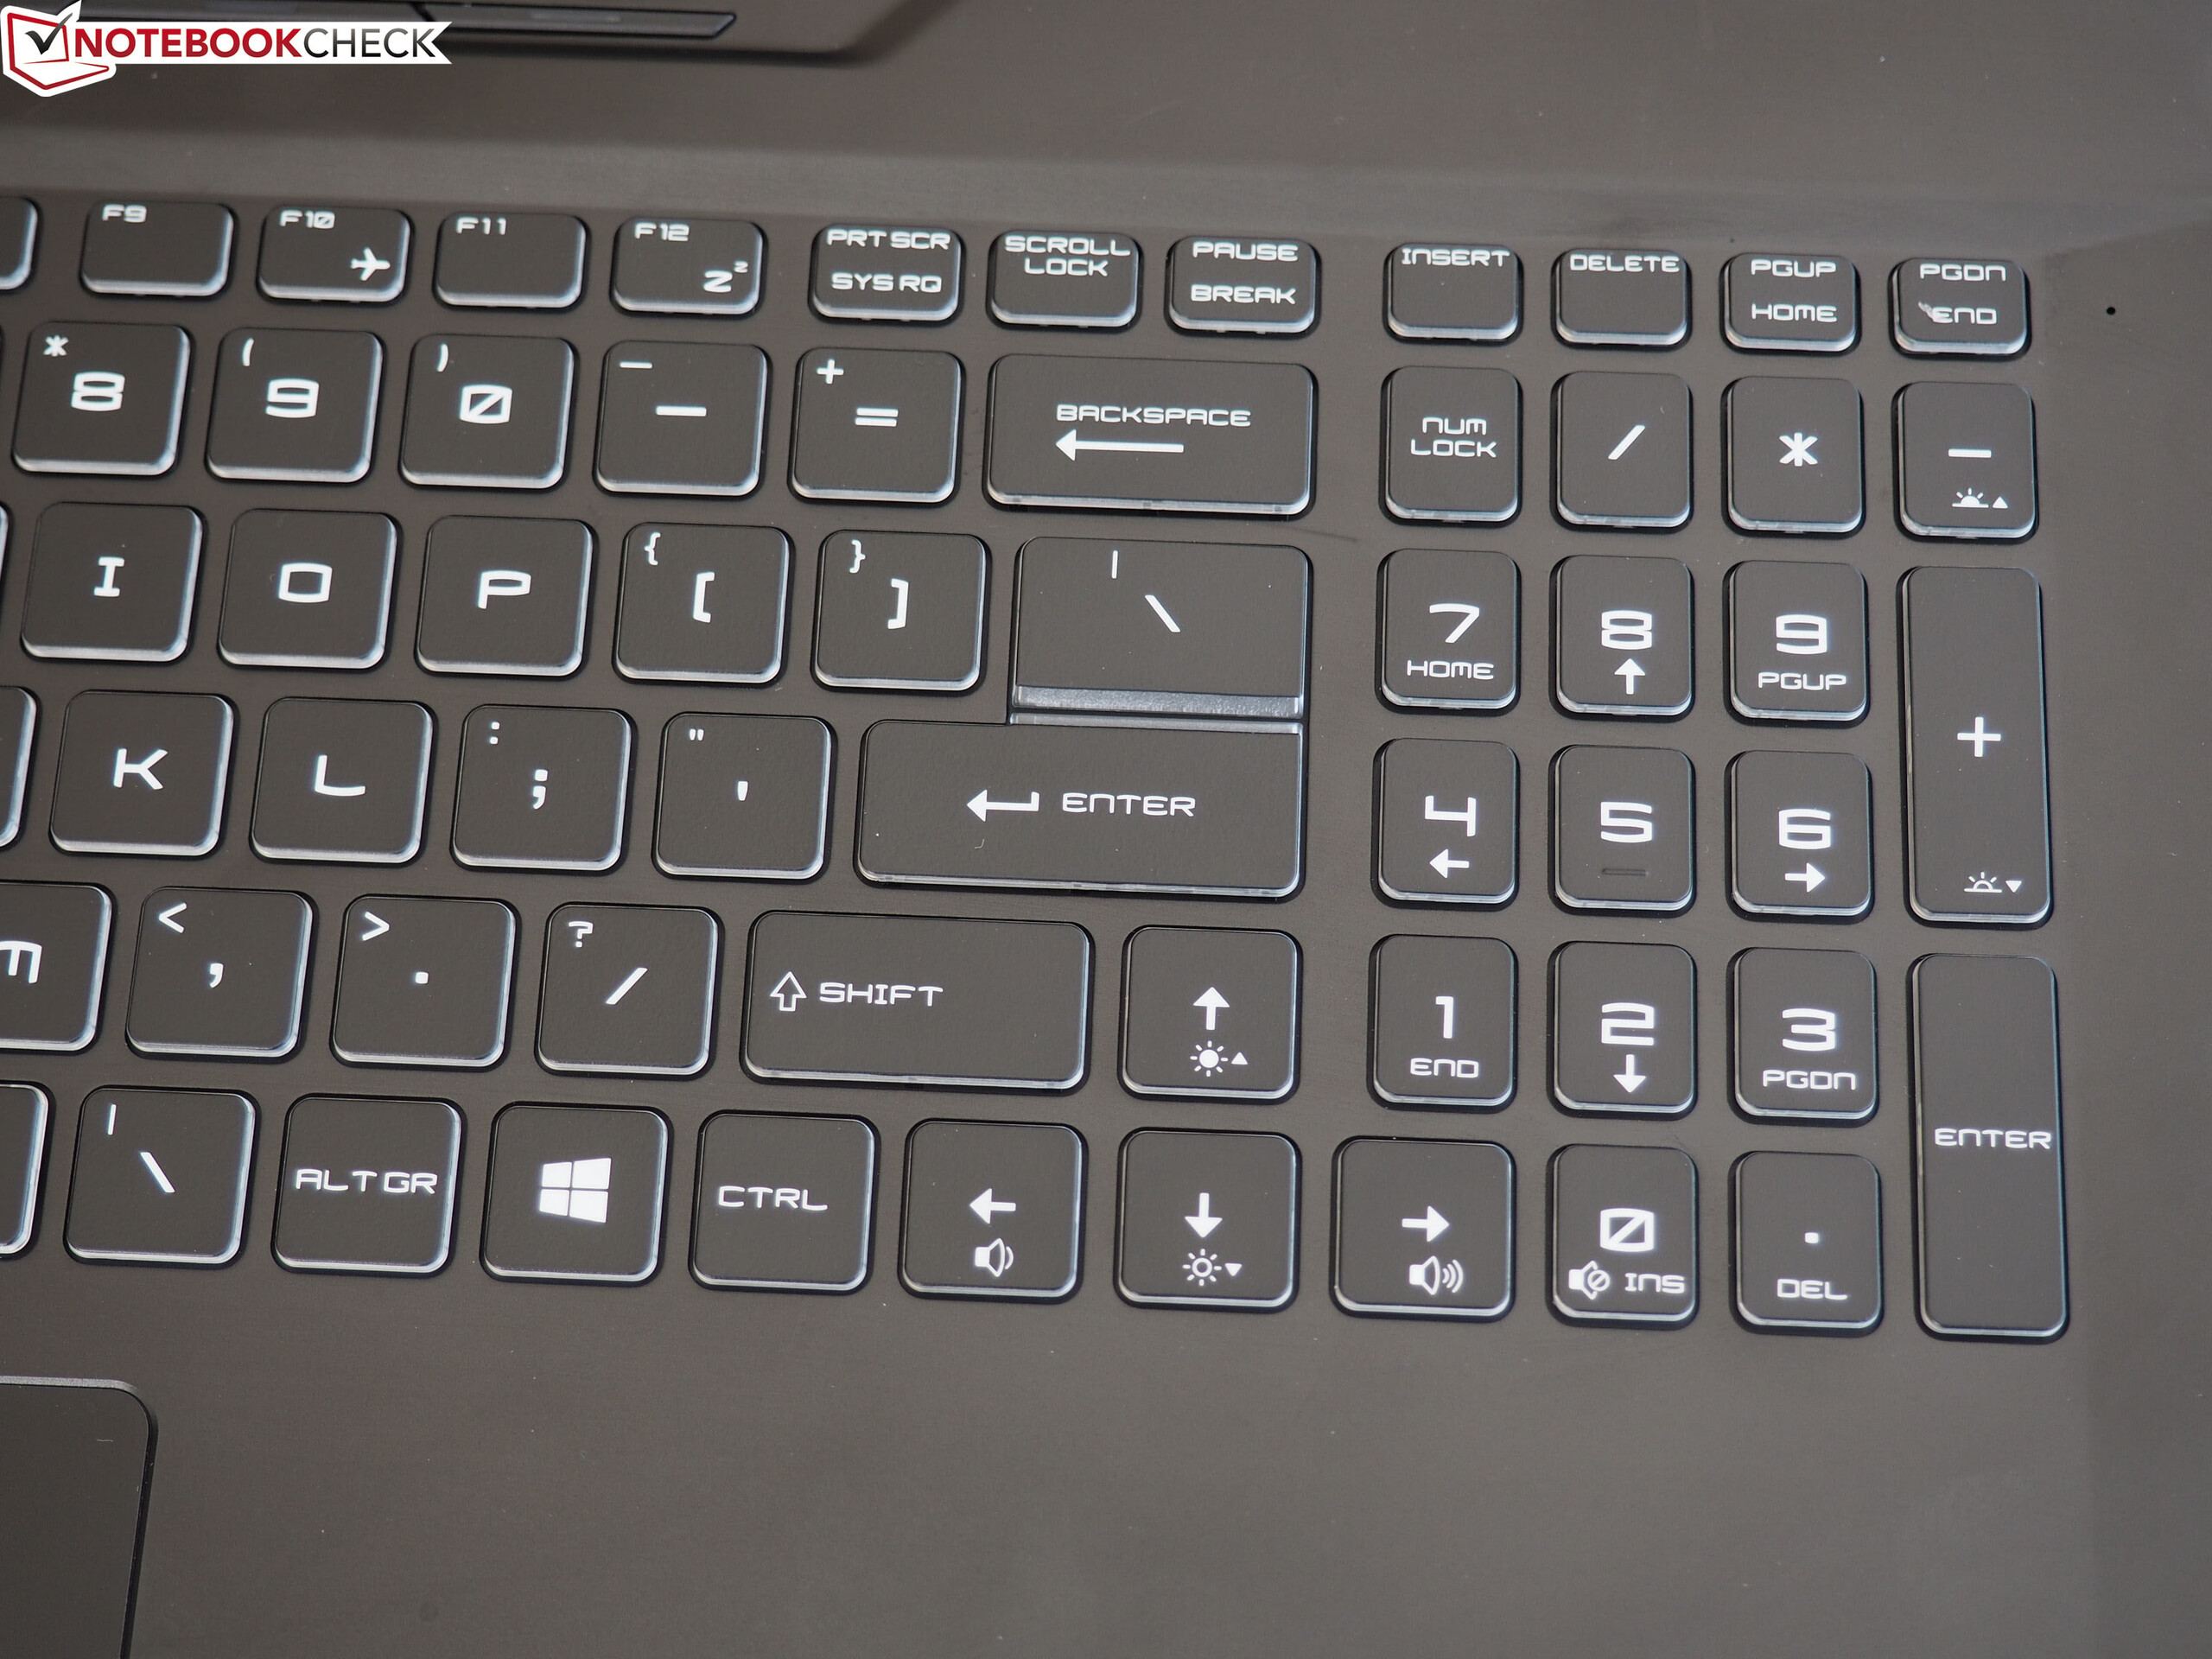
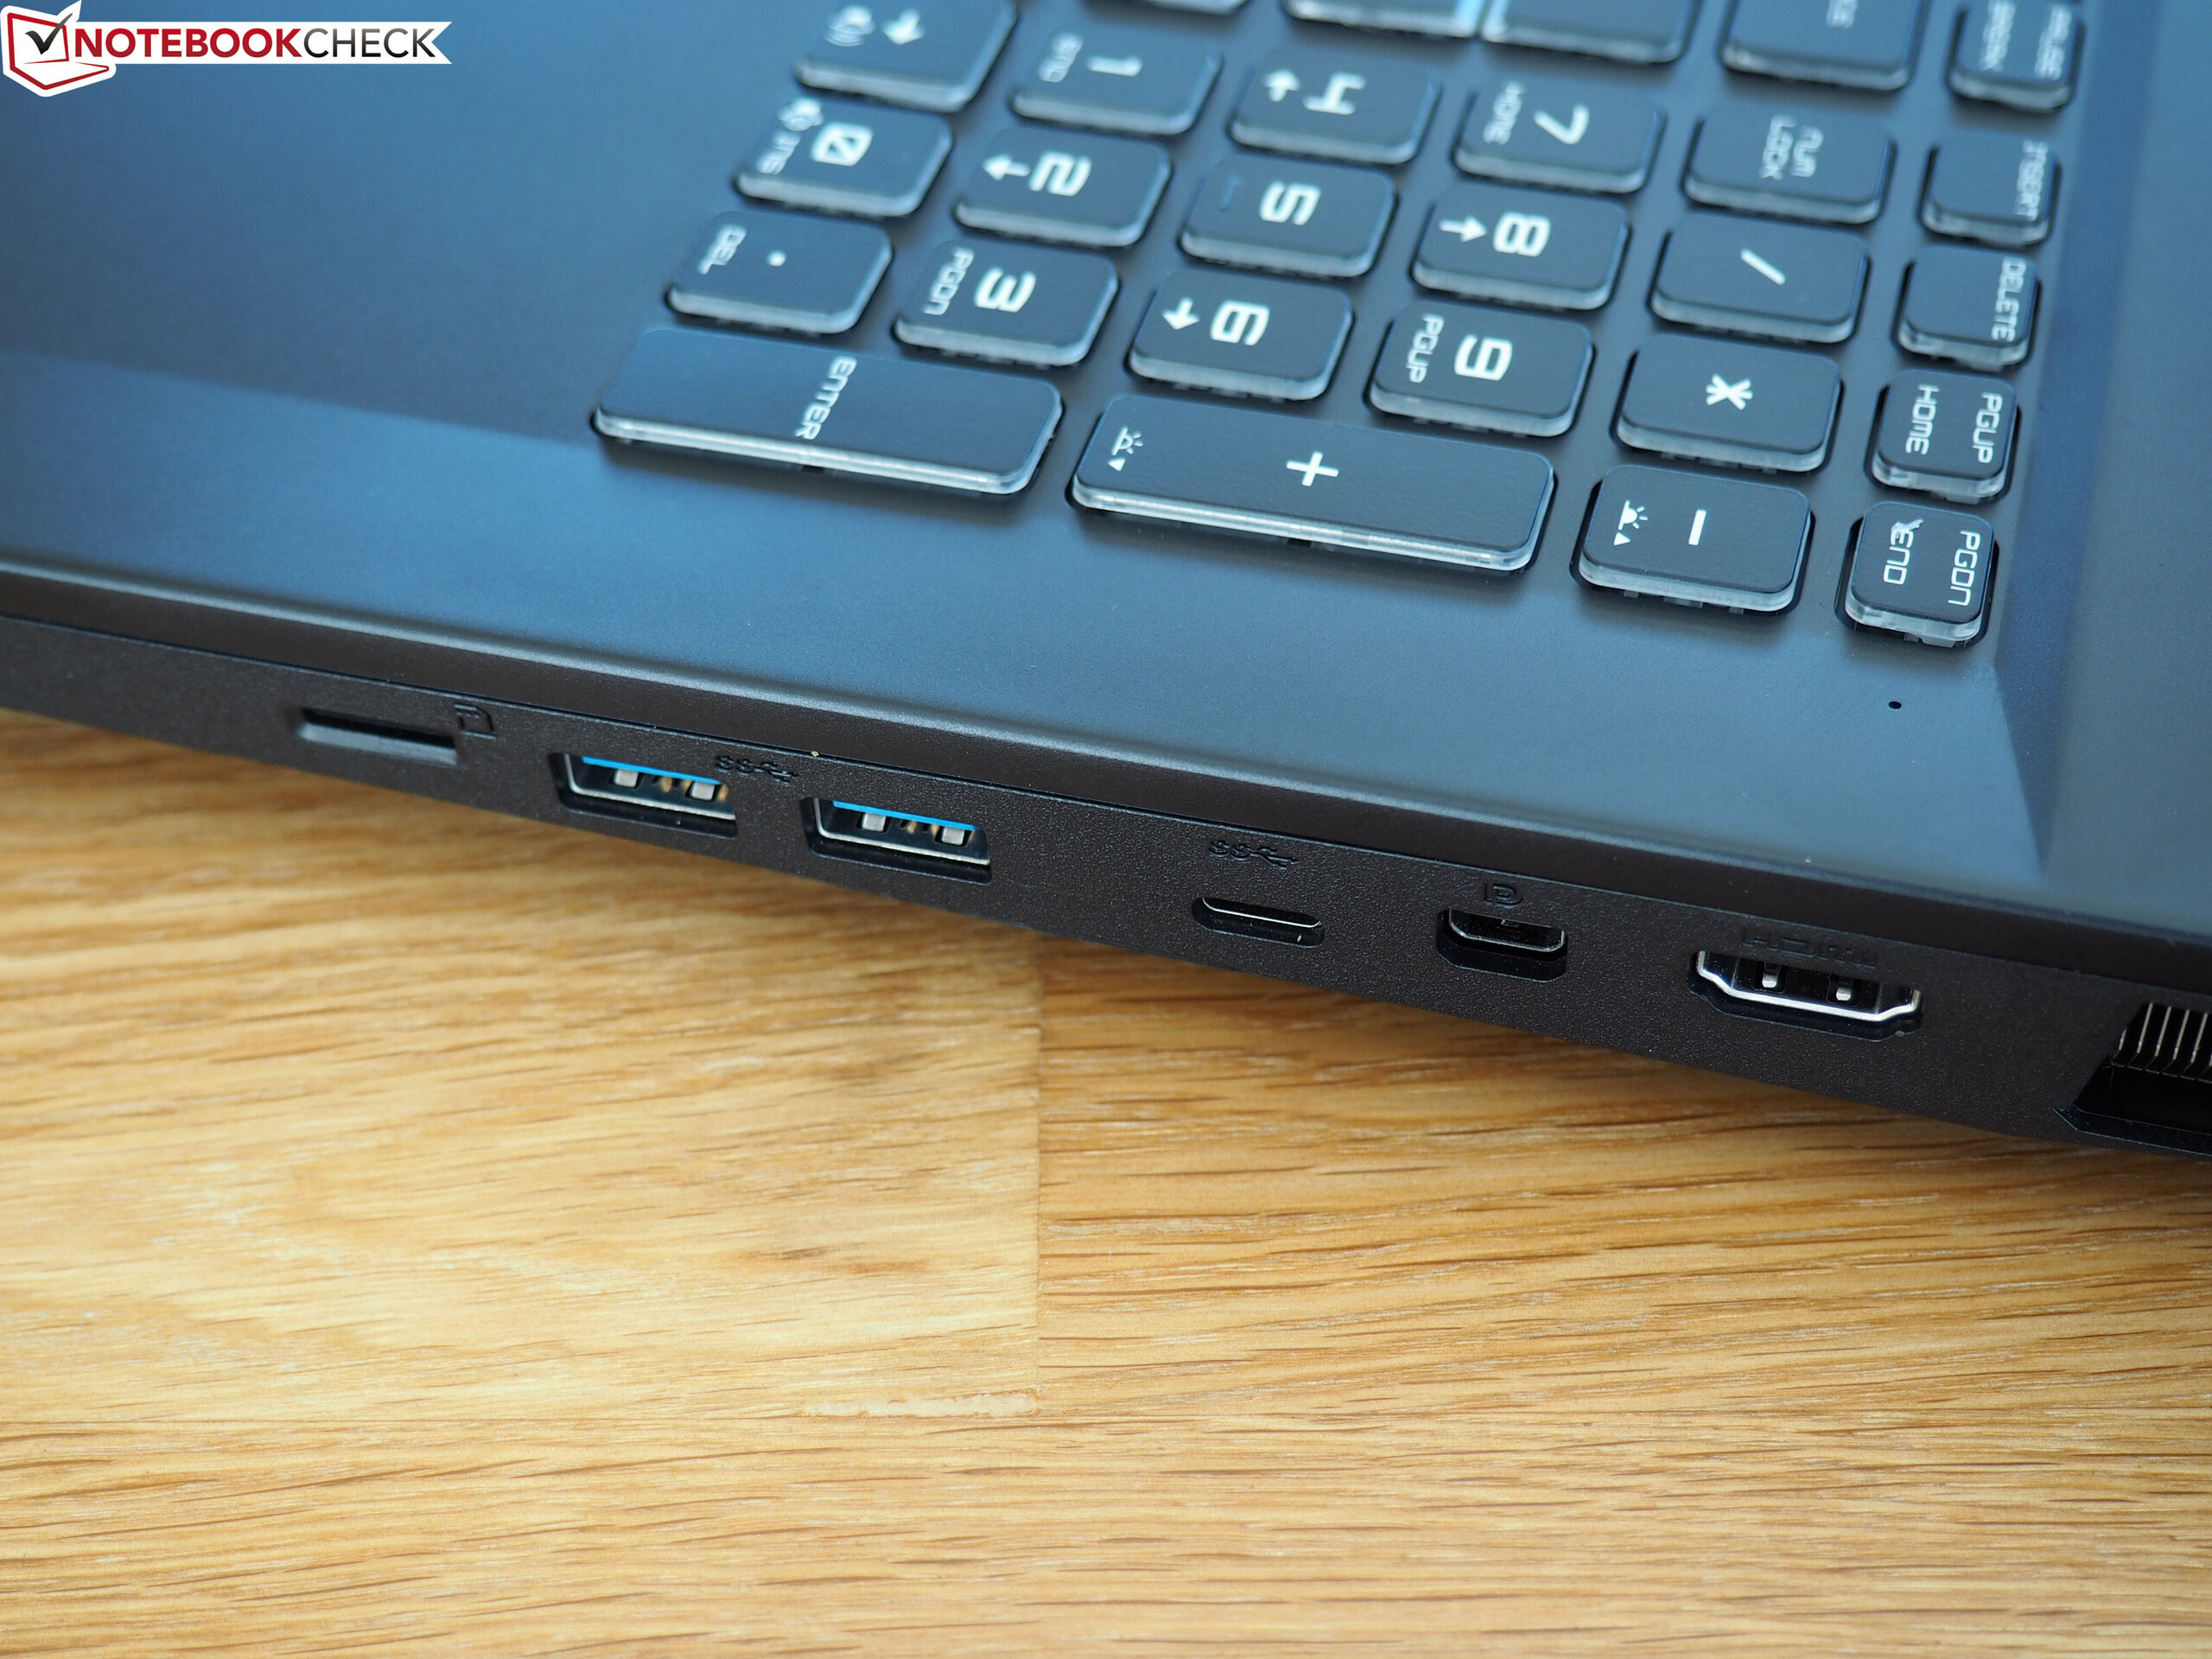
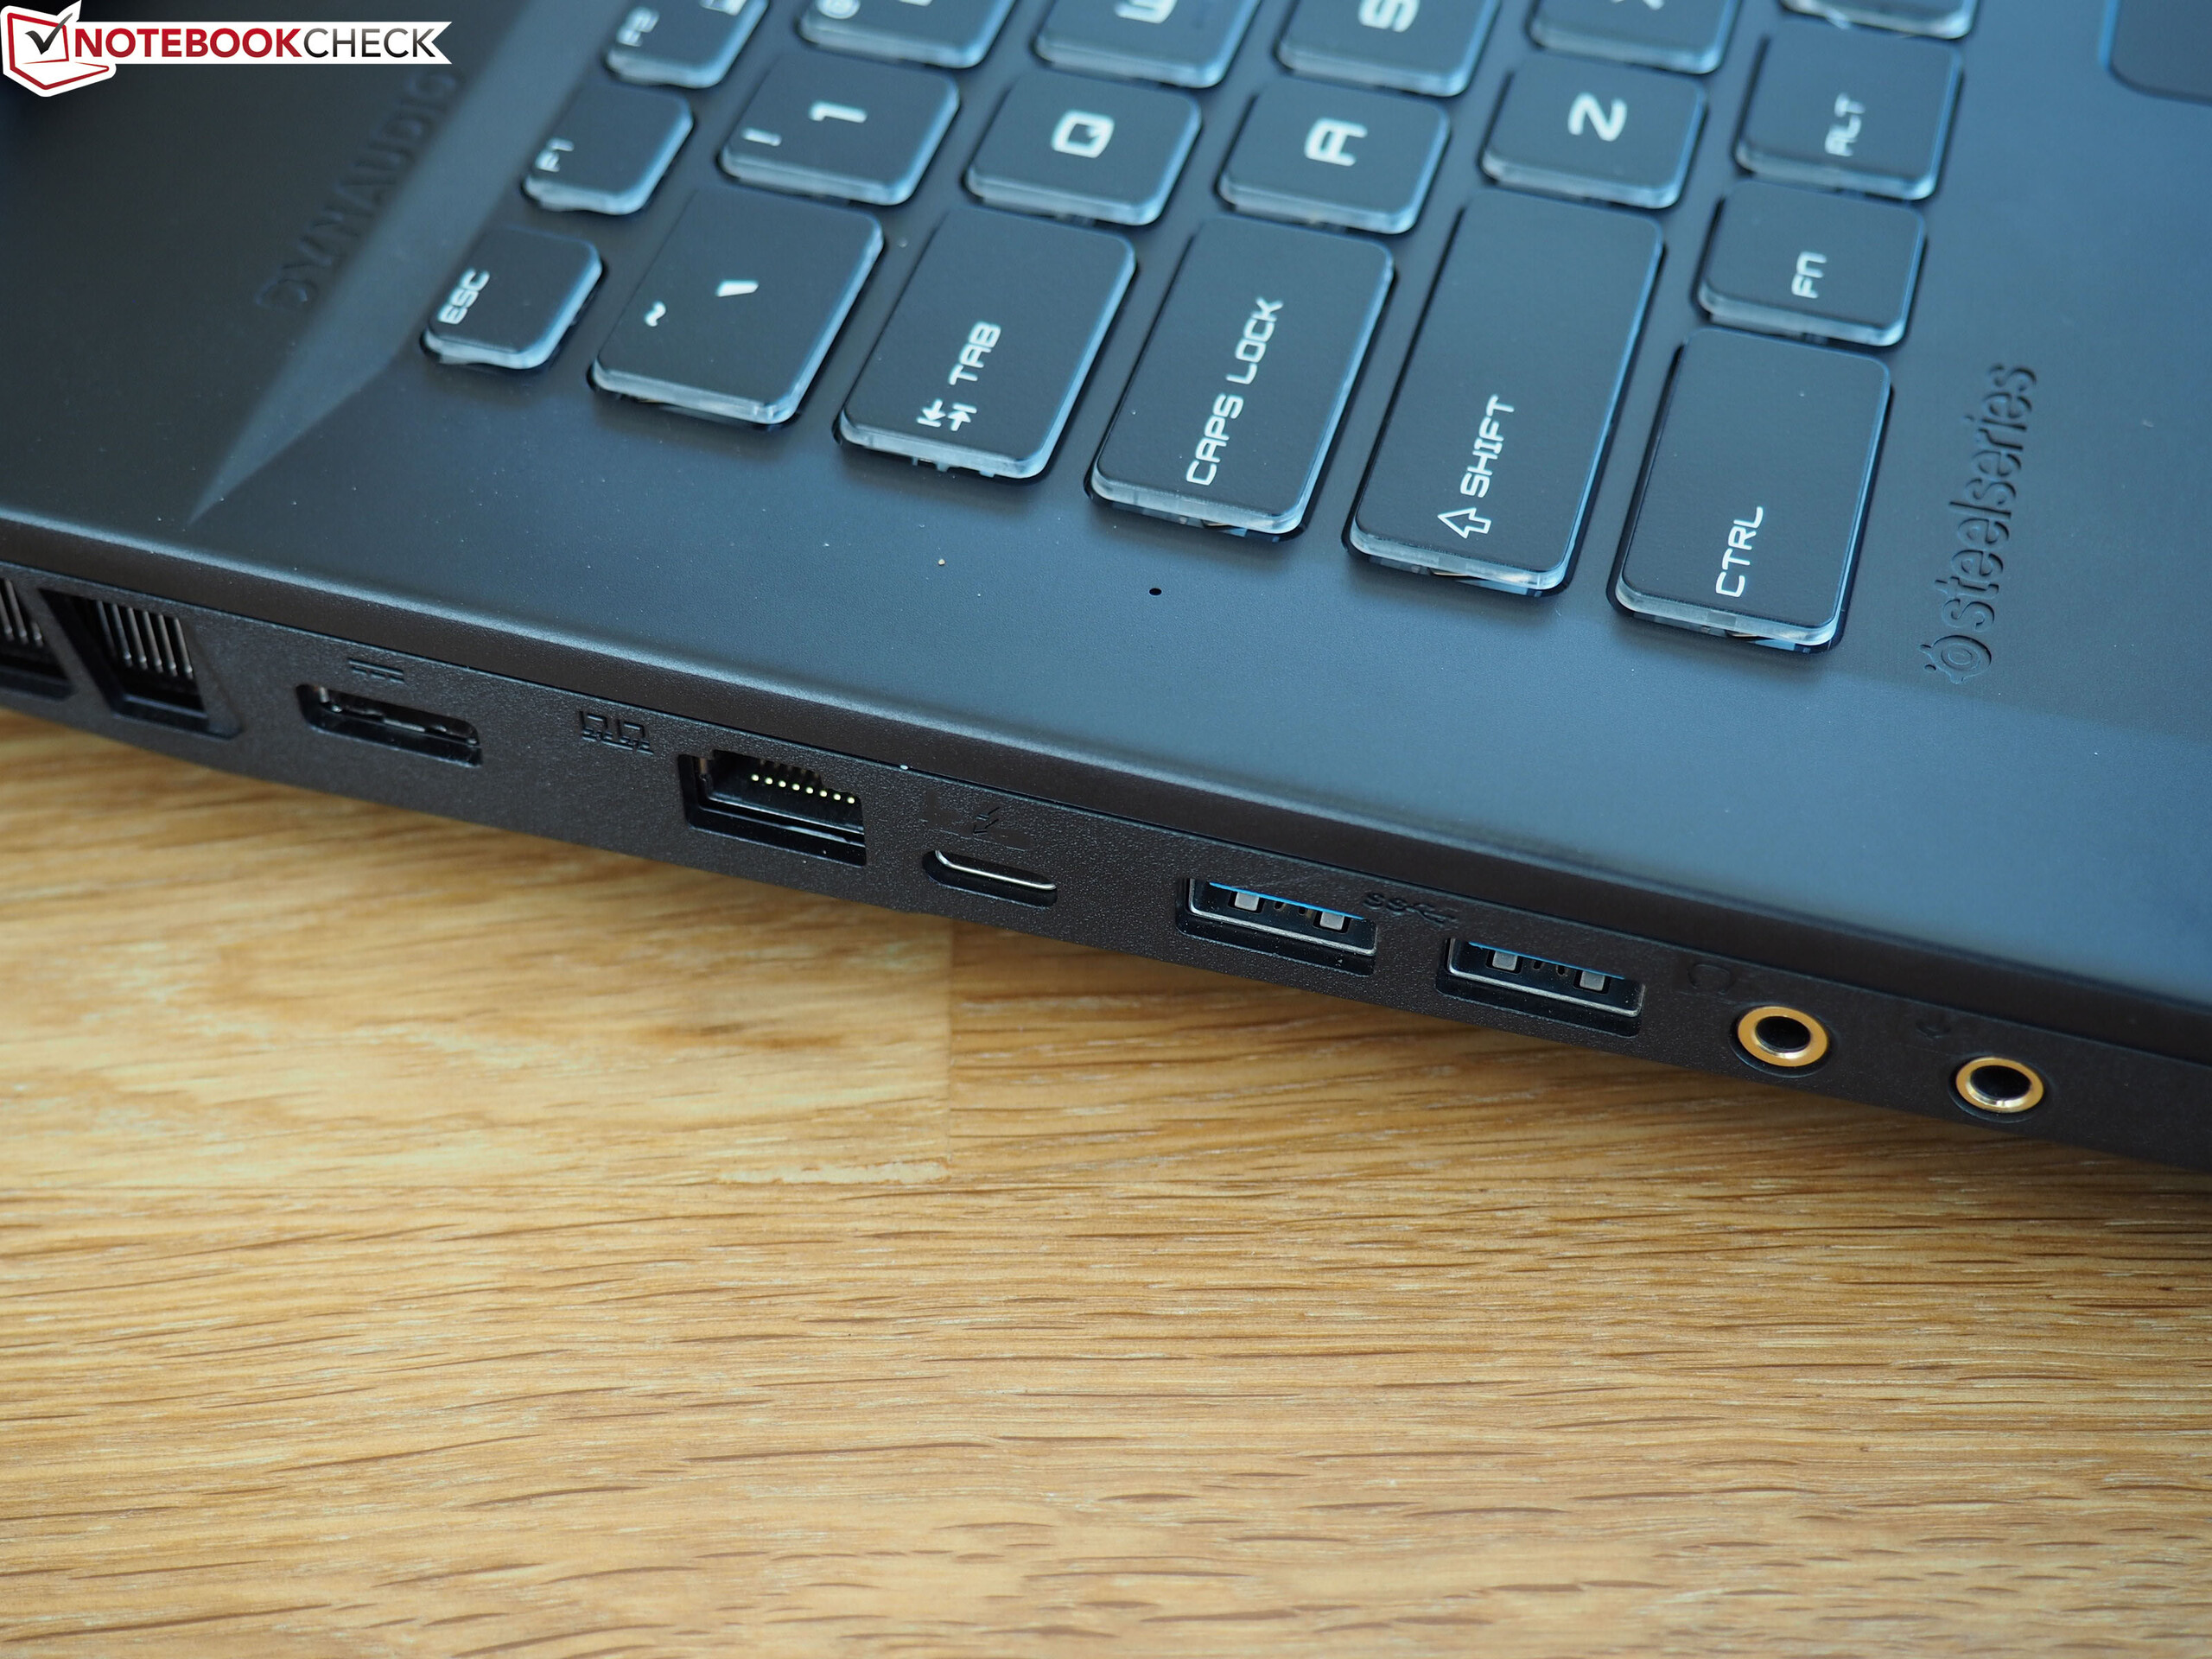
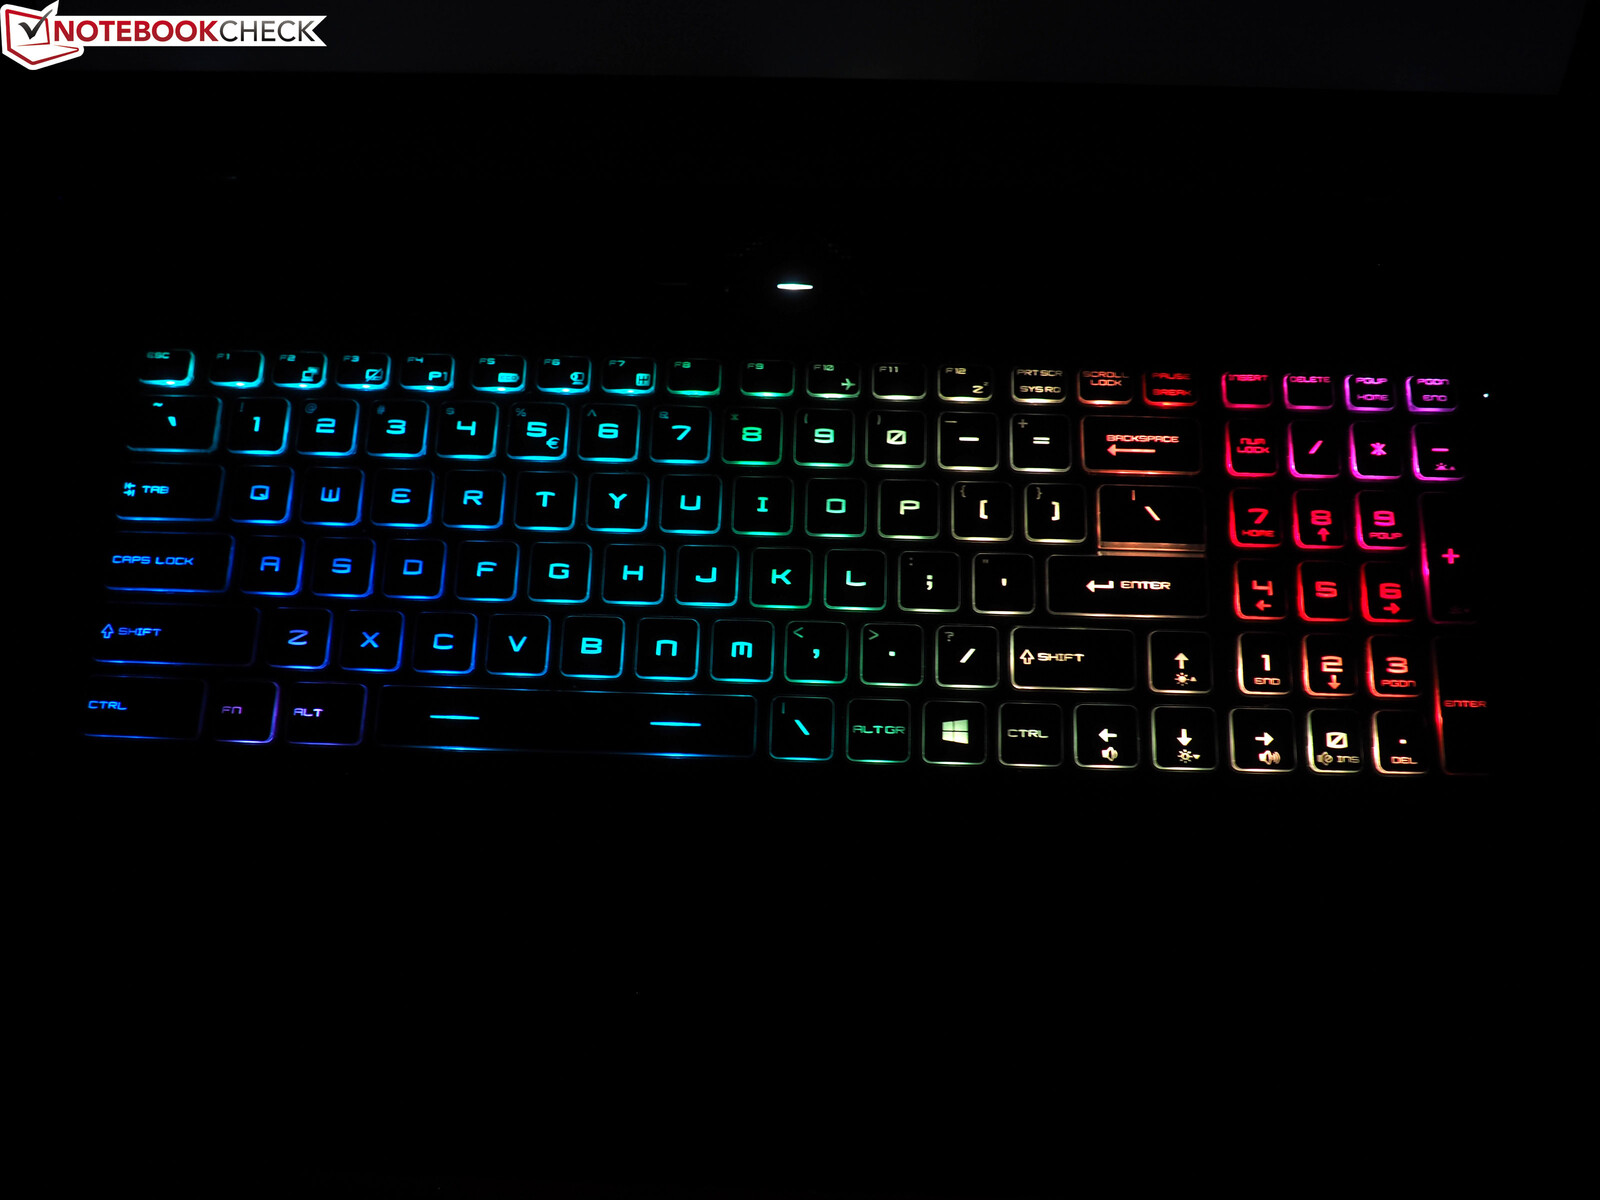
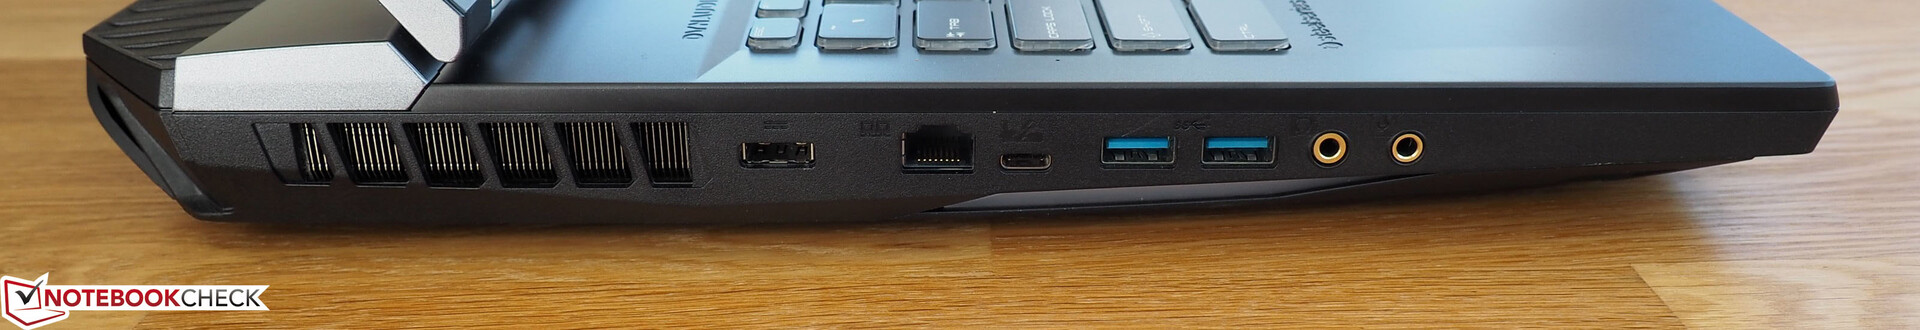
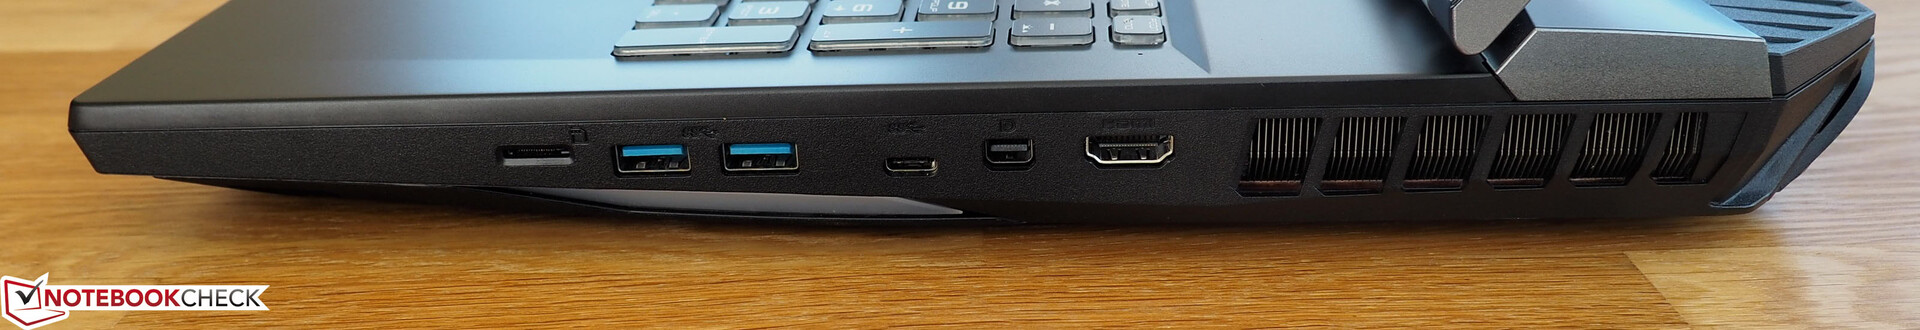
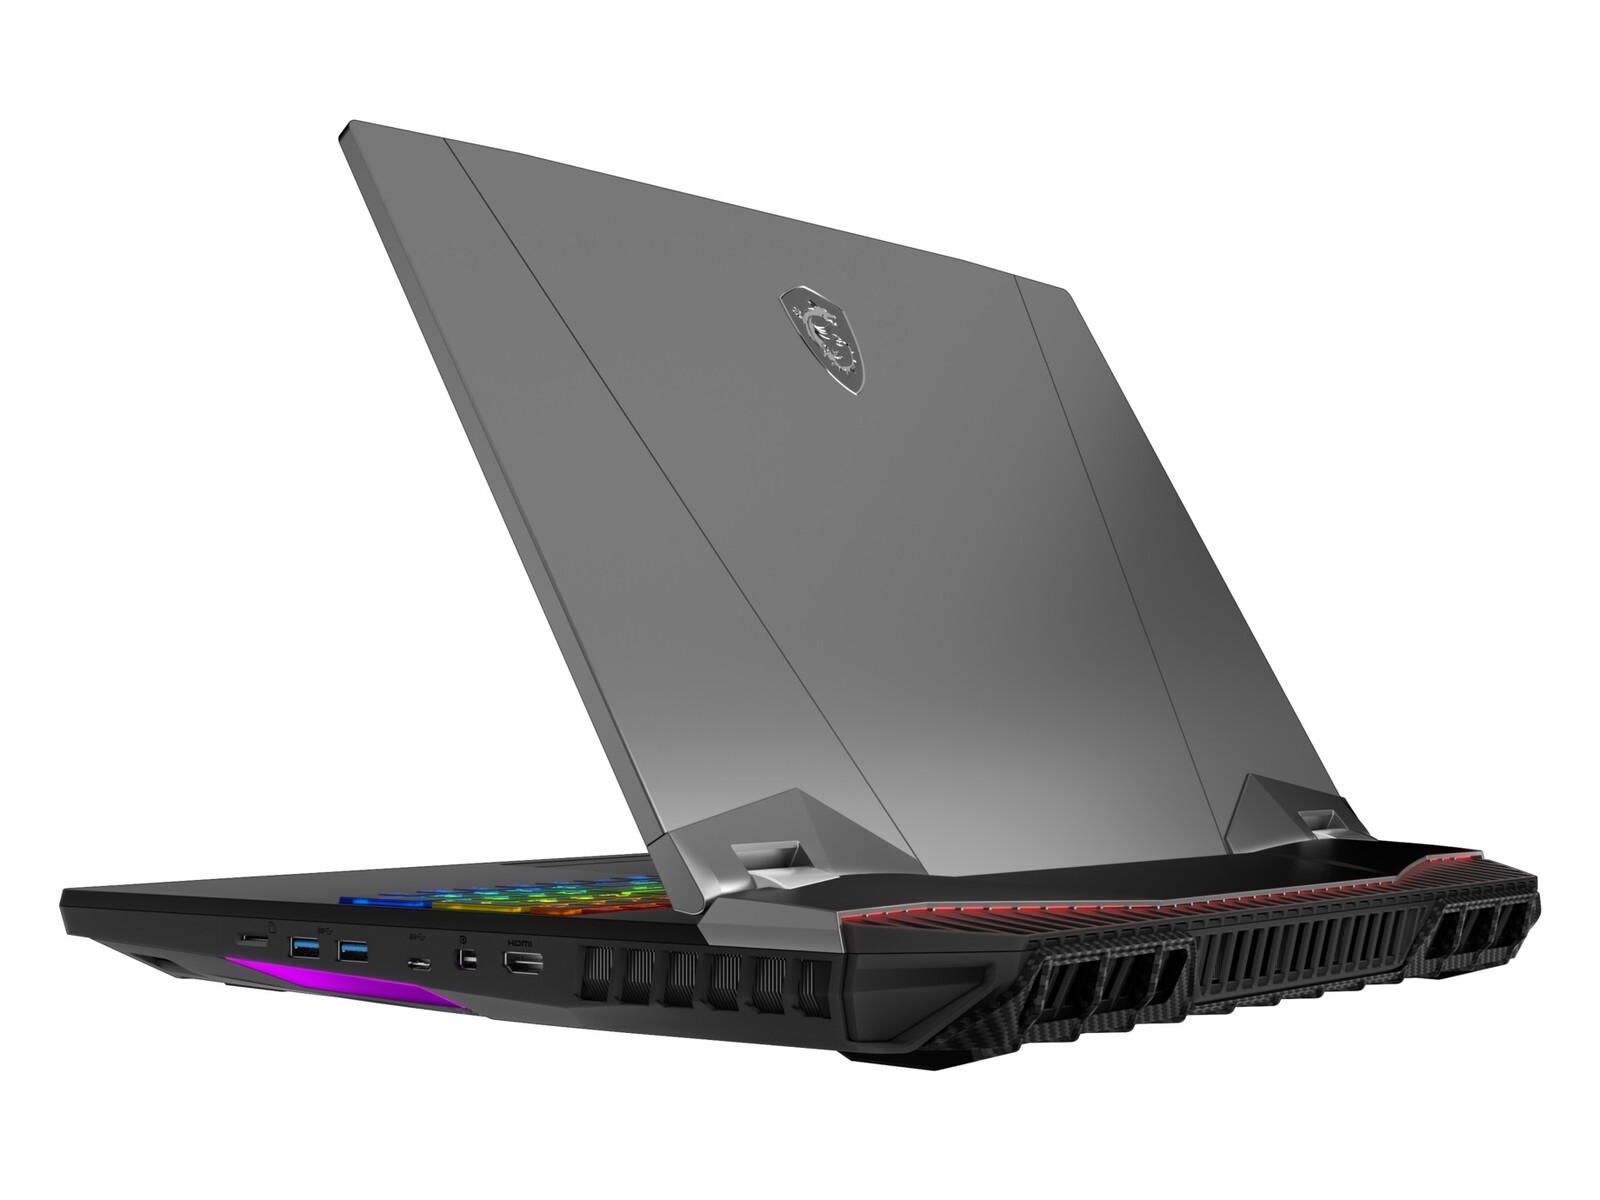
O GT76 o atrai com muitas portas (Thunderbolt 3), bons dispositivos de entrada e uma qualidade de som decente. A qualidade da imagem da tela fina de 144 Hz é mais do que aceitável para um dispositivo com esse preço. E, claro, você não deve esquecer as opções expansivas de manutenção e atualização.
Price comparison