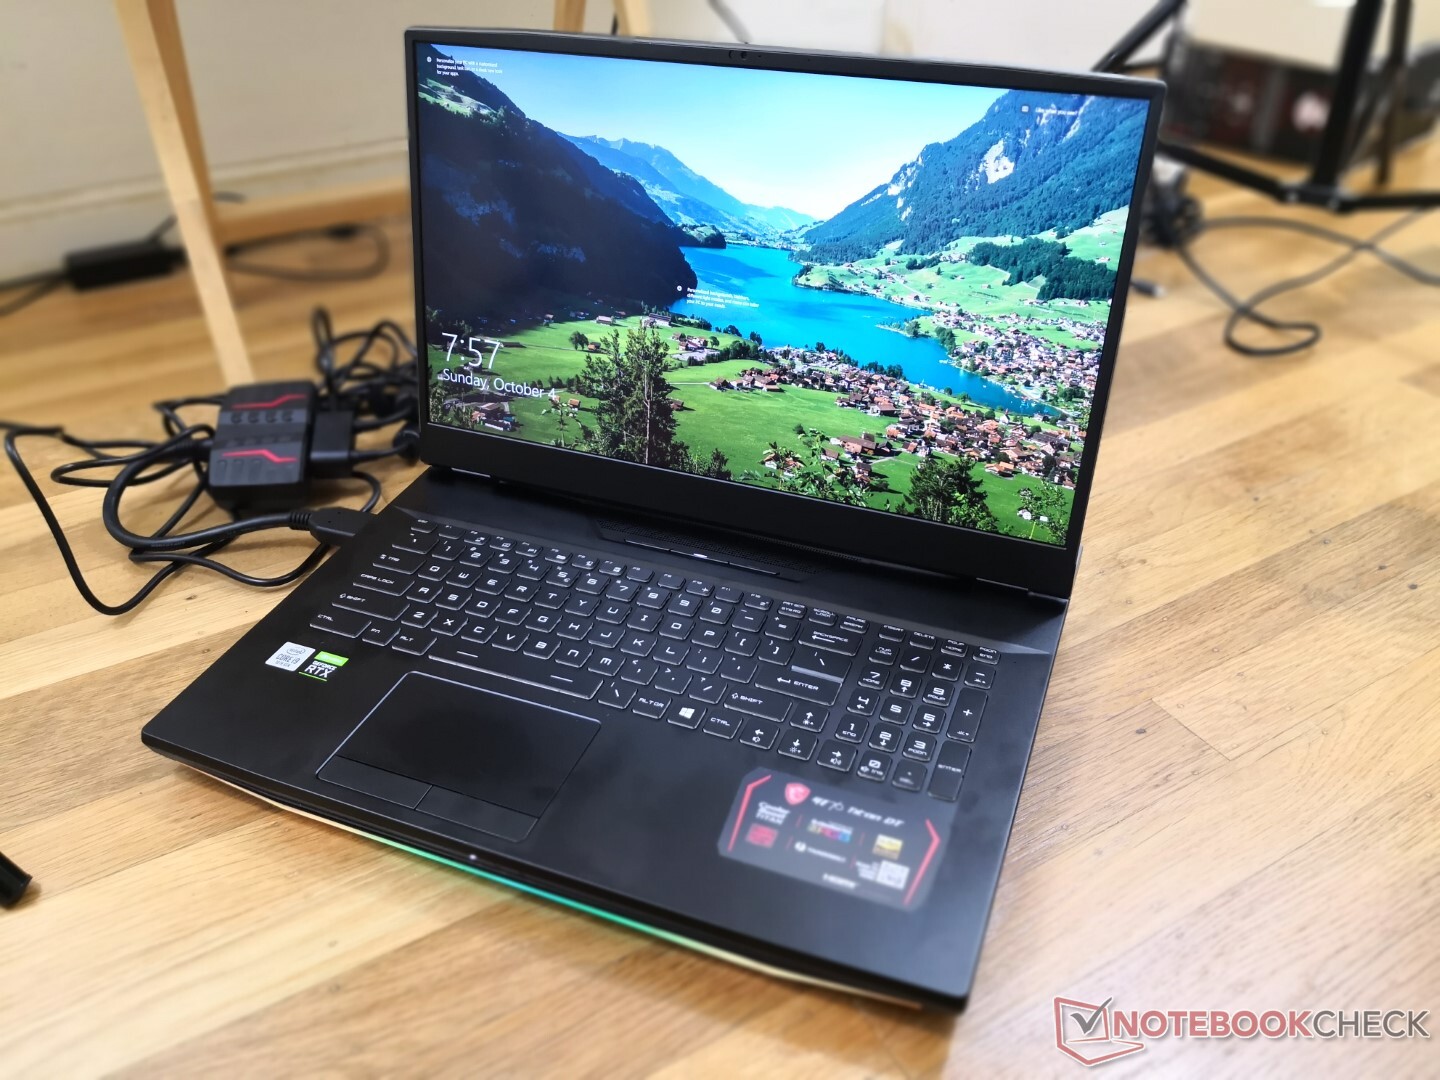
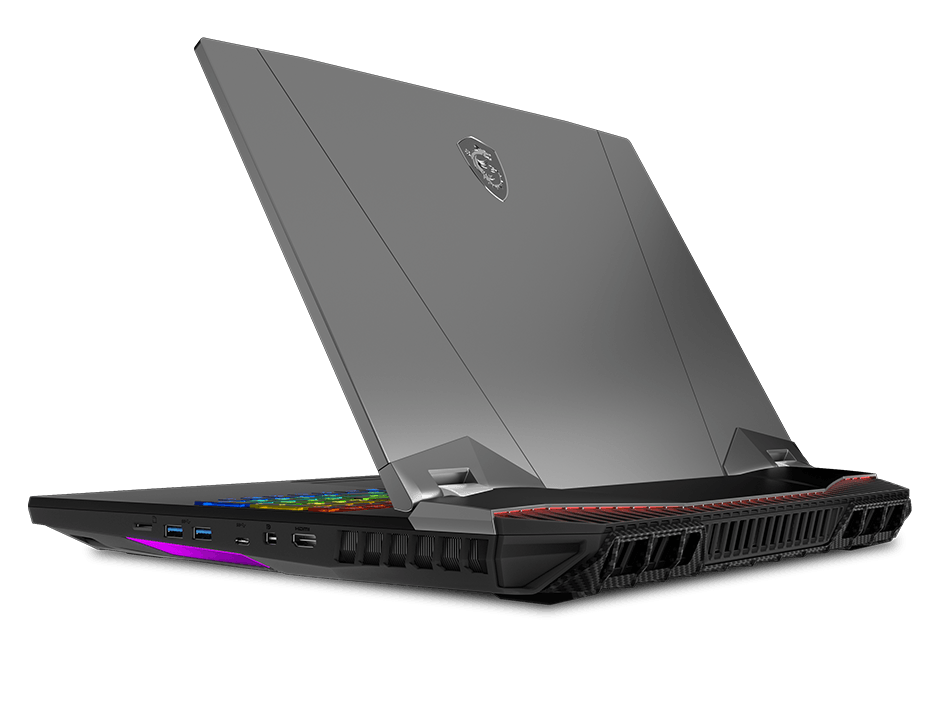
Breve Análise do Portátil MSI GT76 Titan DT 10SGS: Equipamentos exóticos de última geração
Avaliação | Data | Modelo | Peso | Altura | Size | Resolução | Preço |
|---|---|---|---|---|---|---|---|
| 87.4 % v7 (old) | 10/2020 | MSI GT76 Titan DT 10SGS i9-10900K, GeForce RTX 2080 Super Mobile | 4.2 kg | 42 mm | 17.30" | 3840x2160 | |
| 85.8 % v7 (old) | 10/2019 | Asus ROG G703GXR i7-9750H, GeForce RTX 2080 Mobile | 4.7 kg | 48 mm | 17.30" | 1920x1080 | |
| 85.8 % v7 (old) | 03/2019 | Alienware Area-51m i9-9900K RTX 2080 i9-9900K, GeForce RTX 2080 Mobile | 3.9 kg | 42 mm | 17.30" | 1920x1080 | |
| 82.7 % v7 (old) | 07/2020 | Asus Strix Scar 17 G732LXS i9-10980HK, GeForce RTX 2080 Super Mobile | 2.9 kg | 26.5 mm | 17.30" | 1920x1080 | |
| 83.2 % v7 (old) | 03/2020 | Schenker XMG Pro 17 PB71RD-G i7-9750H, GeForce RTX 2060 Mobile | 2.8 kg | 30 mm | 17.30" | 1920x1080 |
| SD Card Reader | |
| average JPG Copy Test (av. of 3 runs) | |
| Schenker XMG Pro 17 PB71RD-G (Toshiba Exceria Pro SDXC 64 GB UHS-II) | |
| Asus ROG G703GXR (Toshiba Exceria Pro SDXC 64 GB UHS-II) | |
| MSI GT76 Titan DT 10SGS (Toshiba Exceria Pro M501 UHS-II) | |
| MSI GE75 9SG (Toshiba Exceria Pro SDXC 64 GB UHS-II) | |
| maximum AS SSD Seq Read Test (1GB) | |
| Asus ROG G703GXR (Toshiba Exceria Pro SDXC 64 GB UHS-II) | |
| Schenker XMG Pro 17 PB71RD-G (Toshiba Exceria Pro SDXC 64 GB UHS-II) | |
| MSI GT76 Titan DT 10SGS (Toshiba Exceria Pro M501 UHS-II) | |
| MSI GE75 9SG (Toshiba Exceria Pro SDXC 64 GB UHS-II) | |

")
")
| |||||||||||||||||||||||||
iluminação: 93 %
iluminação com acumulador: 419.5 cd/m²
Contraste: 1049:1 (Preto: 0.4 cd/m²)
ΔE ColorChecker Calman: 3.4 | ∀{0.5-29.43 Ø4.71}
calibrated: 3.28
ΔE Greyscale Calman: 2 | ∀{0.09-98 Ø4.96}
97.9% sRGB (Argyll 1.6.3 3D)
84.6% AdobeRGB 1998 (Argyll 1.6.3 3D)
96.6% AdobeRGB 1998 (Argyll 3D)
98% sRGB (Argyll 3D)
82.5% Display P3 (Argyll 3D)
Gamma: 2.14
CCT: 6858 K
| MSI GT76 Titan DT 10SGS AU Optronics B173ZAN03.3, IPS, 17.3", 3840x2160 | Asus ROG G703GXR AU Optronics B173HAN04.0 (AUO409D), IPS, 17.3", 1920x1080 | Alienware Area-51m i9-9900K RTX 2080 LG Philips 173WFG, IPS, 17.3", 1920x1080 | Asus Strix Scar 17 G732LXS LQ173M1JW03 (SHP14DC), IPS, 17.3", 1920x1080 | Schenker XMG Pro 17 PB71RD-G AU Optronics B173HAN04.0 (AUO409D), IPS, 17.3", 1920x1080 | MSI GE75 9SG Chi Mei N173HCE-G33, AHVA, 17.3", 1920x1080 | MSI GT76 Titan DT 9SG Chi Mei N173HCE-G33 (CMN175C), IPS, 17.3", 1920x1080 | |
|---|---|---|---|---|---|---|---|
| Display | -21% | -17% | -13% | -22% | -22% | -21% | |
| Display P3 Coverage (%) | 82.5 | 63.2 -23% | 66.3 -20% | 71 -14% | 62.8 -24% | 61.5 -25% | 62.3 -24% |
| sRGB Coverage (%) | 98 | 92 -6% | 96.9 -1% | 99 1% | 89.8 -8% | 92 -6% | 93.4 -5% |
| AdobeRGB 1998 Coverage (%) | 96.6 | 64.7 -33% | 66.5 -31% | 71.6 -26% | 64.2 -34% | 63.5 -34% | 64.3 -33% |
| Response Times | 31% | 25% | 52% | 13% | 56% | 40% | |
| Response Time Grey 50% / Grey 80% * (ms) | 23.2 ? | 6.4 ? 72% | 13.2 ? 43% | 5.8 ? 75% | 16.8 ? 28% | 7.2 ? 69% | 8 ? 66% |
| Response Time Black / White * (ms) | 11.6 ? | 12.8 ? -10% | 10.8 ? 7% | 8.4 ? 28% | 12 ? -3% | 6.6 ? 43% | 10 ? 14% |
| PWM Frequency (Hz) | 26040 ? | 26040 ? | |||||
| Screen | -19% | -14% | -13% | -21% | 16% | 9% | |
| Brightness middle (cd/m²) | 419.5 | 290 -31% | 335.2 -20% | 310 -26% | 274 -35% | 400.7 -4% | 396 -6% |
| Brightness (cd/m²) | 413 | 281 -32% | 297 -28% | 311 -25% | 273 -34% | 372 -10% | 373 -10% |
| Brightness Distribution (%) | 93 | 91 -2% | 82 -12% | 82 -12% | 95 2% | 89 -4% | 89 -4% |
| Black Level * (cd/m²) | 0.4 | 0.2 50% | 0.66 -65% | 0.41 -2% | 0.26 35% | 0.34 15% | 0.33 17% |
| Contrast (:1) | 1049 | 1450 38% | 508 -52% | 756 -28% | 1054 0% | 1179 12% | 1200 14% |
| Colorchecker dE 2000 * | 3.4 | 4.77 -40% | 2.02 41% | 2.41 29% | 4.62 -36% | 1.33 61% | 2.04 40% |
| Colorchecker dE 2000 max. * | 7.4 | 9.08 -23% | 7.23 2% | 8.59 -16% | 7.66 -4% | 3.51 53% | 3.85 48% |
| Colorchecker dE 2000 calibrated * | 3.28 | 1.46 55% | 1.17 64% | 1.13 66% | 1.93 41% | 1.39 58% | 0.82 75% |
| Greyscale dE 2000 * | 2 | 5.83 -192% | 3.2 -60% | 4.3 -115% | 5.3 -165% | 1.3 35% | 2.83 -42% |
| Gamma | 2.14 103% | 2.47 89% | 2.16 102% | 2.149 102% | 2.34 94% | 2.24 98% | 2.49 88% |
| CCT | 6858 95% | 8076 80% | 6746 96% | 7059 92% | 7619 85% | 6735 97% | 7113 91% |
| Color Space (Percent of AdobeRGB 1998) (%) | 84.6 | 59 -30% | 61.3 -28% | 72 -15% | 58 -31% | 58.2 -31% | 59 -30% |
| Color Space (Percent of sRGB) (%) | 97.9 | 92 -6% | 96.9 -1% | 94 -4% | 90 -8% | 92.1 -6% | 94 -4% |
| Média Total (Programa/Configurações) | -3% /
-13% | -2% /
-10% | 9% /
-5% | -10% /
-17% | 17% /
14% | 9% /
7% |
* ... menor é melhor
Exibir tempos de resposta
| ↔ Tempo de resposta preto para branco | ||
|---|---|---|
| 11.6 ms ... ascensão ↗ e queda ↘ combinadas | ↗ 6.4 ms ascensão | 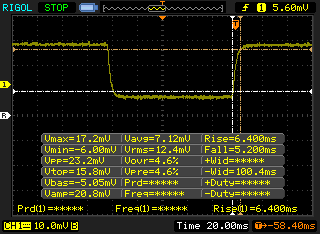 |
| ↘ 5.2 ms queda | ||
| A tela mostra boas taxas de resposta em nossos testes, mas pode ser muito lenta para jogadores competitivos. Em comparação, todos os dispositivos testados variam de 0.1 (mínimo) a 240 (máximo) ms. » 31 % de todos os dispositivos são melhores. Isso significa que o tempo de resposta medido é melhor que a média de todos os dispositivos testados (19.8 ms). | ||
| ↔ Tempo de resposta 50% cinza a 80% cinza | ||
| 23.2 ms ... ascensão ↗ e queda ↘ combinadas | ↗ 12.4 ms ascensão | 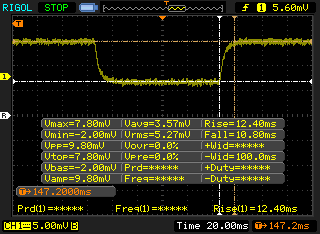 |
| ↘ 10.8 ms queda | ||
| A tela mostra boas taxas de resposta em nossos testes, mas pode ser muito lenta para jogadores competitivos. Em comparação, todos os dispositivos testados variam de 0.165 (mínimo) a 636 (máximo) ms. » 34 % de todos os dispositivos são melhores. Isso significa que o tempo de resposta medido é melhor que a média de todos os dispositivos testados (31 ms). | ||
Cintilação da tela / PWM (modulação por largura de pulso)
| Tela tremeluzindo / PWM não detectado |  | ||
[pwm_comparison] Em comparação: 52 % de todos os dispositivos testados não usam PWM para escurecer a tela. Se PWM foi detectado, uma média de 7754 (mínimo: 5 - máximo: 343500) Hz foi medida. | |||
Cinebench R15: CPU Multi 64Bit | CPU Single 64Bit
Blender: v2.79 BMW27 CPU
7-Zip 18.03: 7z b 4 -mmt1 | 7z b 4
Geekbench 5.5: Single-Core | Multi-Core
HWBOT x265 Benchmark v2.2: 4k Preset
LibreOffice : 20 Documents To PDF
R Benchmark 2.5: Overall mean
| Cinebench R20 / CPU (Multi Core) | |
| KFA2 GeForce GTX 1650 EX One Click Plus | |
| MSI GT76 Titan DT 10SGS | |
| Média Intel Core i9-10900K (5825 - 6381, n=3) | |
| MSI GT76 Titan DT 9SG | |
| Eluktronics RP-17 | |
| Alienware m17 R3 P45E | |
| Eurocom Sky X4C i9-9900KS | |
| Asus Zephyrus G14 GA401IV | |
| Alienware m17 R2 P41E | |
| MSI GE65 Raider 9SF-049US | |
| Gigabyte Aero 15-Y9 | |
| Cinebench R20 / CPU (Single Core) | |
| Média Intel Core i9-10900K (493 - 532, n=3) | |
| MSI GT76 Titan DT 9SG | |
| Eurocom Sky X4C i9-9900KS | |
| KFA2 GeForce GTX 1650 EX One Click Plus | |
| Asus Zephyrus G14 GA401IV | |
| MSI GT76 Titan DT 10SGS | |
| Eluktronics RP-17 | |
| Alienware m17 R2 P41E | |
| MSI GE65 Raider 9SF-049US | |
| Alienware m17 R3 P45E | |
| Gigabyte Aero 15-Y9 | |
| Cinebench R15 / CPU Multi 64Bit | |
| KFA2 GeForce GTX 1650 EX One Click Plus | |
| Média Intel Core i9-10900K (2513 - 2620, n=3) | |
| MSI GT76 Titan DT 10SGS | |
| MSI GT76 Titan DT 9SG | |
| Eurocom Sky X4C i9-9900KS | |
| Eluktronics RP-17 | |
| Asus Zephyrus G14 GA401IV | |
| Alienware m17 R3 P45E | |
| Alienware m17 R2 P41E | |
| MSI GE65 Raider 9SF-049US | |
| Gigabyte Aero 15-Y9 | |
| Cinebench R15 / CPU Single 64Bit | |
| Média Intel Core i9-10900K (206 - 224, n=3) | |
| Eurocom Sky X4C i9-9900KS | |
| MSI GT76 Titan DT 9SG | |
| Alienware m17 R3 P45E | |
| MSI GT76 Titan DT 10SGS | |
| KFA2 GeForce GTX 1650 EX One Click Plus | |
| MSI GE65 Raider 9SF-049US | |
| Alienware m17 R2 P41E | |
| Gigabyte Aero 15-Y9 | |
| Asus Zephyrus G14 GA401IV | |
| Eluktronics RP-17 | |
| Blender / v2.79 BMW27 CPU | |
| Asus Zephyrus G14 GA401IV | |
| Eluktronics RP-17 | |
| Eurocom Sky X4C i9-9900KS | |
| Alienware m17 R3 P45E | |
| MSI GT76 Titan DT 10SGS | |
| Média Intel Core i9-10900K (167.3 - 190, n=3) | |
| KFA2 GeForce GTX 1650 EX One Click Plus | |
| 7-Zip 18.03 / 7z b 4 -mmt1 | |
| Média Intel Core i9-10900K (5349 - 5954, n=3) | |
| Eurocom Sky X4C i9-9900KS | |
| Alienware m17 R3 P45E | |
| MSI GT76 Titan DT 10SGS | |
| KFA2 GeForce GTX 1650 EX One Click Plus | |
| Asus Zephyrus G14 GA401IV | |
| Eluktronics RP-17 | |
| 7-Zip 18.03 / 7z b 4 | |
| KFA2 GeForce GTX 1650 EX One Click Plus | |
| Média Intel Core i9-10900K (67252 - 70968, n=3) | |
| MSI GT76 Titan DT 10SGS | |
| Eurocom Sky X4C i9-9900KS | |
| Eluktronics RP-17 | |
| Asus Zephyrus G14 GA401IV | |
| Alienware m17 R3 P45E | |
| Geekbench 5.5 / Single-Core | |
| Média Intel Core i9-10900K (1336 - 1449, n=3) | |
| Eurocom Sky X4C i9-9900KS | |
| Alienware m17 R3 P45E | |
| MSI GT76 Titan DT 10SGS | |
| MSI GT76 Titan DT 9SG | |
| KFA2 GeForce GTX 1650 EX One Click Plus | |
| KFA2 GeForce GTX 1650 EX One Click Plus | |
| Asus Zephyrus G14 GA401IV | |
| Eluktronics RP-17 | |
| Geekbench 5.5 / Multi-Core | |
| Média Intel Core i9-10900K (10725 - 11414, n=3) | |
| KFA2 GeForce GTX 1650 EX One Click Plus | |
| KFA2 GeForce GTX 1650 EX One Click Plus | |
| MSI GT76 Titan DT 10SGS | |
| Eurocom Sky X4C i9-9900KS | |
| MSI GT76 Titan DT 9SG | |
| Alienware m17 R3 P45E | |
| Eluktronics RP-17 | |
| Asus Zephyrus G14 GA401IV | |
| HWBOT x265 Benchmark v2.2 / 4k Preset | |
| KFA2 GeForce GTX 1650 EX One Click Plus | |
| MSI GT76 Titan DT 10SGS | |
| Média Intel Core i9-10900K (18.2 - 21, n=3) | |
| Eurocom Sky X4C i9-9900KS | |
| Alienware m17 R3 P45E | |
| Eluktronics RP-17 | |
| Asus Zephyrus G14 GA401IV | |
| LibreOffice / 20 Documents To PDF | |
| Eluktronics RP-17 | |
| KFA2 GeForce GTX 1650 EX One Click Plus | |
| Média Intel Core i9-10900K (46.2 - 76, n=3) | |
| Alienware m17 R3 P45E | |
| MSI GT76 Titan DT 10SGS | |
| R Benchmark 2.5 / Overall mean | |
| Eluktronics RP-17 | |
| MSI GT76 Titan DT 10SGS | |
| Alienware m17 R3 P45E | |
| Média Intel Core i9-10900K (0.528 - 0.567, n=3) | |
| KFA2 GeForce GTX 1650 EX One Click Plus | |
* ... menor é melhor
| PCMark 8 | |
| Home Score Accelerated v2 | |
| Alienware Area-51m i9-9900K RTX 2080 | |
| Média da turma Gaming (n=1últimos 2 anos) | |
| MSI GT76 Titan DT 10SGS | |
| MSI GE75 9SG | |
| Work Score Accelerated v2 | |
| Alienware Area-51m i9-9900K RTX 2080 | |
| MSI GE75 9SG | |
| MSI GT76 Titan DT 10SGS | |
| Média da turma Gaming (n=1últimos 2 anos) | |
| PCMark 8 Home Score Accelerated v2 | 4678 pontos | |
| PCMark 8 Work Score Accelerated v2 | 4889 pontos | |
| PCMark 10 Score | 7358 pontos | |
Ajuda | ||
| DPC Latencies / LatencyMon - interrupt to process latency (max), Web, Youtube, Prime95 | |
| MSI GT76 Titan DT 10SGS | |
| Asus Strix Scar 17 G732LXS | |
| Asus Zephyrus G14 GA401IV | |
| Eluktronics RP-17 | |
| Alienware m17 R3 P45E | |
* ... menor é melhor
| MSI GT76 Titan DT 10SGS 2x WDC PC SN730 SDBPNTY-1T00 (RAID 0) | Alienware Area-51m i9-9900K RTX 2080 2x SK Hynix PC400 512GB (RAID 0) | Asus Strix Scar 17 G732LXS 2x Intel SSD 660p 1TB SSDPEKNW010T8 (RAID 0) | MSI GE75 9SG Samsung SSD PM981 MZVLB1T0HALR | MSI GT76 Titan DT 9SG 2x Samsung PM961 MZVLW256HEHP (RAID 0) | |
|---|---|---|---|---|---|
| AS SSD | -20% | -29% | -11% | -16% | |
| Seq Read (MB/s) | 2406 | 2082 -13% | 2450 2% | 1358 -44% | 2646 10% |
| Seq Write (MB/s) | 2867 | 2335 -19% | 1436 -50% | 2381 -17% | 2214 -23% |
| 4K Read (MB/s) | 41.51 | 24.14 -42% | 49.48 19% | 27.02 -35% | 30.42 -27% |
| 4K Write (MB/s) | 108.8 | 91.8 -16% | 119.4 10% | 89.2 -18% | 95.9 -12% |
| 4K-64 Read (MB/s) | 1525 | 1561 2% | 1032 -32% | 1642 8% | 1609 6% |
| 4K-64 Write (MB/s) | 1424 | 1350 -5% | 1229 -14% | 1799 26% | 1573 10% |
| Access Time Read * (ms) | 0.041 | 0.121 -195% | 0.145 -254% | 0.067 -63% | 0.128 -212% |
| Access Time Write * (ms) | 0.102 | 0.039 62% | 0.036 65% | 0.05 51% | 0.039 62% |
| Score Read (Points) | 1807 | 1793 -1% | 1327 -27% | 1805 0% | 1904 5% |
| Score Write (Points) | 1819 | 1675 -8% | 1492 -18% | 2127 17% | 1890 4% |
| Score Total (Points) | 4573 | 4390 -4% | 3456 -24% | 4899 7% | 4740 4% |
| Copy ISO MB/s (MB/s) | 2605 | 2175 -17% | 3193 23% | ||
| Copy Program MB/s (MB/s) | 651 | 582 -11% | 198.2 -70% | ||
| Copy Game MB/s (MB/s) | 1709 | 1479 -13% | 1054 -38% | ||
| CrystalDiskMark 5.2 / 6 | 3% | -7% | -16% | -12% | |
| Write 4K (MB/s) | 116.4 | 111.1 -5% | 125.8 8% | 116.1 0% | 101.4 -13% |
| Read 4K (MB/s) | 43.85 | 45.47 4% | 52.9 21% | 44.98 3% | 40.57 -7% |
| Write Seq (MB/s) | 2927 | 2454 -16% | 1795 -39% | 2370 -19% | 2229 -24% |
| Read Seq (MB/s) | 1997 | 2212 11% | 2315 16% | 1465 -27% | 2528 27% |
| Write 4K Q32T1 (MB/s) | 467.6 | 622 33% | 407.1 -13% | 337.5 -28% | 379.6 -19% |
| Read 4K Q32T1 (MB/s) | 538 | 695 29% | 411.9 -23% | 453.6 -16% | 421.9 -22% |
| Write Seq Q32T1 (MB/s) | 3362 | 2675 -20% | 2844 -15% | 2399 -29% | 2439 -27% |
| Read Seq Q32T1 (MB/s) | 3558 | 3184 -11% | 3130 -12% | 3087 -13% | 3199 -10% |
| Média Total (Programa/Configurações) | -9% /
-12% | -18% /
-20% | -14% /
-13% | -14% /
-14% |
* ... menor é melhor

Disk Throttling: DiskSpd Read Loop, Queue Depth 8
| 3DMark 11 | |
| 1280x720 Performance GPU | |
| KFA2 GeForce RTX 2080 Ti EX | |
| Asus ROG Strix RTX 2080 OC | |
| Nvidia GeForce RTX 2080 Super | |
| Média NVIDIA GeForce RTX 2080 Super Mobile (34021 - 36838, n=4) | |
| MSI GT76 Titan DT 10SGS | |
| Nvidia GeForce RTX 2070 Super | |
| Asus ROG Strix RTX 2070 OC | |
| Alienware m17 R2 P41E | |
| Schenker Key 15 Comet Lake | |
| Schenker XMG Ultra 17 Coffee Lake Refresh | |
| Aorus 17G XB | |
| Asus ASUS ROG Strix SCAR III G731GW-XB74 | |
| 1280x720 Performance Combined | |
| MSI GT76 Titan DT 10SGS | |
| Média NVIDIA GeForce RTX 2080 Super Mobile (16243 - 21954, n=4) | |
| KFA2 GeForce RTX 2080 Ti EX | |
| Schenker XMG Ultra 17 Coffee Lake Refresh | |
| Aorus 17G XB | |
| Schenker Key 15 Comet Lake | |
| Alienware m17 R2 P41E | |
| Asus ROG Strix RTX 2070 OC | |
| Asus ROG Strix RTX 2080 OC | |
| Nvidia GeForce RTX 2070 Super | |
| Nvidia GeForce RTX 2080 Super | |
| Asus ASUS ROG Strix SCAR III G731GW-XB74 | |
| 3DMark 11 Performance | 29634 pontos | |
| 3DMark Cloud Gate Standard Score | 56456 pontos | |
| 3DMark Fire Strike Score | 21653 pontos | |
| 3DMark Time Spy Score | 11010 pontos | |
Ajuda | ||
| Final Fantasy XV Benchmark | |
| 1280x720 Lite Quality | |
| Intel Core i9-10900K | |
| MSI GT76 Titan DT 10SGS | |
| Média NVIDIA GeForce RTX 2080 Super Mobile (193 - 196, n=2) | |
| Alienware m17 R3 P45E | |
| KFA2 GeForce RTX 2080 Ti EX | |
| Asus ROG Strix RTX 2080 OC | |
| Asus ROG Strix RTX 2070 OC | |
| Nvidia GeForce RTX 2070 Super | |
| Nvidia GeForce RTX 2080 Super | |
| Asus ASUS ROG Strix SCAR III G731GW-XB74 | |
| Eluktronics RP-17 | |
| Asus Zephyrus G14 GA401IV | |
| KFA2 GeForce GTX 1650 EX One Click Plus | |
| 1920x1080 High Quality | |
| Intel Core i9-10900K | |
| KFA2 GeForce RTX 2080 Ti EX | |
| MSI GT76 Titan DT 10SGS | |
| Alienware m17 R3 P45E | |
| Média NVIDIA GeForce RTX 2080 Super Mobile (95.7 - 107, n=3) | |
| Nvidia GeForce RTX 2080 Super | |
| Asus ROG Strix RTX 2080 OC | |
| Asus Strix Scar 17 G732LXS | |
| Nvidia GeForce RTX 2070 Super | |
| Asus ROG Strix RTX 2070 OC | |
| Asus ASUS ROG Strix SCAR III G731GW-XB74 | |
| Eluktronics RP-17 | |
| Asus Zephyrus G14 GA401IV | |
| KFA2 GeForce GTX 1650 EX One Click Plus | |
| 3840x2160 High Quality | |
| Intel Core i9-10900K | |
| KFA2 GeForce RTX 2080 Ti EX | |
| MSI GT76 Titan DT 10SGS | |
| Nvidia GeForce RTX 2080 Super | |
| Asus ROG Strix RTX 2080 OC | |
| Média NVIDIA GeForce RTX 2080 Super Mobile (42 - 47, n=2) | |
| Asus Strix Scar 17 G732LXS | |
| Nvidia GeForce RTX 2070 Super | |
| Asus ROG Strix RTX 2070 OC | |
| KFA2 GeForce GTX 1650 EX One Click Plus | |
| GTA V | |
| 1920x1080 Lowest Settings possible | |
| MSI GT76 Titan DT 10SGS | |
| Média NVIDIA GeForce RTX 2080 Super Mobile (182 - 185, n=2) | |
| Asus Strix Scar 17 G732LXS | |
| Aorus 17G XB | |
| 3840x2160 Highest AA:4xMSAA + FX AF:16x | |
| Média NVIDIA GeForce RTX 2080 Super Mobile (47.9 - 49.3, n=3) | |
| MSI GT76 Titan DT 10SGS | |
| 3840x2160 High/On (Advanced Graphics Off) AA:FX AF:8x | |
| KFA2 GeForce RTX 2080 Ti EX | |
| Asus ROG Strix RTX 2080 OC | |
| Nvidia GeForce RTX 2080 Super | |
| Asus ROG Strix RTX 2070 OC | |
| Nvidia GeForce RTX 2070 Super | |
| Média NVIDIA GeForce RTX 2080 Super Mobile (96 - 98.9, n=2) | |
| MSI GT76 Titan DT 10SGS | |
| Gigabyte Aero 15-Y9 | |
| Dota 2 Reborn | |
| 1280x720 min (0/3) fastest | |
| Intel Core i9-10900K | |
| MSI GT76 Titan DT 10SGS | |
| Média NVIDIA GeForce RTX 2080 Super Mobile (150 - 190, n=4) | |
| Asus Strix Scar 17 G732LXS | |
| KFA2 GeForce RTX 2080 Ti EX | |
| Aorus 17G XB | |
| KFA2 GeForce GTX 1650 EX One Click Plus | |
| Alienware m17 R3 P45E | |
| Nvidia GeForce RTX 2070 Super | |
| Nvidia GeForce RTX 2080 Super | |
| Schenker XMG Pro 17 PB71RD-G | |
| Asus Zephyrus G14 GA401IV | |
| Eluktronics RP-17 | |
| 1920x1080 ultra (3/3) best looking | |
| Intel Core i9-10900K | |
| MSI GT76 Titan DT 10SGS | |
| Média NVIDIA GeForce RTX 2080 Super Mobile (127 - 156, n=4) | |
| KFA2 GeForce RTX 2080 Ti EX | |
| Asus Strix Scar 17 G732LXS | |
| Aorus 17G XB | |
| Alienware m17 R3 P45E | |
| Nvidia GeForce RTX 2080 Super | |
| Nvidia GeForce RTX 2070 Super | |
| KFA2 GeForce GTX 1650 EX One Click Plus | |
| Asus Zephyrus G14 GA401IV | |
| Eluktronics RP-17 | |
| Schenker XMG Pro 17 PB71RD-G | |
| 3840x2160 ultra (3/3) best looking | |
| Intel Core i9-10900K | |
| Média NVIDIA GeForce RTX 2080 Super Mobile (136 - 145, n=2) | |
| KFA2 GeForce RTX 2080 Ti EX | |
| MSI GT76 Titan DT 10SGS | |
| Nvidia GeForce RTX 2080 Super | |
| Nvidia GeForce RTX 2070 Super | |
| Eluktronics RP-17 | |
| KFA2 GeForce GTX 1650 EX One Click Plus | |
| Strange Brigade | |
| 1280x720 lowest AF:1 | |
| MSI GT76 Titan DT 10SGS | |
| Média NVIDIA GeForce RTX 2080 Super Mobile (n=1) | |
| KFA2 GeForce GTX 1650 EX One Click Plus | |
| 1920x1080 high AA:high AF:8 | |
| MSI GT76 Titan DT 10SGS | |
| Média NVIDIA GeForce RTX 2080 Super Mobile (n=1) | |
| KFA2 GeForce GTX 1650 EX One Click Plus | |
| 1920x1080 ultra AA:ultra AF:16 | |
| MSI GT76 Titan DT 10SGS | |
| Média NVIDIA GeForce RTX 2080 Super Mobile (n=1) | |
| KFA2 GeForce GTX 1650 EX One Click Plus | |
| X-Plane 11.11 | |
| 1280x720 low (fps_test=1) | |
| Intel Core i9-10900K | |
| MSI GT76 Titan DT 10SGS | |
| Média NVIDIA GeForce RTX 2080 Super Mobile (123 - 145, n=4) | |
| Alienware m17 R3 P45E | |
| KFA2 GeForce RTX 2080 Ti EX | |
| Asus Strix Scar 17 G732LXS | |
| KFA2 GeForce GTX 1650 EX One Click Plus | |
| Aorus 17G XB | |
| Nvidia GeForce RTX 2080 Super | |
| Nvidia GeForce RTX 2070 Super | |
| Asus Zephyrus G14 GA401IV | |
| Eluktronics RP-17 | |
| Schenker XMG Pro 17 PB71RD-G | |
| Gigabyte Aero 15-Y9 | |
| 1920x1080 high (fps_test=3) | |
| Intel Core i9-10900K | |
| MSI GT76 Titan DT 10SGS | |
| Média NVIDIA GeForce RTX 2080 Super Mobile (88.4 - 103, n=4) | |
| Alienware m17 R3 P45E | |
| KFA2 GeForce RTX 2080 Ti EX | |
| KFA2 GeForce GTX 1650 EX One Click Plus | |
| Asus Strix Scar 17 G732LXS | |
| Aorus 17G XB | |
| Nvidia GeForce RTX 2070 Super | |
| Nvidia GeForce RTX 2080 Super | |
| Asus Zephyrus G14 GA401IV | |
| Eluktronics RP-17 | |
| Gigabyte Aero 15-Y9 | |
| Schenker XMG Pro 17 PB71RD-G | |
| 3840x2160 high (fps_test=3) | |
| Intel Core i9-10900K | |
| Média NVIDIA GeForce RTX 2080 Super Mobile (84.2 - 88.2, n=2) | |
| MSI GT76 Titan DT 10SGS | |
| KFA2 GeForce RTX 2080 Ti EX | |
| Nvidia GeForce RTX 2070 Super | |
| KFA2 GeForce GTX 1650 EX One Click Plus | |
| Nvidia GeForce RTX 2080 Super | |
| Gigabyte Aero 15-Y9 | |
| baixo | média | alto | ultra | QHD | 4K | |
|---|---|---|---|---|---|---|
| GTA V (2015) | 185 | 183 | 176 | 101 | 90.2 | 96 |
| The Witcher 3 (2015) | 471.7 | 332 | 223.2 | 113.2 | 80.5 | |
| Dota 2 Reborn (2015) | 179 | 163 | 158 | 148 | 136 | |
| Final Fantasy XV Benchmark (2018) | 196 | 140 | 107 | 80.2 | 47 | |
| X-Plane 11.11 (2018) | 138 | 122 | 98 | 84.2 | ||
| Strange Brigade (2018) | 515 | 265 | 217 | 183 | 137 | 78.4 |
| MSI GT76 Titan DT 10SGS GeForce RTX 2080 Super Mobile, i9-10900K, 2x WDC PC SN730 SDBPNTY-1T00 (RAID 0) | Asus ROG G703GXR GeForce RTX 2080 Mobile, i7-9750H, Samsung SSD PM981 MZVLB512HAJQ | Alienware Area-51m i9-9900K RTX 2080 GeForce RTX 2080 Mobile, i9-9900K, 2x SK Hynix PC400 512GB (RAID 0) | Asus Strix Scar 17 G732LXS GeForce RTX 2080 Super Mobile, i9-10980HK, 2x Intel SSD 660p 1TB SSDPEKNW010T8 (RAID 0) | Schenker XMG Pro 17 PB71RD-G GeForce RTX 2060 Mobile, i7-9750H, Samsung SSD 970 EVO Plus 500GB | MSI GE75 9SG GeForce RTX 2080 Mobile, i9-9880H, Samsung SSD PM981 MZVLB1T0HALR | MSI GT76 Titan DT 9SG GeForce RTX 2080 Mobile, i9-9900K, 2x Samsung PM961 MZVLW256HEHP (RAID 0) | |
|---|---|---|---|---|---|---|---|
| Noise | -9% | -16% | -21% | -15% | -5% | -19% | |
| desligado / ambiente * (dB) | 26.4 | 30 -14% | 28.1 -6% | 25 5% | 30 -14% | 28.2 -7% | 30 -14% |
| Idle Minimum * (dB) | 27.5 | 33 -20% | 28.1 -2% | 33 -20% | 30 -9% | 30.4 -11% | 33 -20% |
| Idle Average * (dB) | 27.5 | 34 -24% | 28.6 -4% | 38 -38% | 32 -16% | 30.4 -11% | 34 -24% |
| Idle Maximum * (dB) | 29.8 | 35 -17% | 51 -71% | 45 -51% | 39 -31% | 33.4 -12% | 44 -48% |
| Load Average * (dB) | 30.9 | 38 -23% | 51 -65% | 54 -75% | 51 -65% | 37.1 -20% | 47 -52% |
| Witcher 3 ultra * (dB) | 60.7 | 50 18% | 51 16% | 50 18% | 54 11% | 54.2 11% | 53 13% |
| Load Maximum * (dB) | 66.6 | 54 19% | 51 23% | 55 17% | 54 19% | 56.4 15% | 59 11% |
* ... menor é melhor
Barulho
| Ocioso |
| 27.5 / 27.5 / 29.8 dB |
| Carga |
| 30.9 / 66.6 dB |
 | ||
30 dB silencioso 40 dB(A) audível 50 dB(A) ruidosamente alto |
||
min: | ||
(+) A temperatura máxima no lado superior é 36.4 °C / 98 F, em comparação com a média de 40.4 °C / 105 F , variando de 21.2 a 68.8 °C para a classe Gaming.
(±) A parte inferior aquece até um máximo de 43 °C / 109 F, em comparação com a média de 43.2 °C / 110 F
(+) Em uso inativo, a temperatura média para o lado superior é 27.3 °C / 81 F, em comparação com a média do dispositivo de 33.9 °C / ### class_avg_f### F.
(±) Jogando The Witcher 3, a temperatura média para o lado superior é 34.8 °C / 95 F, em comparação com a média do dispositivo de 33.9 °C / ## #class_avg_f### F.
(+) Os apoios para as mãos e o touchpad são mais frios que a temperatura da pele, com um máximo de 31.6 °C / 88.9 F e, portanto, são frios ao toque.
(-) A temperatura média da área do apoio para as mãos de dispositivos semelhantes foi 28.8 °C / 83.8 F (-2.8 °C / -5.1 F).
MSI GT76 Titan DT 10SGS análise de áudio
(+) | os alto-falantes podem tocar relativamente alto (###valor### dB)
Graves 100 - 315Hz
(±) | graves reduzidos - em média 8.6% menor que a mediana
(±) | a linearidade dos graves é média (11% delta para a frequência anterior)
Médios 400 - 2.000 Hz
(+) | médios equilibrados - apenas 3.1% longe da mediana
(+) | médios são lineares (6.9% delta para frequência anterior)
Altos 2 - 16 kHz
(+) | agudos equilibrados - apenas 3% longe da mediana
(+) | os máximos são lineares (5.5% delta da frequência anterior)
Geral 100 - 16.000 Hz
(+) | o som geral é linear (9.9% diferença em relação à mediana)
Comparado com a mesma classe
» 5% de todos os dispositivos testados nesta classe foram melhores, 2% semelhantes, 94% piores
» O melhor teve um delta de 6%, a média foi 18%, o pior foi 132%
Comparado com todos os dispositivos testados
» 4% de todos os dispositivos testados foram melhores, 1% semelhantes, 95% piores
» O melhor teve um delta de 4%, a média foi 23%, o pior foi 134%
Apple MacBook 12 (Early 2016) 1.1 GHz análise de áudio
(+) | os alto-falantes podem tocar relativamente alto (###valor### dB)
Graves 100 - 315Hz
(±) | graves reduzidos - em média 11.3% menor que a mediana
(±) | a linearidade dos graves é média (14.2% delta para a frequência anterior)
Médios 400 - 2.000 Hz
(+) | médios equilibrados - apenas 2.4% longe da mediana
(+) | médios são lineares (5.5% delta para frequência anterior)
Altos 2 - 16 kHz
(+) | agudos equilibrados - apenas 2% longe da mediana
(+) | os máximos são lineares (4.5% delta da frequência anterior)
Geral 100 - 16.000 Hz
(+) | o som geral é linear (10.2% diferença em relação à mediana)
Comparado com a mesma classe
» 7% de todos os dispositivos testados nesta classe foram melhores, 2% semelhantes, 90% piores
» O melhor teve um delta de 5%, a média foi 18%, o pior foi 53%
Comparado com todos os dispositivos testados
» 5% de todos os dispositivos testados foram melhores, 1% semelhantes, 94% piores
» O melhor teve um delta de 4%, a média foi 23%, o pior foi 134%
| desligado | |
| Ocioso | |
| Carga |
|
Key:
min: | |
| MSI GT76 Titan DT 10SGS i9-10900K, GeForce RTX 2080 Super Mobile, 2x WDC PC SN730 SDBPNTY-1T00 (RAID 0), IPS, 3840x2160, 17.3" | Asus ROG G703GXR i7-9750H, GeForce RTX 2080 Mobile, Samsung SSD PM981 MZVLB512HAJQ, IPS, 1920x1080, 17.3" | Alienware Area-51m i9-9900K RTX 2080 i9-9900K, GeForce RTX 2080 Mobile, 2x SK Hynix PC400 512GB (RAID 0), IPS, 1920x1080, 17.3" | Asus Strix Scar 17 G732LXS i9-10980HK, GeForce RTX 2080 Super Mobile, 2x Intel SSD 660p 1TB SSDPEKNW010T8 (RAID 0), IPS, 1920x1080, 17.3" | Schenker XMG Pro 17 PB71RD-G i7-9750H, GeForce RTX 2060 Mobile, Samsung SSD 970 EVO Plus 500GB, IPS, 1920x1080, 17.3" | MSI GE75 9SG i9-9880H, GeForce RTX 2080 Mobile, Samsung SSD PM981 MZVLB1T0HALR, AHVA, 1920x1080, 17.3" | MSI GT76 Titan DT 9SG i9-9900K, GeForce RTX 2080 Mobile, 2x Samsung PM961 MZVLW256HEHP (RAID 0), IPS, 1920x1080, 17.3" | |
|---|---|---|---|---|---|---|---|
| Power Consumption | 13% | 7% | 22% | 48% | 38% | 30% | |
| Idle Minimum * (Watt) | 25.9 | 27 -4% | 23.3 10% | 16 38% | 11 58% | 13.9 46% | 14 46% |
| Idle Average * (Watt) | 38 | 32 16% | 33.5 12% | 25 34% | 18 53% | 18.8 51% | 18 53% |
| Idle Maximum * (Watt) | 53.2 | 39 27% | 38.4 28% | 35 34% | 28 47% | 23.1 57% | 23 57% |
| Load Average * (Watt) | 123.8 | 124 -0% | 114.1 8% | 177 -43% | 99 20% | 112.3 9% | 114 8% |
| Witcher 3 ultra * (Watt) | 312.5 | 274 12% | 339.5 -9% | 227 27% | 146 53% | 231 26% | 283 9% |
| Load Maximum * (Watt) | 459.8 | 338 26% | 485.1 -6% | 280 39% | 210 54% | 291.5 37% | 443 4% |
* ... menor é melhor
| MSI GT76 Titan DT 10SGS i9-10900K, GeForce RTX 2080 Super Mobile, 90 Wh | Asus ROG G703GXR i7-9750H, GeForce RTX 2080 Mobile, 96 Wh | Alienware Area-51m i9-9900K RTX 2080 i9-9900K, GeForce RTX 2080 Mobile, 90 Wh | Asus Strix Scar 17 G732LXS i9-10980HK, GeForce RTX 2080 Super Mobile, 66 Wh | Schenker XMG Pro 17 PB71RD-G i7-9750H, GeForce RTX 2060 Mobile, 62 Wh | MSI GE75 9SG i9-9880H, GeForce RTX 2080 Mobile, 65 Wh | MSI GT76 Titan DT 9SG i9-9900K, GeForce RTX 2080 Mobile, 90 Wh | |
|---|---|---|---|---|---|---|---|
| Duração da bateria | 154% | -12% | 146% | 71% | 104% | 108% | |
| WiFi v1.3 (h) | 2.4 | 6.1 154% | 2.1 -12% | 5.9 146% | 4.1 71% | 4.9 104% | 5 108% |
| Reader / Idle (h) | 8.1 | 2.6 | 10 | 5.2 | 6.8 | ||
| Load (h) | 1 | 1.1 | 1.5 | 1.3 | 0.9 |
Pro
Contra
O GT76 Titan tem uma vantagem chave sobre o Dell Alienware Area-51m e o Asus ROG G703: temperaturas de núcleo. O sistema MSI é capaz de rodar seus processadores mais frios quando sob cargas exigentes como jogos, o que não é surpreendente dado que sua rede de 11 tubos de calor internos é a maior que já vimos em um portátil de 17,3 polegadas. A CPU e a GPU são resfriadas independentemente, sem tubos de calor sobrepostos para melhor suportar os esforços de overclock.
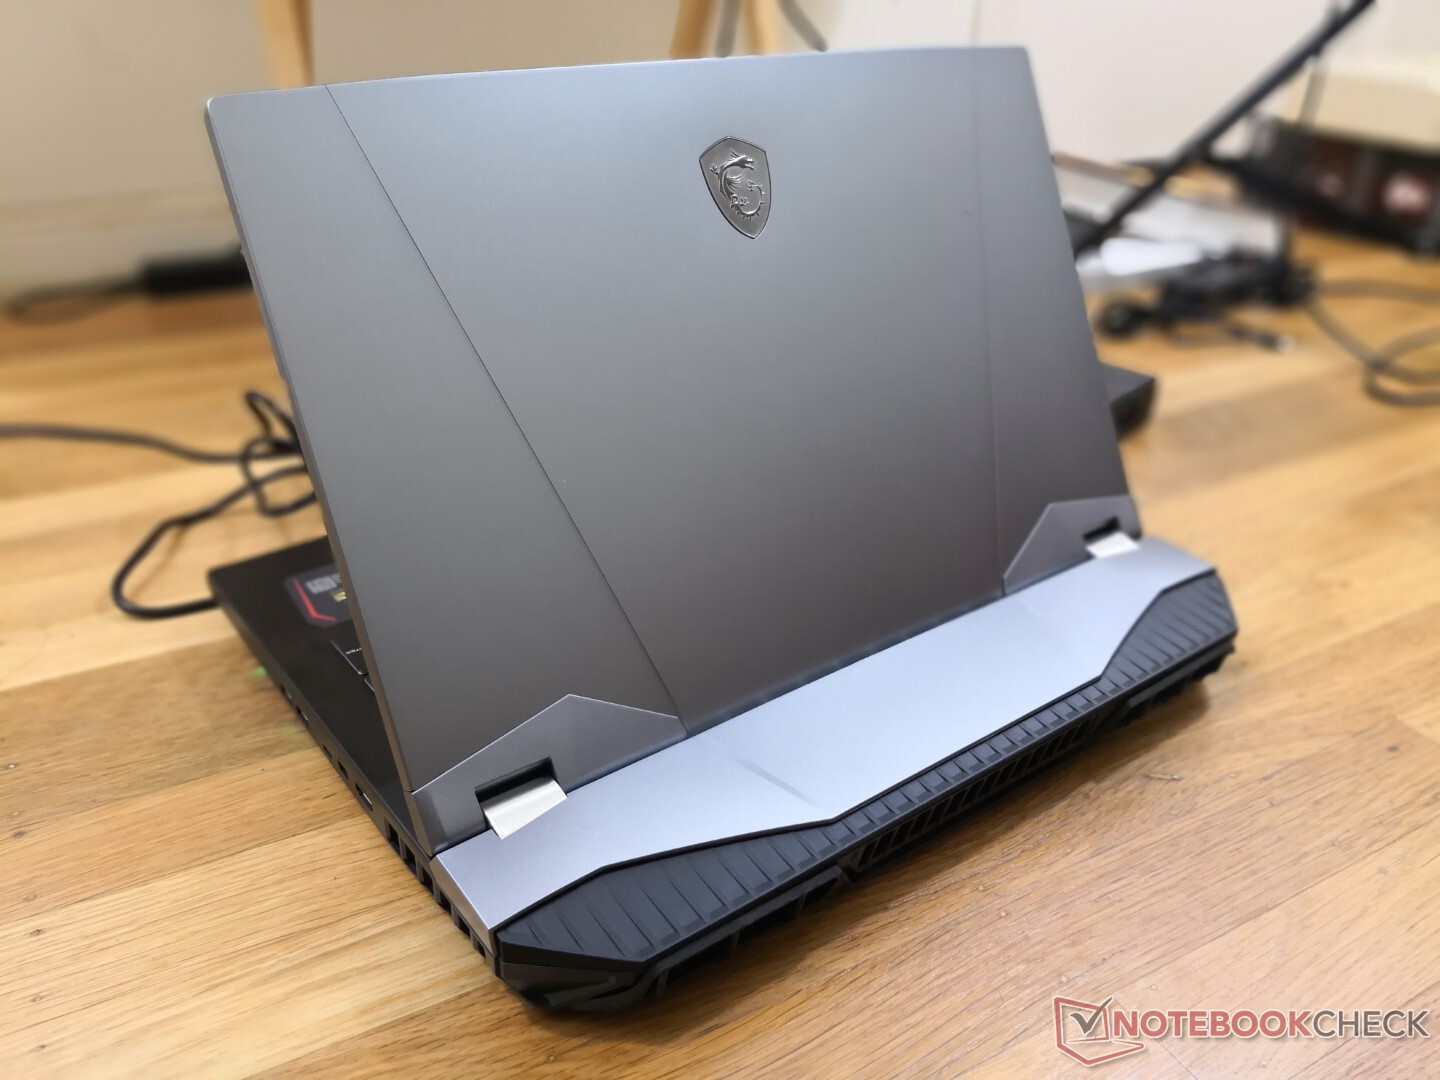
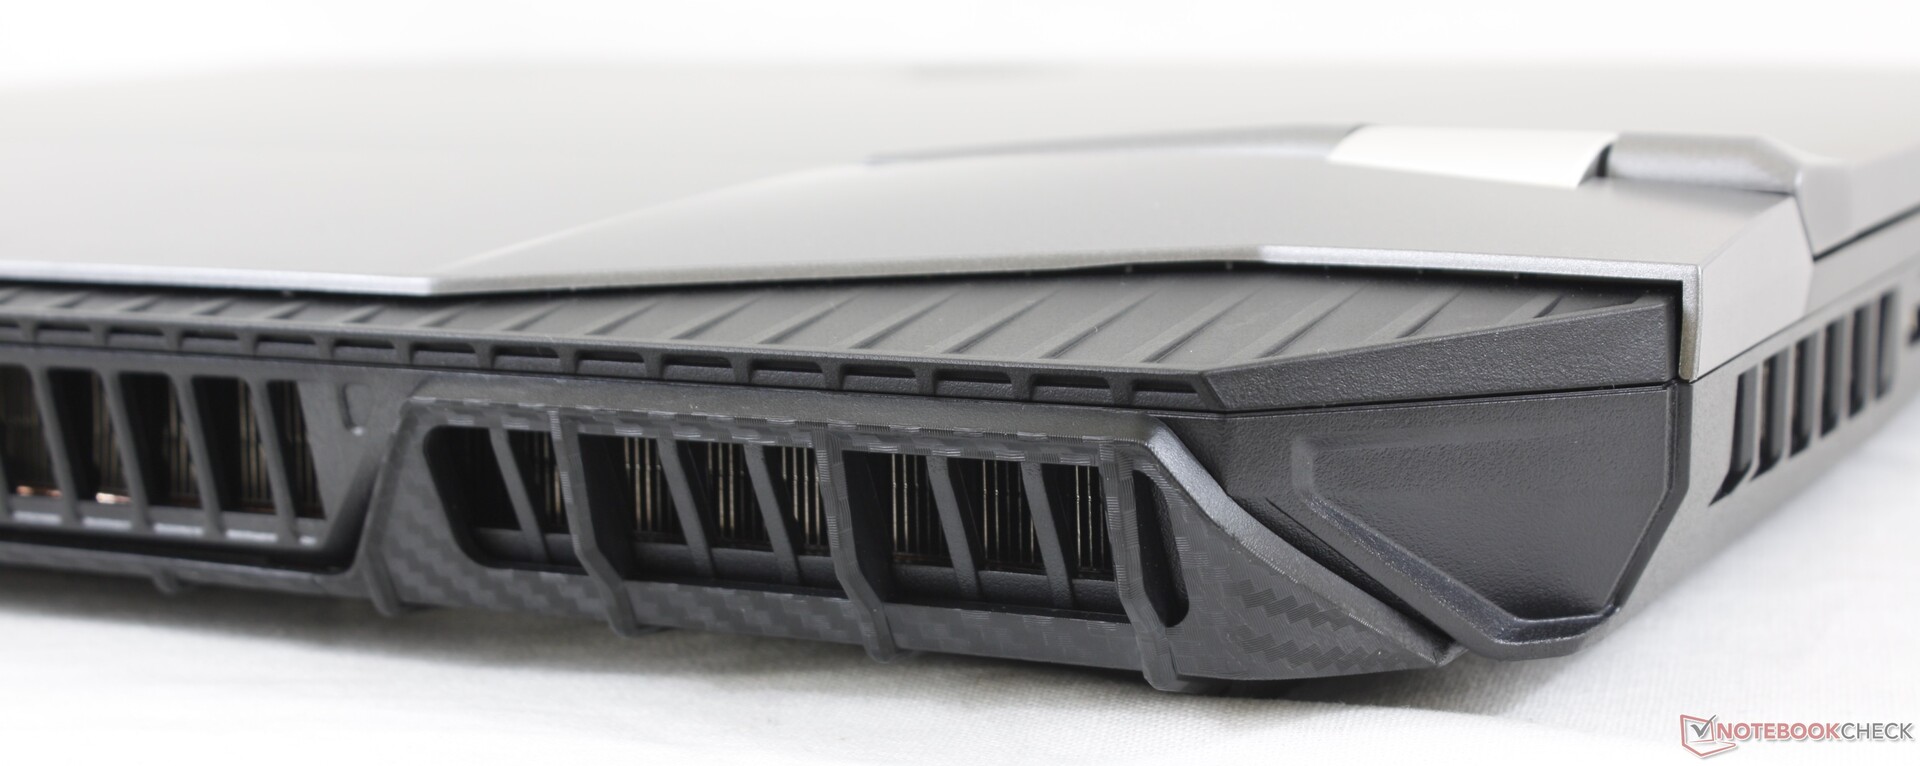
Outras vantagens notáveis incluem o design robusto do chassi, manutenção mais fácil e a opção de tela UHD 4K de 120 Hz que ainda não é um recurso comum.
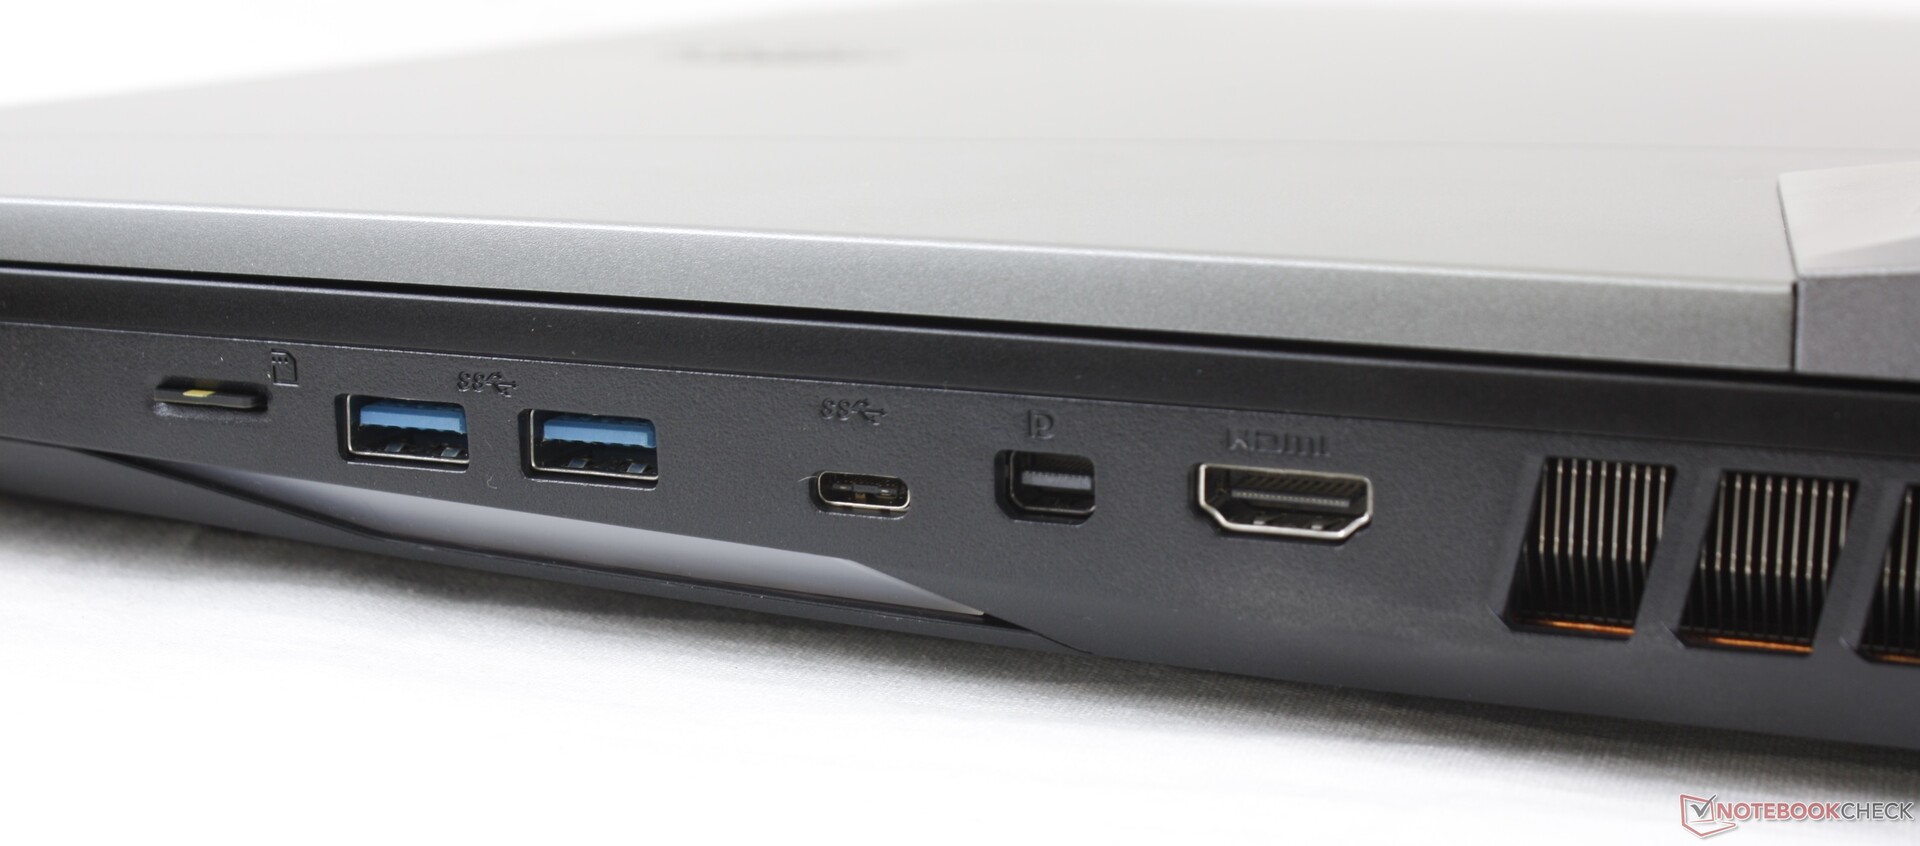
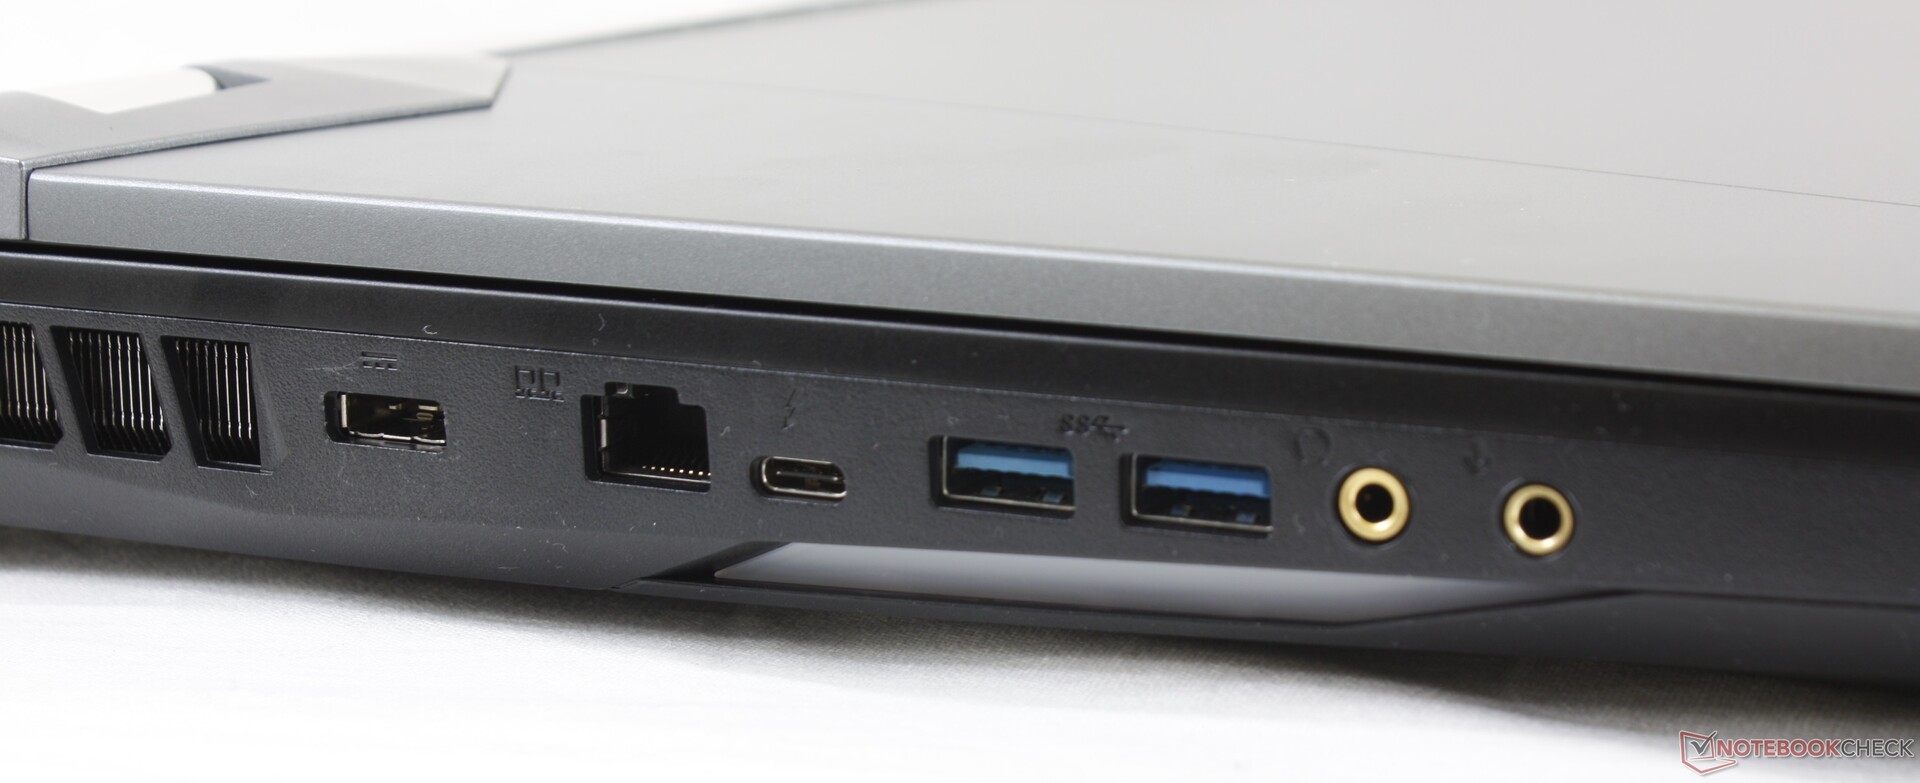
Existem várias desvantagens. O ruído do ventilador ainda é muito alto ao executar cargas exigentes e os dois adaptadores de CA e cabos podem ser ainda mais pesados para carregar do que o próprio portátil. O tamanho do chassi também é muito grande, mesmo para a categoria, devido à parte traseira saliente e à solução de resfriamento ampliada. O painel inferior pode ser difícil de colocar de volta no lugar e a falta de carregamento USB-C e G-Sync é uma oportunidade perdida.
As temperaturas do núcleo são mais baixas do que muitos concorrentes nesta categoria com as mesmas opções de Core i9 e RTX Super para desktop. Você terá que ignorar os ventiladores barulhentos e os adaptadores de CA volumosos para obter o máximo deste substituto de desktop.
MSI GT76 Titan DT 10SGS
- 10/05/2020 v7 (old)
Allen Ngo
Price comparison
