Breve Análise do Portátil Asus ROG G703GX (i7-8750H, RTX 2080)
| SD Card Reader | |
| average JPG Copy Test (av. of 3 runs) | |
| Asus Chimera G703GI (Toshiba Exceria Pro SDXC 64 GB UHS-II) | |
| Aorus X7 DT v8 (Toshiba Exceria Pro SDXC 64 GB UHS-II) | |
| Schenker XMG Ultra 17 (Toshiba Exceria Pro SDXC 64 GB UHS-II) | |
| Asus ROG G703GX (Toshiba Exceria Pro SDXC 64 GB UHS-II) | |
| Média da turma Gaming (20.9 - 210, n=54, últimos 2 anos) | |
| maximum AS SSD Seq Read Test (1GB) | |
| Asus Chimera G703GI (Toshiba Exceria Pro SDXC 64 GB UHS-II) | |
| Aorus X7 DT v8 (Toshiba Exceria Pro SDXC 64 GB UHS-II) | |
| Asus ROG G703GX (Toshiba Exceria Pro SDXC 64 GB UHS-II) | |
| Schenker XMG Ultra 17 (Toshiba Exceria Pro SDXC 64 GB UHS-II) | |
| Média da turma Gaming (25.5 - 261, n=51, últimos 2 anos) | |
| |||||||||||||||||||||||||
iluminação: 85 %
iluminação com acumulador: 296 cd/m²
Contraste: 1184:1 (Preto: 0.25 cd/m²)
ΔE ColorChecker Calman: 4.77 | ∀{0.5-29.43 Ø4.71}
calibrated: 1.46
ΔE Greyscale Calman: 5.83 | ∀{0.09-98 Ø4.96}
93% sRGB (Argyll 1.6.3 3D)
60% AdobeRGB 1998 (Argyll 1.6.3 3D)
65.6% AdobeRGB 1998 (Argyll 3D)
93.3% sRGB (Argyll 3D)
64.1% Display P3 (Argyll 3D)
Gamma: 2.47
CCT: 8076 K
| Asus ROG G703GX AU Optronics B173HAN03.2 (AUO329D), IPS, 1920x1080 | Acer Predator Helios 500 PH517-51-79BY AUO_B173HAN03, IPS, 1920x1080 | Aorus X7 DT v8 AU Optronics B173HAN03.0 (AUO309D), IPS, 1920x1080 | Asus Chimera G703GI B173HAN03.2 (AUO329D), IPS, 1920x1080 | Schenker XMG Ultra 17 AU Optronics B173ZAN01.0 (AUO109B), IPS, 3840x2160 | |
|---|---|---|---|---|---|
| Display | -1% | 0% | 1% | 31% | |
| Display P3 Coverage (%) | 64.1 | 64.4 0% | 65.3 2% | 65.8 3% | 86.4 35% |
| sRGB Coverage (%) | 93.3 | 91.3 -2% | 91.2 -2% | 92.6 -1% | 100 7% |
| AdobeRGB 1998 Coverage (%) | 65.6 | 65.6 0% | 66.3 1% | 67 2% | 99.1 51% |
| Response Times | -44% | -88% | -1% | -335% | |
| Response Time Grey 50% / Grey 80% * (ms) | 7.2 ? | 14 ? -94% | 18 ? -150% | 6.4 ? 11% | 44 ? -511% |
| Response Time Black / White * (ms) | 9.6 ? | 9 ? 6% | 12 ? -25% | 10.8 ? -13% | 24.8 ? -158% |
| PWM Frequency (Hz) | |||||
| Screen | -23% | 19% | 10% | 15% | |
| Brightness middle (cd/m²) | 296 | 335 13% | 297 0% | 285 -4% | 332 12% |
| Brightness (cd/m²) | 279 | 300 8% | 281 1% | 275 -1% | 313 12% |
| Brightness Distribution (%) | 85 | 82 -4% | 84 -1% | 82 -4% | 88 4% |
| Black Level * (cd/m²) | 0.25 | 0.7 -180% | 0.23 8% | 0.22 12% | 0.28 -12% |
| Contrast (:1) | 1184 | 479 -60% | 1291 9% | 1295 9% | 1186 0% |
| Colorchecker dE 2000 * | 4.77 | 4.99 -5% | 2.19 54% | 3.18 33% | 3.86 19% |
| Colorchecker dE 2000 max. * | 9.08 | 9.32 -3% | 4.81 47% | 5.99 34% | 5.88 35% |
| Colorchecker dE 2000 calibrated * | 1.46 | 1.93 -32% | 1.73 -18% | ||
| Greyscale dE 2000 * | 5.83 | 5.2 11% | 1.31 78% | 2.93 50% | 4.33 26% |
| Gamma | 2.47 89% | 2.49 88% | 2.42 91% | 2.45 90% | 2.41 91% |
| CCT | 8076 80% | 7719 84% | 6464 101% | 7165 91% | 6595 99% |
| Color Space (Percent of AdobeRGB 1998) (%) | 60 | 59 -2% | 59 -2% | 60 0% | 88 47% |
| Color Space (Percent of sRGB) (%) | 93 | 91 -2% | 91 -2% | 93 0% | 100 8% |
| Média Total (Programa/Configurações) | -23% /
-22% | -23% /
1% | 3% /
7% | -96% /
-28% |
* ... menor é melhor
Exibir tempos de resposta
| ↔ Tempo de resposta preto para branco | ||
|---|---|---|
| 9.6 ms ... ascensão ↗ e queda ↘ combinadas | ↗ 4.4 ms ascensão | 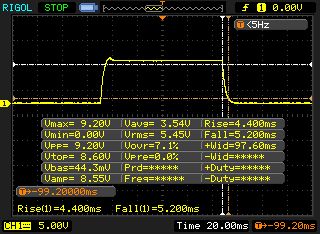 |
| ↘ 5.2 ms queda | ||
| A tela mostra taxas de resposta rápidas em nossos testes e deve ser adequada para jogos. Em comparação, todos os dispositivos testados variam de 0.1 (mínimo) a 240 (máximo) ms. » 26 % de todos os dispositivos são melhores. Isso significa que o tempo de resposta medido é melhor que a média de todos os dispositivos testados (19.8 ms). | ||
| ↔ Tempo de resposta 50% cinza a 80% cinza | ||
| 7.2 ms ... ascensão ↗ e queda ↘ combinadas | ↗ 3.8 ms ascensão | 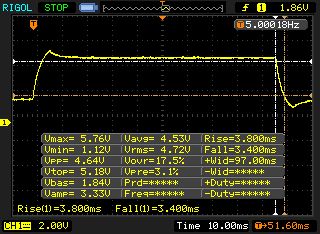 |
| ↘ 3.4 ms queda | ||
| A tela mostra taxas de resposta muito rápidas em nossos testes e deve ser muito adequada para jogos em ritmo acelerado. Em comparação, todos os dispositivos testados variam de 0.165 (mínimo) a 636 (máximo) ms. » 20 % de todos os dispositivos são melhores. Isso significa que o tempo de resposta medido é melhor que a média de todos os dispositivos testados (31 ms). | ||
Cintilação da tela / PWM (modulação por largura de pulso)
| Tela tremeluzindo / PWM não detectado | 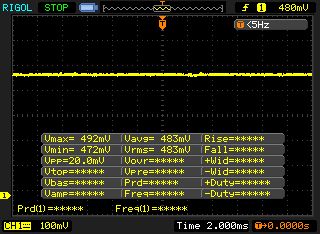 | ||
[pwm_comparison] Em comparação: 52 % de todos os dispositivos testados não usam PWM para escurecer a tela. Se PWM foi detectado, uma média de 7757 (mínimo: 5 - máximo: 343500) Hz foi medida. | |||
| Cinebench R10 | |
| Rendering Single 32Bit | |
| Média da turma Gaming (7457 - 12575, n=9, últimos 2 anos) | |
| Schenker XMG Ultra 17 | |
| Asus ROG G703GX | |
| Rendering Multiple CPUs 32Bit | |
| Média da turma Gaming (42932 - 102066, n=9, últimos 2 anos) | |
| Asus ROG G703GX | |
| Schenker XMG Ultra 17 | |
| Geekbench 3 | |
| 32 Bit Multi-Core Score | |
| Asus ROG G703GX | |
| Schenker XMG Ultra 17 | |
| 32 Bit Single-Core Score | |
| Schenker XMG Ultra 17 | |
| Asus ROG G703GX | |
| Geekbench 4.0 | |
| 64 Bit Multi-Core Score | |
| Média da turma Gaming (40469 - 76142, n=4, últimos 2 anos) | |
| Asus ROG G703GX | |
| 64 Bit Single-Core Score | |
| Média da turma Gaming (7589 - 9053, n=4, últimos 2 anos) | |
| Asus ROG G703GX | |
| Geekbench 4.4 | |
| 64 Bit Multi-Core Score | |
| Média da turma Gaming (89200 - 101054, n=3, últimos 2 anos) | |
| Asus ROG G703GX | |
| 64 Bit Single-Core Score | |
| Média da turma Gaming (9335 - 9775, n=3, últimos 2 anos) | |
| Asus ROG G703GX | |
| Mozilla Kraken 1.1 - Total | |
| Asus ROG G703GX (Edge 44) | |
| Schenker XMG Ultra 17 (Edge 41) | |
| Acer Predator Helios 500 PH517-51-79BY | |
| Média da turma Gaming (391 - 590, n=100, últimos 2 anos) | |
| Octane V2 - Total Score | |
| Média da turma Gaming (93292 - 139447, n=27, últimos 2 anos) | |
| Acer Predator Helios 500 PH517-51-79BY | |
| Asus ROG G703GX (Edge 44) | |
| JetStream 1.1 - 1.1 Total | |
| Média da turma Gaming (549 - 647, n=3, últimos 2 anos) | |
| Schenker XMG Ultra 17 (Edge 41) | |
| Asus ROG G703GX (Edge 44) | |
| Acer Predator Helios 500 PH517-51-79BY | |
* ... menor é melhor
| PCMark 7 Score | 6734 pontos | |
| PCMark 8 Home Score Accelerated v2 | 4622 pontos | |
| PCMark 8 Creative Score Accelerated v2 | 5305 pontos | |
| PCMark 8 Work Score Accelerated v2 | 5697 pontos | |
| PCMark 10 Score | 5680 pontos | |
Ajuda | ||
| PCMark 10 - Score | |
| Média da turma Gaming (5828 - 12414, n=93, últimos 2 anos) | |
| Asus Chimera G703GI | |
| Schenker XMG Ultra 17 | |
| Asus ROG G703GX | |
| Acer Predator Helios 500 PH517-51-79BY | |
| Aorus X7 DT v8 | |

| Asus ROG G703GX Samsung SSD PM981 MZVLB512HAJQ | Acer Predator Helios 500 PH517-51-79BY SK hynix SSD Canvas SC300 HFS256GD9MNE-6200A | Aorus X7 DT v8 Toshiba NVMe THNSN5512GPU7 | Asus Chimera G703GI 2x Intel 760p 512 GB + 1x Samsung SM961 512 GB (RAID) | Schenker XMG Ultra 17 Samsung SSD 960 Evo 500GB m.2 NVMe | |
|---|---|---|---|---|---|
| CrystalDiskMark 5.2 / 6 | -30% | -12% | 92% | 14% | |
| Write 4K (MB/s) | 90.4 | 79.2 -12% | 88.6 -2% | 130.2 44% | 153.5 70% |
| Read 4K (MB/s) | 39.19 | 39.69 1% | 30.76 -22% | 57.3 46% | 44.1 13% |
| Write Seq (MB/s) | 1863 | 950 -49% | 1340 -28% | 4049 117% | 1725 -7% |
| Read Seq (MB/s) | 2100 | 1087 -48% | 1362 -35% | 5325 154% | 1750 -17% |
| Write 4K Q32T1 (MB/s) | 260.2 | 189.6 -27% | 305.7 17% | 383.2 47% | 340 31% |
| Read 4K Q32T1 (MB/s) | 297 | 304 2% | 366.8 24% | 424.9 43% | 392.1 32% |
| Write Seq Q32T1 (MB/s) | 1870 | 948 -49% | 1562 -16% | 4316 131% | 1839 -2% |
| Read Seq Q32T1 (MB/s) | 3471 | 1488 -57% | 2414 -30% | 8905 157% | 3308 -5% |
| 3DMark 06 Standard Score | 35591 pontos | |
| 3DMark 11 Performance | 24624 pontos | |
| 3DMark Ice Storm Standard Score | 117607 pontos | |
| 3DMark Cloud Gate Standard Score | 37209 pontos | |
| 3DMark Fire Strike Score | 20452 pontos | |
| 3DMark Fire Strike Extreme Score | 11801 pontos | |
| 3DMark Time Spy Score | 9617 pontos | |
Ajuda | ||
| 3DMark | |
| 2560x1440 Port Royal Graphics | |
| Média da turma Gaming (4395 - 17286, n=71, últimos 2 anos) | |
| Asus ROG G703GX (Turbo-Mode) | |
| Asus ROG G703GX | |
| Schenker XMG Ultra 15 | |
| 2560x1440 Time Spy Graphics | |
| Média da turma Gaming (5012 - 26212, n=115, últimos 2 anos) | |
| Asus ROG G703GX (Turbo-Mode) | |
| Asus ROG G703GX | |
| Schenker XMG Ultra 15 | |
| Schenker XMG Ultra 17 | |
| Acer Predator Helios 500 PH517-51-79BY | |
| 1920x1080 Fire Strike Graphics | |
| Média da turma Gaming (12242 - 62849, n=115, últimos 2 anos) | |
| Asus ROG G703GX (Turbo-Mode) | |
| Asus ROG G703GX | |
| Schenker XMG Ultra 15 | |
| Asus Chimera G703GI | |
| Schenker XMG Ultra 17 | |
| Aorus X7 DT v8 | |
| Acer Predator Helios 500 PH517-51-79BY | |
| 3DMark 11 - 1280x720 Performance GPU | |
| Média da turma Gaming (21841 - 80022, n=104, últimos 2 anos) | |
| Asus ROG G703GX (Turbo-Mode) | |
| Asus ROG G703GX | |
| Schenker XMG Ultra 15 | |
| Asus Chimera G703GI | |
| Schenker XMG Ultra 17 | |
| Aorus X7 DT v8 | |
| baixo | média | alto | ultra | |
|---|---|---|---|---|
| BioShock Infinite (2013) | 298.3 | 264.1 | 247.8 | 180.7 |
| GTA V (2015) | 164 | 159.6 | 126.4 | 75 |
| The Witcher 3 (2015) | 280.8 | 210.2 | 169.6 | 99.7 |
| X-Plane 11.11 (2018) | 98.2 | 86.2 | 73.1 | |
| Far Cry 5 (2018) | 123 | 104 | 97 | 96 |
| Shadow of the Tomb Raider (2018) | 124 | 115 | 111 | 106 |
| Call of Duty Black Ops 4 (2018) | 143.8 | 119.1 | 124.6 | 120 |
| Battlefield V (2018) | 157.2 | 117.6 | 118.3 | 117.4 |
| Darksiders III (2018) | 171.9 | 111 | 104.2 | 102.9 |
| The Witcher 3 - 1920x1080 Ultra Graphics & Postprocessing (HBAO+) | |
| Média da turma Gaming (104.7 - 240, n=7, últimos 2 anos) | |
| Asus ROG G703GX | |
| Schenker XMG Ultra 15 | |
| Aorus X9 DT | |
| MSI GT75 8RG-090 Titan | |
| Asus Chimera G703GI | |
| Schenker XMG Ultra 17 | |
| MSI GT63 Titan 8RG-046 | |
| Aorus X7 DT v8 | |
| Acer Predator Helios 500 PH517-51-79BY | |
| BioShock Infinite - 1920x1080 Ultra Preset, DX11 (DDOF) | |
| Asus ROG G703GX | |
| MSI GT63 Titan 8RG-046 | |
| Far Cry 5 - 1920x1080 Ultra Preset AA:T | |
| Média da turma Gaming (70 - 151, n=6, últimos 2 anos) | |
| Schenker XMG Ultra 15 | |
| Aorus X9 DT | |
| MSI GT75 8RG-090 Titan | |
| Asus Chimera G703GI | |
| Asus ROG G703GX | |
| Shadow of the Tomb Raider - 1920x1080 Highest Preset AA:T | |
| Asus ROG G703GX | |
| Média da turma Gaming (96 - 116, n=2, últimos 2 anos) | |
| Schenker XMG Ultra 15 | |
| Call of Duty Black Ops 4 - 1920x1080 Very High / On | |
| Schenker XMG Ultra 15 | |
| Asus ROG G703GX | |
| Darksiders III - 1920x1080 Epic | |
| Schenker XMG Ultra 15 | |
| Asus ROG G703GX | |
Barulho
| Ocioso |
| 30 / 35 / 41 dB |
| HDD |
| 33 dB |
| Carga |
| 44 / 52 dB |
 | ||
30 dB silencioso 40 dB(A) audível 50 dB(A) ruidosamente alto |
||
min: | ||
| Asus ROG G703GX i7-8750H, GeForce RTX 2080 Mobile | Acer Predator Helios 500 PH517-51-79BY i7-8750H, GeForce GTX 1070 Mobile | Aorus X7 DT v8 i7-8850H, GeForce GTX 1080 Mobile | Asus Chimera G703GI i9-8950HK, GeForce GTX 1080 Mobile | Schenker XMG Ultra 17 i7-8700, GeForce GTX 1080 Mobile | Média da turma Gaming | |
|---|---|---|---|---|---|---|
| Noise | 6% | -3% | -3% | -4% | 13% | |
| desligado / ambiente * (dB) | 30 | 30.4 -1% | 29 3% | 29 3% | 30 -0% | 24.1 ? 20% |
| Idle Minimum * (dB) | 30 | 31.2 -4% | 35 -17% | 30 -0% | 34 -13% | 26 ? 13% |
| Idle Average * (dB) | 35 | 35.3 -1% | 36 -3% | 34 3% | 35 -0% | 27.4 ? 22% |
| Idle Maximum * (dB) | 41 | 35.3 14% | 41 -0% | 42 -2% | 40 2% | 30.1 ? 27% |
| Load Average * (dB) | 44 | 44.4 -1% | 43 2% | 53 -20% | 45 -2% | 43.6 ? 1% |
| Witcher 3 ultra * (dB) | 51 | 41 20% | 53 -4% | 51 -0% | 52 -2% | |
| Load Maximum * (dB) | 52 | 45.2 13% | 54 -4% | 53 -2% | 60 -15% | 54.2 ? -4% |
* ... menor é melhor
(-) A temperatura máxima no lado superior é 50 °C / 122 F, em comparação com a média de 40.4 °C / 105 F , variando de 21.2 a 68.8 °C para a classe Gaming.
(-) A parte inferior aquece até um máximo de 50 °C / 122 F, em comparação com a média de 43.2 °C / 110 F
(+) Em uso inativo, a temperatura média para o lado superior é 28.3 °C / 83 F, em comparação com a média do dispositivo de 33.9 °C / ### class_avg_f### F.
(±) Jogando The Witcher 3, a temperatura média para o lado superior é 37.2 °C / 99 F, em comparação com a média do dispositivo de 33.9 °C / ## #class_avg_f### F.
(+) Os apoios para as mãos e o touchpad são mais frios que a temperatura da pele, com um máximo de 28 °C / 82.4 F e, portanto, são frios ao toque.
(±) A temperatura média da área do apoio para as mãos de dispositivos semelhantes foi 28.8 °C / 83.8 F (+0.8 °C / 1.4 F).
| Asus ROG G703GX i7-8750H, GeForce RTX 2080 Mobile | Acer Predator Helios 500 PH517-51-79BY i7-8750H, GeForce GTX 1070 Mobile | Aorus X7 DT v8 i7-8850H, GeForce GTX 1080 Mobile | Asus Chimera G703GI i9-8950HK, GeForce GTX 1080 Mobile | Schenker XMG Ultra 17 i7-8700, GeForce GTX 1080 Mobile | Média da turma Gaming | |
|---|---|---|---|---|---|---|
| Heat | 9% | -1% | -2% | 4% | 2% | |
| Maximum Upper Side * (°C) | 50 | 42.6 15% | 51 -2% | 50 -0% | 41 18% | 45.2 ? 10% |
| Maximum Bottom * (°C) | 50 | 37.2 26% | 63 -26% | 50 -0% | 48 4% | 48.1 ? 4% |
| Idle Upper Side * (°C) | 30 | 33.6 -12% | 27 10% | 32 -7% | 30 -0% | 31 ? -3% |
| Idle Bottom * (°C) | 33 | 31 6% | 28 15% | 33 -0% | 35 -6% | 34.2 ? -4% |
* ... menor é melhor
Asus ROG G703GX análise de áudio
(+) | os alto-falantes podem tocar relativamente alto (###valor### dB)
Graves 100 - 315Hz
(±) | graves reduzidos - em média 13.3% menor que a mediana
(±) | a linearidade dos graves é média (8.9% delta para a frequência anterior)
Médios 400 - 2.000 Hz
(+) | médios equilibrados - apenas 4% longe da mediana
(+) | médios são lineares (3.4% delta para frequência anterior)
Altos 2 - 16 kHz
(±) | máximos reduzidos - em média 5.1% menor que a mediana
(+) | os máximos são lineares (4.4% delta da frequência anterior)
Geral 100 - 16.000 Hz
(±) | a linearidade do som geral é média (15.4% diferença em relação à mediana)
Comparado com a mesma classe
» 34% de todos os dispositivos testados nesta classe foram melhores, 7% semelhantes, 59% piores
» O melhor teve um delta de 6%, a média foi 18%, o pior foi 132%
Comparado com todos os dispositivos testados
» 23% de todos os dispositivos testados foram melhores, 4% semelhantes, 73% piores
» O melhor teve um delta de 4%, a média foi 23%, o pior foi 134%
Asus Chimera G703GI análise de áudio
(+) | os alto-falantes podem tocar relativamente alto (###valor### dB)
Graves 100 - 315Hz
(±) | graves reduzidos - em média 8.9% menor que a mediana
(+) | o baixo é linear (6.4% delta para a frequência anterior)
Médios 400 - 2.000 Hz
(+) | médios equilibrados - apenas 3.1% longe da mediana
(+) | médios são lineares (2.4% delta para frequência anterior)
Altos 2 - 16 kHz
(+) | agudos equilibrados - apenas 4.4% longe da mediana
(+) | os máximos são lineares (3.2% delta da frequência anterior)
Geral 100 - 16.000 Hz
(+) | o som geral é linear (11.8% diferença em relação à mediana)
Comparado com a mesma classe
» 11% de todos os dispositivos testados nesta classe foram melhores, 4% semelhantes, 85% piores
» O melhor teve um delta de 6%, a média foi 18%, o pior foi 132%
Comparado com todos os dispositivos testados
» 9% de todos os dispositivos testados foram melhores, 3% semelhantes, 89% piores
» O melhor teve um delta de 4%, a média foi 23%, o pior foi 134%
| desligado | |
| Ocioso | |
| Carga |
|
Key:
min: | |
| Asus ROG G703GX i7-8750H, GeForce RTX 2080 Mobile | Acer Predator Helios 500 PH517-51-79BY i7-8750H, GeForce GTX 1070 Mobile | Aorus X7 DT v8 i7-8850H, GeForce GTX 1080 Mobile | Asus Chimera G703GI i9-8950HK, GeForce GTX 1080 Mobile | Schenker XMG Ultra 17 i7-8700, GeForce GTX 1080 Mobile | Média da turma Gaming | |
|---|---|---|---|---|---|---|
| Power Consumption | -42% | -59% | -95% | -96% | -16% | |
| Idle Minimum * (Watt) | 5 | 20.4 -308% | 23 -360% | 29 -480% | 32 -540% | 13 ? -160% |
| Idle Average * (Watt) | 24 | 26.5 -10% | 33 -38% | 37 -54% | 38 -58% | 19 ? 21% |
| Idle Maximum * (Watt) | 42 | 37 12% | 37 12% | 46 -10% | 45 -7% | 24.6 ? 41% |
| Load Average * (Watt) | 112 | 129 -15% | 115 -3% | 156 -39% | 96 14% | 110.7 ? 1% |
| Witcher 3 ultra * (Watt) | 284 | 186 35% | 225 21% | 252 11% | 237 17% | |
| Load Maximum * (Watt) | 320 | 216 32% | 281 12% | 314 2% | 331 -3% | 259 ? 19% |
* ... menor é melhor
| Asus ROG G703GX i7-8750H, GeForce RTX 2080 Mobile, 96 Wh | Schenker XMG Ultra 17 i7-8700, GeForce GTX 1080 Mobile, 82 Wh | Acer Predator Helios 500 PH517-51-79BY i7-8750H, GeForce GTX 1070 Mobile, 72 Wh | Aorus X7 DT v8 i7-8850H, GeForce GTX 1080 Mobile, 94.24 Wh | Asus Chimera G703GI i9-8950HK, GeForce GTX 1080 Mobile, 71 Wh | Média da turma Gaming | |
|---|---|---|---|---|---|---|
| Duração da bateria | -32% | -9% | -2% | -40% | 70% | |
| Reader / Idle (h) | 5 | 2.7 -46% | 4.2 -16% | 4.9 -2% | 2.8 -44% | 8.27 ? 65% |
| H.264 (h) | 3.8 | 2.5 -34% | 8.32 ? 119% | |||
| WiFi v1.3 (h) | 4 | 2.4 -40% | 2.9 -27% | 3.8 -5% | 2.2 -45% | 7.11 ? 78% |
| Load (h) | 1.3 | 1.2 -8% | 1.5 15% | 1.3 0% | 0.9 -31% | 1.502 ? 16% |
| Witcher 3 ultra (h) | 1.1 |
Pro
Contra
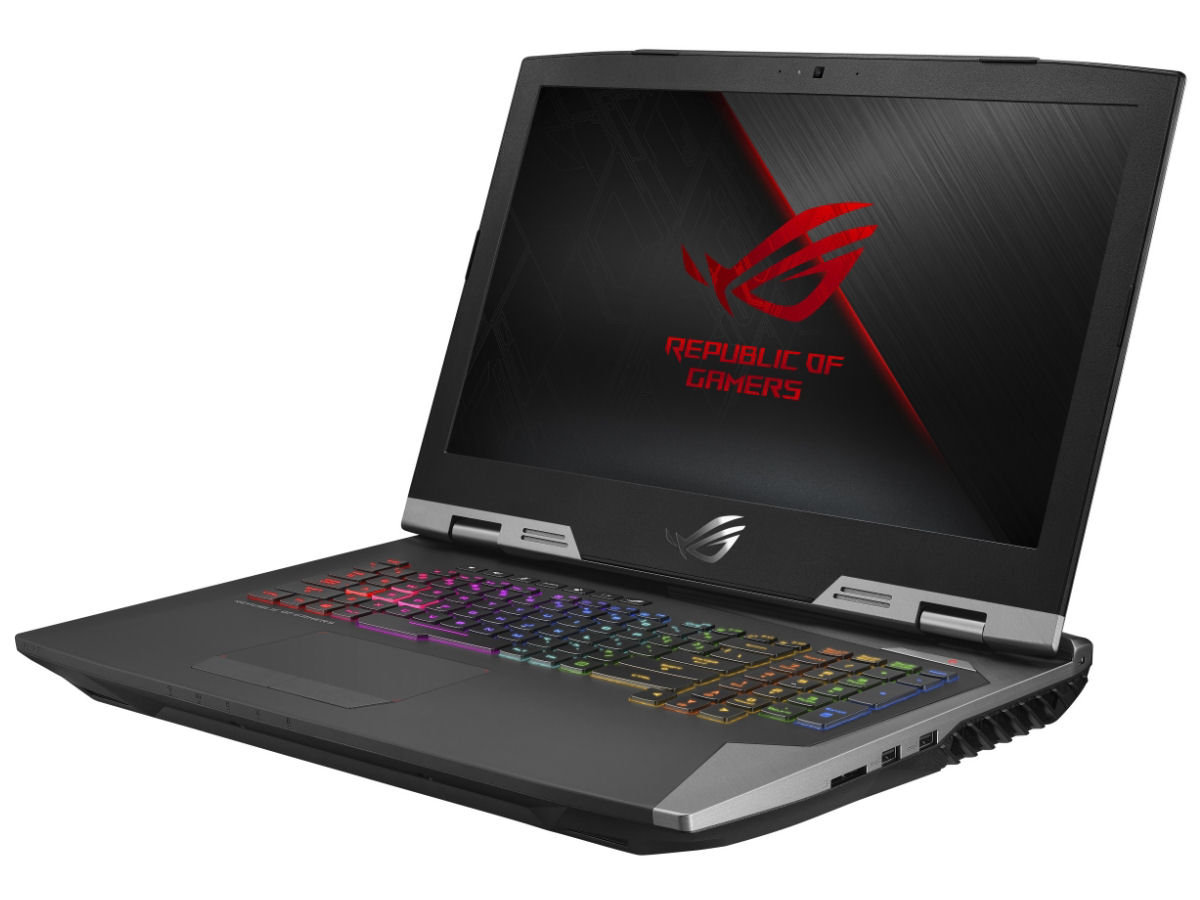
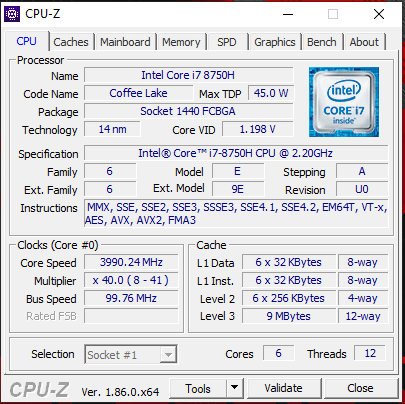
O Asus ROG G703GX é capaz de trazer todos os jogos de computador atuais fluentemente para a tela Full-HD mate. Você não precisa se preocupar com as configurações de qualidade e, durante todos os jogos, as configurações podem ser ajustadas ao máximo. O GeForce GTX 2080 e o processador hexa-core Coffee-Lake oferecem suficiente desempenho computacional para os próximos anos.
O Asus ROG G703GX é um dos melhores e mais rápidos portáteis de gama alta para jogos, disponíveis atualmente.
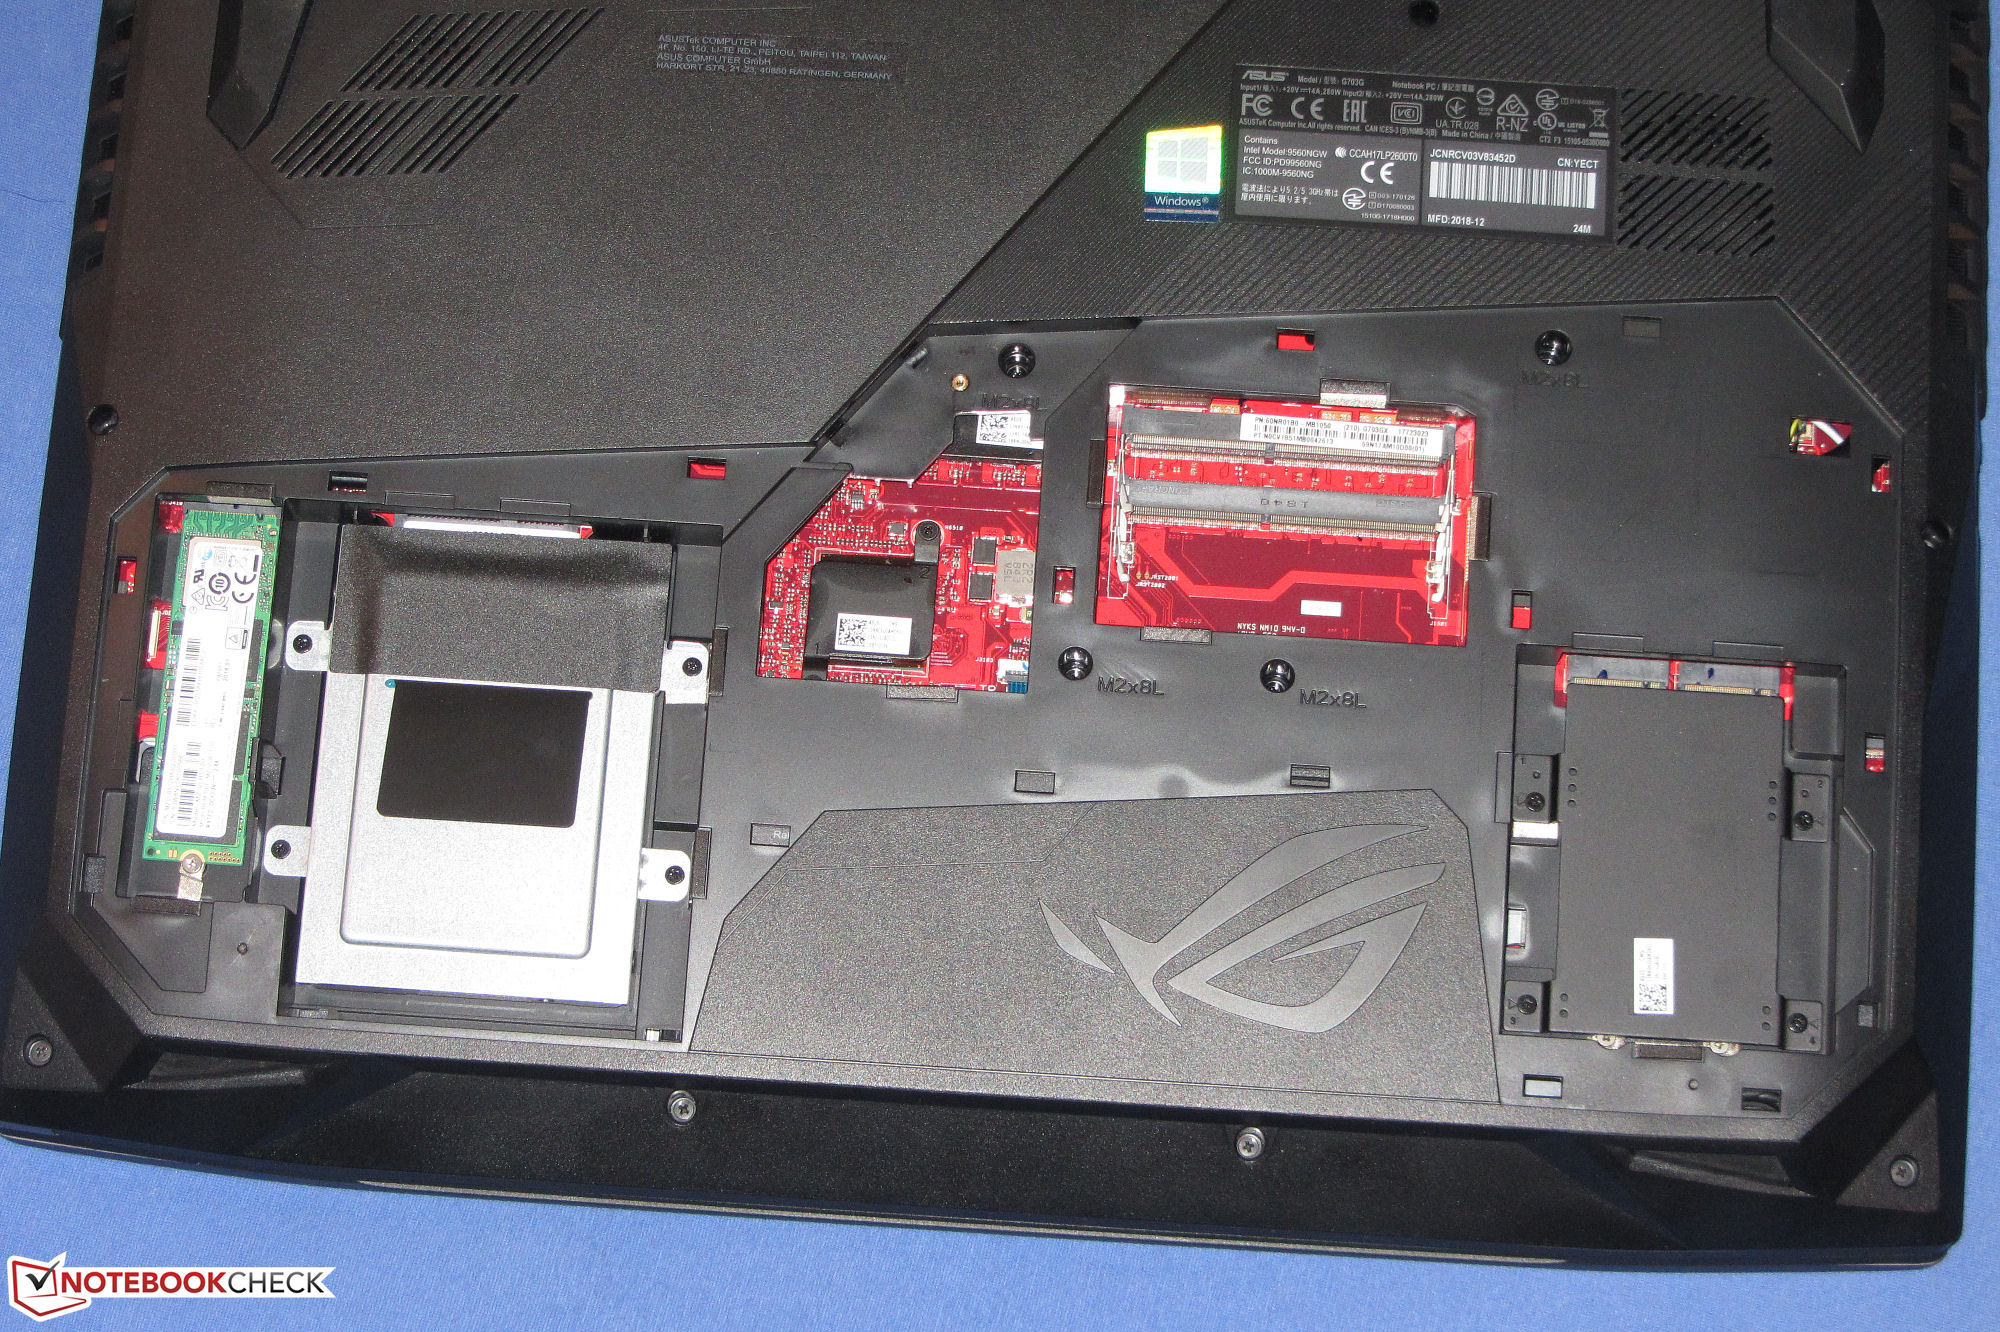
Um incrivelmente veloz SSD garante um sistema veloz. Além disso, há um disco rígido de 1 TB a bordo. A substituição das duas unidades não seria um problema, e você também poderia adicionar mais SSDs, já que dois slots M.2-2280 adicionais aguardam por trás de uma escotilha de manutenção.
A tela IPS de 144 Hz com capacidade para G-Sync agrada com um bom contraste, ângulos de visão estáveis e bons tempos de resposta. O valor de brilho é bom, mas poderia ter sido maior. A duração da bateria é decente para um dispositivo desta classe de desempenho. O efeito de uma bateria de maior capacidade em comparação com o predecessor é perceptível aqui. Isto é acompanhado por conexões modernas como Thunderbolt 3 e Ethernet de 2.5 Gigabit.
Asus ROG G703GX
- 05/14/2020 v7 (old)
Sascha Mölck
Price comparison
