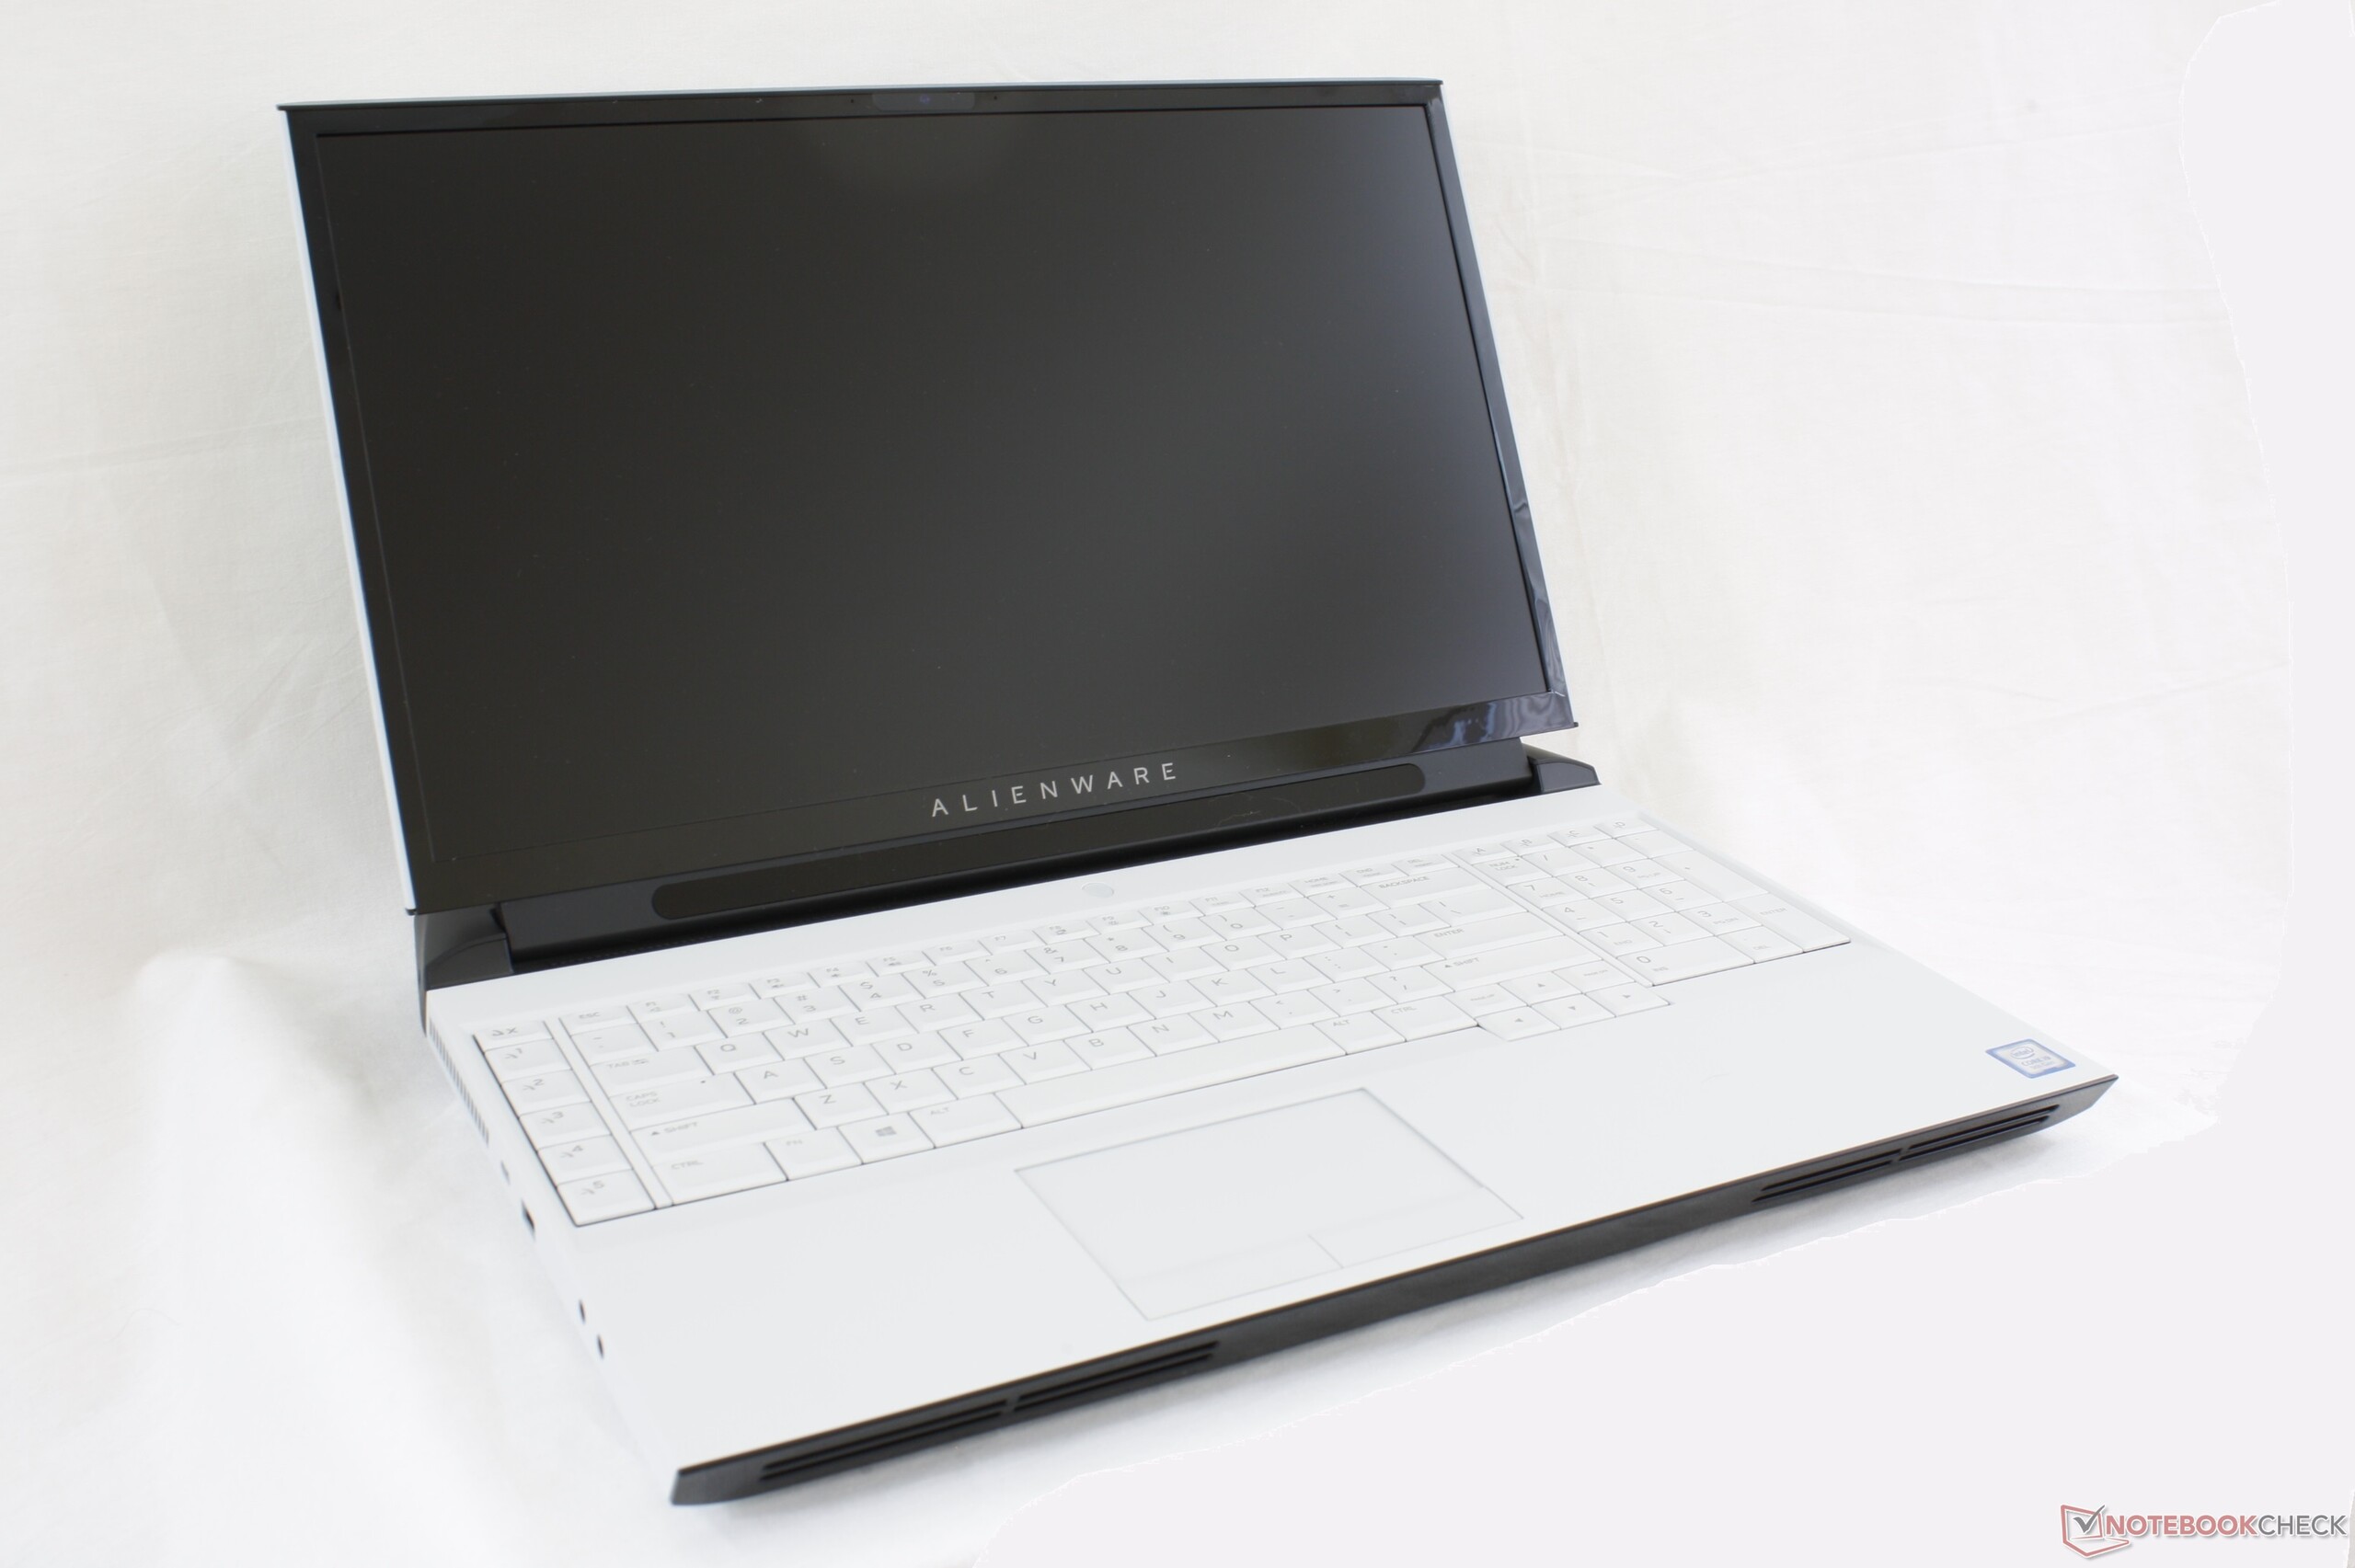
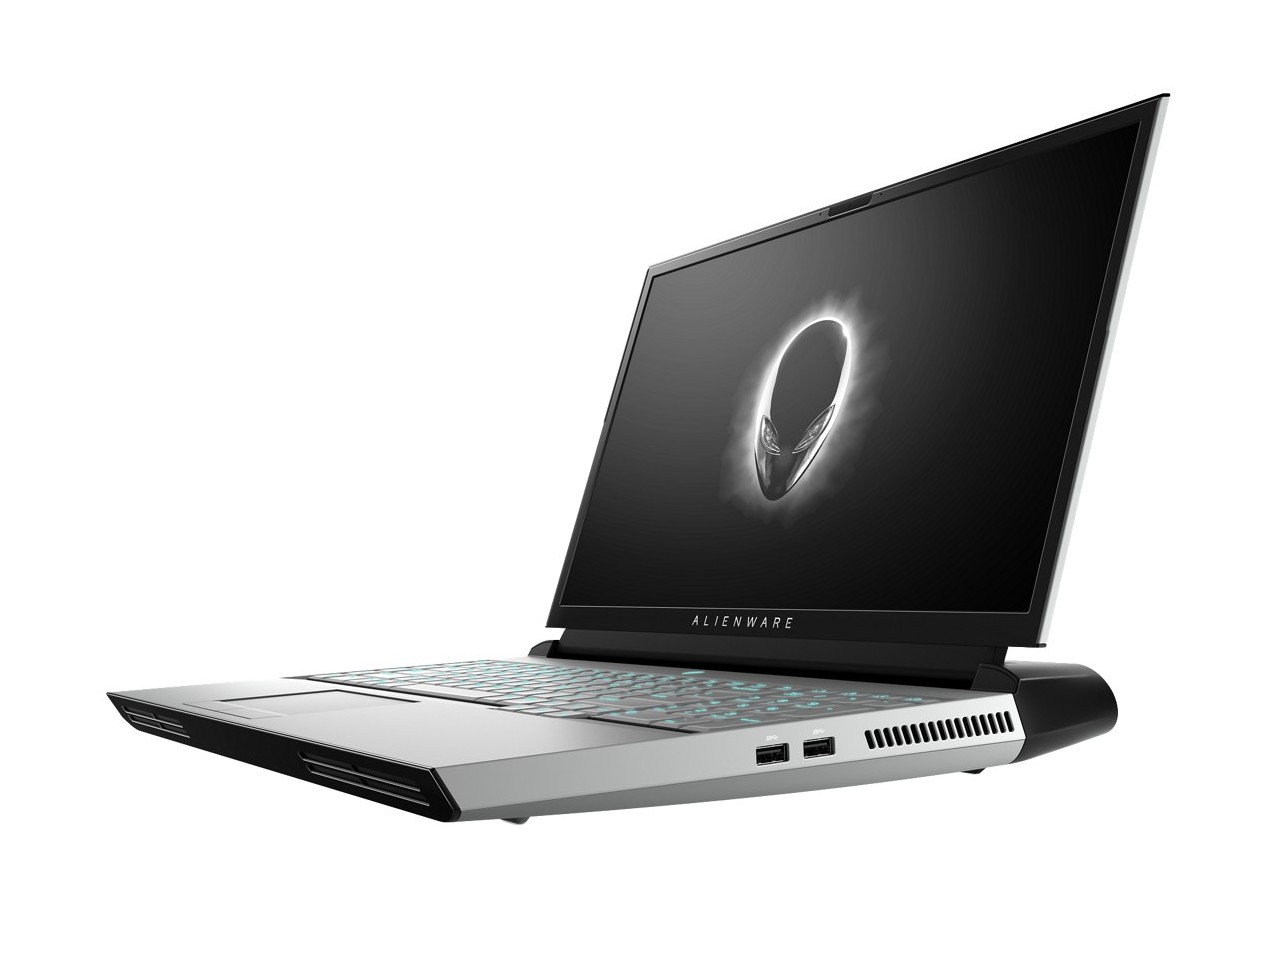
Breve Análise do Portátil Alienware Area-51m (i9-9900K, RTX 2080)
| Networking | |
| iperf3 transmit AX12 | |
| Asus ROG G703GX | |
| MSI GT75 8RG-090 Titan | |
| Alienware Area-51m i9-9900K RTX 2080 | |
| Alienware 17 R5 | |
| iperf3 receive AX12 | |
| MSI GT75 8RG-090 Titan | |
| Asus ROG G703GX | |
| Alienware 17 R5 | |
| Alienware Area-51m i9-9900K RTX 2080 | |
| |||||||||||||||||||||||||
iluminação: 82 %
iluminação com acumulador: 355.2 cd/m²
Contraste: 508:1 (Preto: 0.66 cd/m²)
ΔE ColorChecker Calman: 2.02 | ∀{0.5-29.43 Ø4.72}
calibrated: 1.17
ΔE Greyscale Calman: 3.2 | ∀{0.09-98 Ø4.97}
96.9% sRGB (Argyll 1.6.3 3D)
61.3% AdobeRGB 1998 (Argyll 1.6.3 3D)
66.5% AdobeRGB 1998 (Argyll 3D)
96.9% sRGB (Argyll 3D)
66.3% Display P3 (Argyll 3D)
Gamma: 2.16
CCT: 6746 K
| Alienware Area-51m i9-9900K RTX 2080 LG Philips 173WFG, IPS, 17.3", 1920x1080 | MSI GT75 8RG-090 Titan CMN N173HHE-G32 (CMN1747), TN, 17.3", 1920x1080 | Asus ROG G703GX AU Optronics B173HAN03.2 (AUO329D), IPS, 17.3", 1920x1080 | Eurocom Sky X7C i9-9900K AU Optronics B173HAN03.1, IPS, 17.3", 1920x1080 | Razer Blade Pro 2017 Sharp LQ173D1JW33 (SHP145A), IGZO, 17.3", 3840x2160 | Alienware 17 R5 JYWWF_B173QTN (AUO1496), TN, 17.3", 2560x1440 | |
|---|---|---|---|---|---|---|
| Display | 23% | -3% | -4% | 29% | -7% | |
| Display P3 Coverage (%) | 66.3 | 90.9 37% | 64.1 -3% | 64.7 -2% | 88.9 34% | 63.4 -4% |
| sRGB Coverage (%) | 96.9 | 100 3% | 93.3 -4% | 89.1 -8% | 100 3% | 86.1 -11% |
| AdobeRGB 1998 Coverage (%) | 66.5 | 86.2 30% | 65.6 -1% | 65.2 -2% | 99.7 50% | 62.9 -5% |
| Response Times | 44% | 28% | -18% | -309% | -7% | |
| Response Time Grey 50% / Grey 80% * (ms) | 13.2 ? | 8 ? 39% | 7.2 ? 45% | 18 ? -36% | 60.8 ? -361% | 20.8 ? -58% |
| Response Time Black / White * (ms) | 10.8 ? | 5.6 ? 48% | 9.6 ? 11% | 10.8 ? -0% | 38.4 ? -256% | 6 ? 44% |
| PWM Frequency (Hz) | 26000 ? | 204.9 ? | ||||
| Screen | 19% | -9% | -18% | -8% | -27% | |
| Brightness middle (cd/m²) | 335.2 | 240 -28% | 296 -12% | 276.1 -18% | 230 -31% | 398 19% |
| Brightness (cd/m²) | 297 | 248 -16% | 279 -6% | 260 -12% | 207 -30% | 367 24% |
| Brightness Distribution (%) | 82 | 83 1% | 85 4% | 85 4% | 83 1% | 86 5% |
| Black Level * (cd/m²) | 0.66 | 0.22 67% | 0.25 62% | 0.36 45% | 0.2 70% | 0.51 23% |
| Contrast (:1) | 508 | 1091 115% | 1184 133% | 767 51% | 1150 126% | 780 54% |
| Colorchecker dE 2000 * | 2.02 | 2.14 -6% | 4.77 -136% | 3.51 -74% | 5.62 -178% | 5.45 -170% |
| Colorchecker dE 2000 max. * | 7.23 | 5.04 30% | 9.08 -26% | 6.84 5% | 10.24 -42% | 10.36 -43% |
| Colorchecker dE 2000 calibrated * | 1.17 | 1.54 -32% | 1.46 -25% | 3.56 -204% | 2.56 -119% | |
| Greyscale dE 2000 * | 3.2 | 1.62 49% | 5.83 -82% | 2.7 16% | 4.54 -42% | 5.4 -69% |
| Gamma | 2.16 102% | 2.28 96% | 2.47 89% | 2.28 96% | 2.36 93% | 2.4 92% |
| CCT | 6746 96% | 6846 95% | 8076 80% | 6947 94% | 6625 98% | 7453 87% |
| Color Space (Percent of AdobeRGB 1998) (%) | 61.3 | 77 26% | 60 -2% | 57.8 -6% | 88 44% | 56 -9% |
| Color Space (Percent of sRGB) (%) | 96.9 | 100 3% | 93 -4% | 88.8 -8% | 100 3% | 86 -11% |
| Média Total (Programa/Configurações) | 29% /
23% | 5% /
-3% | -13% /
-16% | -96% /
-41% | -14% /
-21% |
* ... menor é melhor
Exibir tempos de resposta
| ↔ Tempo de resposta preto para branco | ||
|---|---|---|
| 10.8 ms ... ascensão ↗ e queda ↘ combinadas | ↗ 6 ms ascensão | 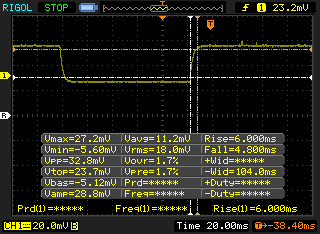 |
| ↘ 4.8 ms queda | ||
| A tela mostra boas taxas de resposta em nossos testes, mas pode ser muito lenta para jogadores competitivos. Em comparação, todos os dispositivos testados variam de 0.1 (mínimo) a 240 (máximo) ms. » 29 % de todos os dispositivos são melhores. Isso significa que o tempo de resposta medido é melhor que a média de todos os dispositivos testados (19.8 ms). | ||
| ↔ Tempo de resposta 50% cinza a 80% cinza | ||
| 13.2 ms ... ascensão ↗ e queda ↘ combinadas | ↗ 8 ms ascensão | 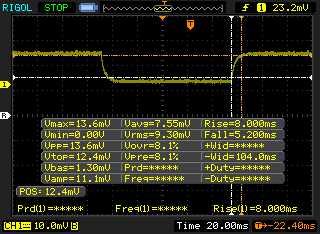 |
| ↘ 5.2 ms queda | ||
| A tela mostra boas taxas de resposta em nossos testes, mas pode ser muito lenta para jogadores competitivos. Em comparação, todos os dispositivos testados variam de 0.165 (mínimo) a 636 (máximo) ms. » 27 % de todos os dispositivos são melhores. Isso significa que o tempo de resposta medido é melhor que a média de todos os dispositivos testados (31 ms). | ||
Cintilação da tela / PWM (modulação por largura de pulso)
| Tela tremeluzindo / PWM não detectado | 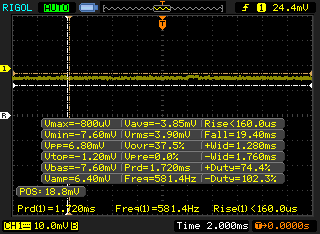 | ||
[pwm_comparison] Em comparação: 52 % de todos os dispositivos testados não usam PWM para escurecer a tela. Se PWM foi detectado, uma média de 7763 (mínimo: 5 - máximo: 343500) Hz foi medida. | |||
| Cinebench R15 | |
| CPU Single 64Bit | |
| Notebookcheck Desktop PC 2018 | |
| Média Intel Core i9-9900K (203 - 218, n=9) | |
| Alienware Area-51m i9-9900K RTX 2080 | |
| MSI GT75 8RG-090 Titan | |
| Eurocom Sky X9C | |
| AMD Threadripper 2970WX, AMD Radeon RX Vega 64 | |
| Alienware 17 R5 | |
| Dell G3 17 3779 | |
| Alienware 15 R3 | |
| Razer Blade Pro 2017 | |
| Asus GL702ZC-GC104T | |
| CPU Multi 64Bit | |
| AMD Threadripper 2970WX, AMD Radeon RX Vega 64 | |
| Notebookcheck Desktop PC 2018 | |
| Alienware Area-51m i9-9900K RTX 2080 | |
| Média Intel Core i9-9900K (1623 - 2040, n=9) | |
| Asus GL702ZC-GC104T | |
| MSI GT75 8RG-090 Titan | |
| Eurocom Sky X9C | |
| Alienware 17 R5 | |
| Dell G3 17 3779 | |
| Razer Blade Pro 2017 | |
| Alienware 15 R3 | |
| Cinebench R11.5 | |
| CPU Single 64Bit | |
| Média Intel Core i9-9900K (2.33 - 2.44, n=5) | |
| MSI GT75 8RG-090 Titan | |
| Eurocom Sky X9C | |
| Alienware 17 R5 | |
| Dell G3 17 3779 | |
| AMD Threadripper 2970WX, AMD Radeon RX Vega 64 | |
| Alienware 15 R3 | |
| Razer Blade Pro 2017 | |
| Asus GL702ZC-GC104T | |
| CPU Multi 64Bit | |
| AMD Threadripper 2970WX, AMD Radeon RX Vega 64 | |
| Média Intel Core i9-9900K (17.4 - 21.8, n=5) | |
| Asus GL702ZC-GC104T | |
| MSI GT75 8RG-090 Titan | |
| Eurocom Sky X9C | |
| Alienware 17 R5 | |
| Dell G3 17 3779 | |
| Razer Blade Pro 2017 | |
| Alienware 15 R3 | |
| Cinebench R10 | |
| Rendering Multiple CPUs 32Bit | |
| Média Intel Core i9-9900K (36683 - 49142, n=4) | |
| Eurocom Sky X9C | |
| AMD Threadripper 2970WX, AMD Radeon RX Vega 64 | |
| Asus GL702ZC-GC104T | |
| Dell G3 17 3779 | |
| Rendering Single 32Bit | |
| Média Intel Core i9-9900K (7786 - 8042, n=4) | |
| Eurocom Sky X9C | |
| Dell G3 17 3779 | |
| AMD Threadripper 2970WX, AMD Radeon RX Vega 64 | |
| Asus GL702ZC-GC104T | |
| wPrime 2.10 - 1024m | |
| Eurocom Sky X9C | |
| Média Intel Core i9-9900K (85.6 - 98.7, n=3) | |
| AMD Threadripper 2970WX, AMD Radeon RX Vega 64 | |
* ... menor é melhor
| PCMark 10 | |
| Score | |
| Eurocom Sky X7C i9-9900K | |
| Intel Core i9-9900K, AMD Radeon RX Vega 64 | |
| Alienware Area-51m i9-9900K RTX 2080 | |
| MSI GT75 8RG-090 Titan | |
| Asus ROG G703GX | |
| Alienware 17 R5 | |
| Razer Blade Pro 2017 | |
| Essentials | |
| Eurocom Sky X7C i9-9900K | |
| Alienware Area-51m i9-9900K RTX 2080 | |
| Intel Core i9-9900K, AMD Radeon RX Vega 64 | |
| MSI GT75 8RG-090 Titan | |
| Asus ROG G703GX | |
| Alienware 17 R5 | |
| Razer Blade Pro 2017 | |
| Productivity | |
| Intel Core i9-9900K, AMD Radeon RX Vega 64 | |
| MSI GT75 8RG-090 Titan | |
| Eurocom Sky X7C i9-9900K | |
| Alienware Area-51m i9-9900K RTX 2080 | |
| Asus ROG G703GX | |
| Alienware 17 R5 | |
| Razer Blade Pro 2017 | |
| Digital Content Creation | |
| Eurocom Sky X7C i9-9900K | |
| Alienware Area-51m i9-9900K RTX 2080 | |
| Intel Core i9-9900K, AMD Radeon RX Vega 64 | |
| MSI GT75 8RG-090 Titan | |
| Asus ROG G703GX | |
| Alienware 17 R5 | |
| Razer Blade Pro 2017 | |
| PCMark 8 | |
| Home Score Accelerated v2 | |
| MSI GT75 8RG-090 Titan | |
| Eurocom Sky X7C i9-9900K | |
| Alienware Area-51m i9-9900K RTX 2080 | |
| Intel Core i9-9900K, AMD Radeon RX Vega 64 | |
| Asus ROG G703GX | |
| Razer Blade Pro 2017 | |
| Work Score Accelerated v2 | |
| Eurocom Sky X7C i9-9900K | |
| Alienware Area-51m i9-9900K RTX 2080 | |
| Intel Core i9-9900K, AMD Radeon RX Vega 64 | |
| MSI GT75 8RG-090 Titan | |
| Asus ROG G703GX | |
| Razer Blade Pro 2017 | |
| PCMark 8 Home Score Accelerated v2 | 5607 pontos | |
| PCMark 8 Work Score Accelerated v2 | 6140 pontos | |
| PCMark 10 Score | 7006 pontos | |
Ajuda | ||
| Alienware Area-51m i9-9900K RTX 2080 2x SK Hynix PC400 512GB (RAID 0) | MSI GT75 8RG-090 Titan 2x Samsung PM961 MZVLW256HEHP (RAID 0) | Asus ROG G703GX Samsung SSD PM981 MZVLB512HAJQ | Eurocom Sky X7C i9-9900K 2x Samsung SSD 970 Pro 512GB (RAID 0) | Razer Blade Pro 2017 2x Samsung SSD PM951 MZVLV256HCHP (RAID 0) | |
|---|---|---|---|---|---|
| AS SSD | 11% | 4% | 20% | -11% | |
| Seq Read (MB/s) | 2082 | 3058 47% | 1632 -22% | 2323 12% | 2599 25% |
| Seq Write (MB/s) | 2335 | 2196 -6% | 1767 -24% | 2887 24% | 588 -75% |
| 4K Read (MB/s) | 24.14 | 38.37 59% | 50.4 109% | 30.51 26% | 37.57 56% |
| 4K Write (MB/s) | 91.8 | 97.7 6% | 101.9 11% | 131.8 44% | 104.4 14% |
| 4K-64 Read (MB/s) | 1561 | 1347 -14% | 1196 -23% | 1507 -3% | 1116 -29% |
| 4K-64 Write (MB/s) | 1350 | 1236 -8% | 1631 21% | 1483 10% | 513 -62% |
| Access Time Read * (ms) | 0.121 | 0.056 54% | 0.061 50% | 0.032 74% | 0.051 58% |
| Access Time Write * (ms) | 0.039 | 0.038 3% | 0.037 5% | 0.028 28% | 0.036 8% |
| Score Read (Points) | 1793 | 1691 -6% | 1410 -21% | 1770 -1% | 1414 -21% |
| Score Write (Points) | 1675 | 1553 -7% | 1910 14% | 1904 14% | 676 -60% |
| Score Total (Points) | 4390 | 4066 -7% | 4057 -8% | 4602 5% | 2715 -38% |
| Copy ISO MB/s (MB/s) | 2175 | 2048 -6% | 3044 40% | ||
| Copy Program MB/s (MB/s) | 582 | 428.5 -26% | 574 -1% | ||
| Copy Game MB/s (MB/s) | 1479 | 1173 -21% | 1489 1% |
* ... menor é melhor

| 3DMark 11 | |
| 1280x720 Performance GPU | |
| Eurocom Sky X9C | |
| Asus ROG Strix RTX 2080 OC | |
| Alienware Area-51m i9-9900K RTX 2080 | |
| 1200 Nvidia GeForce GTX 1080 Ti FE Asus Prime B350-PLUS | |
| Média NVIDIA GeForce RTX 2080 Mobile (31826 - 38809, n=17) | |
| Eurocom Sky X7C i9-9900K | |
| Notebookcheck Desktop PC 2018 | |
| Asus Zephyrus S GX701GX | |
| MSI GT75 8RG-090 Titan | |
| MSI GE75 8SF | |
| Razer Blade Pro 2017 | |
| Alienware 17 R5 | |
| Asus GL702ZC-GC104T | |
| Dell G3 17 3779 | |
| 1280x720 Performance Combined | |
| Eurocom Sky X7C i9-9900K | |
| Alienware Area-51m i9-9900K RTX 2080 | |
| Notebookcheck Desktop PC 2018 | |
| Média NVIDIA GeForce RTX 2080 Mobile (9038 - 18934, n=17) | |
| Eurocom Sky X9C | |
| MSI GT75 8RG-090 Titan | |
| Asus ROG Strix RTX 2080 OC | |
| Asus Zephyrus S GX701GX | |
| Alienware 17 R5 | |
| Razer Blade Pro 2017 | |
| Asus GL702ZC-GC104T | |
| MSI GE75 8SF | |
| Dell G3 17 3779 | |
| 1200 Nvidia GeForce GTX 1080 Ti FE Asus Prime B350-PLUS | |
| 3DMark 11 Performance | 29759 pontos | |
| 3DMark Cloud Gate Standard Score | 59224 pontos | |
| 3DMark Fire Strike Score | 23195 pontos | |
| 3DMark Time Spy Score | 10704 pontos | |
Ajuda | ||
| Metro Exodus - 1920x1080 Ultra Quality AF:16x | |
| Alienware Area-51m i9-9900K RTX 2080 | |
| MSI RTX 2080 Gaming X Trio | |
| MSI GeForce GTX 1080 | |
| Schenker XMG Neo 17 | |
| MSI RTX 2060 Gaming Z 6G | |
| i7-7740X Asus X299 Prime | |
| Acer Predator Triton 700 | |
| Gigabyte Aero 15-Y9 | |
| Schenker XMG Neo 15 Turing | |
| The Witcher 3 - 1920x1080 Ultra Graphics & Postprocessing (HBAO+) | |
| MSI RTX 2080 Gaming X Trio | |
| Alienware Area-51m i9-9900K RTX 2080 | |
| Schenker XMG Neo 17 | |
| MSI RTX 2060 Gaming Z 6G | |
| Gigabyte Aero 15-Y9 | |
| Schenker XMG Neo 15 Turing | |
| baixo | média | alto | ultra | |
|---|---|---|---|---|
| BioShock Infinite (2013) | 447.6 | 380.6 | 348 | 213.4 |
| The Witcher 3 (2015) | 382.5 | 273.3 | 194.4 | 101.1 |
| Rise of the Tomb Raider (2016) | 317 | 224.3 | 188.8 | 158.8 |
| Shadow of the Tomb Raider (2018) | 171 | 140 | 134 | 123 |
| Metro Exodus (2019) | 165 | 120.1 | 91.5 | 76.1 |
| Alienware Area-51m i9-9900K RTX 2080 GeForce RTX 2080 Mobile, i9-9900K, 2x SK Hynix PC400 512GB (RAID 0) | MSI GT75 8RG-090 Titan GeForce GTX 1080 Mobile, i9-8950HK, 2x Samsung PM961 MZVLW256HEHP (RAID 0) | Asus ROG G703GX GeForce RTX 2080 Mobile, i7-8750H, Samsung SSD PM981 MZVLB512HAJQ | Eurocom Sky X7C i9-9900K GeForce RTX 2080 Mobile, i9-9900K, 2x Samsung SSD 970 Pro 512GB (RAID 0) | HP Omen X 17-ap002ng GeForce GTX 1080 Mobile, i7-7820HK | Razer Blade Pro 2017 GeForce GTX 1080 Mobile, i7-7820HK, 2x Samsung SSD PM951 MZVLV256HCHP (RAID 0) | |
|---|---|---|---|---|---|---|
| Noise | -4% | -1% | 7% | 7% | 1% | |
| desligado / ambiente * (dB) | 28.1 | 30 -7% | 30 -7% | 28.9 -3% | 30 -7% | 30 -7% |
| Idle Minimum * (dB) | 28.1 | 32 -14% | 30 -7% | 29.7 -6% | 31.6 -12% | 30 -7% |
| Idle Average * (dB) | 28.6 | 34 -19% | 35 -22% | 29.7 -4% | 31.6 -10% | 31 -8% |
| Idle Maximum * (dB) | 51 | 37 27% | 41 20% | 30 41% | 31.7 38% | 33 35% |
| Load Average * (dB) | 51 | 43 16% | 44 14% | 36.5 28% | 38.4 25% | 43 16% |
| Witcher 3 ultra * (dB) | 51 | 57 -12% | 51 -0% | 49 4% | 47.2 7% | 55 -8% |
| Load Maximum * (dB) | 51 | 62 -22% | 52 -2% | 57 -12% | 48.1 6% | 58 -14% |
* ... menor é melhor
Barulho
| Ocioso |
| 28.1 / 28.6 / 51 dB |
| Carga |
| 51 / 51 dB |
 | ||
30 dB silencioso 40 dB(A) audível 50 dB(A) ruidosamente alto |
||
min: | ||
(-) A temperatura máxima no lado superior é 47 °C / 117 F, em comparação com a média de 40.4 °C / 105 F , variando de 21.2 a 68.8 °C para a classe Gaming.
(-) A parte inferior aquece até um máximo de 58.8 °C / 138 F, em comparação com a média de 43.2 °C / 110 F
(+) Em uso inativo, a temperatura média para o lado superior é 27.8 °C / 82 F, em comparação com a média do dispositivo de 33.9 °C / ### class_avg_f### F.
(±) Jogando The Witcher 3, a temperatura média para o lado superior é 35.3 °C / 96 F, em comparação com a média do dispositivo de 33.9 °C / ## #class_avg_f### F.
(+) Os apoios para as mãos e o touchpad estão atingindo a temperatura máxima da pele (32 °C / 89.6 F) e, portanto, não estão quentes.
(-) A temperatura média da área do apoio para as mãos de dispositivos semelhantes foi 28.8 °C / 83.8 F (-3.2 °C / -5.8 F).
Alienware Area-51m i9-9900K RTX 2080 análise de áudio
(+) | os alto-falantes podem tocar relativamente alto (###valor### dB)
Graves 100 - 315Hz
(±) | graves reduzidos - em média 11% menor que a mediana
(±) | a linearidade dos graves é média (14.5% delta para a frequência anterior)
Médios 400 - 2.000 Hz
(+) | médios equilibrados - apenas 3.4% longe da mediana
(±) | a linearidade dos médios é média (7.8% delta para frequência anterior)
Altos 2 - 16 kHz
(+) | agudos equilibrados - apenas 2.8% longe da mediana
(±) | a linearidade dos máximos é média (9.4% delta para frequência anterior)
Geral 100 - 16.000 Hz
(+) | o som geral é linear (11.9% diferença em relação à mediana)
Comparado com a mesma classe
» 12% de todos os dispositivos testados nesta classe foram melhores, 4% semelhantes, 84% piores
» O melhor teve um delta de 6%, a média foi 18%, o pior foi 132%
Comparado com todos os dispositivos testados
» 9% de todos os dispositivos testados foram melhores, 2% semelhantes, 89% piores
» O melhor teve um delta de 4%, a média foi 24%, o pior foi 134%
Apple MacBook 12 (Early 2016) 1.1 GHz análise de áudio
(+) | os alto-falantes podem tocar relativamente alto (###valor### dB)
Graves 100 - 315Hz
(±) | graves reduzidos - em média 11.3% menor que a mediana
(±) | a linearidade dos graves é média (14.2% delta para a frequência anterior)
Médios 400 - 2.000 Hz
(+) | médios equilibrados - apenas 2.4% longe da mediana
(+) | médios são lineares (5.5% delta para frequência anterior)
Altos 2 - 16 kHz
(+) | agudos equilibrados - apenas 2% longe da mediana
(+) | os máximos são lineares (4.5% delta da frequência anterior)
Geral 100 - 16.000 Hz
(+) | o som geral é linear (10.2% diferença em relação à mediana)
Comparado com a mesma classe
» 7% de todos os dispositivos testados nesta classe foram melhores, 2% semelhantes, 91% piores
» O melhor teve um delta de 5%, a média foi 18%, o pior foi 53%
Comparado com todos os dispositivos testados
» 5% de todos os dispositivos testados foram melhores, 1% semelhantes, 94% piores
» O melhor teve um delta de 4%, a média foi 24%, o pior foi 134%
| desligado | |
| Ocioso | |
| Carga |
|
Key:
min: | |
| Alienware Area-51m i9-9900K RTX 2080 i9-9900K, GeForce RTX 2080 Mobile, 2x SK Hynix PC400 512GB (RAID 0), IPS, 1920x1080, 17.3" | MSI GT75 8RG-090 Titan i9-8950HK, GeForce GTX 1080 Mobile, 2x Samsung PM961 MZVLW256HEHP (RAID 0), TN, 1920x1080, 17.3" | Asus ROG G703GX i7-8750H, GeForce RTX 2080 Mobile, Samsung SSD PM981 MZVLB512HAJQ, IPS, 1920x1080, 17.3" | Eurocom Sky X7C i9-9900K i9-9900K, GeForce RTX 2080 Mobile, 2x Samsung SSD 970 Pro 512GB (RAID 0), IPS, 1920x1080, 17.3" | Razer Blade Pro 2017 i7-7820HK, GeForce GTX 1080 Mobile, 2x Samsung SSD PM951 MZVLV256HCHP (RAID 0), IGZO, 3840x2160, 17.3" | Alienware 17 R5 i7-8750H, GeForce GTX 1070 Mobile, SK hynix PC401 HFS256GD9TNG, TN, 2560x1440, 17.3" | |
|---|---|---|---|---|---|---|
| Power Consumption | -4% | 25% | -12% | 6% | 14% | |
| Idle Minimum * (Watt) | 23.3 | 31 -33% | 5 79% | 41.3 -77% | 31 -33% | 28 -20% |
| Idle Average * (Watt) | 33.5 | 35 -4% | 24 28% | 41.8 -25% | 36 -7% | 32 4% |
| Idle Maximum * (Watt) | 38.4 | 45 -17% | 42 -9% | 46.1 -20% | 44 -15% | 37 4% |
| Load Average * (Watt) | 114.1 | 130 -14% | 112 2% | 116.6 -2% | 107 6% | 112 2% |
| Witcher 3 ultra * (Watt) | 339.5 | 268 21% | 284 16% | 245.9 28% | 212 38% | 192 43% |
| Load Maximum * (Watt) | 485.1 | 374 23% | 320 34% | 352.6 27% | 258 47% | 231 52% |
* ... menor é melhor
| Alienware Area-51m i9-9900K RTX 2080 i9-9900K, GeForce RTX 2080 Mobile, 90 Wh | MSI GT75 8RG-090 Titan i9-8950HK, GeForce GTX 1080 Mobile, 75 Wh | Asus ROG G703GX i7-8750H, GeForce RTX 2080 Mobile, 96 Wh | Eurocom Sky X7C i9-9900K i9-9900K, GeForce RTX 2080 Mobile, 82 Wh | Razer Blade Pro 2017 i7-7820HK, GeForce GTX 1080 Mobile, 99 Wh | Alienware 17 R5 i7-8750H, GeForce GTX 1070 Mobile, 99 Wh | |
|---|---|---|---|---|---|---|
| Duração da bateria | 23% | 67% | -5% | 49% | 48% | |
| Reader / Idle (h) | 2.6 | 3.8 46% | 5 92% | 4.2 62% | 4.5 73% | |
| WiFi v1.3 (h) | 2.1 | 4 90% | 2 -5% | 3.3 57% | 3.6 71% | |
| Load (h) | 1.1 | 1.1 0% | 1.3 18% | 1.4 27% | 1.1 0% |
Pro
Contra
Do ponto de vista “geração a geração”, o Area-51m é um respeitável sucessor do Alienware 17 R5. Ele mantém o que amamos do modelo antigo (teclado chanfrado, design robusto, fácil manutenção) enquanto atualiza vários aspectos que consideramos mais necessários (resfriamento mais potente, marcos mais estreitos, desempenho mais rápido). A duração da bateria é ruim, mas se essa for uma prioridade real, sugerimos que você dê uma olhada no Alienware m17.
Não é uma surpresa que o desempenho seja o verdadeiro destaque do portátil. O fato de a máquina esteja apenas a meros pontos percentuais por trás de nossa referência interna de PC de desktop é impressionante por si só. O ruído do ventilador durante os jogos permanece quase idêntico ao do Alienware 17 R5, o que é bom, considerando o enorme aumento no desempenho, mas também é uma decepção para aqueles que esperavam por uma máquina mais silenciosa.
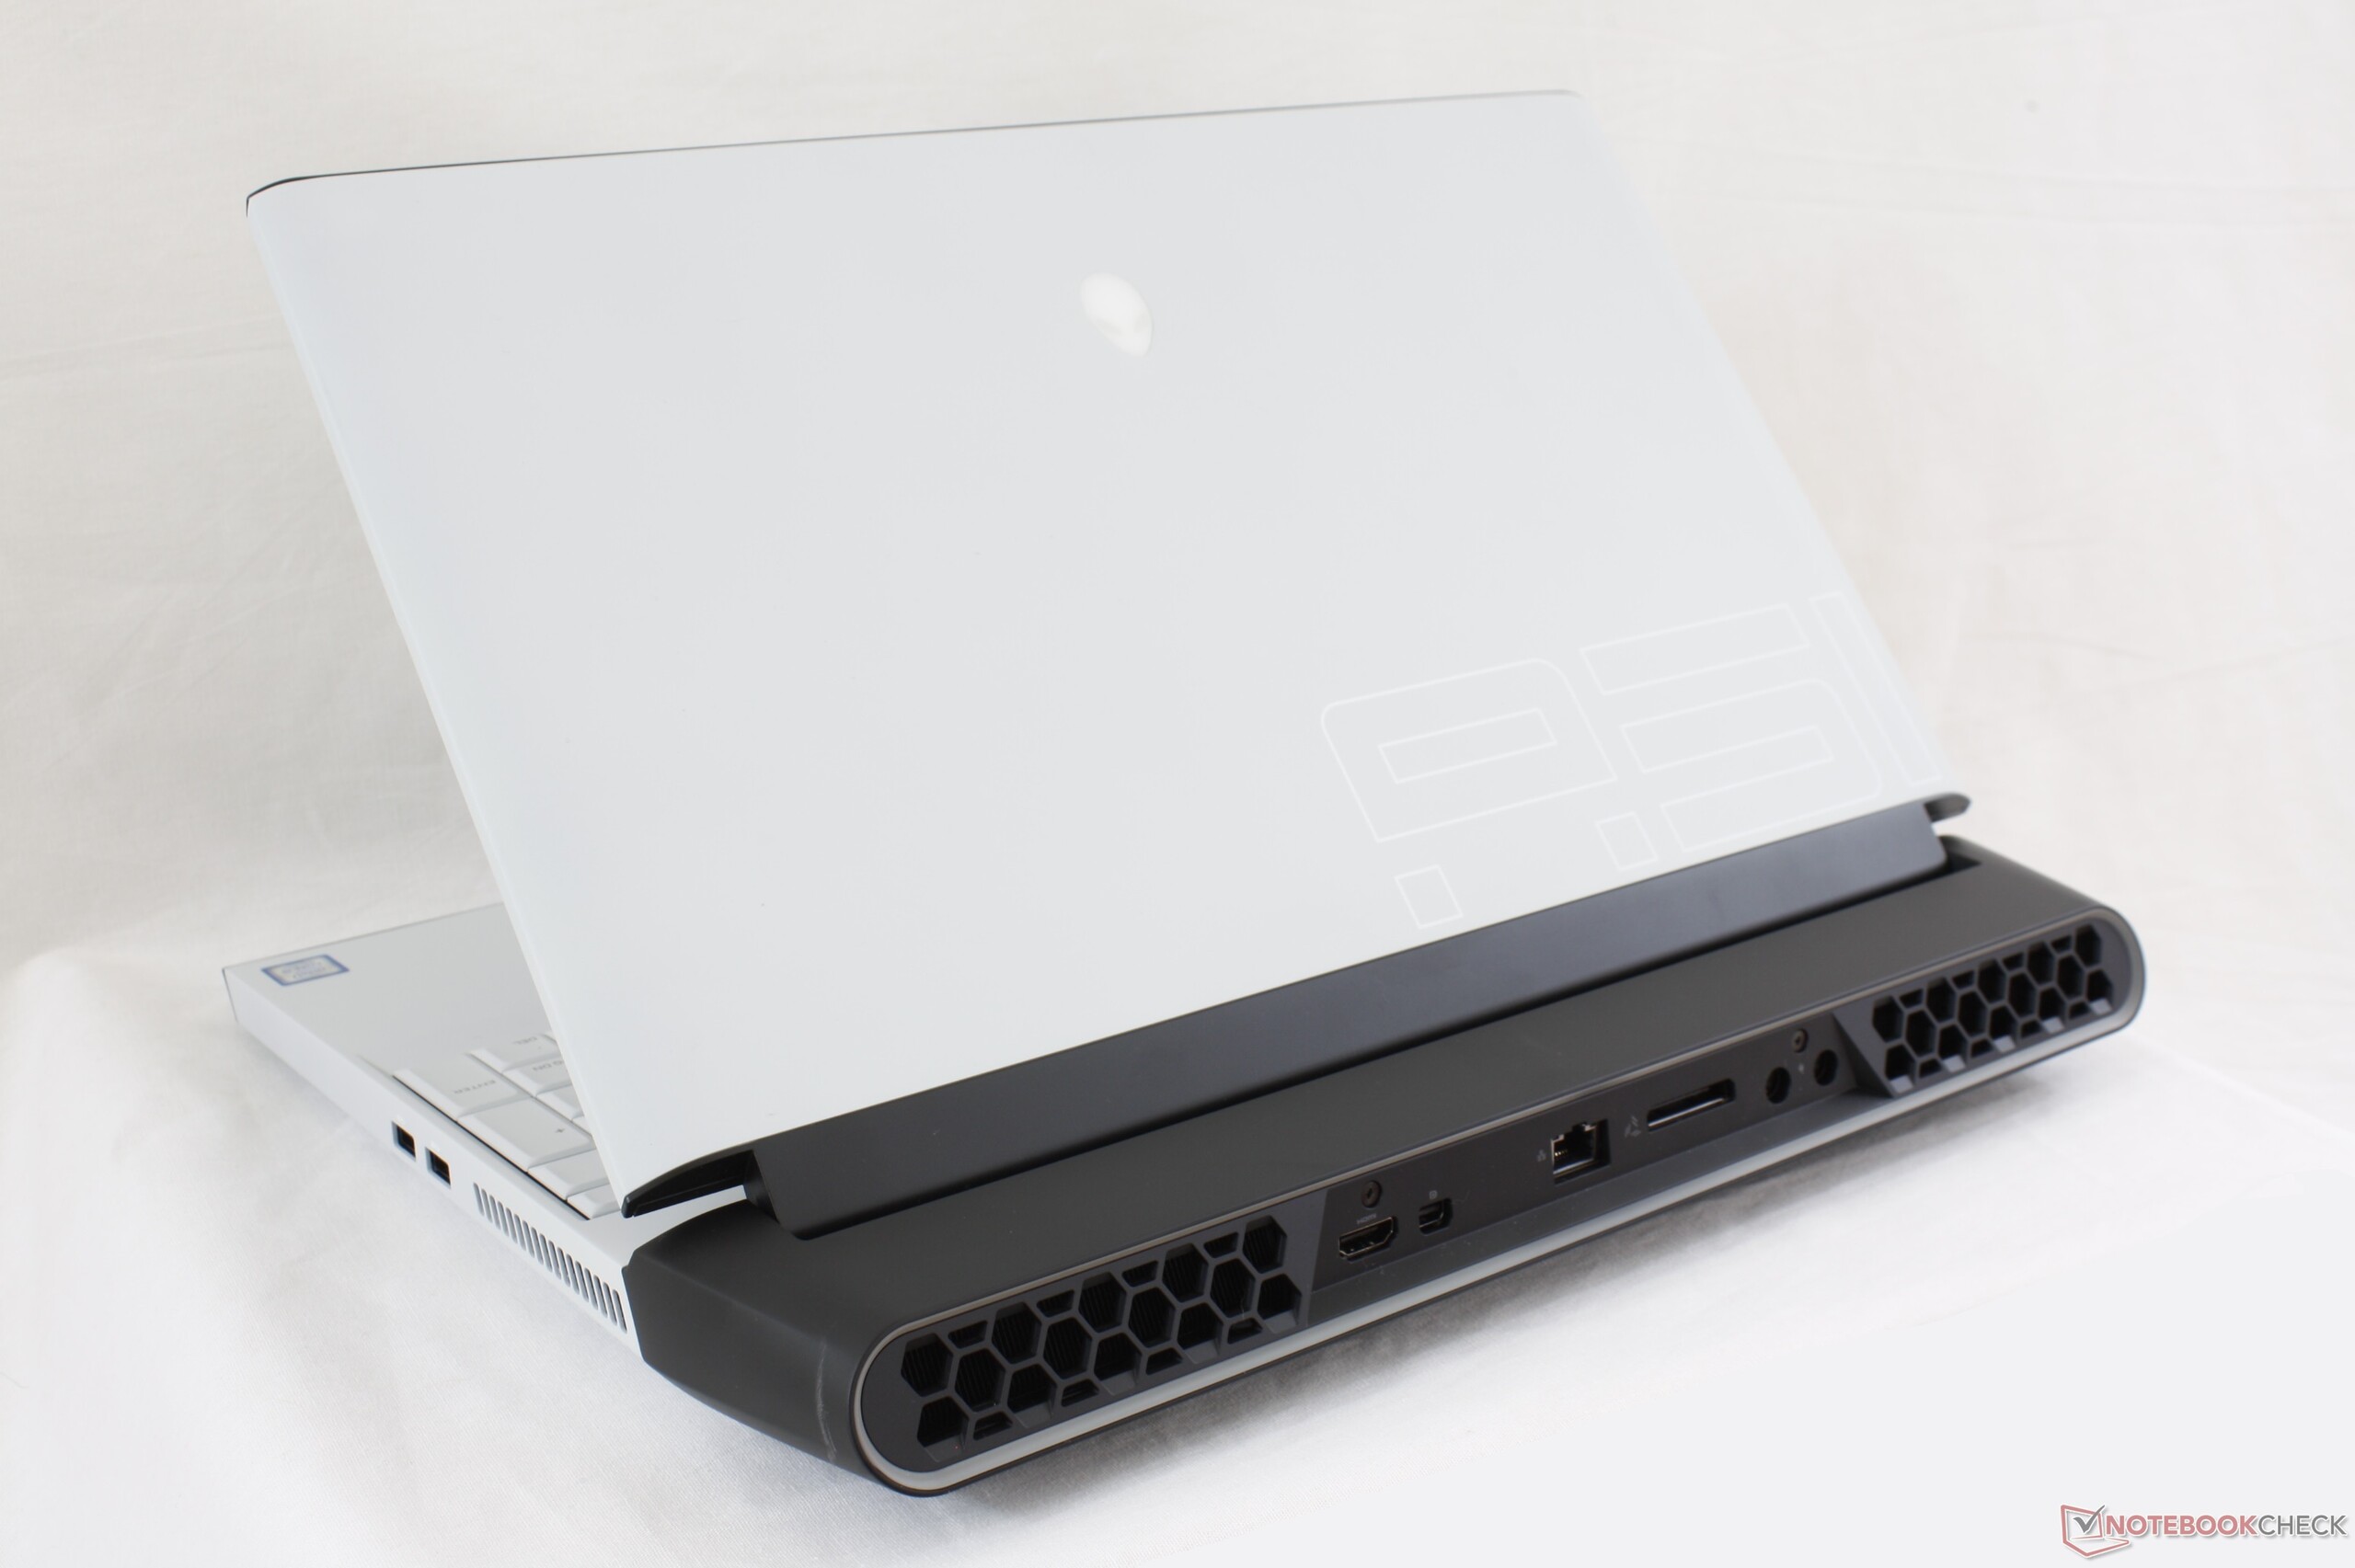
O que torna a Área-51m tão especial também parece ser responsável por suas principais desvantagens. A placa de vídeo DGFF atualizável e supostamente preparada para o futuro, por exemplo, é um conceito muito genial. Até que um sucessor RTX 2080 chegue, no entanto, se sente quase experimental na atualidade. Em segundo lugar, o salto para um Core i9-9900K de 95+ W certamente aumenta o desempenho da CPU em relação à tradicional solução Coffee Lake-H de 45 w, mas nos prejudica ver as temperaturas do núcleo de 99+ C em plena utilização.
Embora essas altos temperaturas não sejam intrinsecamente inseguras, achamos que não há uma desculpa para isso. O Eurocom Sky X7C aloja a mesma CPU Core i9 e ainda assim atinge 84 C quando submetido ao mesmo teste de estresse sem precisar limitar as velocidades.
Se o Clevo consegue, não há motivo para que a Dell também não consiga.
A próxima desvantagem é algo que não estávamos esperando. A relação de contraste não é tão profunda quanto no Alienware 17 R5 do ano passado ou o MSI GT75. Este pode ser um dos portáteis de jogos mais rápidos disponíveis, mas não tem a melhor tela em todas as frentes.
As desvantagens, embora aparentes, não diminuem o fato de que o Area-51m ainda é um grande salto em relação à envelhecida série Alienware 17. Se a Dell continuar com a rota da CPU e DGFF da estação de trabalho, esperamos ter uma ventoinha mais silenciosa e temperaturas mais baixas em futuras revisões.
Exagero da melhor maneira possível. Definitivamente há espaço para melhorias em relação às temperaturas do núcleo e ao ruído do ventilador quando comparado ao Eurocom Sky X7C. Mas como um sucessor do Alienware 17, ele atinge todas as notas certas para ser um forte substituto de desktop.
Alienware Area-51m i9-9900K RTX 2080
- 09/20/2019 v7 (old)
Allen Ngo
Price comparison
