Breve Análise do Portátil Lenovo ThinkPad X1 Extreme (i7, 4K-HDR, GTX 1050 Ti Max-Q)
| SD Card Reader | |
| average JPG Copy Test (av. of 3 runs) | |
| Lenovo ThinkPad X1 Carbon 2018-20KGS03900 (Toshiba Exceria Pro M501) | |
| Lenovo ThinkPad X1 Extreme-20MF000XGE (Toshiba Exceria Pro SDXC 64 GB UHS-II) | |
| Dell XPS 15 9570 i7 UHD (Toshiba Exceria Pro SDXC 64 GB UHS-II) | |
| HP EliteBook 1050 G1-4QY20EA (Toshiba Exceria Pro SDXC 64 GB UHS-II) | |
| Média da turma Multimedia (23 - 531, n=44, últimos 2 anos) | |
| Lenovo ThinkPad T580-20LAS01H00 (Toshiba Exceria Pro SDXC 64 GB UHS-II) | |
| maximum AS SSD Seq Read Test (1GB) | |
| Lenovo ThinkPad X1 Extreme-20MF000XGE (Toshiba Exceria Pro SDXC 64 GB UHS-II) | |
| Lenovo ThinkPad X1 Carbon 2018-20KGS03900 (Toshiba Exceria Pro M501) | |
| HP EliteBook 1050 G1-4QY20EA (Toshiba Exceria Pro SDXC 64 GB UHS-II) | |
| Dell XPS 15 9570 i7 UHD (Toshiba Exceria Pro SDXC 64 GB UHS-II) | |
| Média da turma Multimedia (27.9 - 1455, n=43, últimos 2 anos) | |
| Lenovo ThinkPad T580-20LAS01H00 (Toshiba Exceria Pro SDXC 64 GB UHS-II) | |
| |||||||||||||||||||||||||
iluminação: 90 %
iluminação com acumulador: 397 cd/m²
Contraste: 1414:1 (Preto: 0.28 cd/m²)
ΔE ColorChecker Calman: 4 | ∀{0.5-29.43 Ø4.72}
calibrated: 0.9
ΔE Greyscale Calman: 6.1 | ∀{0.09-98 Ø4.97}
100% sRGB (Argyll 1.6.3 3D)
88.5% AdobeRGB 1998 (Argyll 1.6.3 3D)
99.4% AdobeRGB 1998 (Argyll 3D)
100% sRGB (Argyll 3D)
86.3% Display P3 (Argyll 3D)
Gamma: 2.25
CCT: 7786 K
| Lenovo ThinkPad X1 Extreme-20MF000XGE B156ZAN03.2, , 3840x2160, 15.6" | Dell XPS 15 9570 i7 UHD LQ156D1, , 3840x2160, 15.6" | HP EliteBook 1050 G1-4QY20EA AUO30EB, , 3840x2160, 15.6" | Apple MacBook Pro 15 2018 (2.6 GHz, 560X) APPA040, , 2880x1800, 15.4" | Lenovo ThinkPad X1 Carbon 2018-20KGS03900 B140QAN02.0, , 2560x1440, 14" | Lenovo ThinkPad T580-20LAS01H00 NV156QUM-N44, , 3840x2160, 15.6" | |
|---|---|---|---|---|---|---|
| Display | -10% | -20% | 0% | 1% | -21% | |
| Display P3 Coverage (%) | 86.3 | 79.1 -8% | 67.8 -21% | 98.7 14% | 87.7 2% | 69.2 -20% |
| sRGB Coverage (%) | 100 | 98.8 -1% | 94.1 -6% | 99.9 0% | 100 0% | 90.7 -9% |
| AdobeRGB 1998 Coverage (%) | 99.4 | 79.2 -20% | 67.9 -32% | 86.6 -13% | 99.9 1% | 66.3 -33% |
| Response Times | 13% | 9% | 16% | -2% | 12% | |
| Response Time Grey 50% / Grey 80% * (ms) | 61.6 ? | 46.4 ? 25% | 56 ? 9% | 43.2 ? 30% | 59.2 ? 4% | 51.2 ? 17% |
| Response Time Black / White * (ms) | 32 ? | 32 ? -0% | 29 ? 9% | 31.2 ? 2% | 34.4 ? -8% | 29.6 ? 7% |
| PWM Frequency (Hz) | 980 ? | 117000 ? | 952 ? | |||
| Screen | -10% | -17% | 29% | 20% | -14% | |
| Brightness middle (cd/m²) | 396 | 494 25% | 440 11% | 520 31% | 578 46% | 310 -22% |
| Brightness (cd/m²) | 380 | 457 20% | 389 2% | 492 29% | 533 40% | 283 -26% |
| Brightness Distribution (%) | 90 | 88 -2% | 83 -8% | 88 -2% | 84 -7% | 87 -3% |
| Black Level * (cd/m²) | 0.28 | 0.34 -21% | 0.34 -21% | 0.39 -39% | 0.38 -36% | 0.24 14% |
| Contrast (:1) | 1414 | 1453 3% | 1294 -8% | 1333 -6% | 1521 8% | 1292 -9% |
| Colorchecker dE 2000 * | 4 | 5.2 -30% | 5.04 -26% | 1.2 70% | 1.9 52% | 3.1 22% |
| Colorchecker dE 2000 max. * | 7.6 | 17.5 -130% | 6.99 8% | 2.3 70% | 3.8 50% | 7.6 -0% |
| Colorchecker dE 2000 calibrated * | 0.9 | 2.04 -127% | 0.8 11% | 2.2 -144% | ||
| Greyscale dE 2000 * | 6.1 | 2.7 56% | 4.98 18% | 1.3 79% | 3 51% | 2.3 62% |
| Gamma | 2.25 98% | 2.1 105% | 2.48 89% | 2.18 101% | 2.14 103% | 2.21 100% |
| CCT | 7786 83% | 7038 92% | 7777 84% | 6738 96% | 6377 102% | 6876 95% |
| Color Space (Percent of AdobeRGB 1998) (%) | 88.5 | 71.2 -20% | 61 -31% | 88.8 0% | 59.1 -33% | |
| Color Space (Percent of sRGB) (%) | 100 | 98.8 -1% | 94 -6% | 100 0% | 90.1 -10% | |
| Média Total (Programa/Configurações) | -2% /
-7% | -9% /
-14% | 15% /
20% | 6% /
13% | -8% /
-12% |
* ... menor é melhor
Exibir tempos de resposta
| ↔ Tempo de resposta preto para branco | ||
|---|---|---|
| 32 ms ... ascensão ↗ e queda ↘ combinadas | ↗ 15.6 ms ascensão | 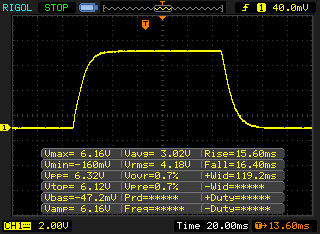 |
| ↘ 16.4 ms queda | ||
| A tela mostra taxas de resposta lentas em nossos testes e será insatisfatória para os jogadores. Em comparação, todos os dispositivos testados variam de 0.1 (mínimo) a 240 (máximo) ms. » 86 % de todos os dispositivos são melhores. Isso significa que o tempo de resposta medido é pior que a média de todos os dispositivos testados (19.8 ms). | ||
| ↔ Tempo de resposta 50% cinza a 80% cinza | ||
| 61.6 ms ... ascensão ↗ e queda ↘ combinadas | ↗ 30.8 ms ascensão | 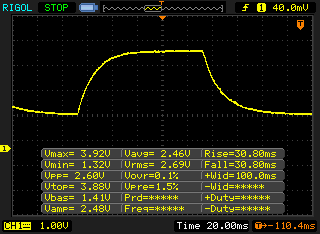 |
| ↘ 30.8 ms queda | ||
| A tela mostra taxas de resposta lentas em nossos testes e será insatisfatória para os jogadores. Em comparação, todos os dispositivos testados variam de 0.165 (mínimo) a 636 (máximo) ms. » 97 % de todos os dispositivos são melhores. Isso significa que o tempo de resposta medido é pior que a média de todos os dispositivos testados (31 ms). | ||
Cintilação da tela / PWM (modulação por largura de pulso)
| Tela tremeluzindo / PWM não detectado | 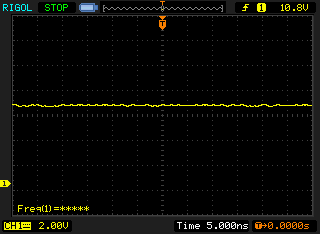 | ||
[pwm_comparison] Em comparação: 52 % de todos os dispositivos testados não usam PWM para escurecer a tela. Se PWM foi detectado, uma média de 7781 (mínimo: 5 - máximo: 343500) Hz foi medida. | |||
| PCMark 8 Home Score Accelerated v2 | 3611 pontos | |
| PCMark 8 Creative Score Accelerated v2 | 4725 pontos | |
| PCMark 8 Work Score Accelerated v2 | 4381 pontos | |
| PCMark 10 Score | 4785 pontos | |
Ajuda | ||
| Lenovo ThinkPad X1 Extreme-20MF000XGE Samsung SSD PM981 MZVLB1T0HALR | Dell XPS 15 9570 i7 UHD Toshiba XG5 KXG50ZNV512G | HP EliteBook 1050 G1-4QY20EA Toshiba XG5-P KXG50PNV2T04 | Lenovo ThinkPad X1 Carbon 2018-20KGS03900 Samsung SSD PM981 MZVLB512HAJQ | Lenovo ThinkPad T580-20LAS01H00 Samsung SSD PM981 MZVLB512HAJQ | Média Samsung SSD PM981 MZVLB1T0HALR | |
|---|---|---|---|---|---|---|
| CrystalDiskMark 5.2 / 6 | -24% | -30% | -3% | -31% | 6% | |
| Write 4K (MB/s) | 123.7 | 79.1 -36% | 94.8 -23% | 131.9 7% | 131.4 6% | 165.7 ? 34% |
| Read 4K (MB/s) | 44.07 | 37.89 -14% | 26.45 -40% | 44.6 1% | 29.47 -33% | 44.6 ? 1% |
| Write Seq (MB/s) | 2215 | 1119 -49% | 1037 -53% | 1824 -18% | 878 -60% | 1982 ? -11% |
| Read Seq (MB/s) | 2242 | 1852 -17% | 1280 -43% | 2163 -4% | 883 -61% | 1764 ? -21% |
| Write 4K Q32T1 (MB/s) | 313.9 | 361.1 15% | 277.6 -12% | 338.1 8% | 256 -18% | 395 ? 26% |
| Read 4K Q32T1 (MB/s) | 359.8 | 257.9 -28% | 333.9 -7% | 351.9 -2% | 337.7 -6% | 434 ? 21% |
| Write Seq Q32T1 (MB/s) | 2404 | 1131 -53% | 1037 -57% | 1972 -18% | 1723 -28% | 2351 ? -2% |
| Read Seq Q32T1 (MB/s) | 3333 | 3096 -7% | 3135 -6% | 3387 2% | 1778 -47% | 3234 ? -3% |
| Write 4K Q8T8 (MB/s) | 1044 | 1408 ? | ||||
| Read 4K Q8T8 (MB/s) | 914 | 1449 ? |

| 3DMark 11 Performance | 8886 pontos | |
| 3DMark Fire Strike Score | 6424 pontos | |
| 3DMark Time Spy Score | 2361 pontos | |
Ajuda | ||
Barulho
| Ocioso |
| 28.8 / 28.8 / 31.3 dB |
| Carga |
| 36.4 / 39.2 dB |
 | ||
30 dB silencioso 40 dB(A) audível 50 dB(A) ruidosamente alto |
||
min: | ||
| Lenovo ThinkPad X1 Extreme-20MF000XGE GeForce GTX 1050 Ti Max-Q, i7-8750H, Samsung SSD PM981 MZVLB1T0HALR | Dell XPS 15 9570 i7 UHD GeForce GTX 1050 Ti Max-Q, i7-8750H, Toshiba XG5 KXG50ZNV512G | HP EliteBook 1050 G1-4QY20EA GeForce GTX 1050 Max-Q, i7-8750H, Toshiba XG5-P KXG50PNV2T04 | Lenovo ThinkPad X1 Carbon 2018-20KGS03900 UHD Graphics 620, i5-8550U, Samsung SSD PM981 MZVLB512HAJQ | Lenovo ThinkPad T580-20LAS01H00 GeForce MX150, i5-8550U, Samsung SSD PM981 MZVLB512HAJQ | Apple MacBook Pro 15 2018 (2.6 GHz, 560X) Radeon Pro 560X, i7-8850H, Apple SSD AP0512 | |
|---|---|---|---|---|---|---|
| Noise | -3% | -8% | 2% | -0% | -8% | |
| desligado / ambiente * (dB) | 28.8 | 29.9 -4% | 30.25 -5% | 28.9 -0% | 29.3 -2% | 29.6 -3% |
| Idle Minimum * (dB) | 28.8 | 29.9 -4% | 30.25 -5% | 28.9 -0% | 29.3 -2% | 30.1 -5% |
| Idle Average * (dB) | 28.8 | 29.9 -4% | 30.25 -5% | 28.9 -0% | 29.3 -2% | 30.1 -5% |
| Idle Maximum * (dB) | 31.3 | 30.3 3% | 31.8 -2% | 32.5 -4% | 31.8 -2% | 30.1 4% |
| Load Average * (dB) | 36.4 | 36.5 -0% | 44.7 -23% | 35.1 4% | 35.8 2% | 46.8 -29% |
| Witcher 3 ultra * (dB) | 36.4 | 40.4 -11% | 35.8 2% | 36 1% | ||
| Load Maximum * (dB) | 39.2 | 40.4 -3% | 42 -7% | 35.1 10% | 38 3% | 46.8 -19% |
* ... menor é melhor
(-) A temperatura máxima no lado superior é 45.4 °C / 114 F, em comparação com a média de 36.8 °C / 98 F , variando de 21 a 71 °C para a classe Multimedia.
(-) A parte inferior aquece até um máximo de 53.4 °C / 128 F, em comparação com a média de 39.1 °C / 102 F
(+) Em uso inativo, a temperatura média para o lado superior é 25.5 °C / 78 F, em comparação com a média do dispositivo de 31.3 °C / ### class_avg_f### F.
(±) Jogando The Witcher 3, a temperatura média para o lado superior é 36 °C / 97 F, em comparação com a média do dispositivo de 31.3 °C / ## #class_avg_f### F.
(+) Os apoios para as mãos e o touchpad são mais frios que a temperatura da pele, com um máximo de 30.7 °C / 87.3 F e, portanto, são frios ao toque.
(±) A temperatura média da área do apoio para as mãos de dispositivos semelhantes foi 28.7 °C / 83.7 F (-2 °C / -3.6 F).
| Lenovo ThinkPad X1 Extreme-20MF000XGE i7-8750H, GeForce GTX 1050 Ti Max-Q, 80 Wh | Dell XPS 15 9570 i7 UHD i7-8750H, GeForce GTX 1050 Ti Max-Q, 97 Wh | HP EliteBook 1050 G1-4QY20EA i7-8750H, GeForce GTX 1050 Max-Q, 96 Wh | Lenovo ThinkPad X1 Carbon 2018-20KGS03900 i5-8550U, UHD Graphics 620, 57 Wh | Lenovo ThinkPad T580-20LAS01H00 i5-8550U, GeForce MX150, 105 Wh | Apple MacBook Pro 15 2018 (2.6 GHz, 560X) i7-8850H, Radeon Pro 560X, 83 Wh | Média da turma Multimedia | |
|---|---|---|---|---|---|---|---|
| Duração da bateria | 26% | 37% | 43% | 47% | 61% | 89% | |
| Reader / Idle (h) | 11.5 | 17.1 49% | 22.1 92% | 19.7 71% | 25.2 ? 119% | ||
| H.264 (h) | 6.2 | 12.3 98% | 9.7 56% | 9.4 52% | 9.4 52% | 11.7 89% | 16.4 ? 165% |
| WiFi v1.3 (h) | 6.4 | 9.6 50% | 8.7 36% | 8.7 36% | 8.7 36% | 10.2 59% | 12 ? 88% |
| Witcher 3 ultra (h) | 1.1 | 1 -9% | 1.5 36% | ||||
| Load (h) | 2 | 1.3 -35% | 2.1 5% | 1.8 -10% | 2.6 30% | 1.675 ? -16% |
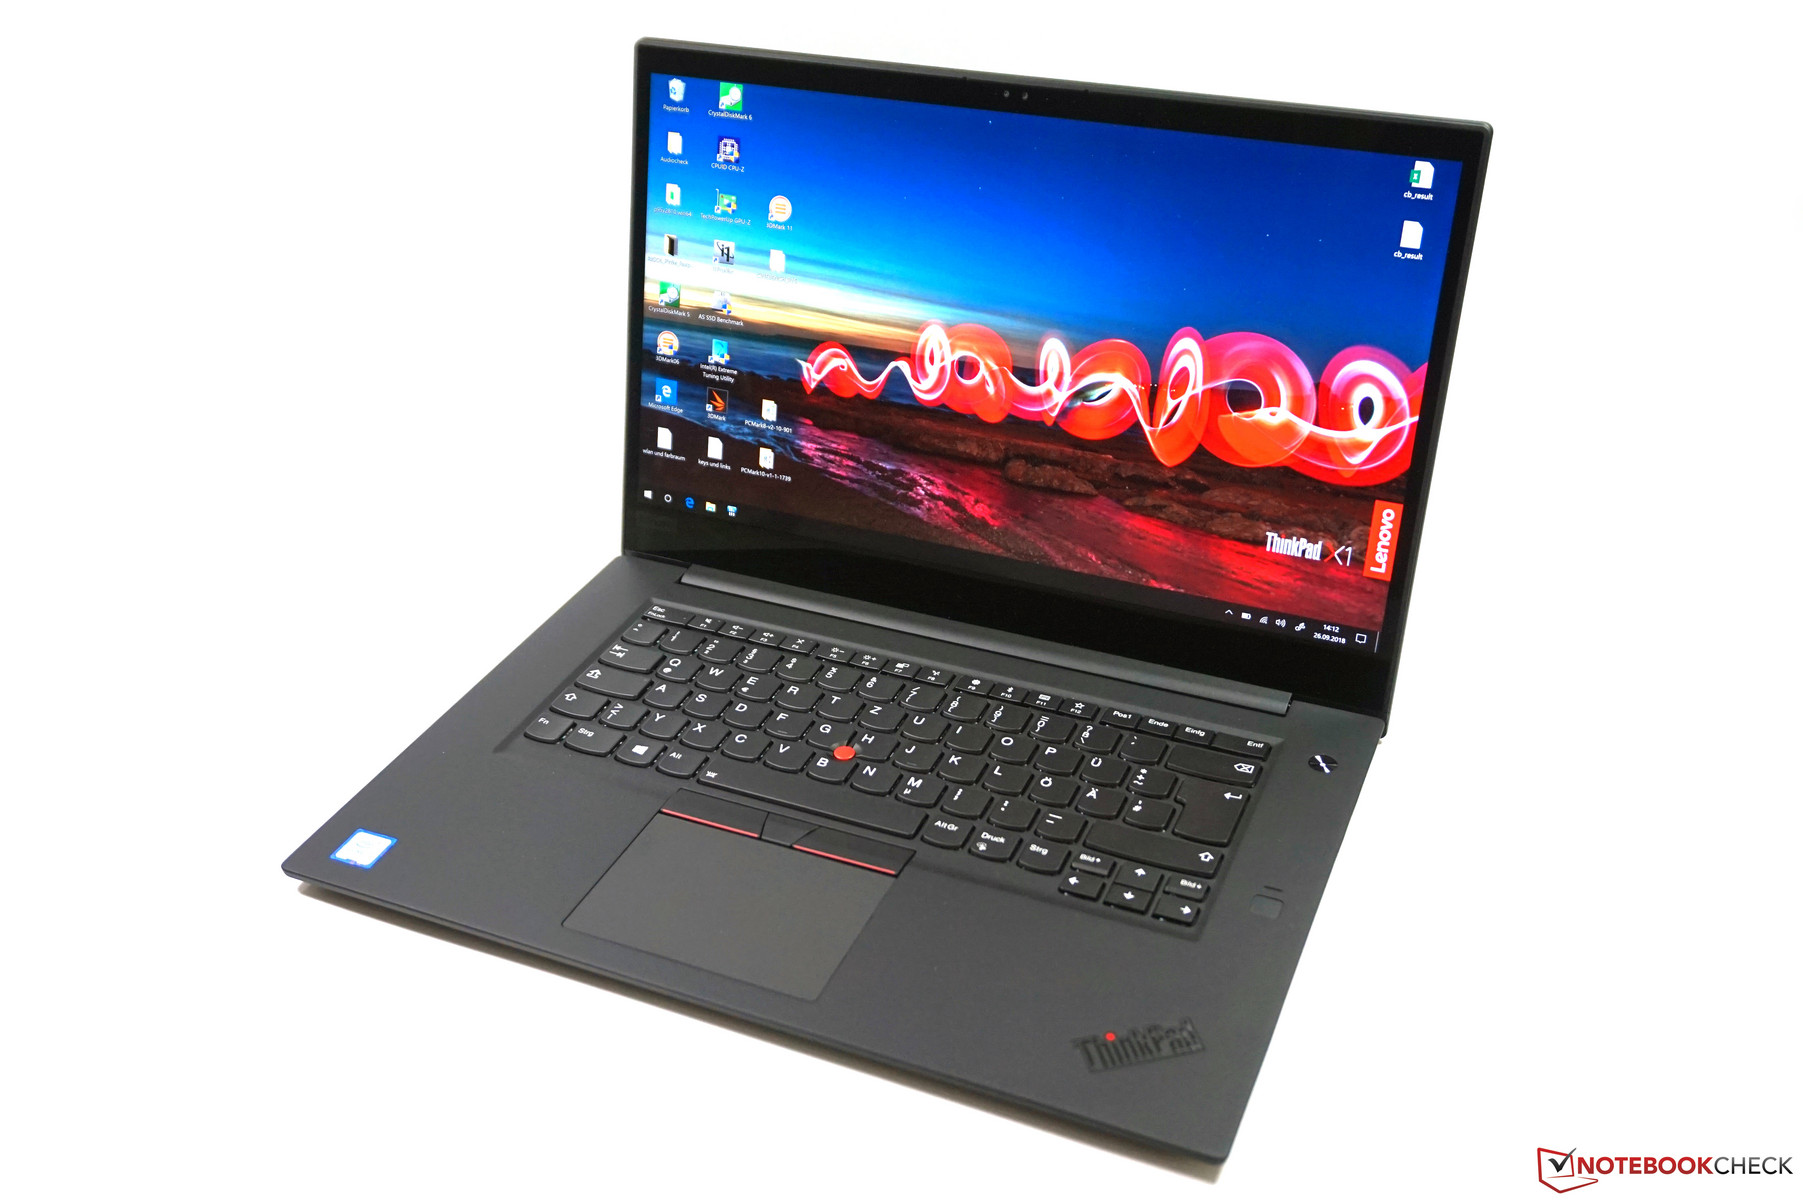
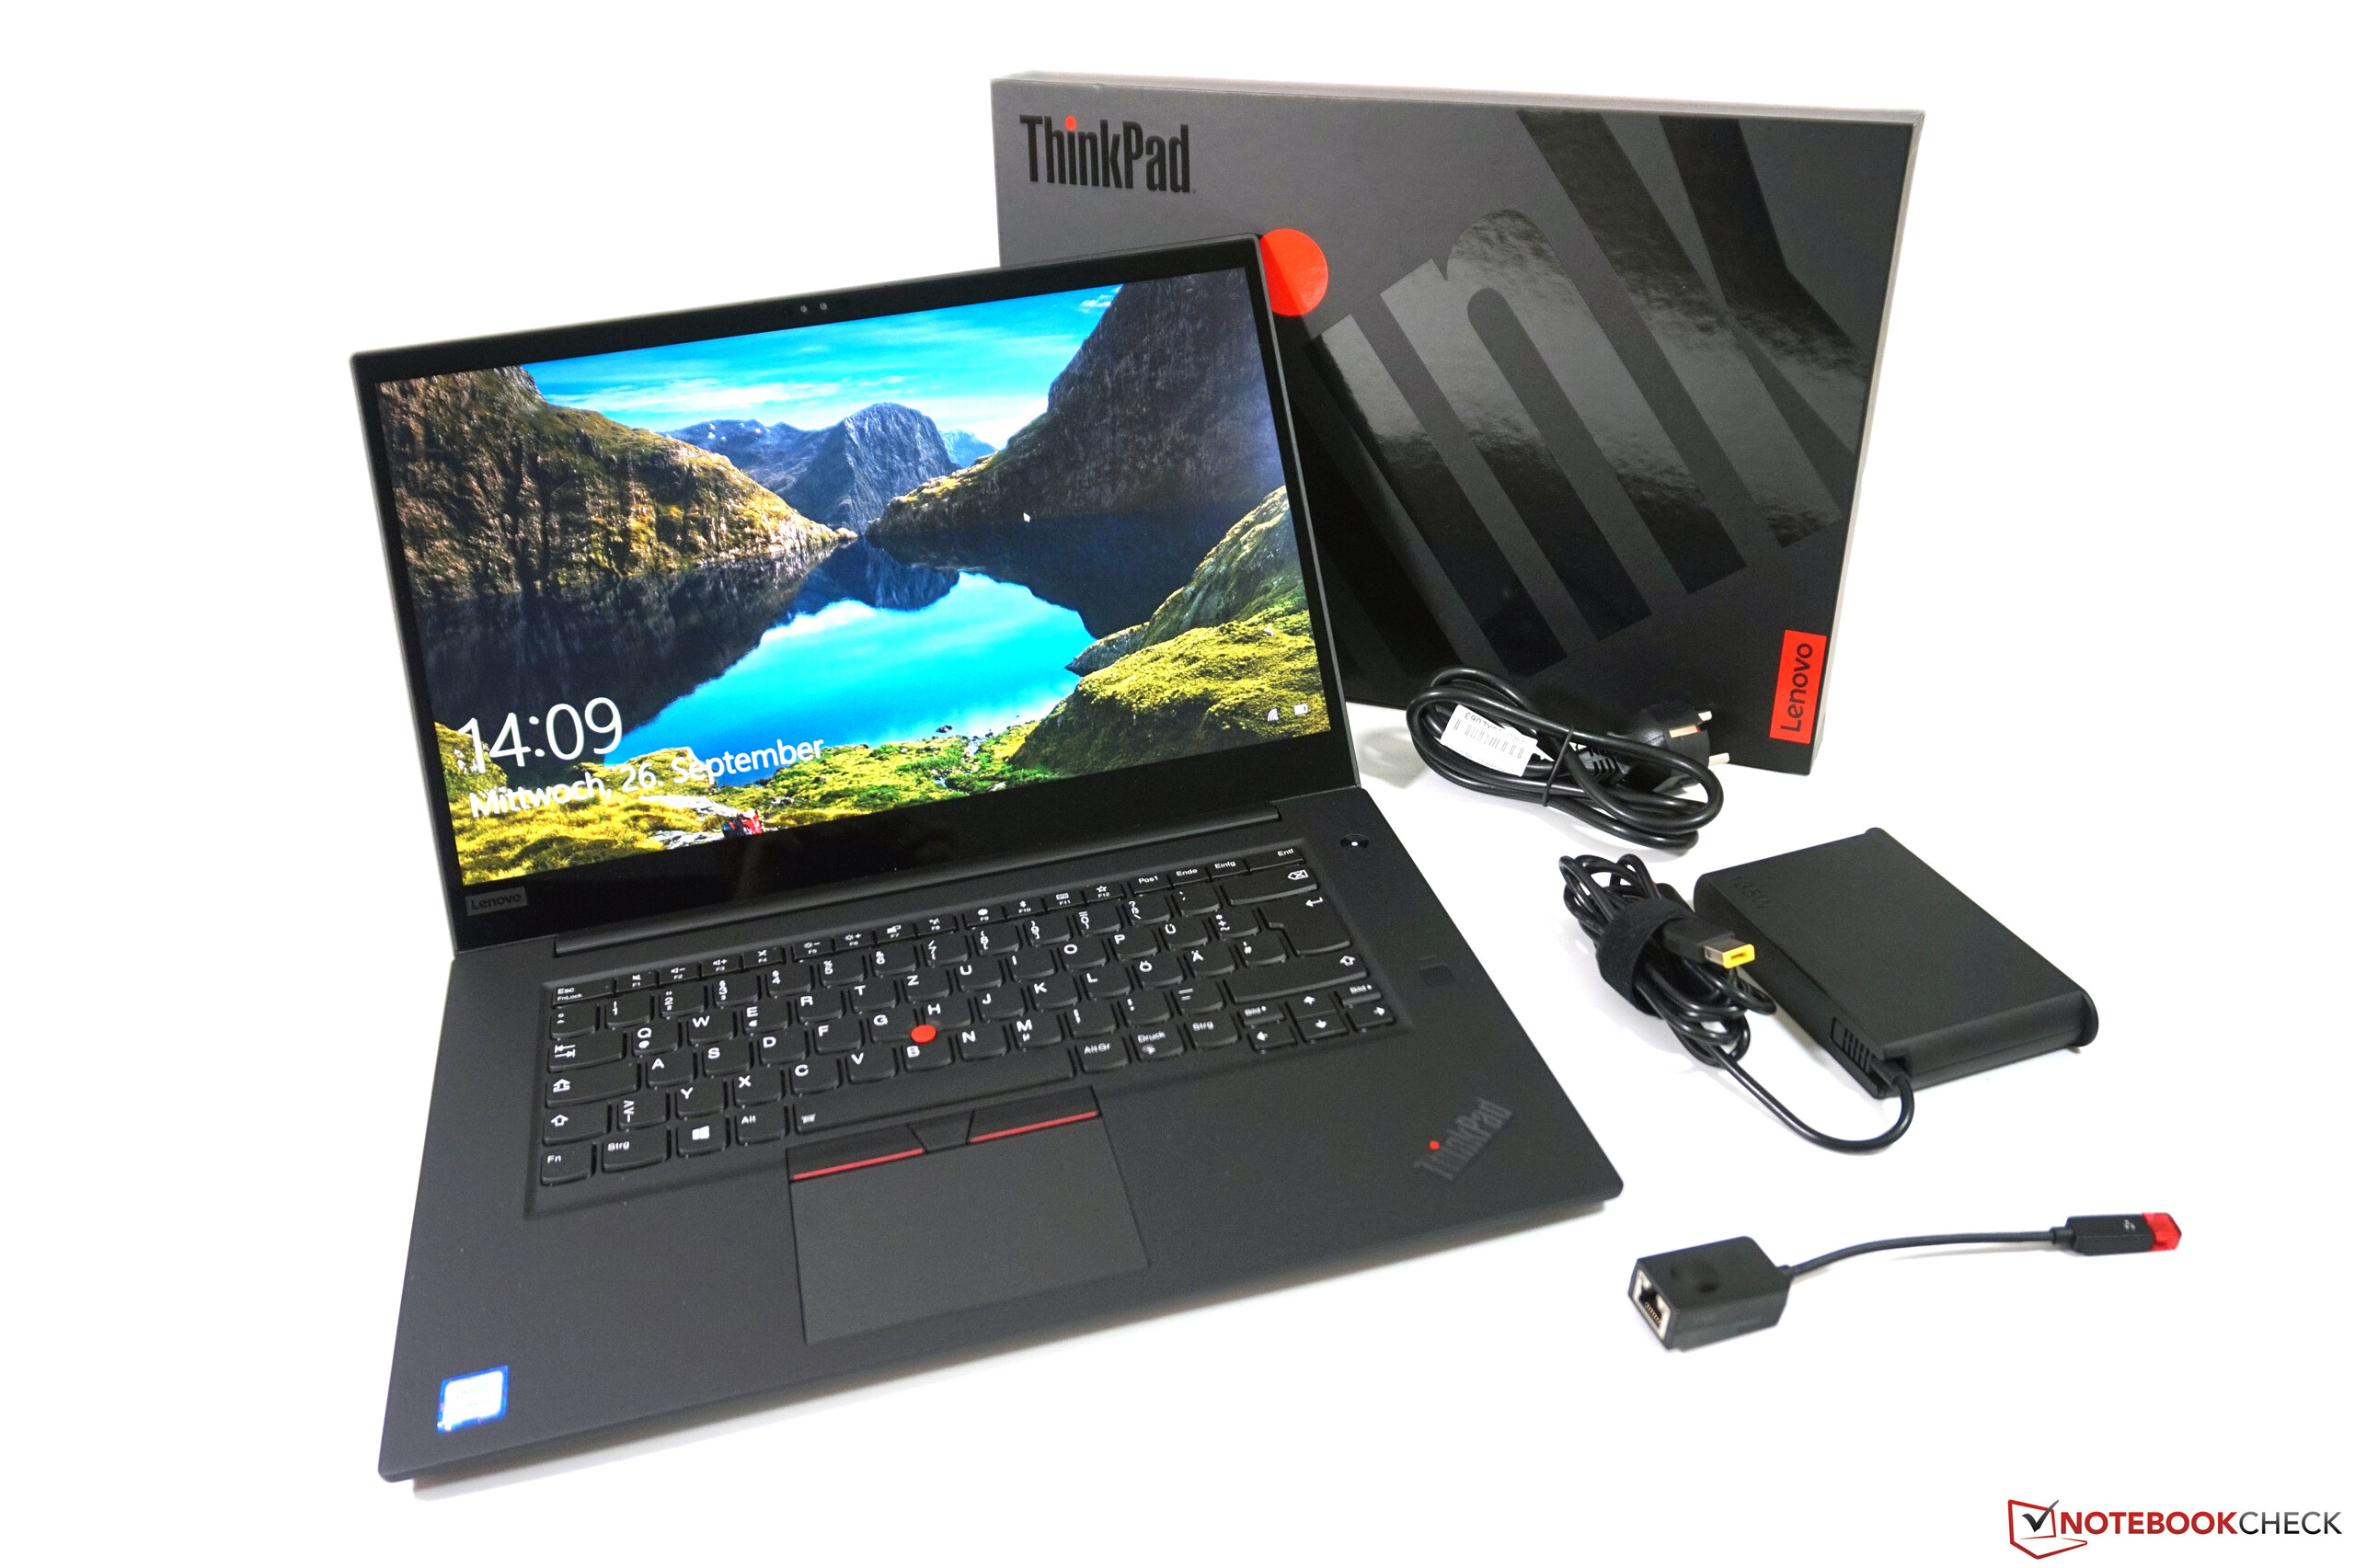
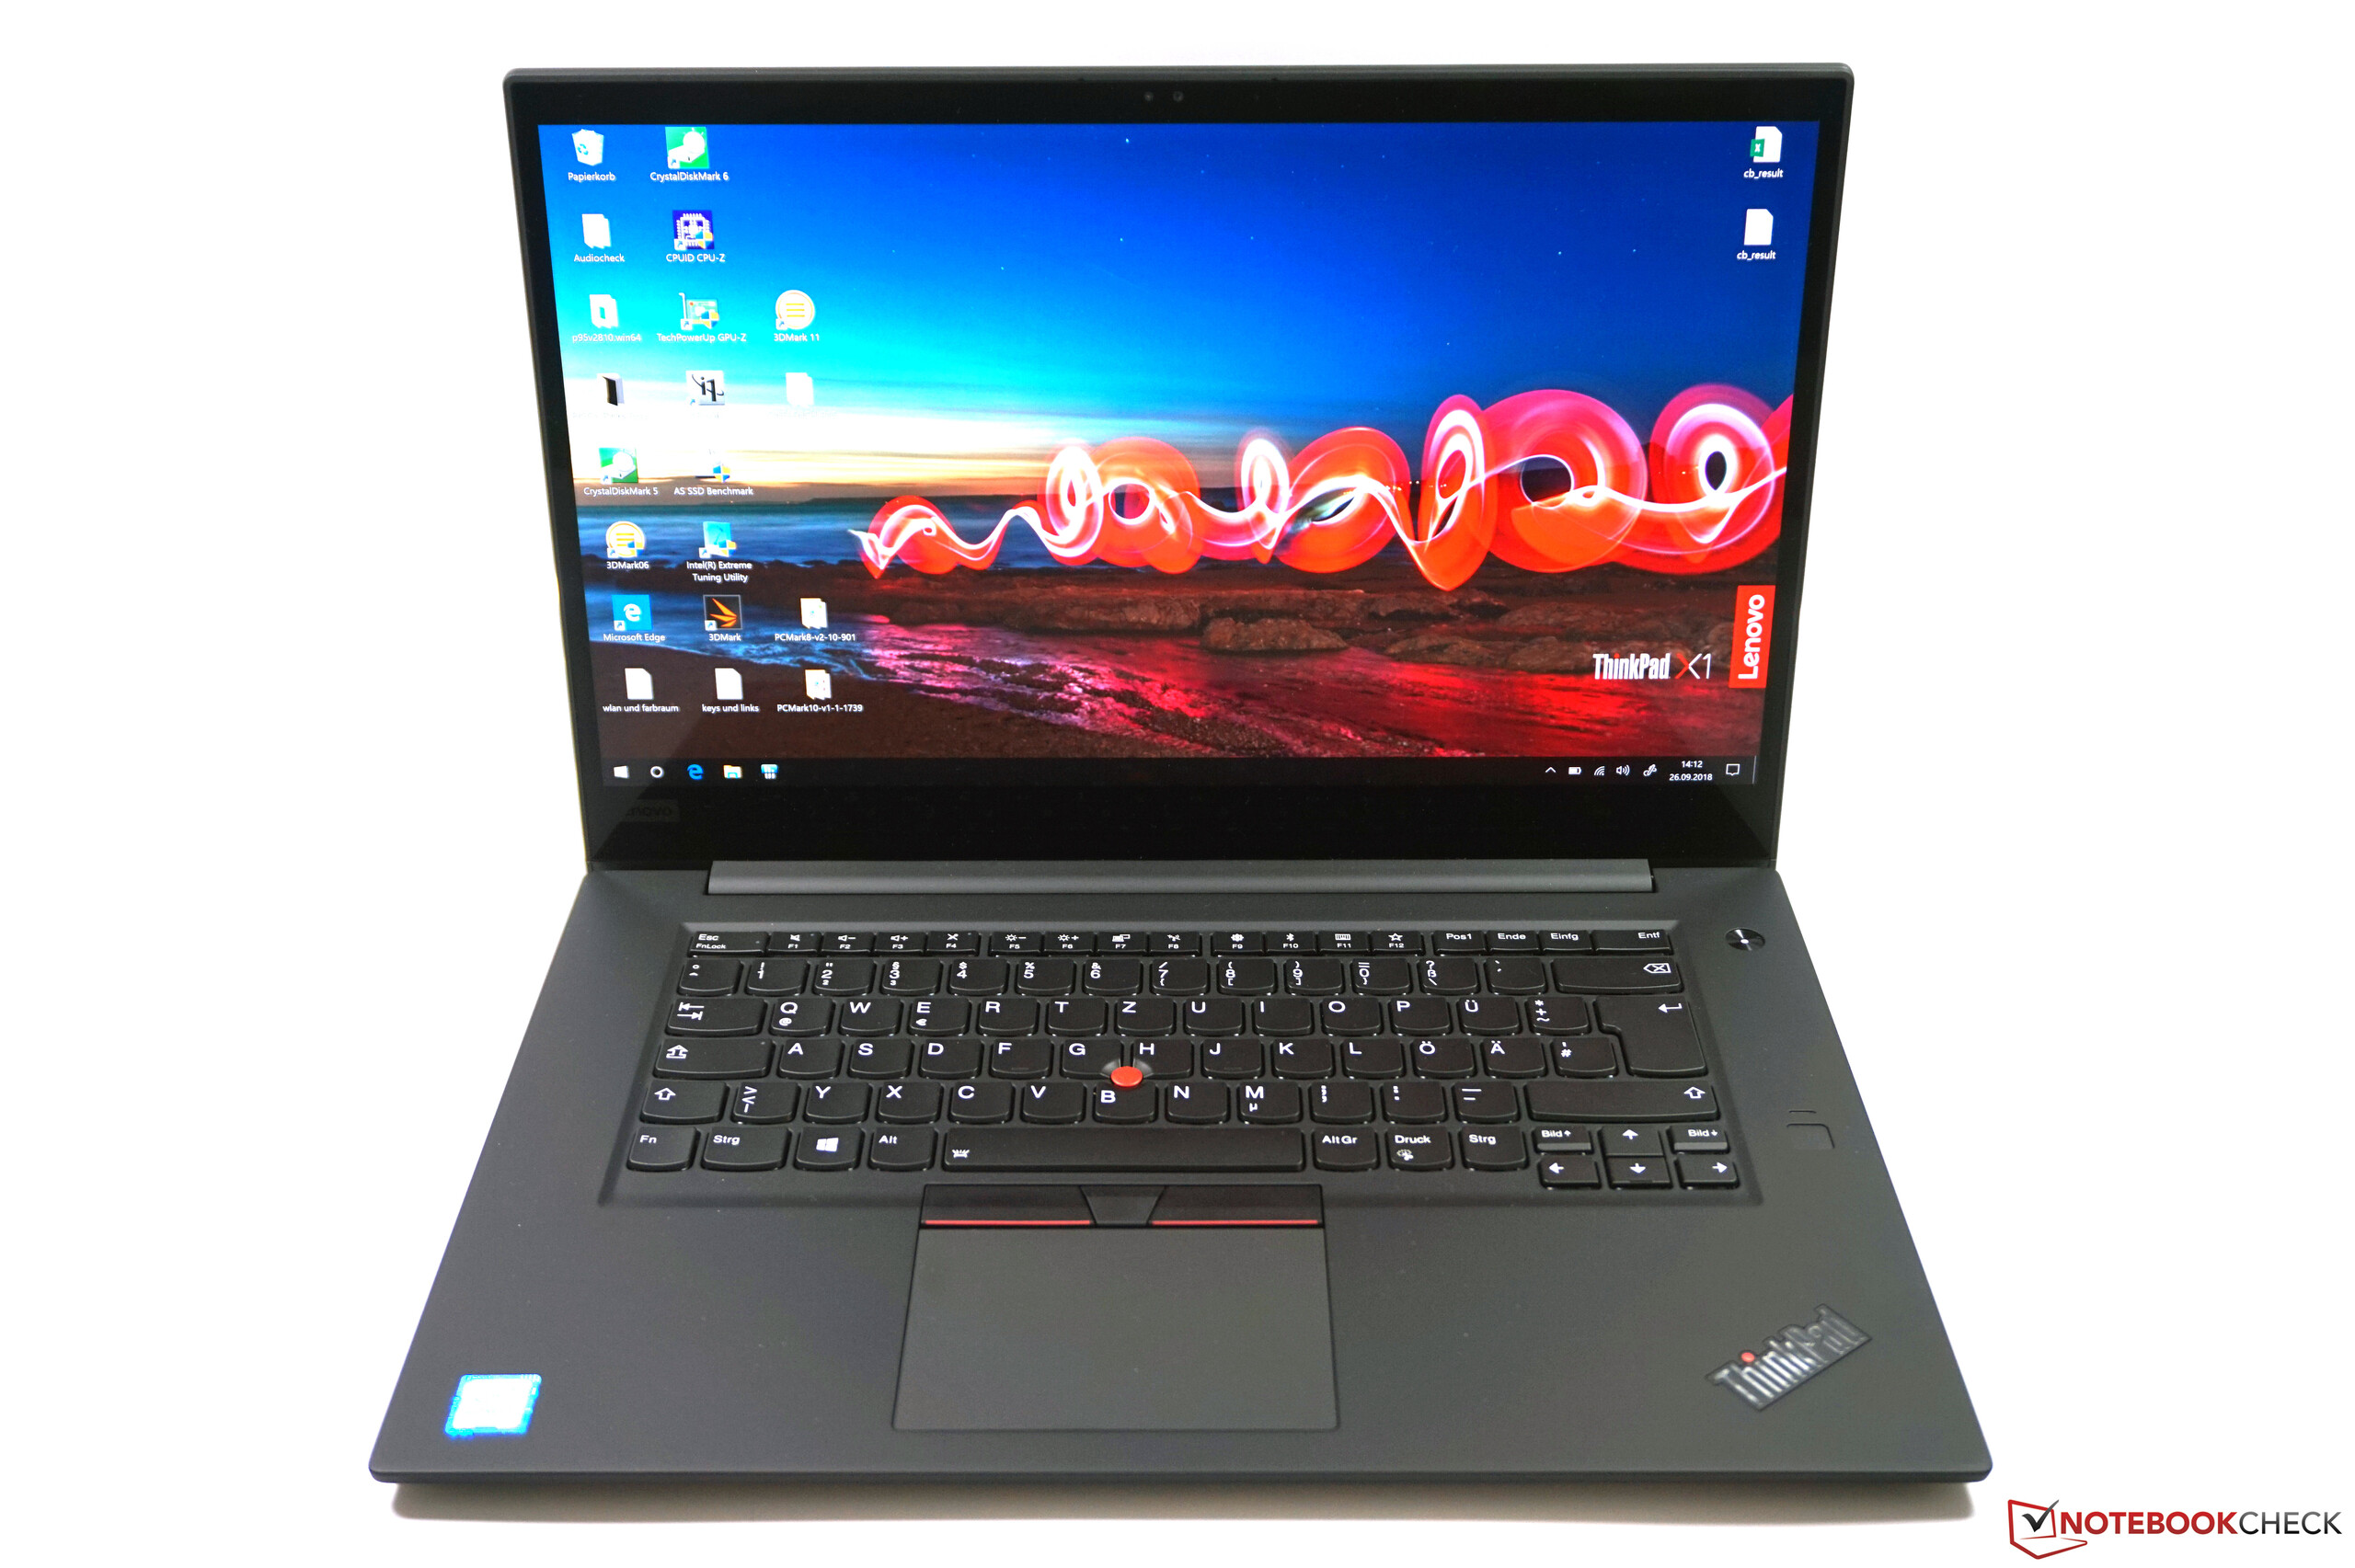
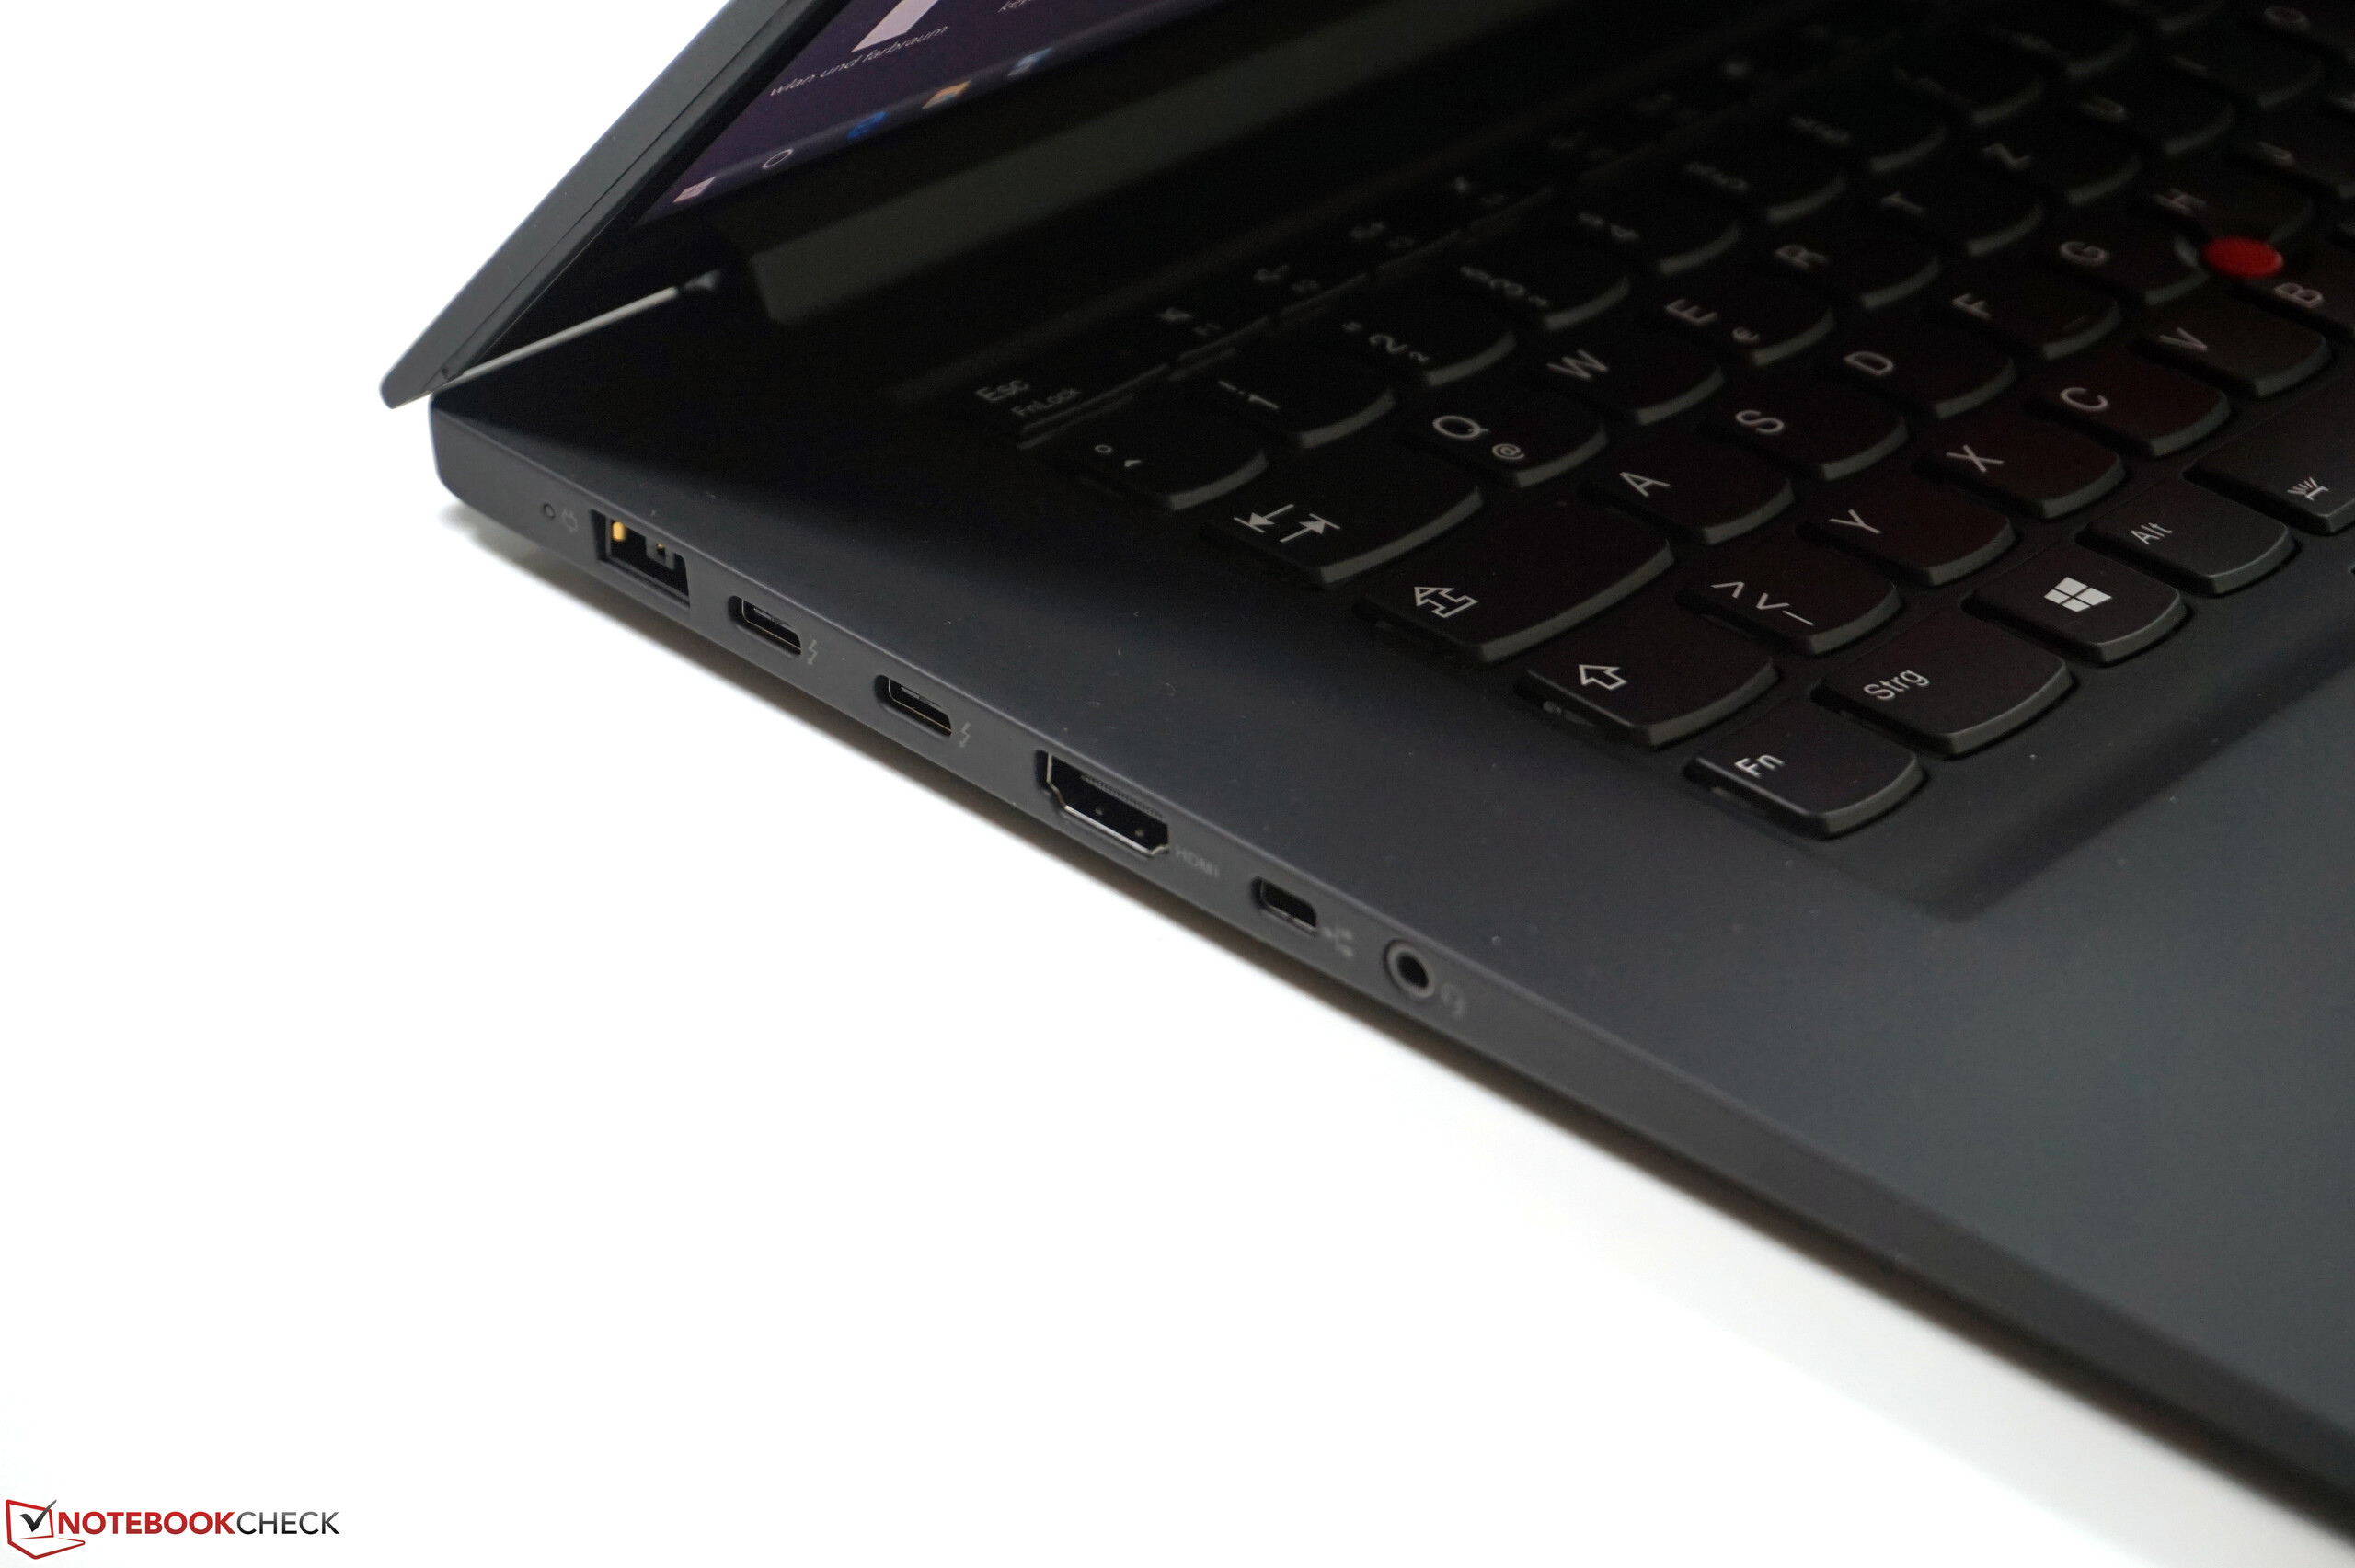
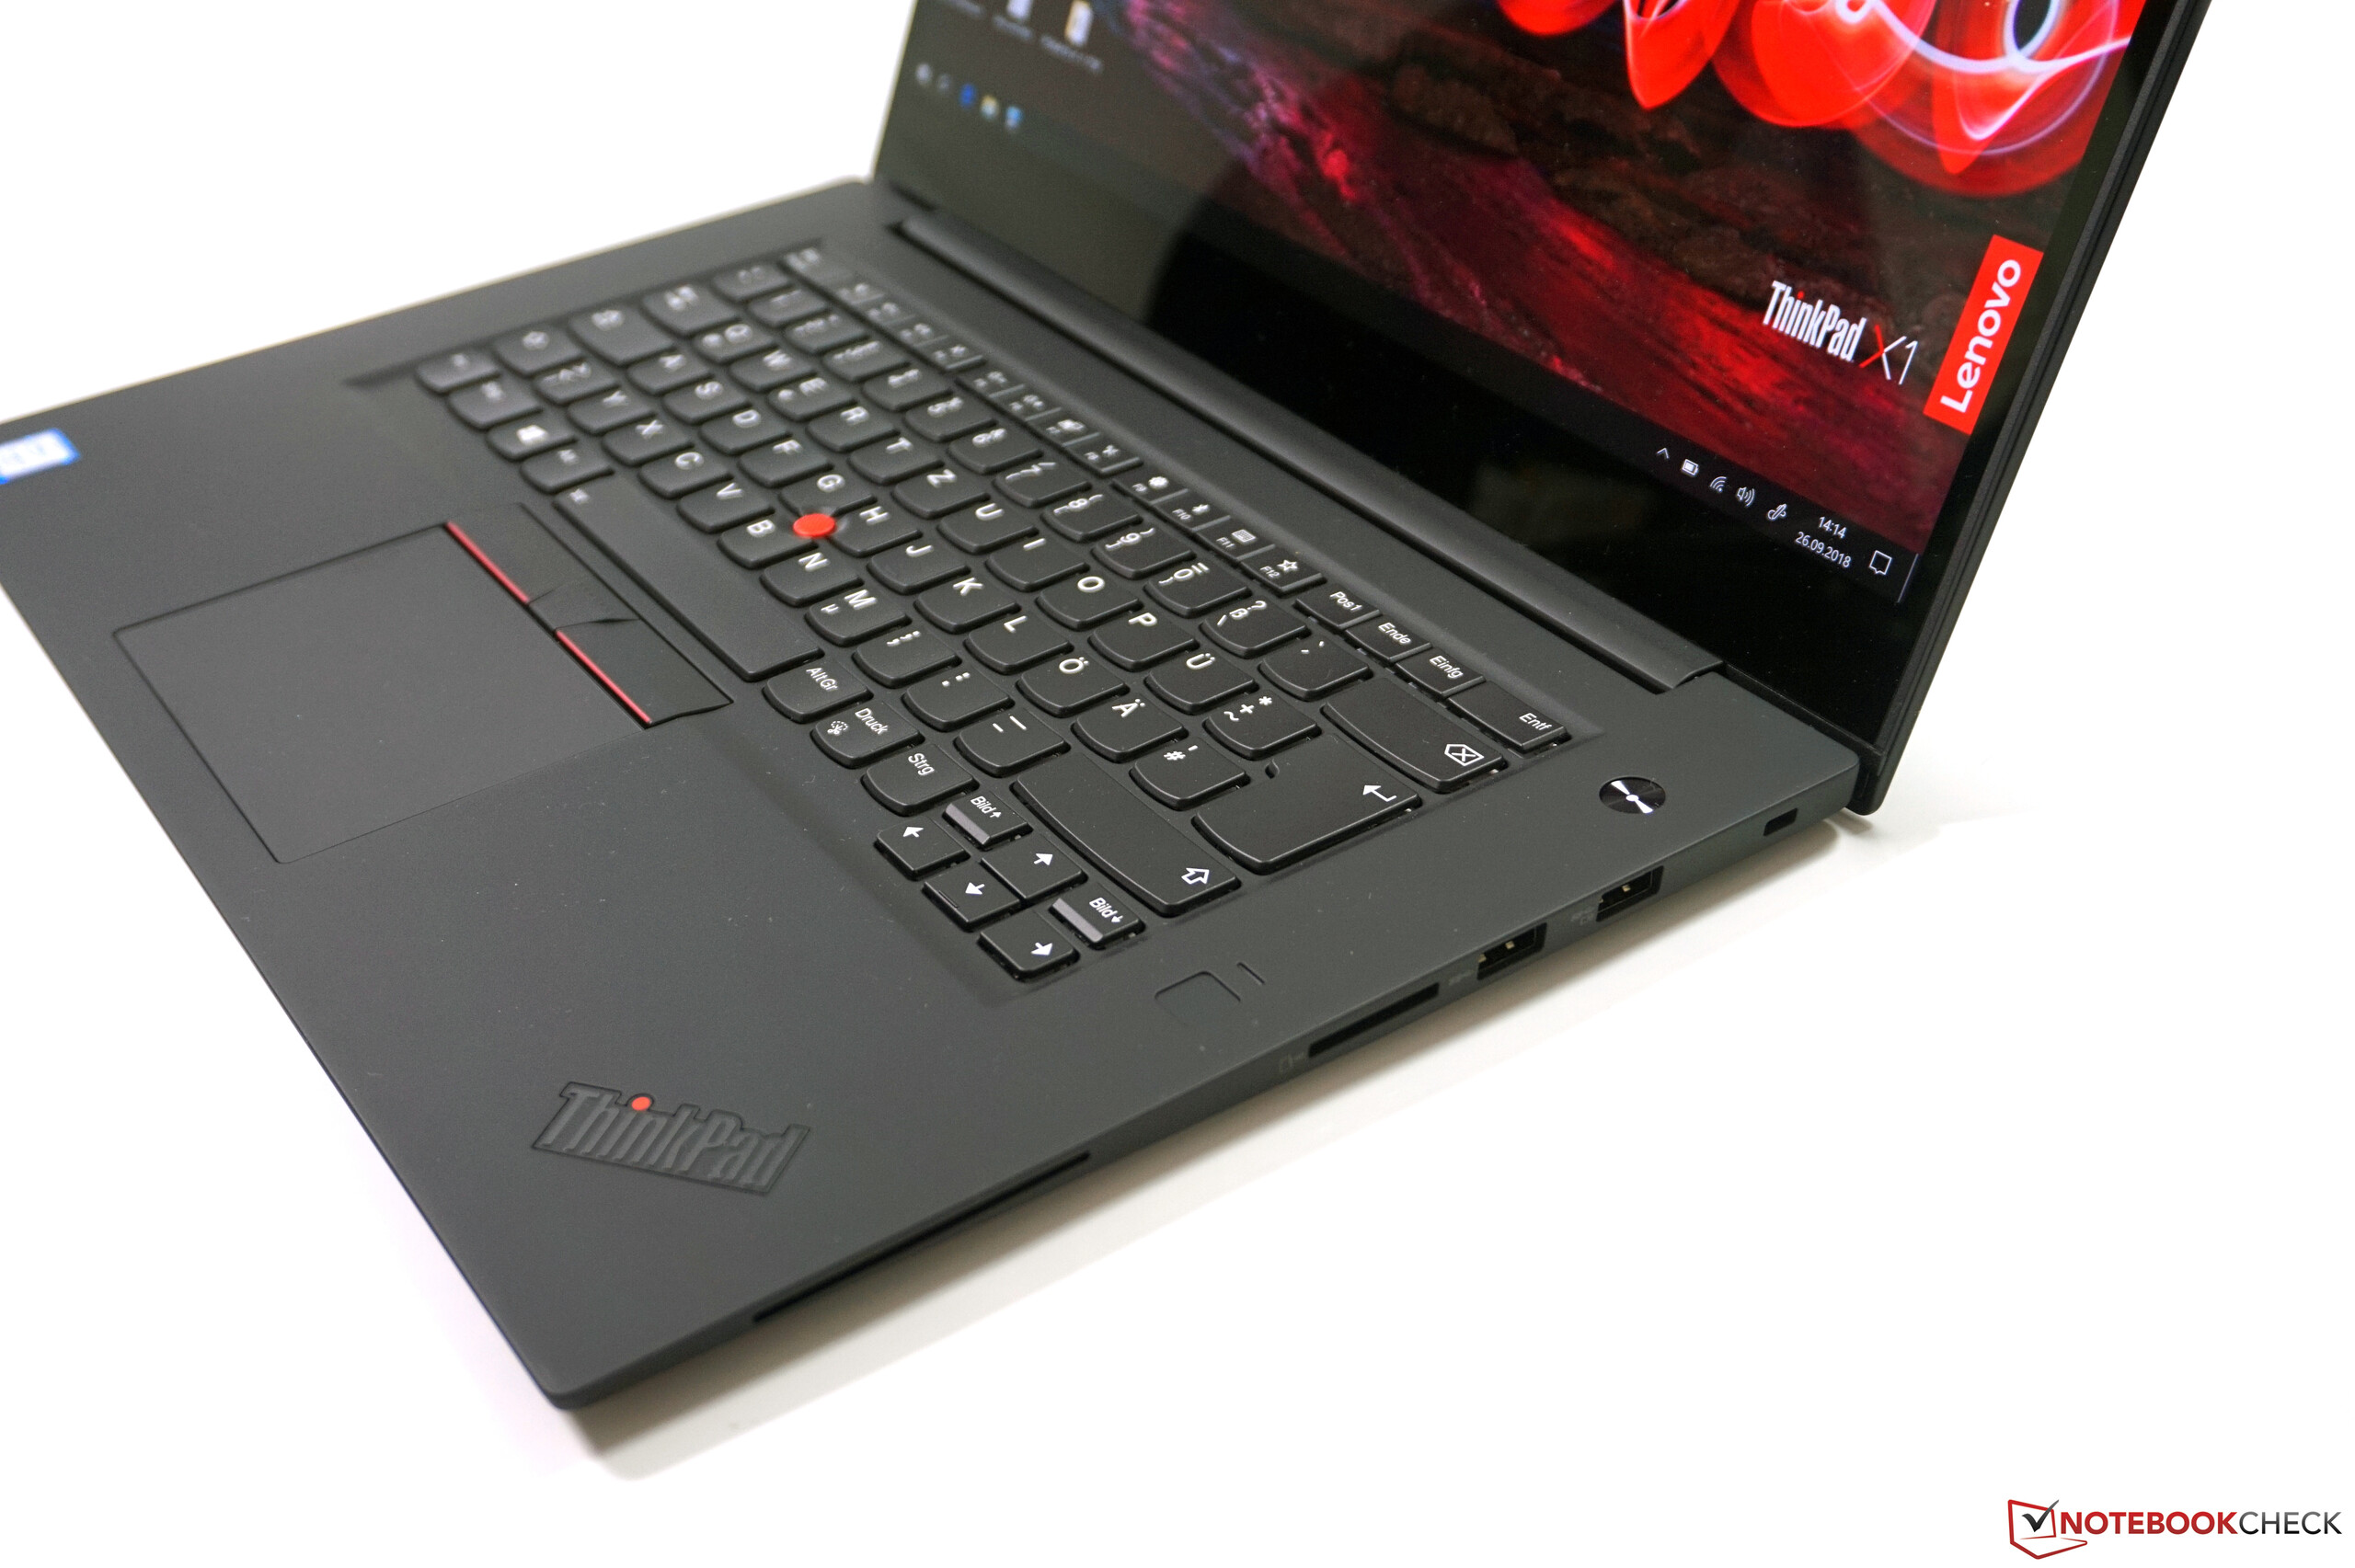
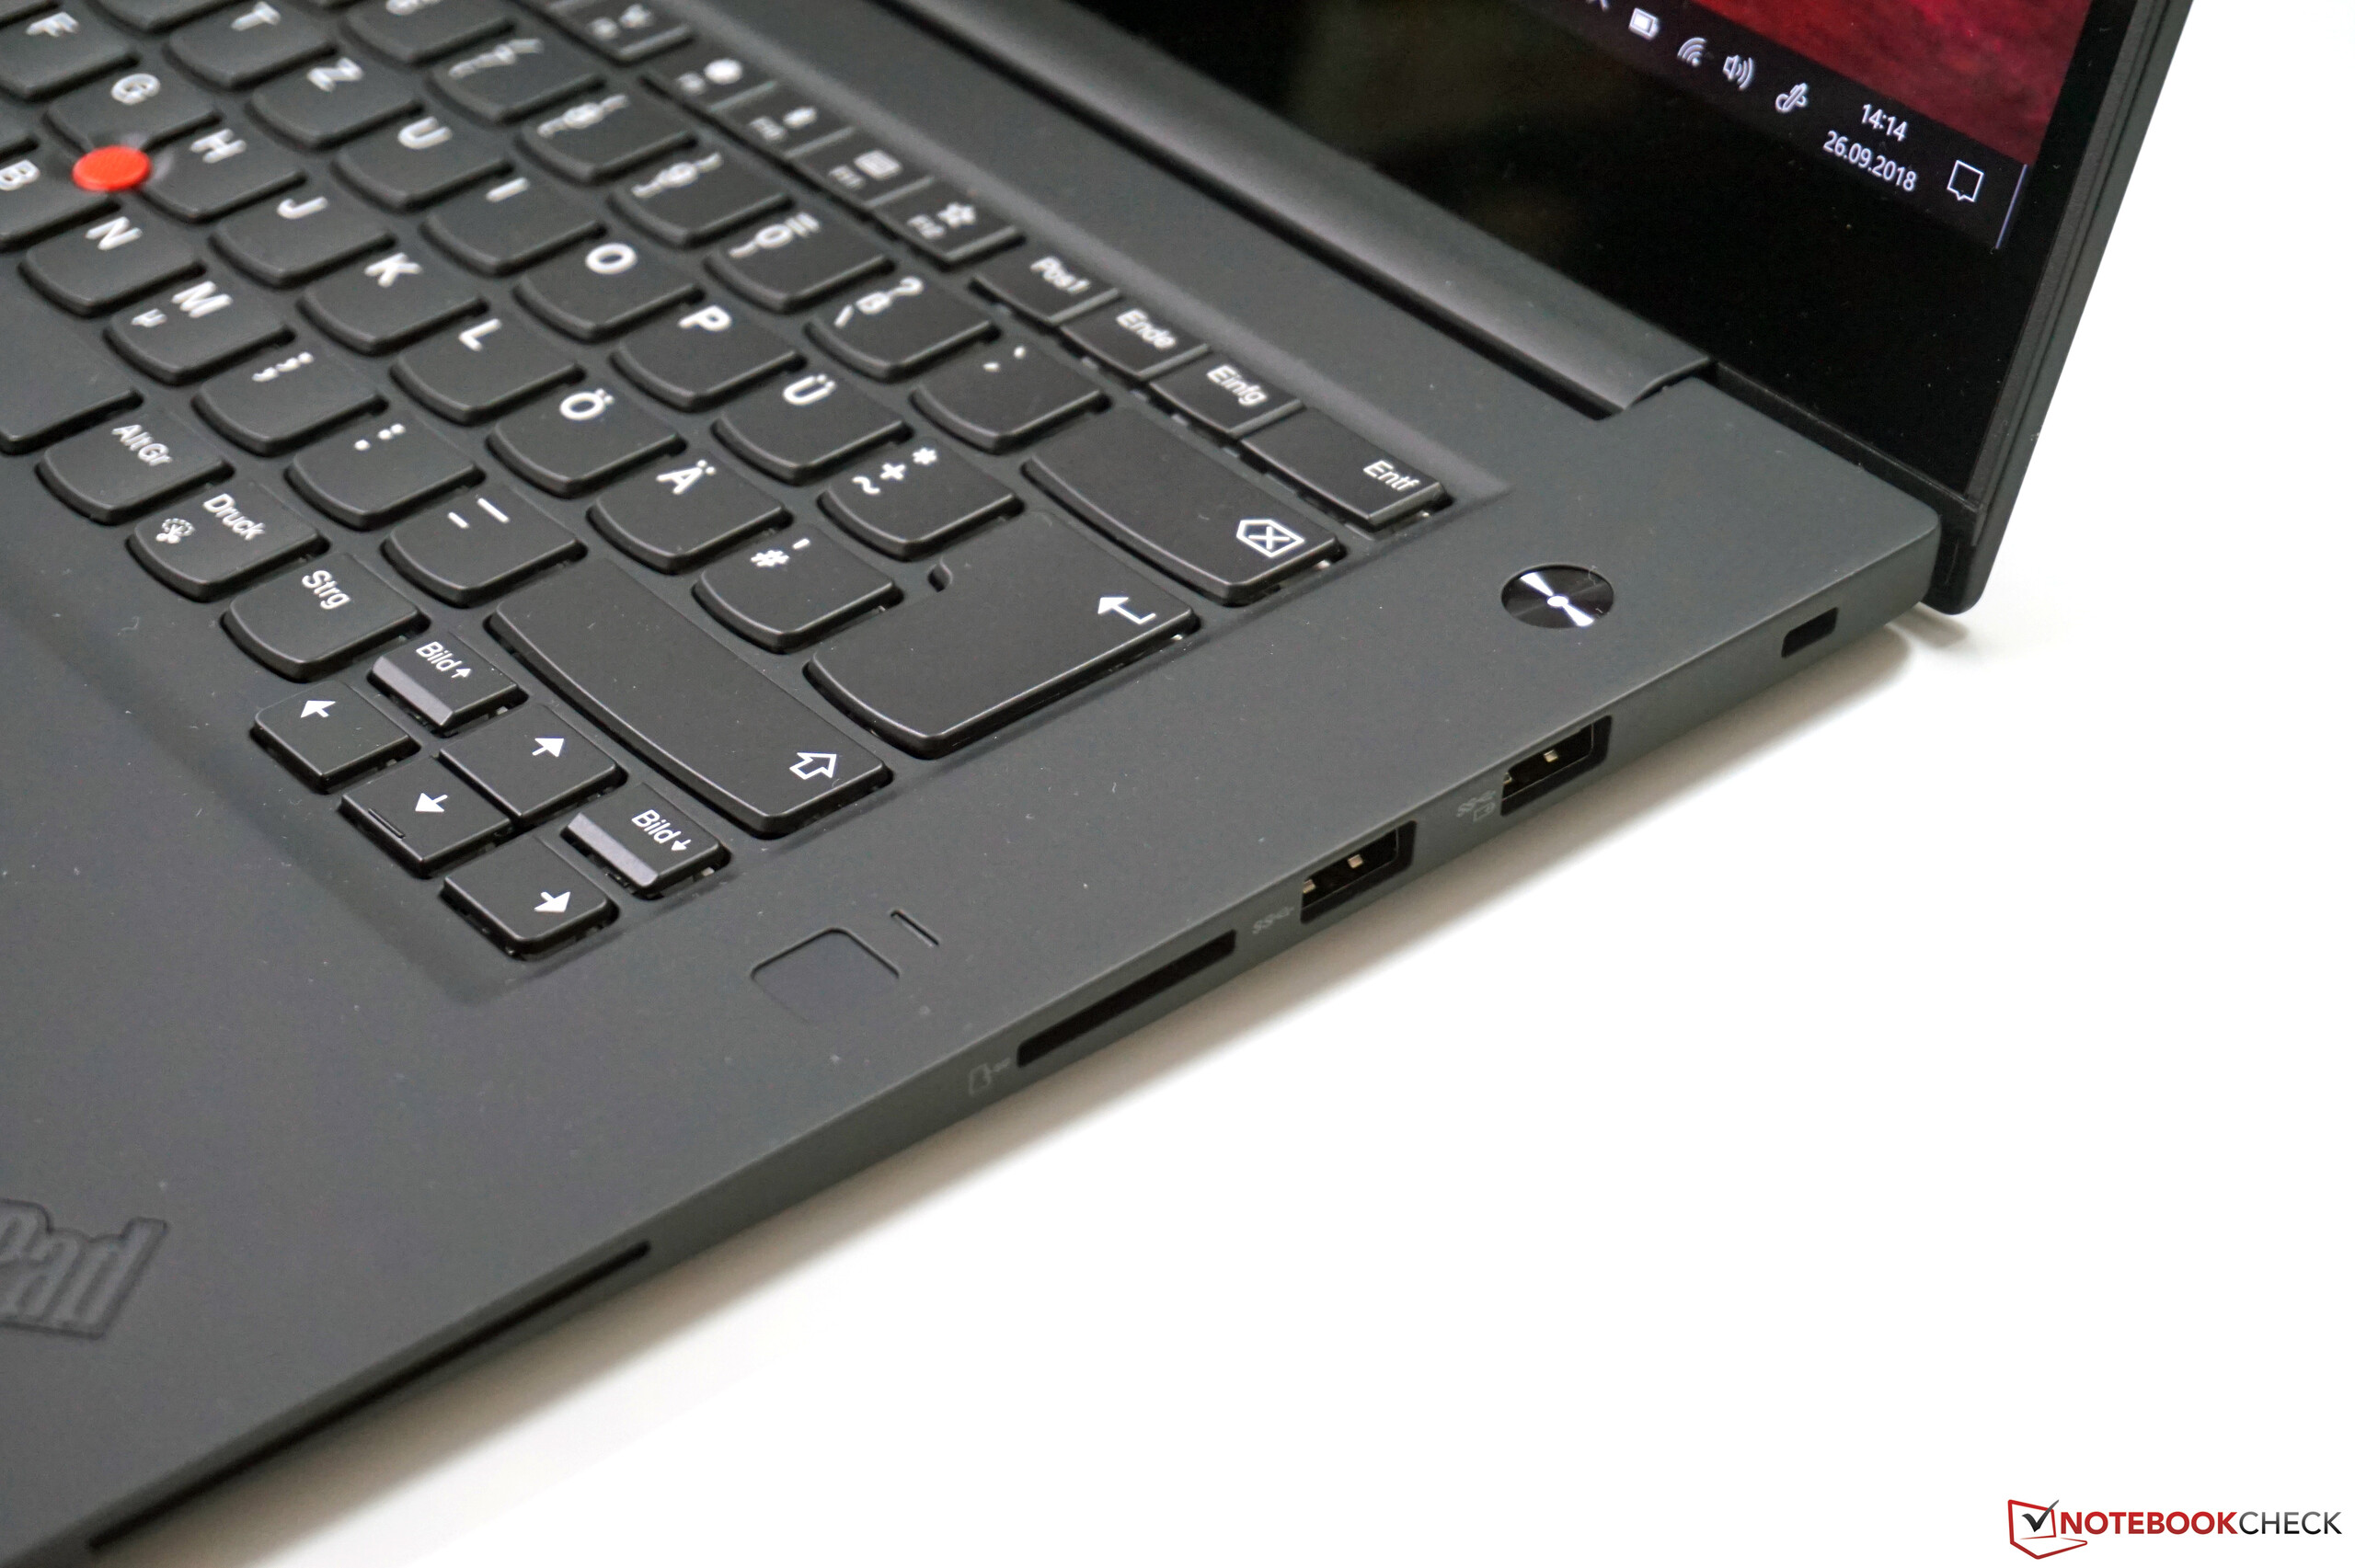
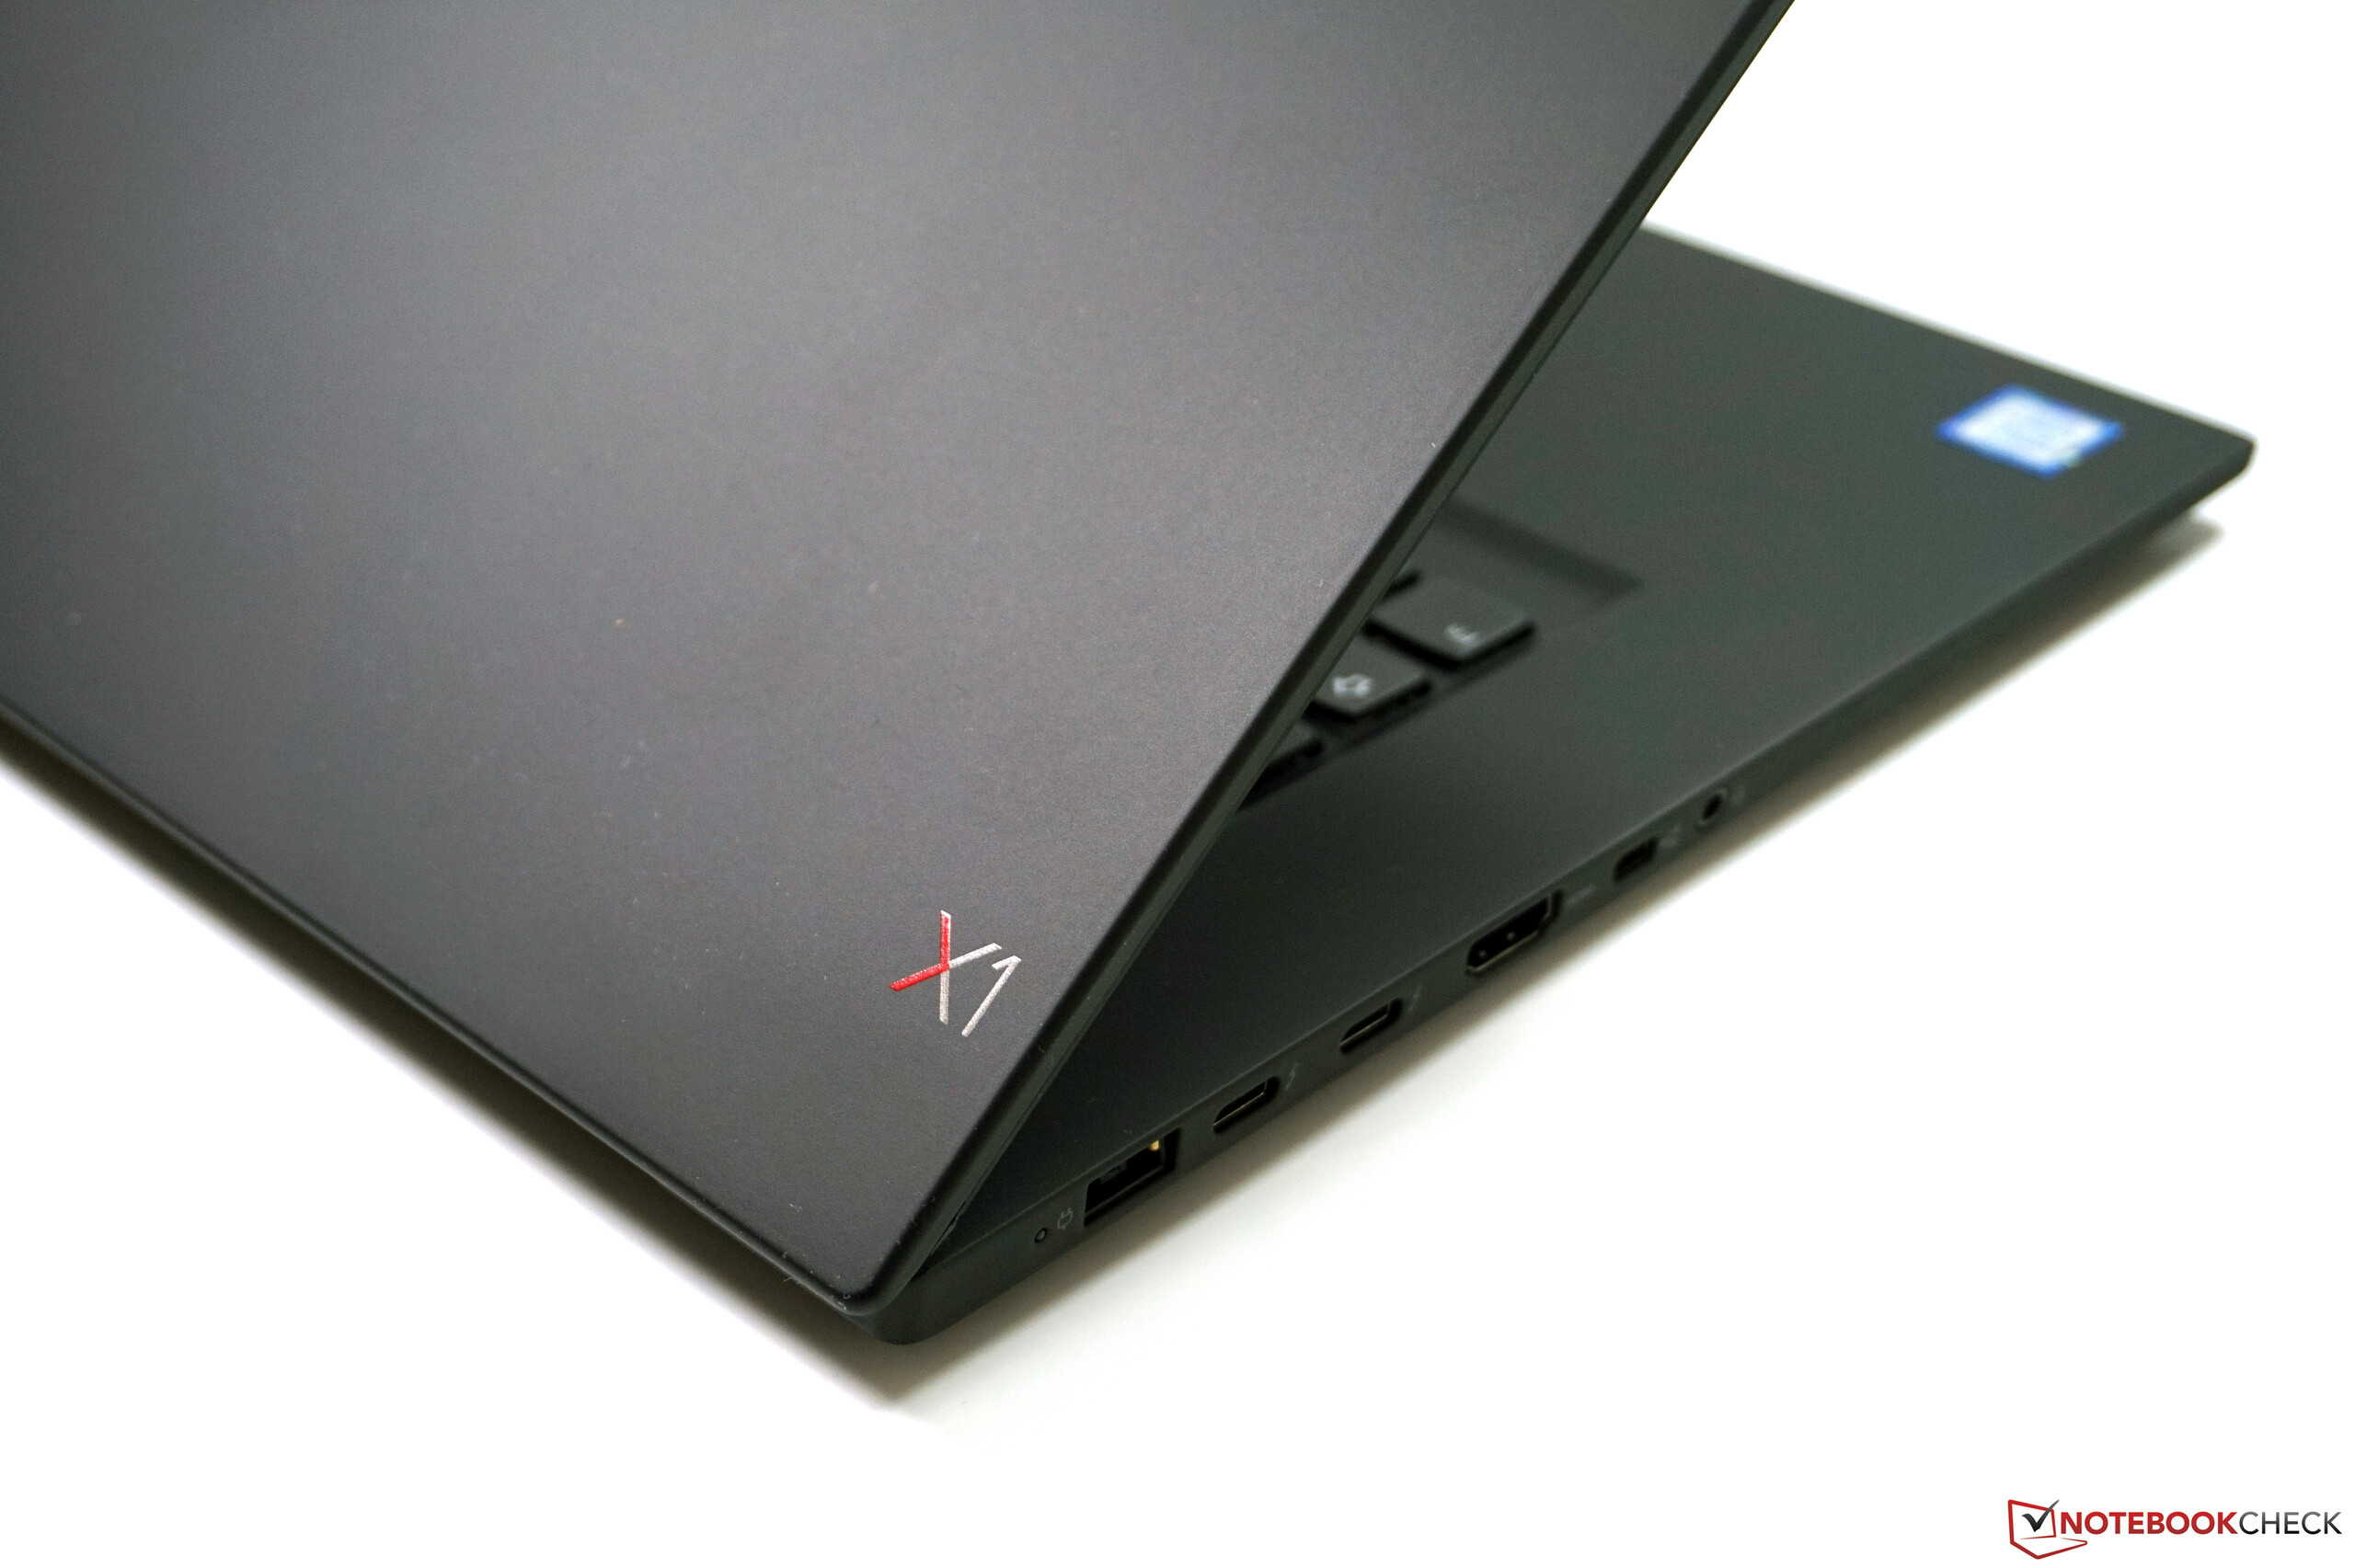
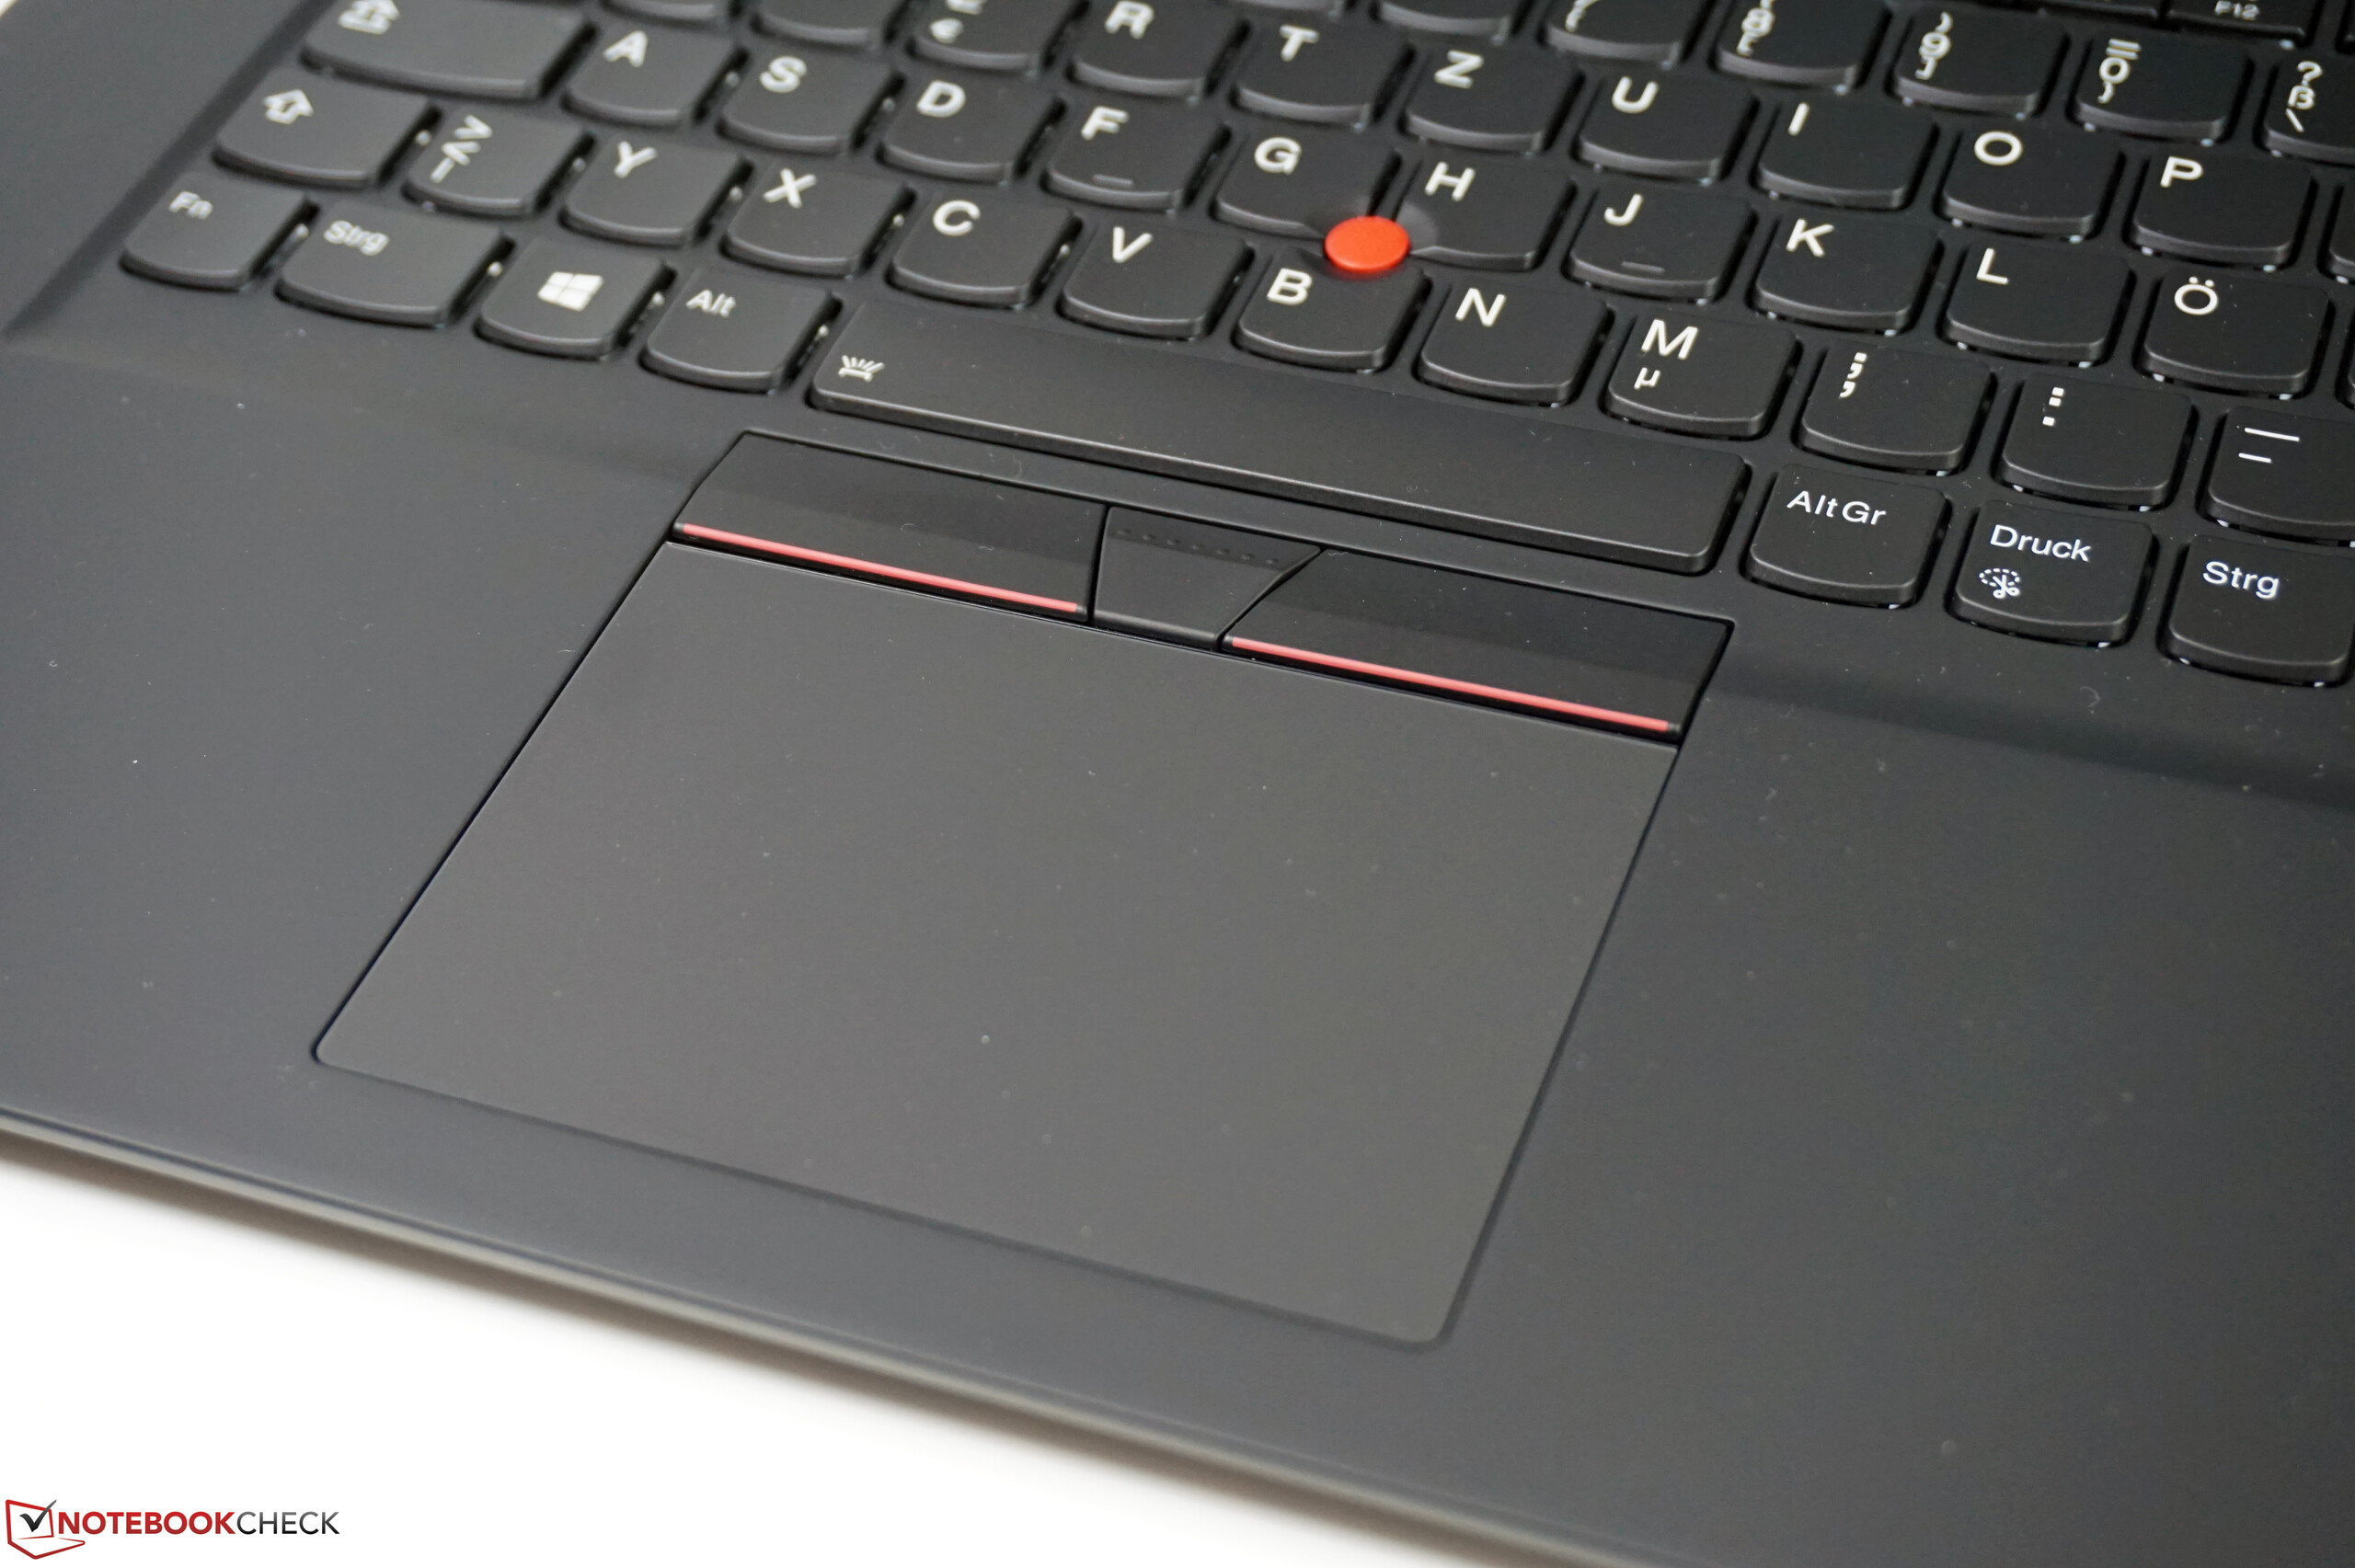
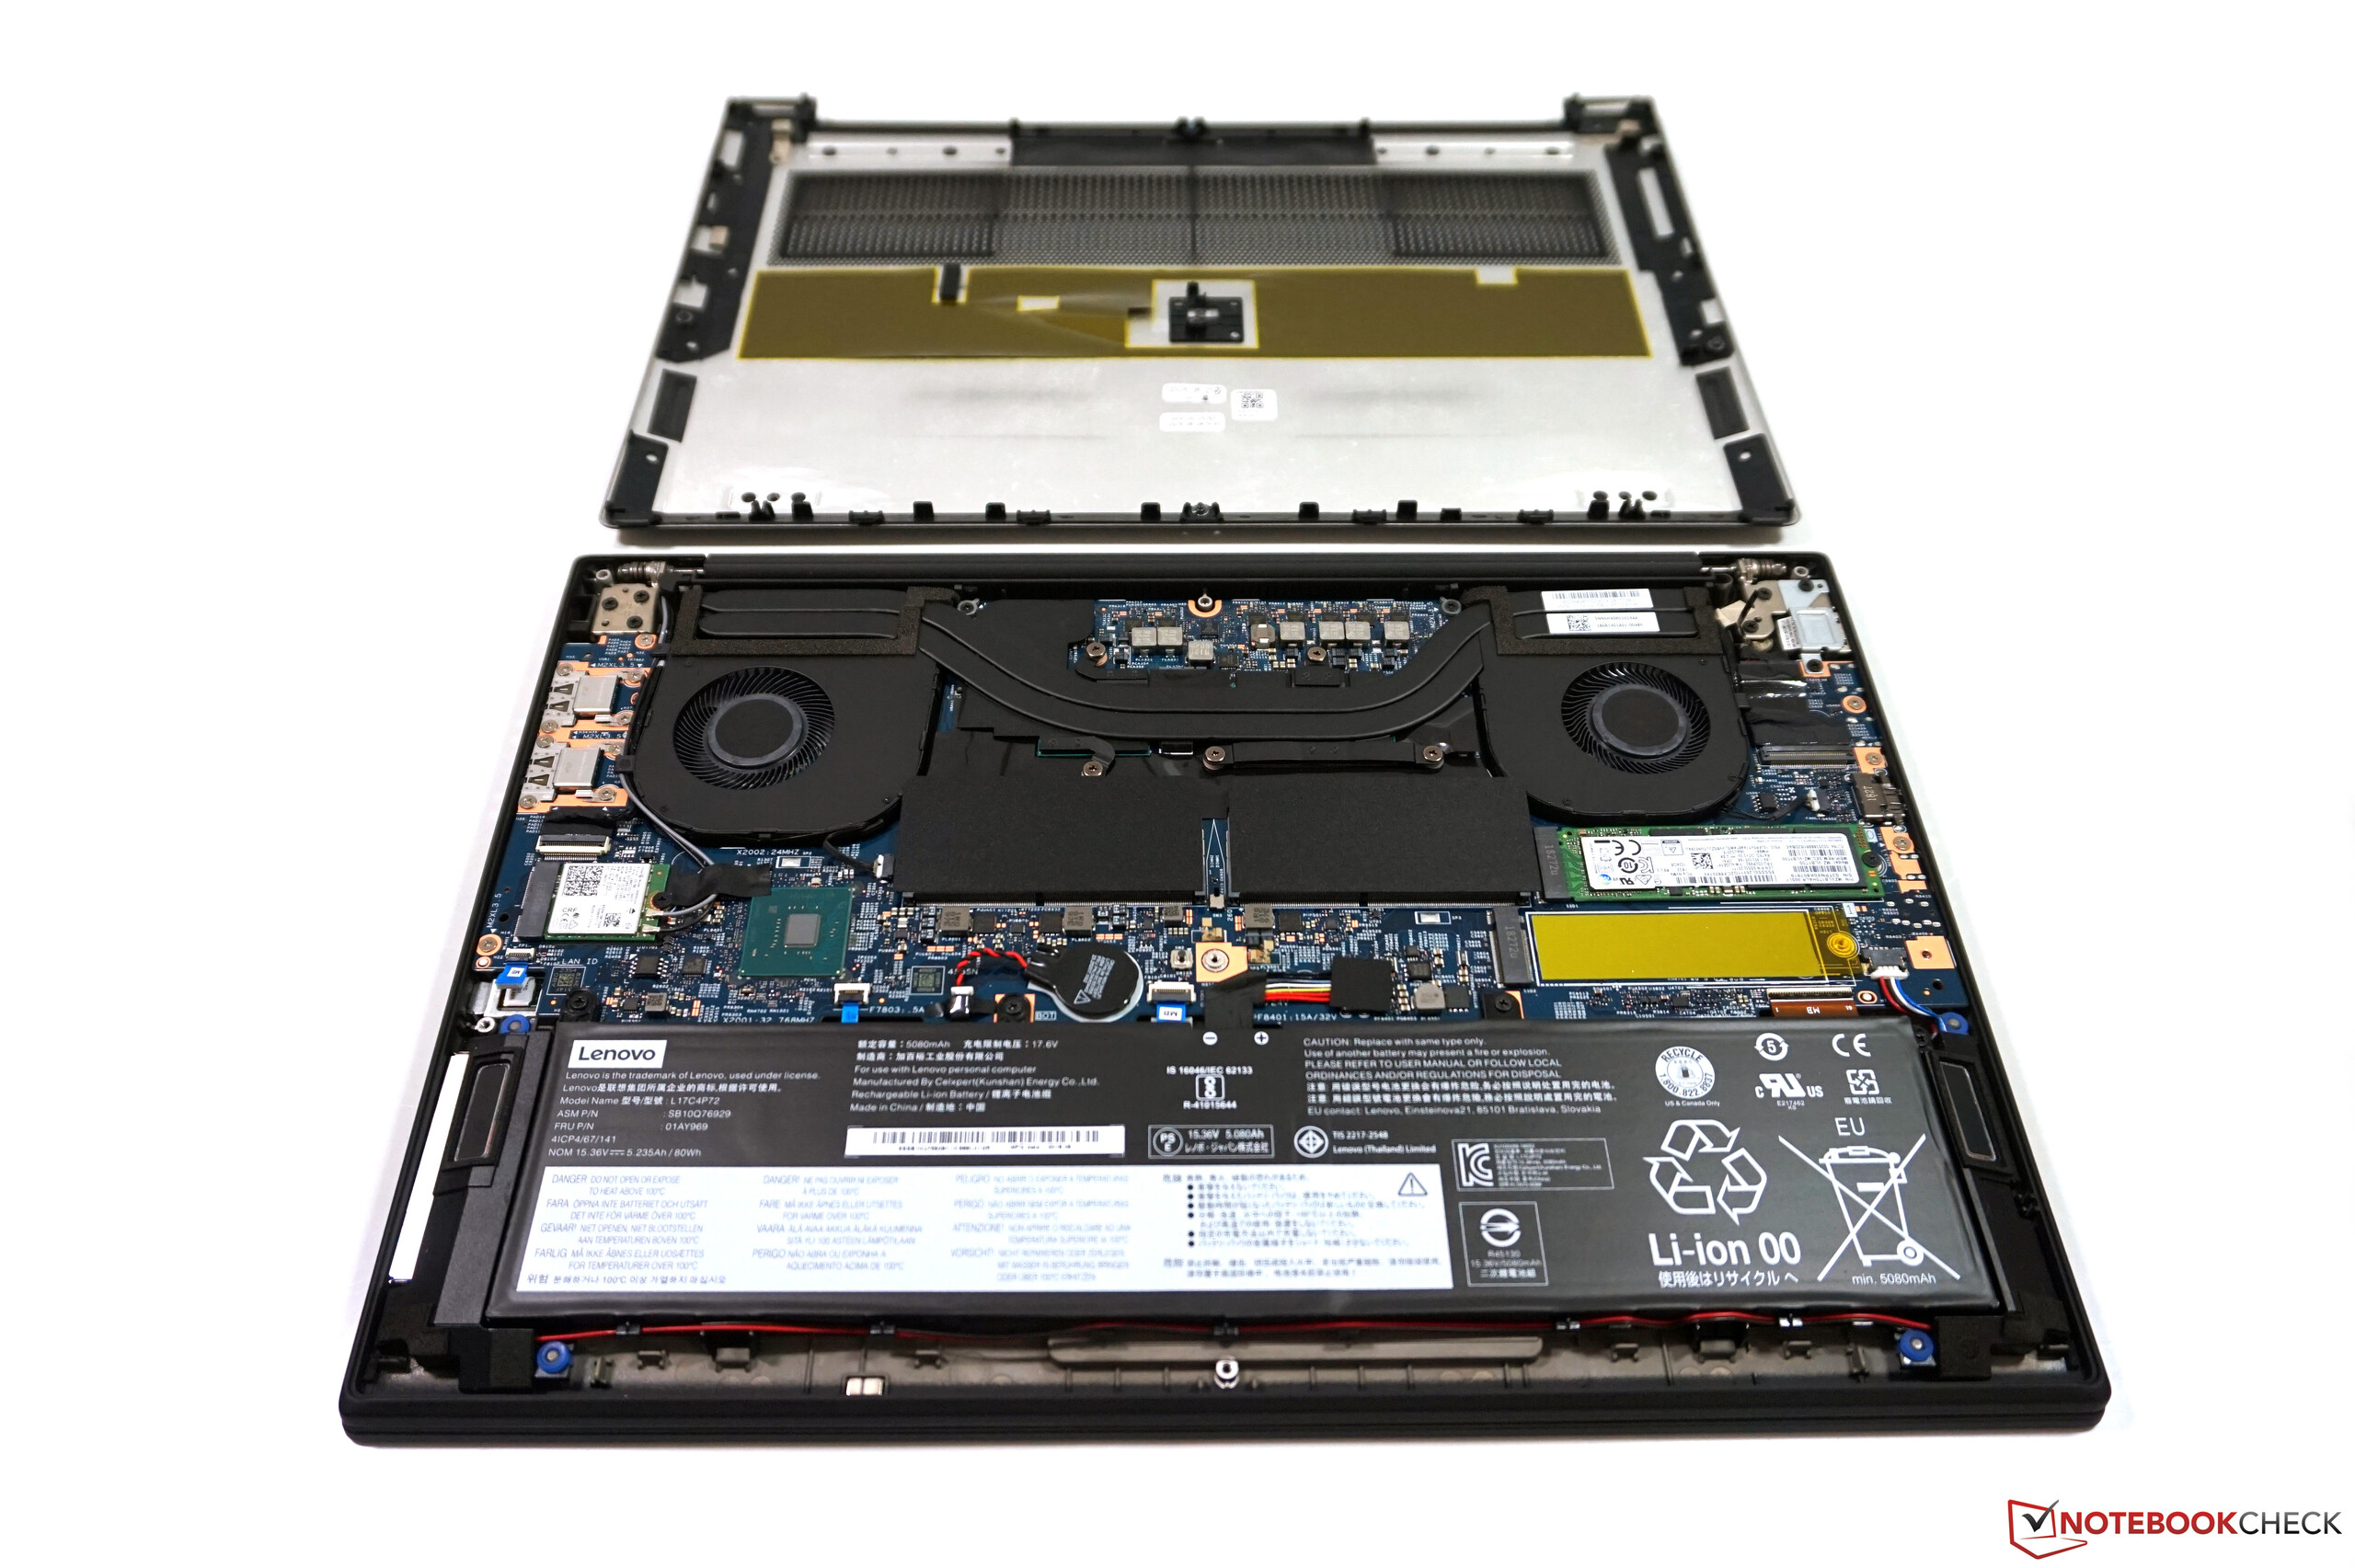
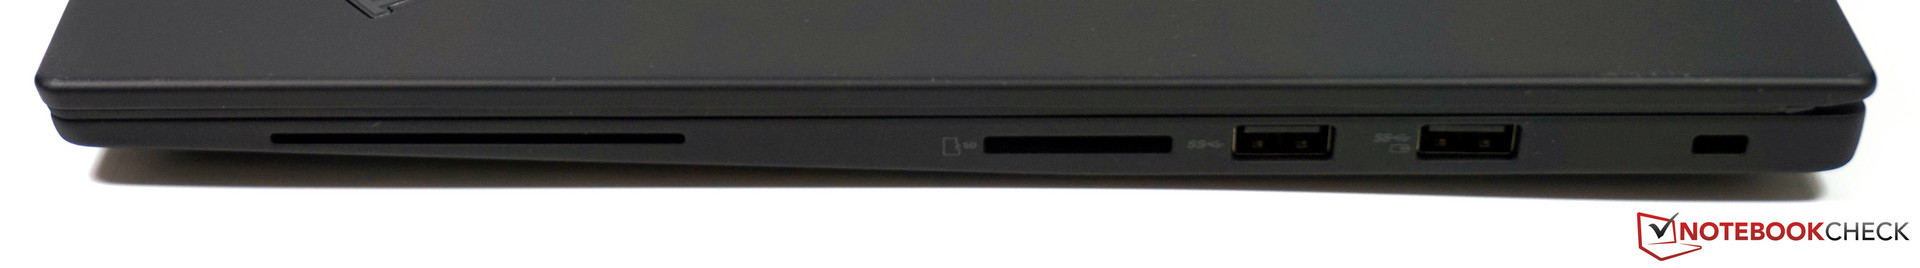
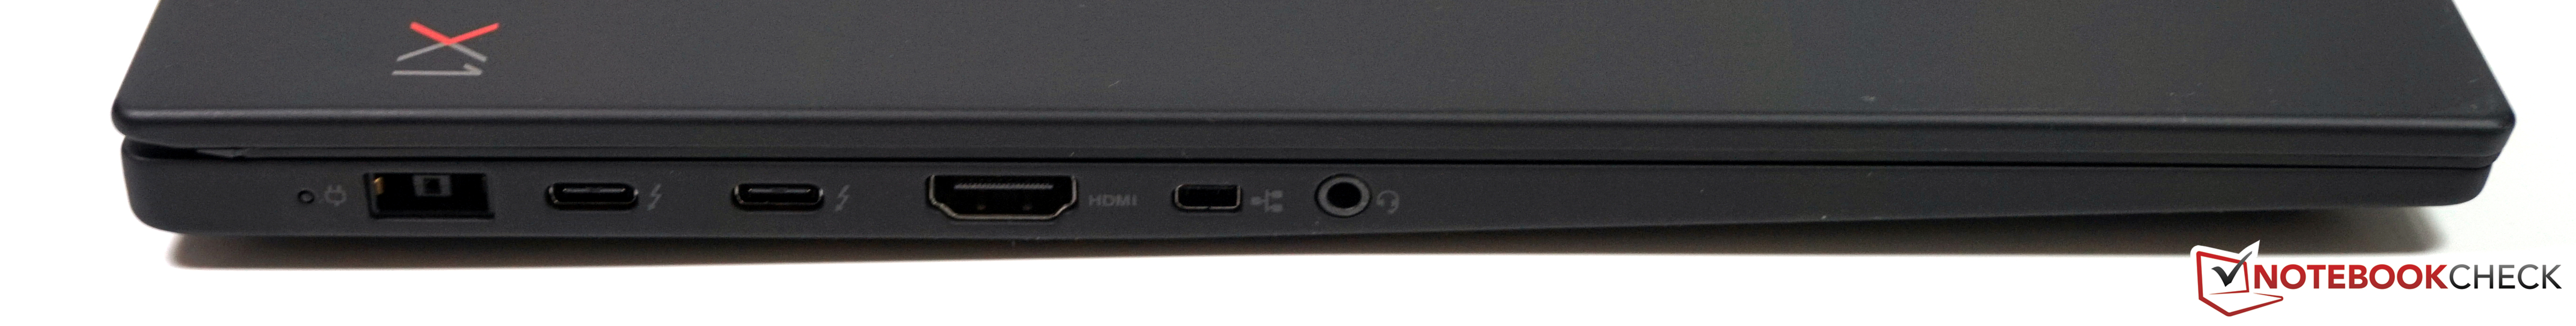
O altamente antecipado ThinkPad X1 Extreme finalmente chegou. O dispositivo já está conosco há alguns dias e terminamos muitos testes. A impressão até agora é bastante positiva. Tem a aparência de um X1 Carbon maior e é definitivamente um ThinkPad. Você obtém um número de portas suficiente, bem como um leitor de cartões SD comuns.
A tela 4K HDR também é muito similar à do irmão menor, tanto em termos de impressão de imagem subjetiva quanto de gama de cores. Ainda assim, gostaríamos de ver uma melhor calibração de fábrica, já que há uma tonalidade azul visível. A superfície da tela muito refletiva é outro problema.
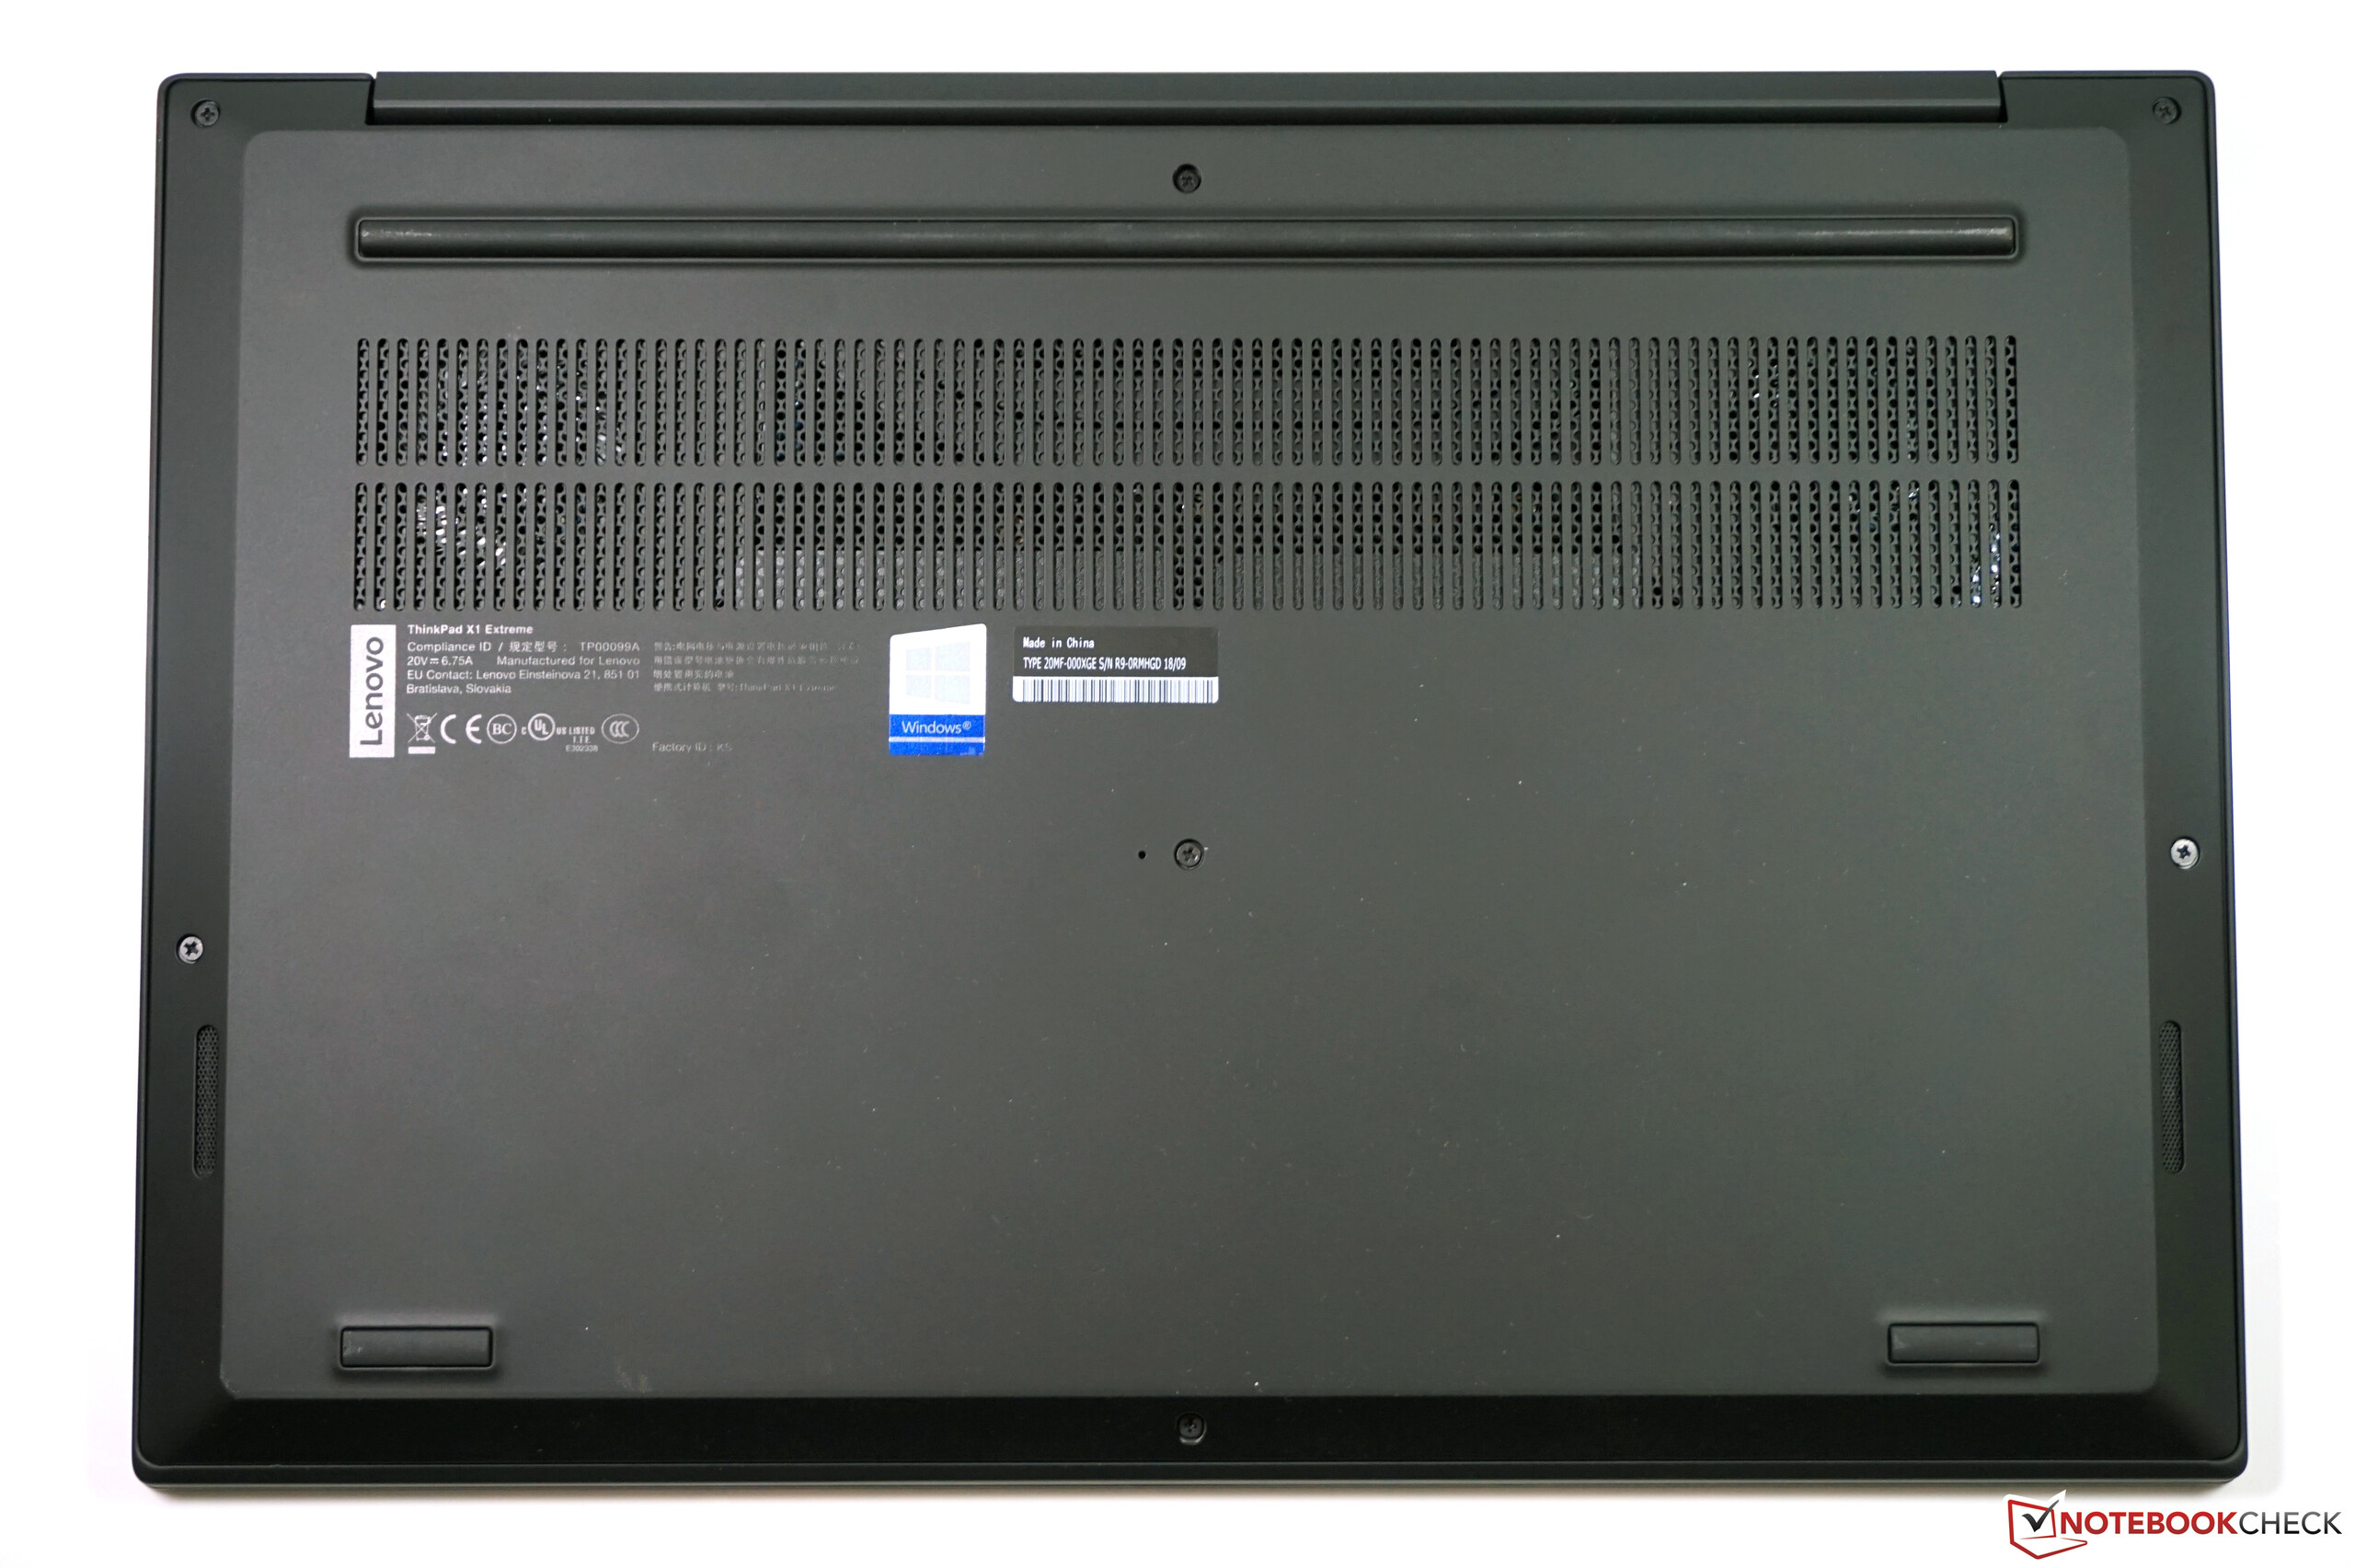
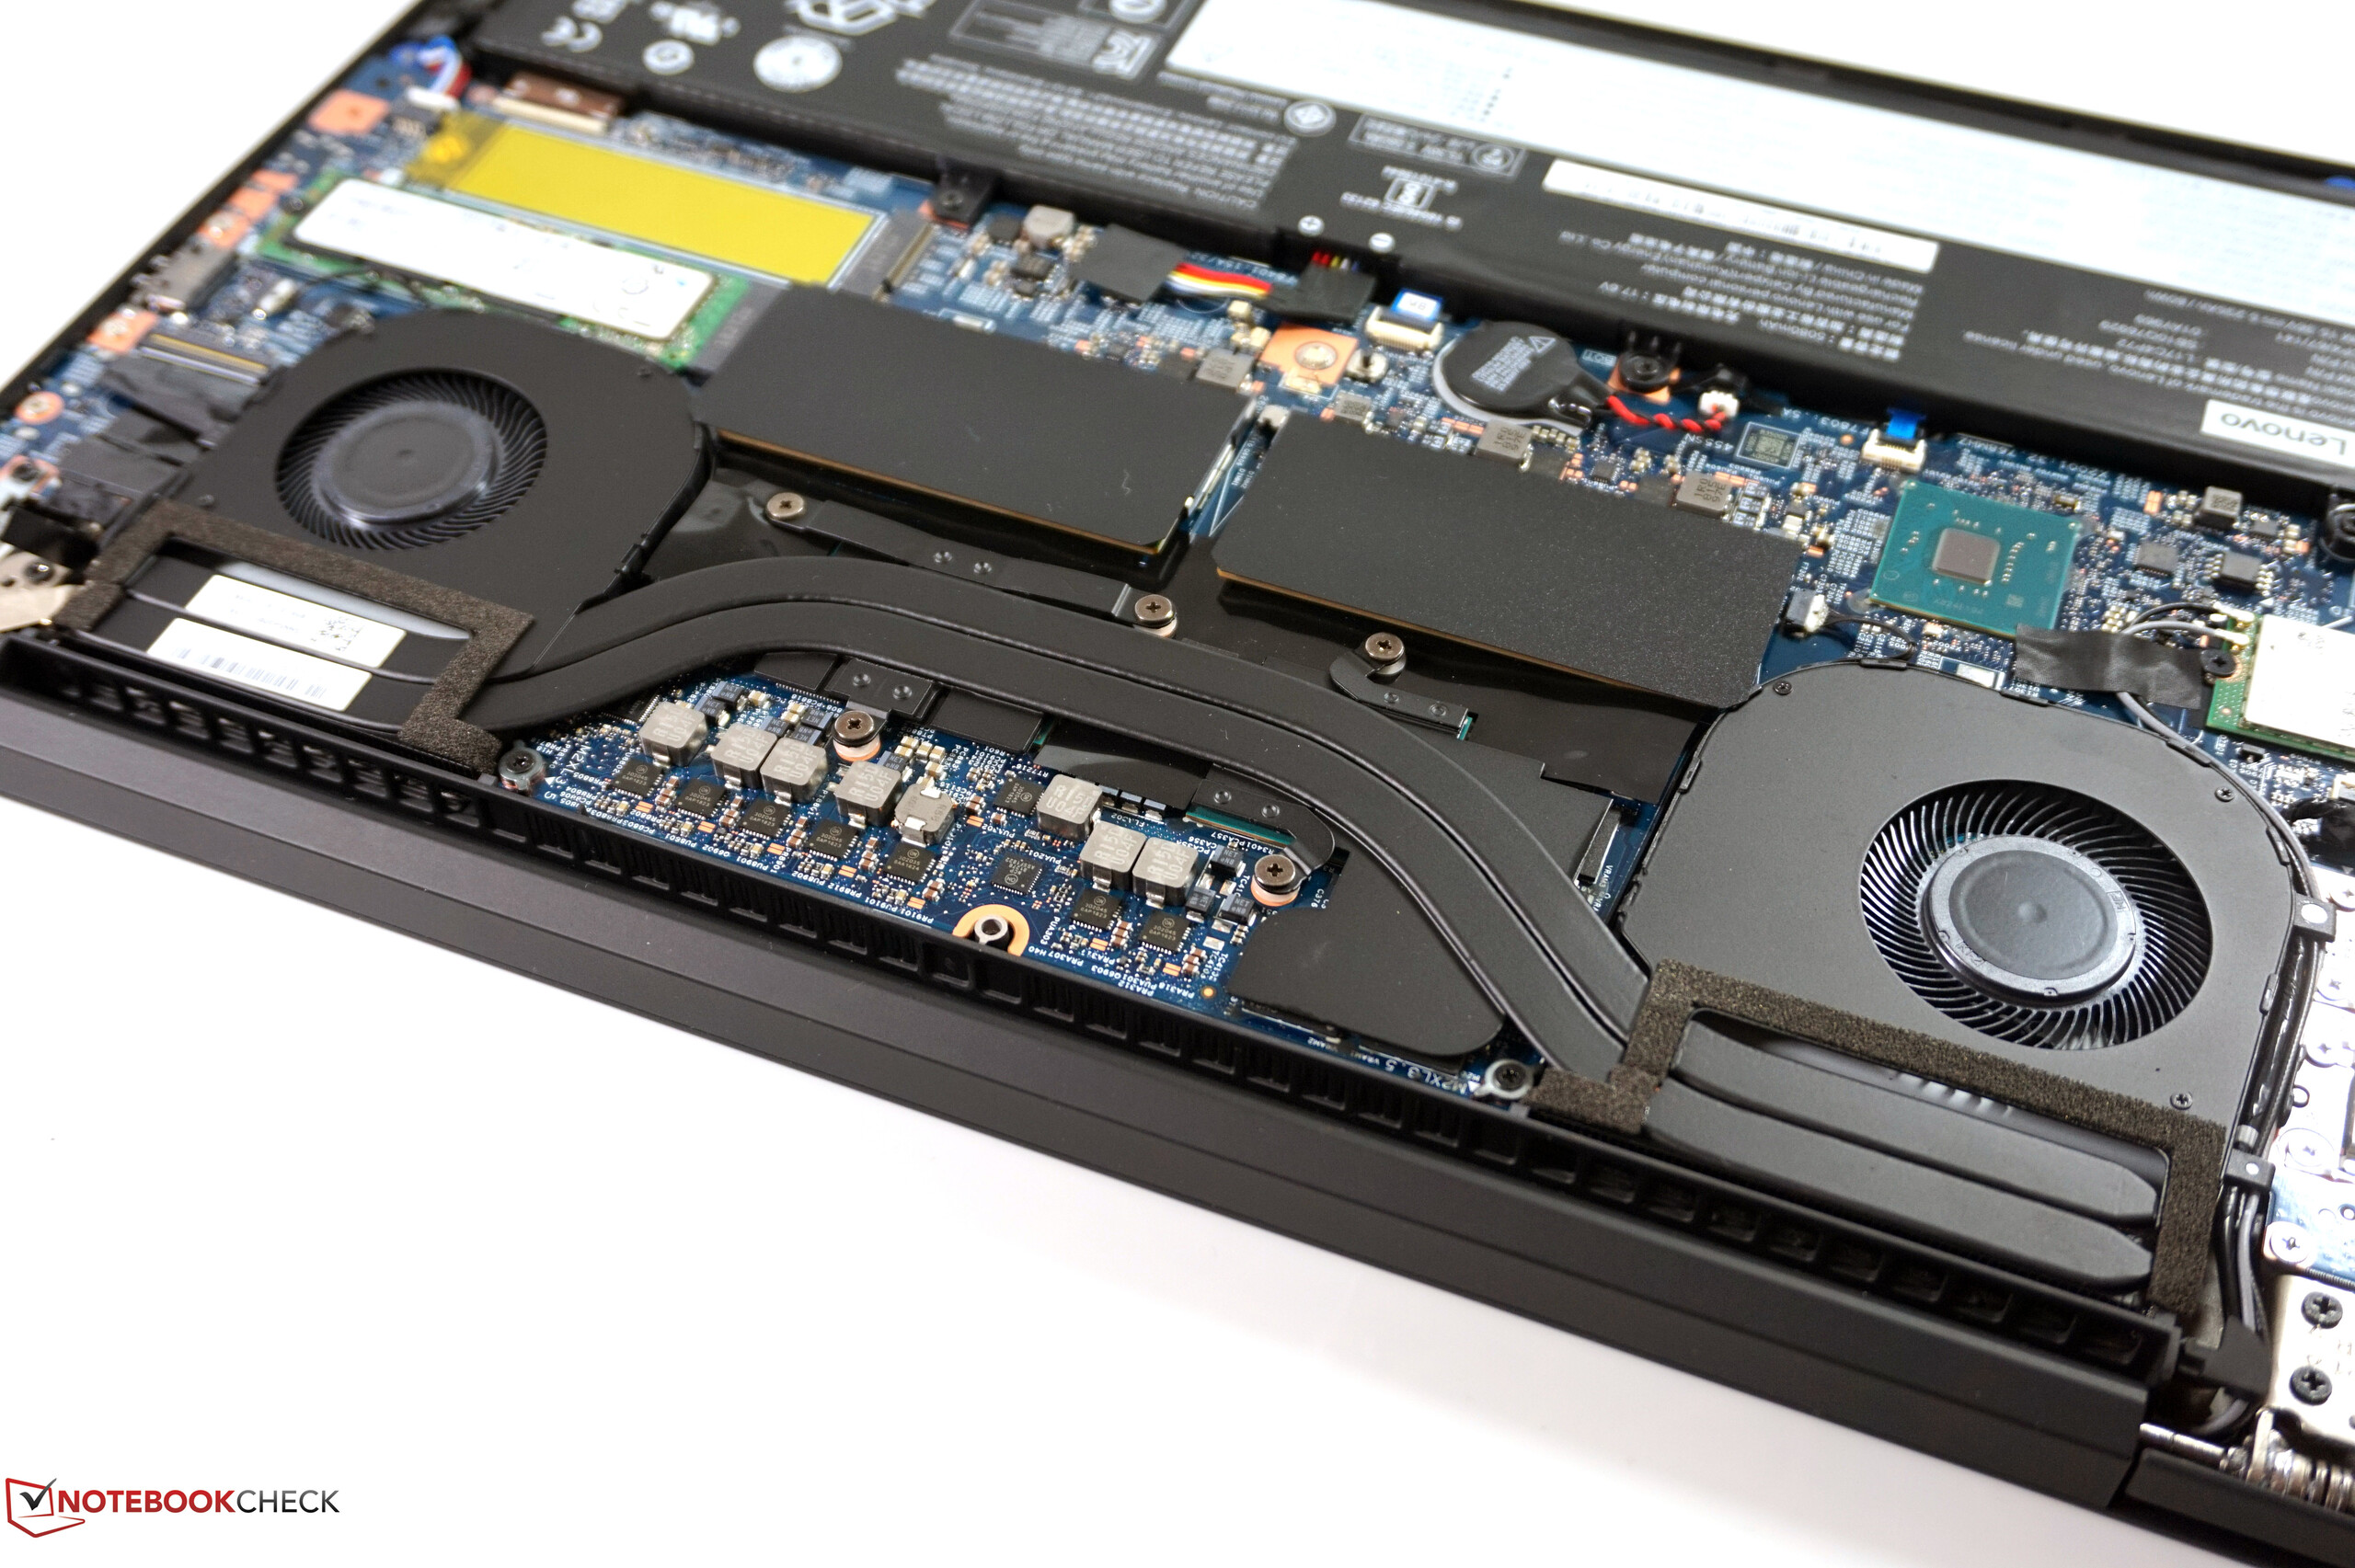
A solução de resfriamento parece ser bem capaz após nossos benchmarks iniciais. Os ventiladores permanecem silenciosos, mas isso afeta as temperaturas da superfície, bem como o desempenho da CPU sob uso intenso. Conseguimos melhorar o desempenho da CPU com alguns ajustes. O dispositivo é de fácil manutenção e você tem dois slots para SSDs M.2. A duração da bateria é preocupante até o momento e, às vezes, é menor que a dos concorrentes.
A próxima atualização abrangerá o novo módulo WLAN, os dispositivos de entrada, a funcionalidade HDR, bem como o consumo de energia.
Price comparison
