Breve Análise do Workstation MSI WS63 7RF (i7-7700HQ, FHD, P3000)
| SD Card Reader | |
| average JPG Copy Test (av. of 3 runs) | |
| Dell Precision 5520 UHD | |
| Lenovo ThinkPad P51 20HH0016GE | |
| MSI WT72-6QM | |
| MSI WS63 7RF-290US | |
| maximum AS SSD Seq Read Test (1GB) | |
| Dell Precision 5520 UHD | |
| Lenovo ThinkPad P51 20HH0016GE | |
| MSI WT72-6QM | |
| MSI WS63 7RF-290US | |
| Networking | |
| iperf3 transmit AX12 | |
| MSI GS63VR 7RF-228US | |
| MSI WS63 7RF-290US | |
| Lenovo ThinkPad P51 20HH0016GE | |
| Dell Precision 5520 UHD | |
| iperf3 receive AX12 | |
| MSI GS63VR 7RF-228US | |
| Lenovo ThinkPad P51 20HH0016GE | |
| MSI WS63 7RF-290US | |
| Dell Precision 5520 UHD | |
| |||||||||||||||||||||||||
iluminação: 92 %
iluminação com acumulador: 302.5 cd/m²
Contraste: 976:1 (Preto: 0.31 cd/m²)
ΔE ColorChecker Calman: 4.3 | ∀{0.5-29.43 Ø4.73}
ΔE Greyscale Calman: 3.1 | ∀{0.09-98 Ø4.97}
84.3% sRGB (Argyll 1.6.3 3D)
55% AdobeRGB 1998 (Argyll 1.6.3 3D)
61.5% AdobeRGB 1998 (Argyll 3D)
84.2% sRGB (Argyll 3D)
63.6% Display P3 (Argyll 3D)
Gamma: 2.16
CCT: 7071 K
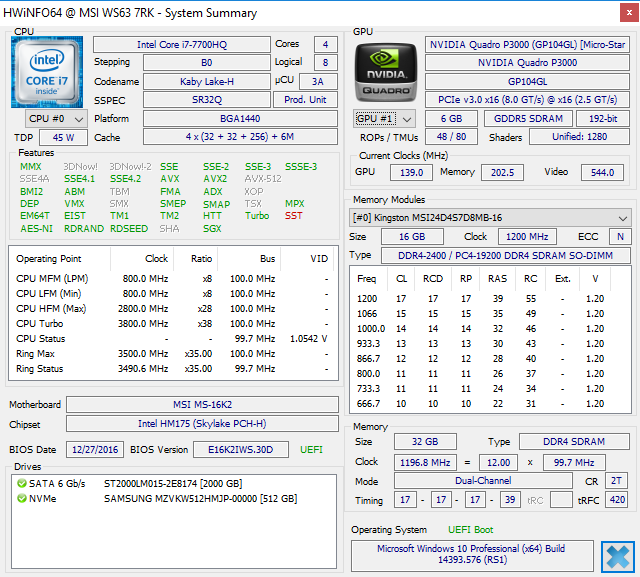
| MSI WS63 7RF-290US ID: LGD046F, Name: LG Philips LP156W6, Dell P/N: 3874Y, IPS, 15.6", 1920x1080 | Lenovo ThinkPad P51 20HH0016GE LEN40BD, B156ZAN02.1, IPS, 15.6", 3840x2160 | Dell Precision 5520 UHD SHP1476, IPS, 15.6", 3840x2160 | Fujitsu Celsius H760 LGD046F LP156WF6-SPP1, IPS LED, 15.6", 1920x1080 | MSI WS60-6QJE316H11 SDC424B, IPS, 15.6", 3840x2160 | |
|---|---|---|---|---|---|
| Display | 38% | 12% | -1% | -7% | |
| Display P3 Coverage (%) | 63.6 | 86.3 36% | 67.4 6% | 63.9 0% | 55.1 -13% |
| sRGB Coverage (%) | 84.2 | 99.5 18% | 98.5 17% | 82.4 -2% | 83 -1% |
| AdobeRGB 1998 Coverage (%) | 61.5 | 99.3 61% | 68.9 12% | 60.3 -2% | 56.9 -7% |
| Response Times | 9% | -41% | 11% | 19% | |
| Response Time Grey 50% / Grey 80% * (ms) | 38 ? | 40.8 ? -7% | 59.2 ? -56% | 38 ? -0% | 34 ? 11% |
| Response Time Black / White * (ms) | 33 ? | 25.2 ? 24% | 41.6 ? -26% | 26 ? 21% | 24 ? 27% |
| PWM Frequency (Hz) | 21740 ? | 1316 ? | |||
| Screen | 15% | 6% | 3% | -10% | |
| Brightness middle (cd/m²) | 302.5 | 317 5% | 372.4 23% | 341 13% | 237 -22% |
| Brightness (cd/m²) | 295 | 309 5% | 368 25% | 310 5% | 208 -29% |
| Brightness Distribution (%) | 92 | 89 -3% | 90 -2% | 82 -11% | 77 -16% |
| Black Level * (cd/m²) | 0.31 | 0.36 -16% | 0.48 -55% | 0.34 -10% | 0.26 16% |
| Contrast (:1) | 976 | 881 -10% | 776 -20% | 1003 3% | 912 -7% |
| Colorchecker dE 2000 * | 4.3 | 2.7 37% | 2.6 40% | 3.8 12% | 4.42 -3% |
| Colorchecker dE 2000 max. * | 9.4 | 4.1 56% | 5.6 40% | 10.8 -15% | 8.54 9% |
| Greyscale dE 2000 * | 3.1 | 3 3% | 3.7 -19% | 2 35% | 4.43 -43% |
| Gamma | 2.16 102% | 2.27 97% | 2.14 103% | 2.17 101% | 2.23 99% |
| CCT | 7071 92% | 6077 107% | 7096 92% | 6581 99% | 6133 106% |
| Color Space (Percent of AdobeRGB 1998) (%) | 55 | 87.6 59% | 63 15% | 54 -2% | 52.5 -5% |
| Color Space (Percent of sRGB) (%) | 84.3 | 99.5 18% | 99 17% | 82.2 -2% | 82.9 -2% |
| Média Total (Programa/Configurações) | 21% /
19% | -8% /
1% | 4% /
3% | 1% /
-6% |
* ... menor é melhor
Exibir tempos de resposta
| ↔ Tempo de resposta preto para branco | ||
|---|---|---|
| 33 ms ... ascensão ↗ e queda ↘ combinadas | ↗ 20 ms ascensão | 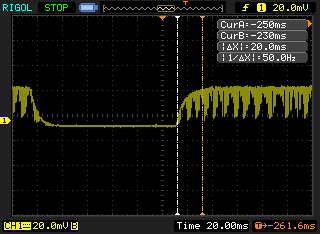 |
| ↘ 13 ms queda | ||
| A tela mostra taxas de resposta lentas em nossos testes e será insatisfatória para os jogadores. Em comparação, todos os dispositivos testados variam de 0.1 (mínimo) a 240 (máximo) ms. » 89 % de todos os dispositivos são melhores. Isso significa que o tempo de resposta medido é pior que a média de todos os dispositivos testados (19.9 ms). | ||
| ↔ Tempo de resposta 50% cinza a 80% cinza | ||
| 38 ms ... ascensão ↗ e queda ↘ combinadas | ↗ 20 ms ascensão | 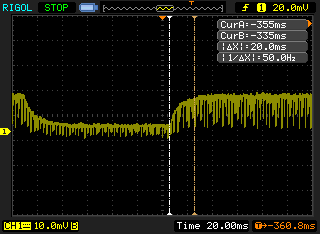 |
| ↘ 18 ms queda | ||
| A tela mostra taxas de resposta lentas em nossos testes e será insatisfatória para os jogadores. Em comparação, todos os dispositivos testados variam de 0.165 (mínimo) a 636 (máximo) ms. » 55 % de todos os dispositivos são melhores. Isso significa que o tempo de resposta medido é pior que a média de todos os dispositivos testados (31.1 ms). | ||
Cintilação da tela / PWM (modulação por largura de pulso)
| Tela tremeluzindo/PWM detectado | 21740 Hz | ≤ 100 % configuração de brilho | 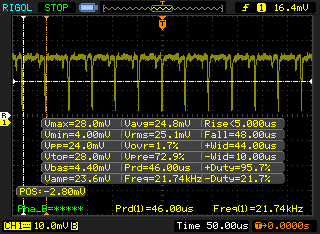 |
A luz de fundo da tela pisca em 21740 Hz (pior caso, por exemplo, utilizando PWM) Cintilação detectada em uma configuração de brilho de 100 % e abaixo. Não deve haver cintilação ou PWM acima desta configuração de brilho. A frequência de 21740 Hz é bastante alta, então a maioria dos usuários sensíveis ao PWM não deve notar nenhuma oscilação. [pwm_comparison] Em comparação: 52 % de todos os dispositivos testados não usam PWM para escurecer a tela. Se PWM foi detectado, uma média de 7798 (mínimo: 5 - máximo: 343500) Hz foi medida. | |||
| Cinebench R15 | |
| CPU Single 64Bit | |
| Dell Precision 5520 UHD | |
| Lenovo ThinkPad P71-20HK0004GE | |
| MSI GS63VR 7RF-228US | |
| MSI WS63 7RF-290US | |
| MSI WS60 6QJ-535VPL | |
| MSI GE62 2QC-468XPL | |
| MSI GE72VR-6RF16H21 | |
| Nvidia Titan X (Pascal) | |
| CPU Multi 64Bit | |
| Nvidia Titan X (Pascal) | |
| Lenovo ThinkPad P71-20HK0004GE | |
| MSI WS63 7RF-290US | |
| MSI GS63VR 7RF-228US | |
| MSI GE62 2QC-468XPL | |
| MSI GE72VR-6RF16H21 | |
| MSI WS60 6QJ-535VPL | |
| Dell Precision 5520 UHD | |
| Cinebench R11.5 | |
| CPU Single 64Bit | |
| Dell Precision 5520 UHD | |
| Lenovo ThinkPad P71-20HK0004GE | |
| MSI WS63 7RF-290US | |
| MSI GS63VR 7RF-228US | |
| MSI GE62 2QC-468XPL | |
| MSI GE72VR-6RF16H21 | |
| Nvidia Titan X (Pascal) | |
| CPU Multi 64Bit | |
| Nvidia Titan X (Pascal) | |
| Lenovo ThinkPad P71-20HK0004GE | |
| MSI GS63VR 7RF-228US | |
| MSI WS63 7RF-290US | |
| MSI GE62 2QC-468XPL | |
| Dell Precision 5520 UHD | |
| MSI GE72VR-6RF16H21 | |
| Cinebench R10 | |
| Rendering Multiple CPUs 32Bit | |
| Nvidia Titan X (Pascal) | |
| Lenovo ThinkPad P71-20HK0004GE | |
| MSI WS63 7RF-290US | |
| MSI GS63VR 7RF-228US | |
| MSI GE62 2QC-468XPL | |
| MSI GE72VR-6RF16H21 | |
| Rendering Single 32Bit | |
| Lenovo ThinkPad P71-20HK0004GE | |
| MSI WS63 7RF-290US | |
| MSI GS63VR 7RF-228US | |
| MSI GE62 2QC-468XPL | |
| MSI GE72VR-6RF16H21 | |
| Nvidia Titan X (Pascal) | |
| wPrime 2.10 - 1024m | |
| MSI WS60 6QJ-535VPL | |
| Dell Precision 5520 UHD | |
| MSI GS63VR 7RF-228US | |
| MSI WS63 7RF-290US | |
| MSI GE62 2QC-468XPL | |
* ... menor é melhor
| PCMark 8 | |
| Home Score Accelerated v2 | |
| EVGA SC15 | |
| MSI WS63 7RF-290US | |
| Lenovo ThinkPad P51 20HH0016GE | |
| MSI WS60-6QJE316H11 | |
| Work Score Accelerated v2 | |
| EVGA SC15 | |
| MSI WS63 7RF-290US | |
| Lenovo ThinkPad P51 20HH0016GE | |
| MSI WS60-6QJE316H11 | |
| Creative Score Accelerated v2 | |
| EVGA SC15 | |
| Lenovo ThinkPad P51 20HH0016GE | |
| MSI WS63 7RF-290US | |
| PCMark 8 Home Score Accelerated v2 | 4284 pontos | |
| PCMark 8 Creative Score Accelerated v2 | 5348 pontos | |
| PCMark 8 Work Score Accelerated v2 | 5331 pontos | |
Ajuda | ||
| MSI WS63 7RF-290US Samsung SM961 MZVKW512HMJP m.2 PCI-e | MSI WS60 6QJ-535VPL 2x Plextor PX512M6GV-2280 (RAID 0) | Lenovo ThinkPad P51 20HH0016GE Samsung PM961 NVMe MZVLW512HMJP | Dell Precision 5520 UHD Samsung SM961 MZVKW512HMJP m.2 PCI-e | Fujitsu Celsius H760 Samsung SM951 MZVPV512 m.2 PCI-e | |
|---|---|---|---|---|---|
| AS SSD | -55% | -4% | -1% | -17% | |
| Copy Game MB/s (MB/s) | 1121 | 1140 2% | 921 -18% | 978 -13% | |
| Copy Program MB/s (MB/s) | 447.3 | 425.6 -5% | 372.8 -17% | 571 28% | |
| Copy ISO MB/s (MB/s) | 1760 | 1607 -9% | 1659 -6% | 1325 -25% | |
| Score Total (Points) | 3759 | 1392 -63% | 3424 -9% | 3681 -2% | 2201 -41% |
| Score Write (Points) | 1440 | 543 -62% | 917 -36% | 1379 -4% | 623 -57% |
| Score Read (Points) | 1568 | 557 -64% | 1690 8% | 1554 -1% | 1048 -33% |
| Access Time Write * (ms) | 0.028 | 0.041 -46% | 0.025 11% | 0.023 18% | 0.018 36% |
| Access Time Read * (ms) | 0.036 | 0.054 -50% | 0.032 11% | 0.038 -6% | 0.036 -0% |
| 4K-64 Write (MB/s) | 1151 | 375.8 -67% | 623 -46% | 1055 -8% | 285 -75% |
| 4K-64 Read (MB/s) | 1244 | 437.1 -65% | 1372 10% | 1223 -2% | 801 -36% |
| 4K Write (MB/s) | 128.5 | 85 -34% | 143.1 11% | 155.3 21% | 188 46% |
| 4K Read (MB/s) | 49.02 | 32.19 -34% | 55.6 13% | 51.5 5% | 34 -31% |
| Seq Write (MB/s) | 1603 | 821 -49% | 1506 -6% | 1694 6% | 1492 -7% |
| Seq Read (MB/s) | 2750 | 880 -68% | 2624 -5% | 2799 2% | 1916 -30% |
* ... menor é melhor

| 3DMark | |
| 1920x1080 Fire Strike Graphics | |
| Desktop PC Intel Xeon E5 2680v4 KFA2 GTX 1060 6GB | |
| Fujitsu Celsius H970 | |
| Asus Strix GL502VY-DS71 | |
| MSI WS63 7RF-290US | |
| MSI WT72-6QM | |
| Lenovo ThinkPad P71-20HK0004GE | |
| Lenovo ThinkPad P70-20ER000XUS | |
| HP ZBook 17 G3 TZV66eA | |
| Fujitsu Celsius H760 | |
| Fire Strike Extreme Graphics | |
| Desktop PC Intel Xeon E5 2680v4 KFA2 GTX 1060 6GB | |
| Fujitsu Celsius H970 | |
| Asus Strix GL502VY-DS71 | |
| MSI WS63 7RF-290US | |
| MSI WT72-6QM | |
| Lenovo ThinkPad P71-20HK0004GE | |
| Lenovo ThinkPad P70-20ER000XUS | |
| 3DMark 11 | |
| 1280x720 Performance GPU | |
| Desktop PC Intel Xeon E5 2680v4 KFA2 GTX 1060 6GB | |
| Fujitsu Celsius H970 | |
| Asus Strix GL502VY-DS71 | |
| MSI WS63 7RF-290US | |
| MSI WT72-6QM | |
| Lenovo ThinkPad P71-20HK0004GE | |
| Lenovo ThinkPad P70-20ER000XUS | |
| HP ZBook 17 G3 TZV66eA | |
| 1280x720 Performance Combined | |
| Desktop PC Intel Xeon E5 2680v4 KFA2 GTX 1060 6GB | |
| Lenovo ThinkPad P71-20HK0004GE | |
| MSI WT72-6QM | |
| MSI WS63 7RF-290US | |
| HP ZBook 17 G3 TZV66eA | |
| Asus Strix GL502VY-DS71 | |
| Lenovo ThinkPad P70-20ER000XUS | |
| Fujitsu Celsius H970 | |
| Rise of the Tomb Raider - 1920x1080 Very High Preset AA:FX AF:16x | |
| EVGA SC15 | |
| Asus Strix GL502VY-DS71 | |
| MSI WS63 7RF-290US | |
| Lenovo ThinkPad P70-20ER000XUS | |
| Asus GL753VE-DS74 | |
| HP ZBook 17 G3 TZV66eA | |
| HP Pavilion 15 Power 1GK62AV | |
| baixo | média | alto | ultra | |
|---|---|---|---|---|
| BioShock Infinite (2013) | 92.1 | |||
| Metro: Last Light (2013) | 67.5 | |||
| Thief (2014) | 65 | |||
| The Witcher 3 (2015) | 66 | 33 | ||
| Batman: Arkham Knight (2015) | 73 | 49 | ||
| Metal Gear Solid V (2015) | 60 | |||
| Fallout 4 (2015) | 51.9 | |||
| Rise of the Tomb Raider (2016) | 53.6 | |||
| Ashes of the Singularity (2016) | 52.5 | 47.8 | ||
| Doom (2016) | 73 | |||
| Overwatch (2016) | 89.9 | |||
| Mafia 3 (2016) | 36.5 | |||
| Prey (2017) | 89.3 |
Barulho
| Ocioso |
| 28.1 / 28.1 / 32 dB |
| Carga |
| 38 / 47.2 dB |
 | ||
30 dB silencioso 40 dB(A) audível 50 dB(A) ruidosamente alto |
||
min: | ||
| MSI WS63 7RF-290US Quadro P3000, i7-7700HQ, Samsung SM961 MZVKW512HMJP m.2 PCI-e | Lenovo ThinkPad P51 20HH0016GE Quadro M2200, E3-1505M v6, Samsung PM961 NVMe MZVLW512HMJP | Dell Precision 5520 UHD Quadro M1200, E3-1505M v6, Samsung SM961 MZVKW512HMJP m.2 PCI-e | MSI WS60-6QJE316H11 Quadro M2000M, E3-1505M v5, Toshiba NVMe THNSN5128GP | HP ZBook 15 G3 Quadro M2000M, E3-1505M v5, Samsung SM951 MZVPV512HDGL m.2 PCI-e | Fujitsu Celsius H760 Quadro M2000M, E3-1505M v5, Samsung SM951 MZVPV512 m.2 PCI-e | |
|---|---|---|---|---|---|---|
| Noise | 5% | -7% | -20% | -7% | -3% | |
| desligado / ambiente * (dB) | 28.1 | 29.6 -5% | 28.7 -2% | 30 -7% | 29 -3% | |
| Idle Minimum * (dB) | 28.1 | 29.6 -5% | 28.7 -2% | 37.2 -32% | 30 -7% | 29 -3% |
| Idle Average * (dB) | 28.1 | 29.6 -5% | 32.1 -14% | 37.2 -32% | 30 -7% | 29 -3% |
| Idle Maximum * (dB) | 32 | 29.6 7% | 32.1 -0% | 37.2 -16% | 30 6% | 29 9% |
| Load Average * (dB) | 38 | 32.2 15% | 41.3 -9% | 42.1 -11% | 45.3 -19% | 43.1 -13% |
| Witcher 3 ultra * (dB) | 35.8 | 45.5 -27% | ||||
| Load Maximum * (dB) | 47.2 | 36.6 22% | 45.5 4% | 50.7 -7% | 49.7 -5% | 49.2 -4% |
* ... menor é melhor
(-) A temperatura máxima no lado superior é 46.4 °C / 116 F, em comparação com a média de 38.2 °C / 101 F , variando de 22.2 a 69.8 °C para a classe Workstation.
(-) A parte inferior aquece até um máximo de 62 °C / 144 F, em comparação com a média de 41.1 °C / 106 F
(+) Em uso inativo, a temperatura média para o lado superior é 27.2 °C / 81 F, em comparação com a média do dispositivo de 32 °C / ### class_avg_f### F.
(±) Jogando The Witcher 3, a temperatura média para o lado superior é 36.2 °C / 97 F, em comparação com a média do dispositivo de 32 °C / ## #class_avg_f### F.
(±) Os apoios para as mãos e o touchpad podem ficar muito quentes ao toque, com um máximo de 36.4 °C / 97.5 F.
(-) A temperatura média da área do apoio para as mãos de dispositivos semelhantes foi 27.8 °C / 82 F (-8.6 °C / -15.5 F).
MSI WS63 7RF-290US análise de áudio
(-) | alto-falantes não muito altos (###valor### dB)
Graves 100 - 315Hz
(-) | quase nenhum baixo - em média 17.1% menor que a mediana
(±) | a linearidade dos graves é média (11.9% delta para a frequência anterior)
Médios 400 - 2.000 Hz
(±) | médios mais altos - em média 6.4% maior que a mediana
(-) | médios não são lineares (15.4% delta para frequência anterior)
Altos 2 - 16 kHz
(+) | agudos equilibrados - apenas 4.8% longe da mediana
(±) | a linearidade dos máximos é média (10.8% delta para frequência anterior)
Geral 100 - 16.000 Hz
(-) | o som geral não é linear (35.1% diferença em relação à mediana)
Comparado com a mesma classe
» 99% de todos os dispositivos testados nesta classe foram melhores, 1% semelhantes, 0% piores
» O melhor teve um delta de 7%, a média foi 17%, o pior foi 35%
Comparado com todos os dispositivos testados
» 93% de todos os dispositivos testados foram melhores, 1% semelhantes, 6% piores
» O melhor teve um delta de 4%, a média foi 24%, o pior foi 134%
Apple MacBook 12 (Early 2016) 1.1 GHz análise de áudio
(+) | os alto-falantes podem tocar relativamente alto (###valor### dB)
Graves 100 - 315Hz
(±) | graves reduzidos - em média 11.3% menor que a mediana
(±) | a linearidade dos graves é média (14.2% delta para a frequência anterior)
Médios 400 - 2.000 Hz
(+) | médios equilibrados - apenas 2.4% longe da mediana
(+) | médios são lineares (5.5% delta para frequência anterior)
Altos 2 - 16 kHz
(+) | agudos equilibrados - apenas 2% longe da mediana
(+) | os máximos são lineares (4.5% delta da frequência anterior)
Geral 100 - 16.000 Hz
(+) | o som geral é linear (10.2% diferença em relação à mediana)
Comparado com a mesma classe
» 7% de todos os dispositivos testados nesta classe foram melhores, 2% semelhantes, 91% piores
» O melhor teve um delta de 5%, a média foi 18%, o pior foi 53%
Comparado com todos os dispositivos testados
» 5% de todos os dispositivos testados foram melhores, 1% semelhantes, 94% piores
» O melhor teve um delta de 4%, a média foi 24%, o pior foi 134%
| desligado | |
| Ocioso | |
| Carga |
|
Key:
min: | |
| MSI WS63 7RF-290US i7-7700HQ, Quadro P3000, Samsung SM961 MZVKW512HMJP m.2 PCI-e, IPS, 1920x1080, 15.6" | MSI WS60-6QJE316H11 E3-1505M v5, Quadro M2000M, Toshiba NVMe THNSN5128GP, IPS, 3840x2160, 15.6" | EVGA SC15 i7-7700HQ, GeForce GTX 1060 Mobile, Toshiba NVMe THNSN5256GPU7, , 1920x1080, 15.6" | HP ZBook 17 G3 TZV66eA E3-1535M v5, Quadro M3000M, Samsung SM951 MZVPV256HDGL m.2 PCI-e, IPS, 1920x1080, 17.3" | MSI WT72-6QM E3-1505M v5, Quadro M5000M, Toshiba NVMe THNSN5256GPU7, IPS, 1920x1080, 17.3" | |
|---|---|---|---|---|---|
| Power Consumption | -59% | -57% | -0% | -79% | |
| Idle Minimum * (Watt) | 11 | 18.8 -71% | 25.8 -135% | 6.7 39% | 24.8 -125% |
| Idle Average * (Watt) | 14.2 | 29.6 -108% | 26.6 -87% | 12.5 12% | 29.7 -109% |
| Idle Maximum * (Watt) | 14.6 | 30.3 -108% | 26.7 -83% | 13.2 10% | 30.1 -106% |
| Load Average * (Watt) | 77.7 | 90.4 -16% | 80.3 -3% | 128.2 -65% | 105.2 -35% |
| Witcher 3 ultra * (Watt) | 89.1 | 121.2 -36% | |||
| Load Maximum * (Watt) | 161.7 | 150.2 7% | 159.3 1% | 158.9 2% | 192.2 -19% |
* ... menor é melhor
| MSI WS63 7RF-290US i7-7700HQ, Quadro P3000, 65 Wh | MSI WS60-6QJE316H11 E3-1505M v5, Quadro M2000M, 47 Wh | Lenovo ThinkPad P51 20HH0016GE E3-1505M v6, Quadro M2200, 90 Wh | Dell Precision 5520 UHD E3-1505M v6, Quadro M1200, 97 Wh | MSI WT72-6QM E3-1505M v5, Quadro M5000M, Wh | HP ZBook 15 G3 E3-1505M v5, Quadro M2000M, 90 Wh | |
|---|---|---|---|---|---|---|
| Duração da bateria | -50% | 70% | 14% | -3% | 60% | |
| Reader / Idle (h) | 7.1 | 2.7 -62% | 16.4 131% | 12.1 70% | 6.9 -3% | 13.7 93% |
| WiFi v1.3 (h) | 4.7 | 1.8 -62% | 6.9 47% | 4.2 -11% | 4.1 -13% | 6.4 36% |
| Load (h) | 1.2 | 0.9 -25% | 1.6 33% | 1 -17% | 1.3 8% | 1.8 50% |
Pro
Contra
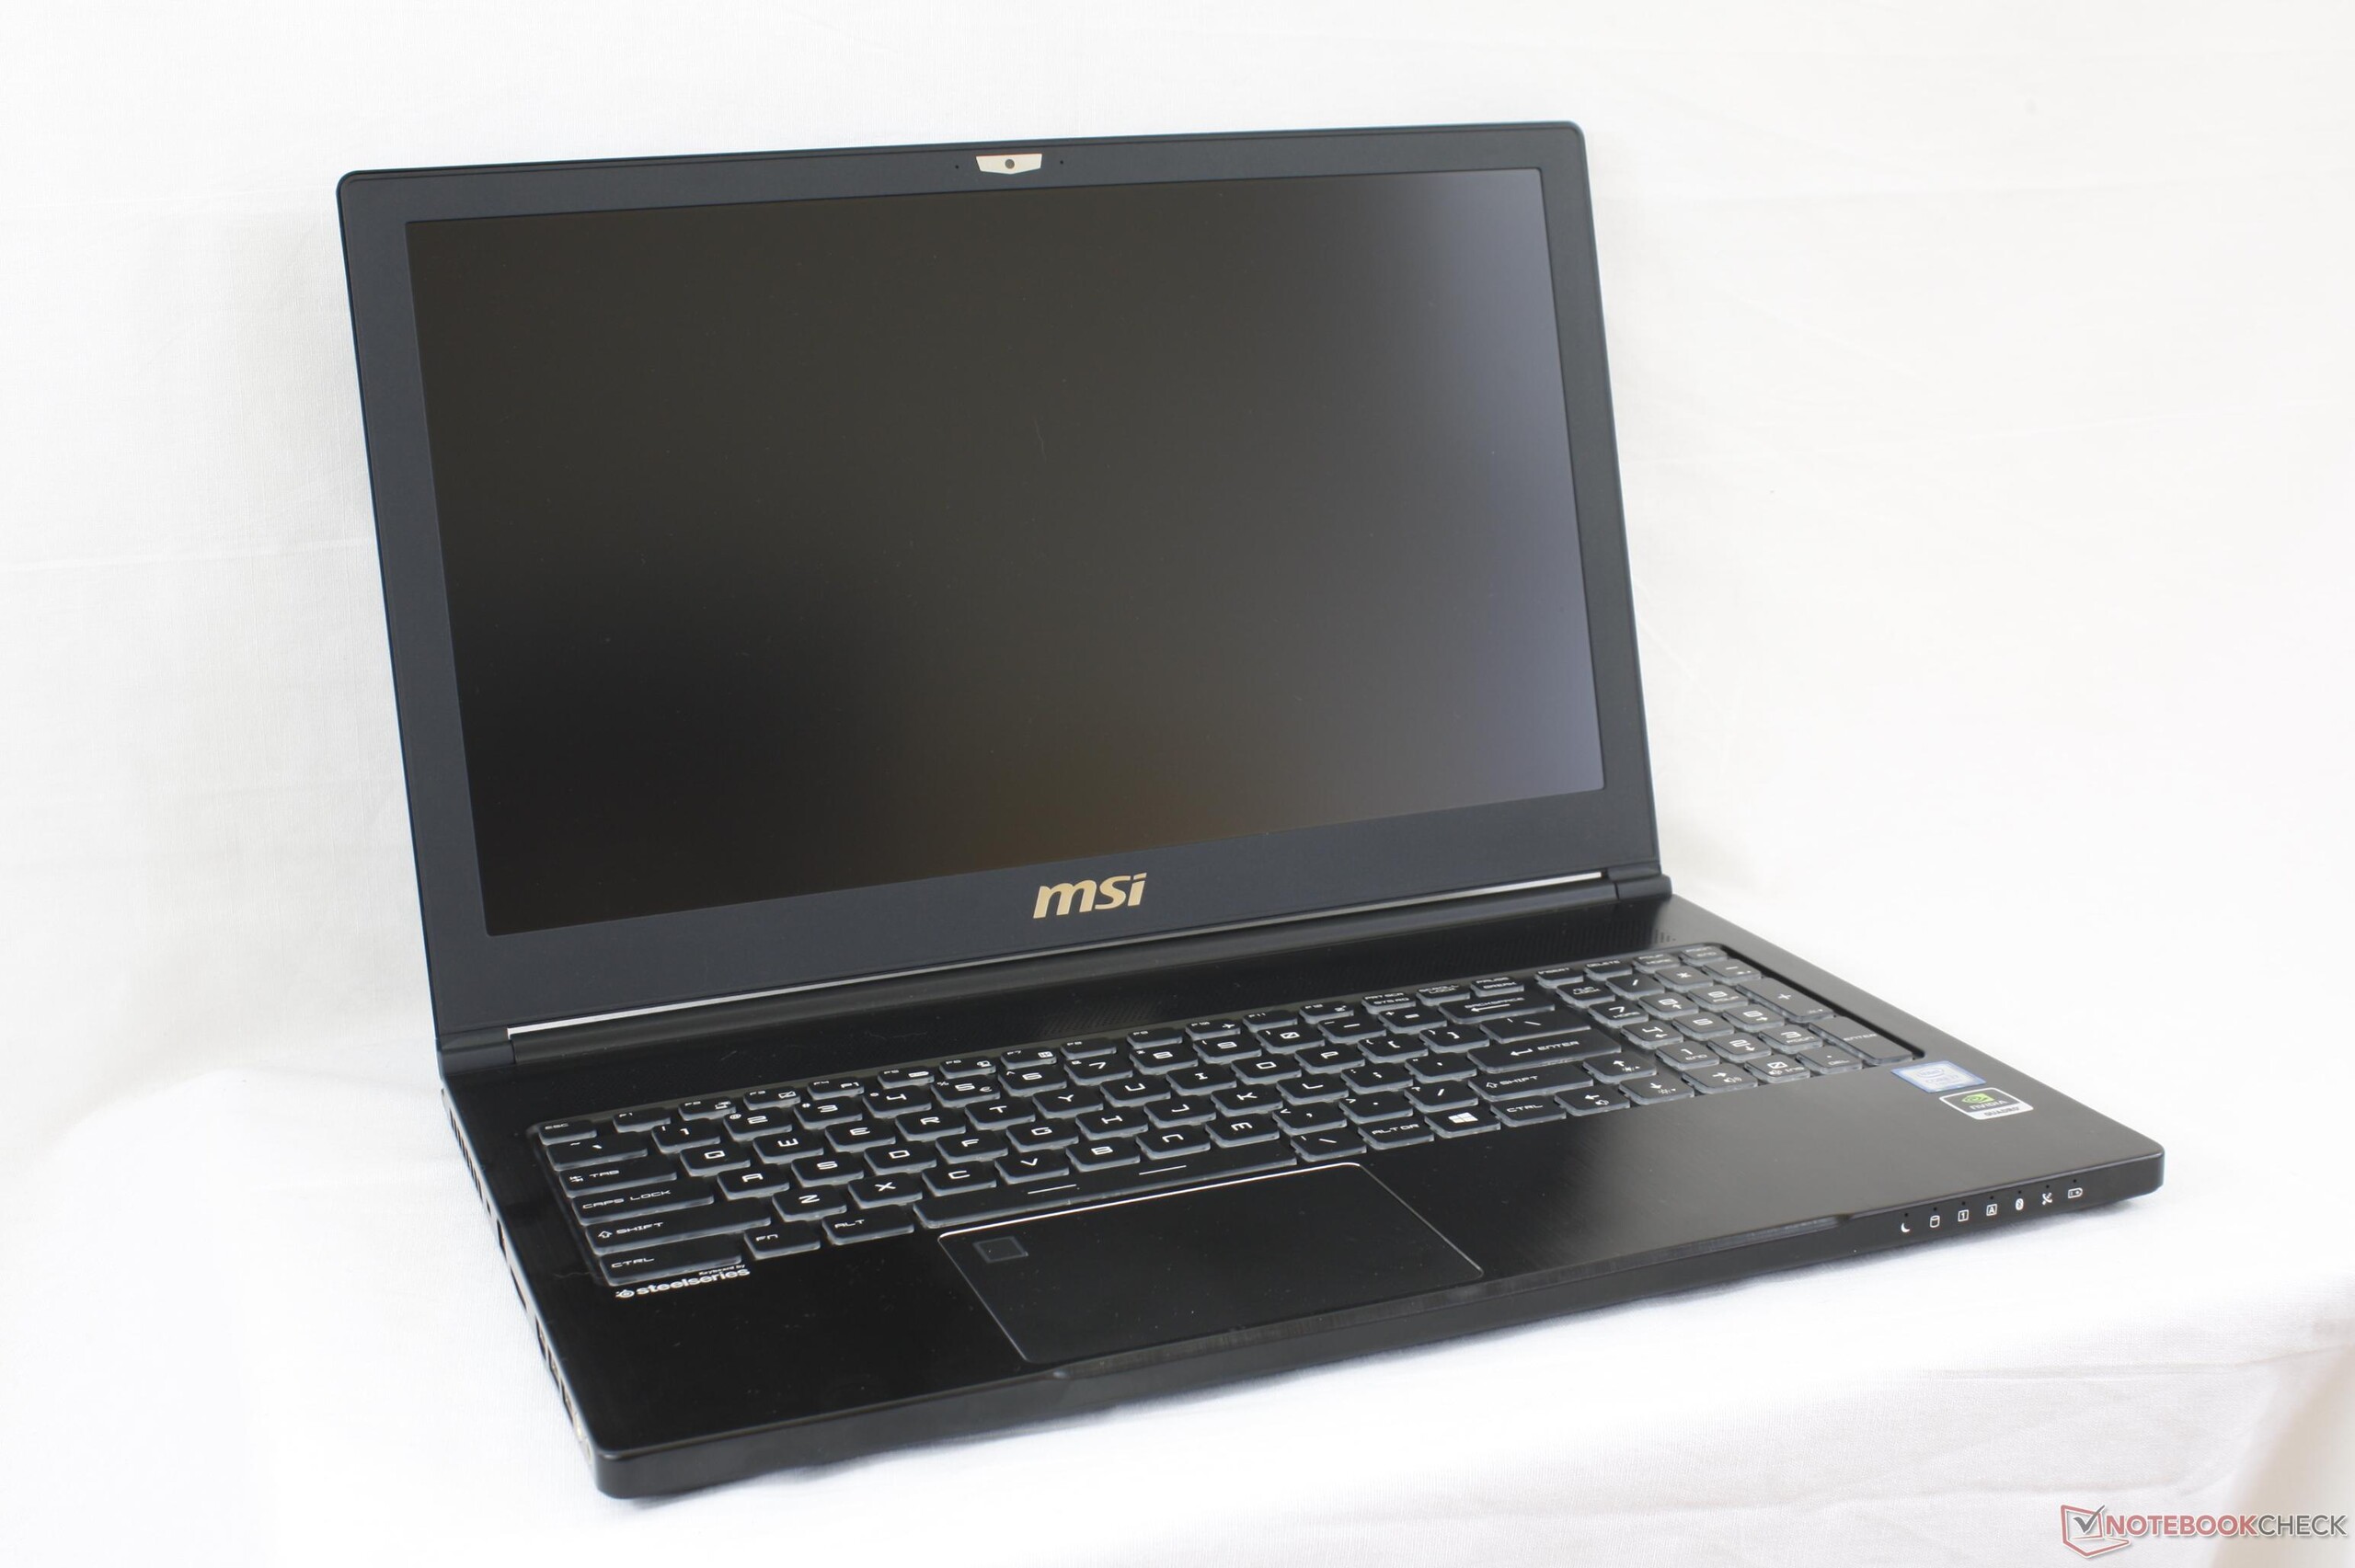
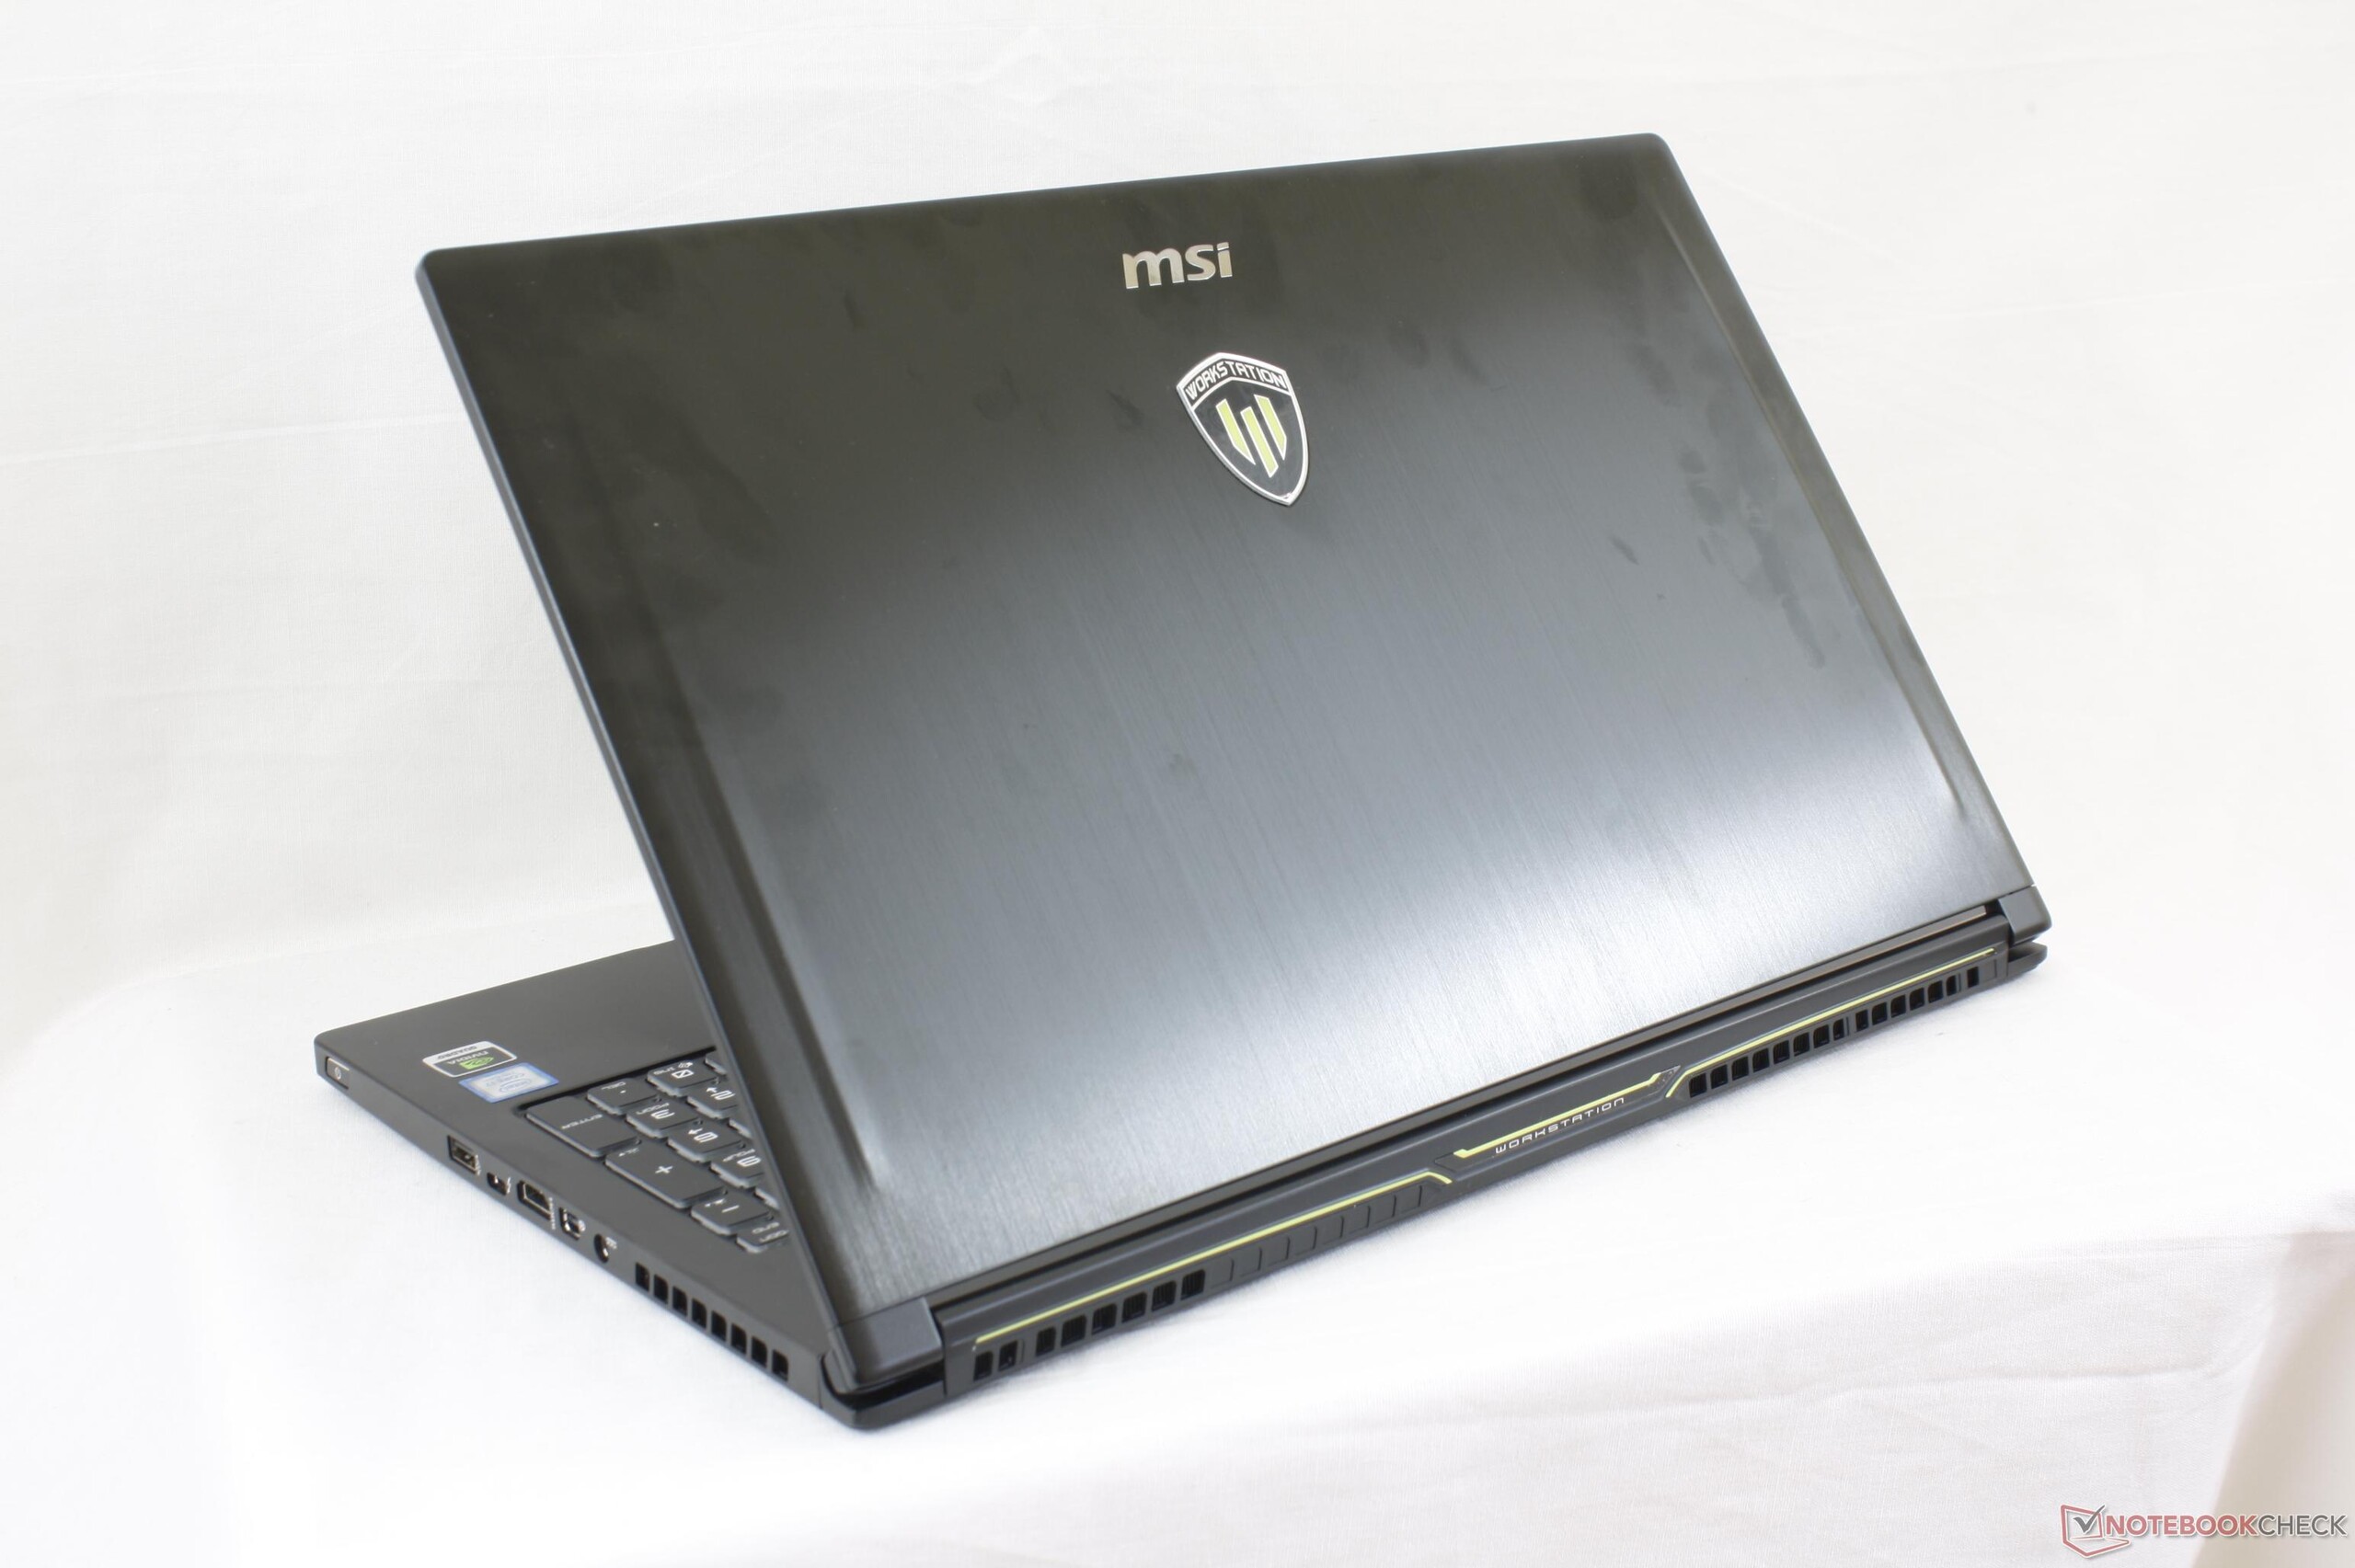
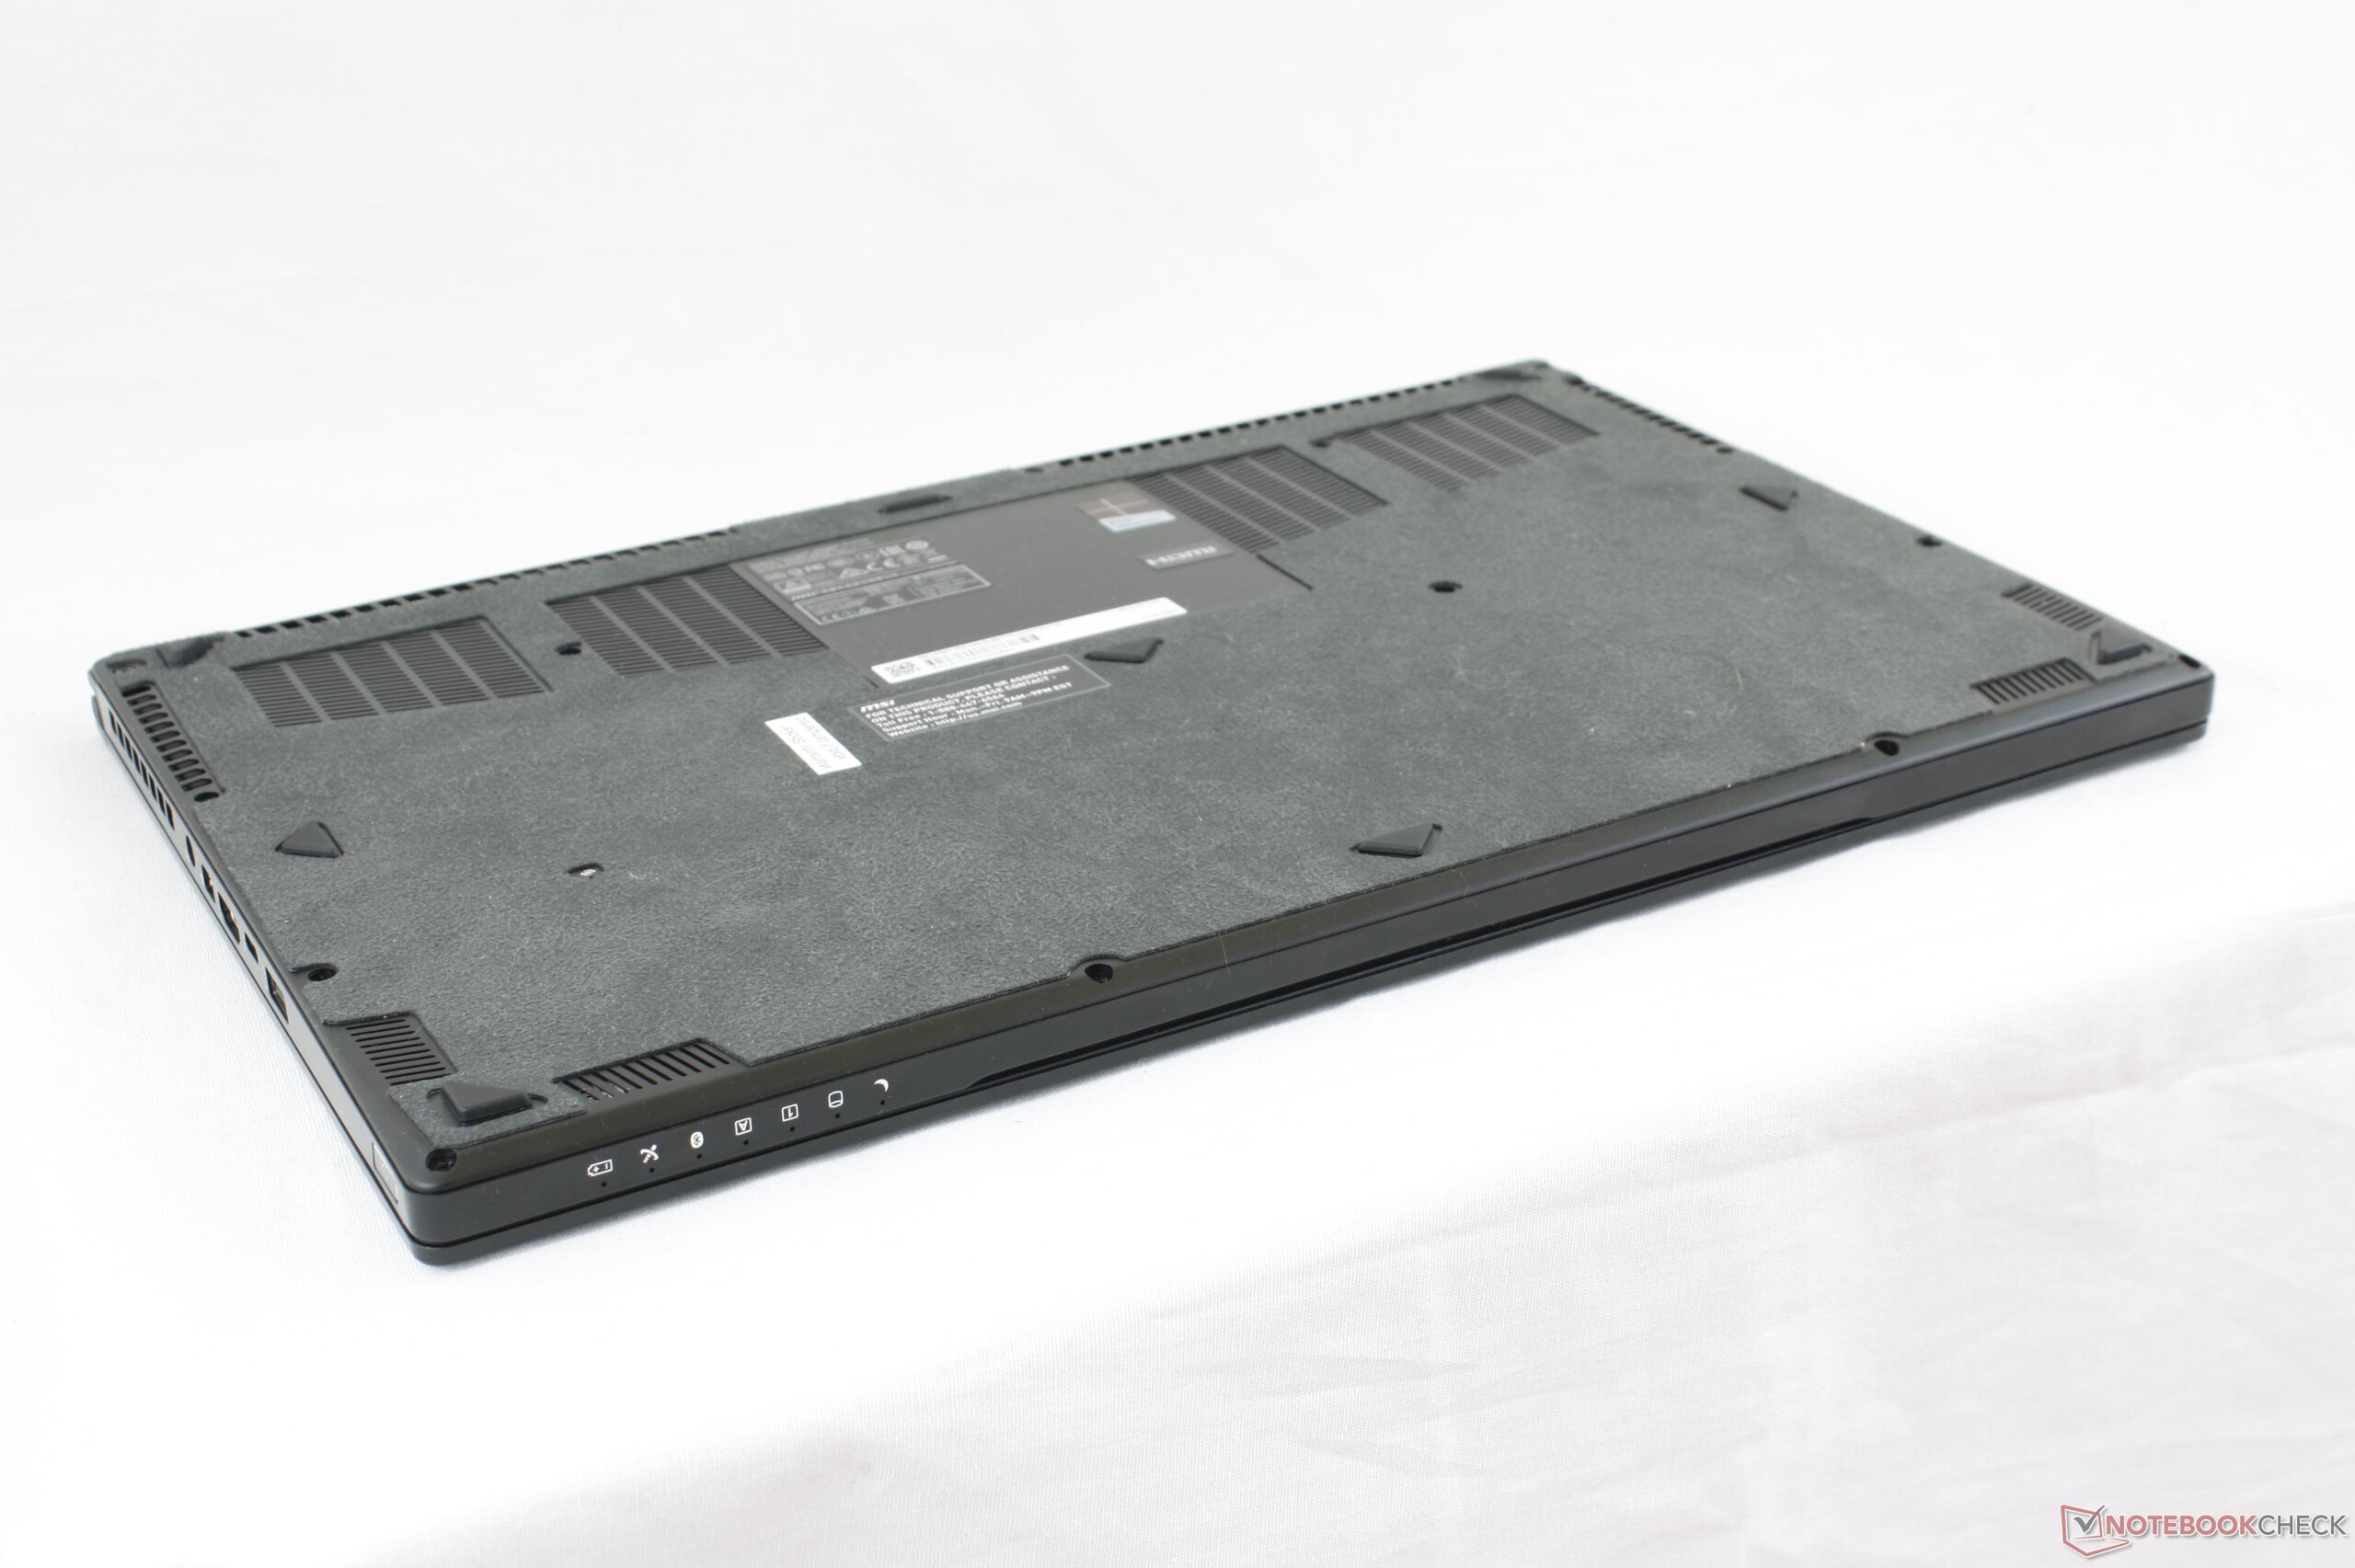
O tradicional Dell Precision, Lenovo ThinkPad P, e a série ZBookda HP dos workstations móveis, possuem designs pesados e massivos. A série WS da MSI tem coragem de olhar para outro horizonte, oferecendo um formato mais leve e fino sem sacrificar desempenho. O novo Quadro P3000 da Nvidia torna o WS63 em uma compra atraente com o seu consumo de energia mais baixo que o de um portátil com Quadro M5000M, enquanto ainda oferece o mesmo nível de desempenho de um GTX 980M. É quase chocante ver o novo WS63 superar o ZBook 15 G3 do ano passado que pode custar milhares a mais. Os profissionais que desejam o desempenho e portabilidade da GPU, acima de tudo, não precisam procurar mais.
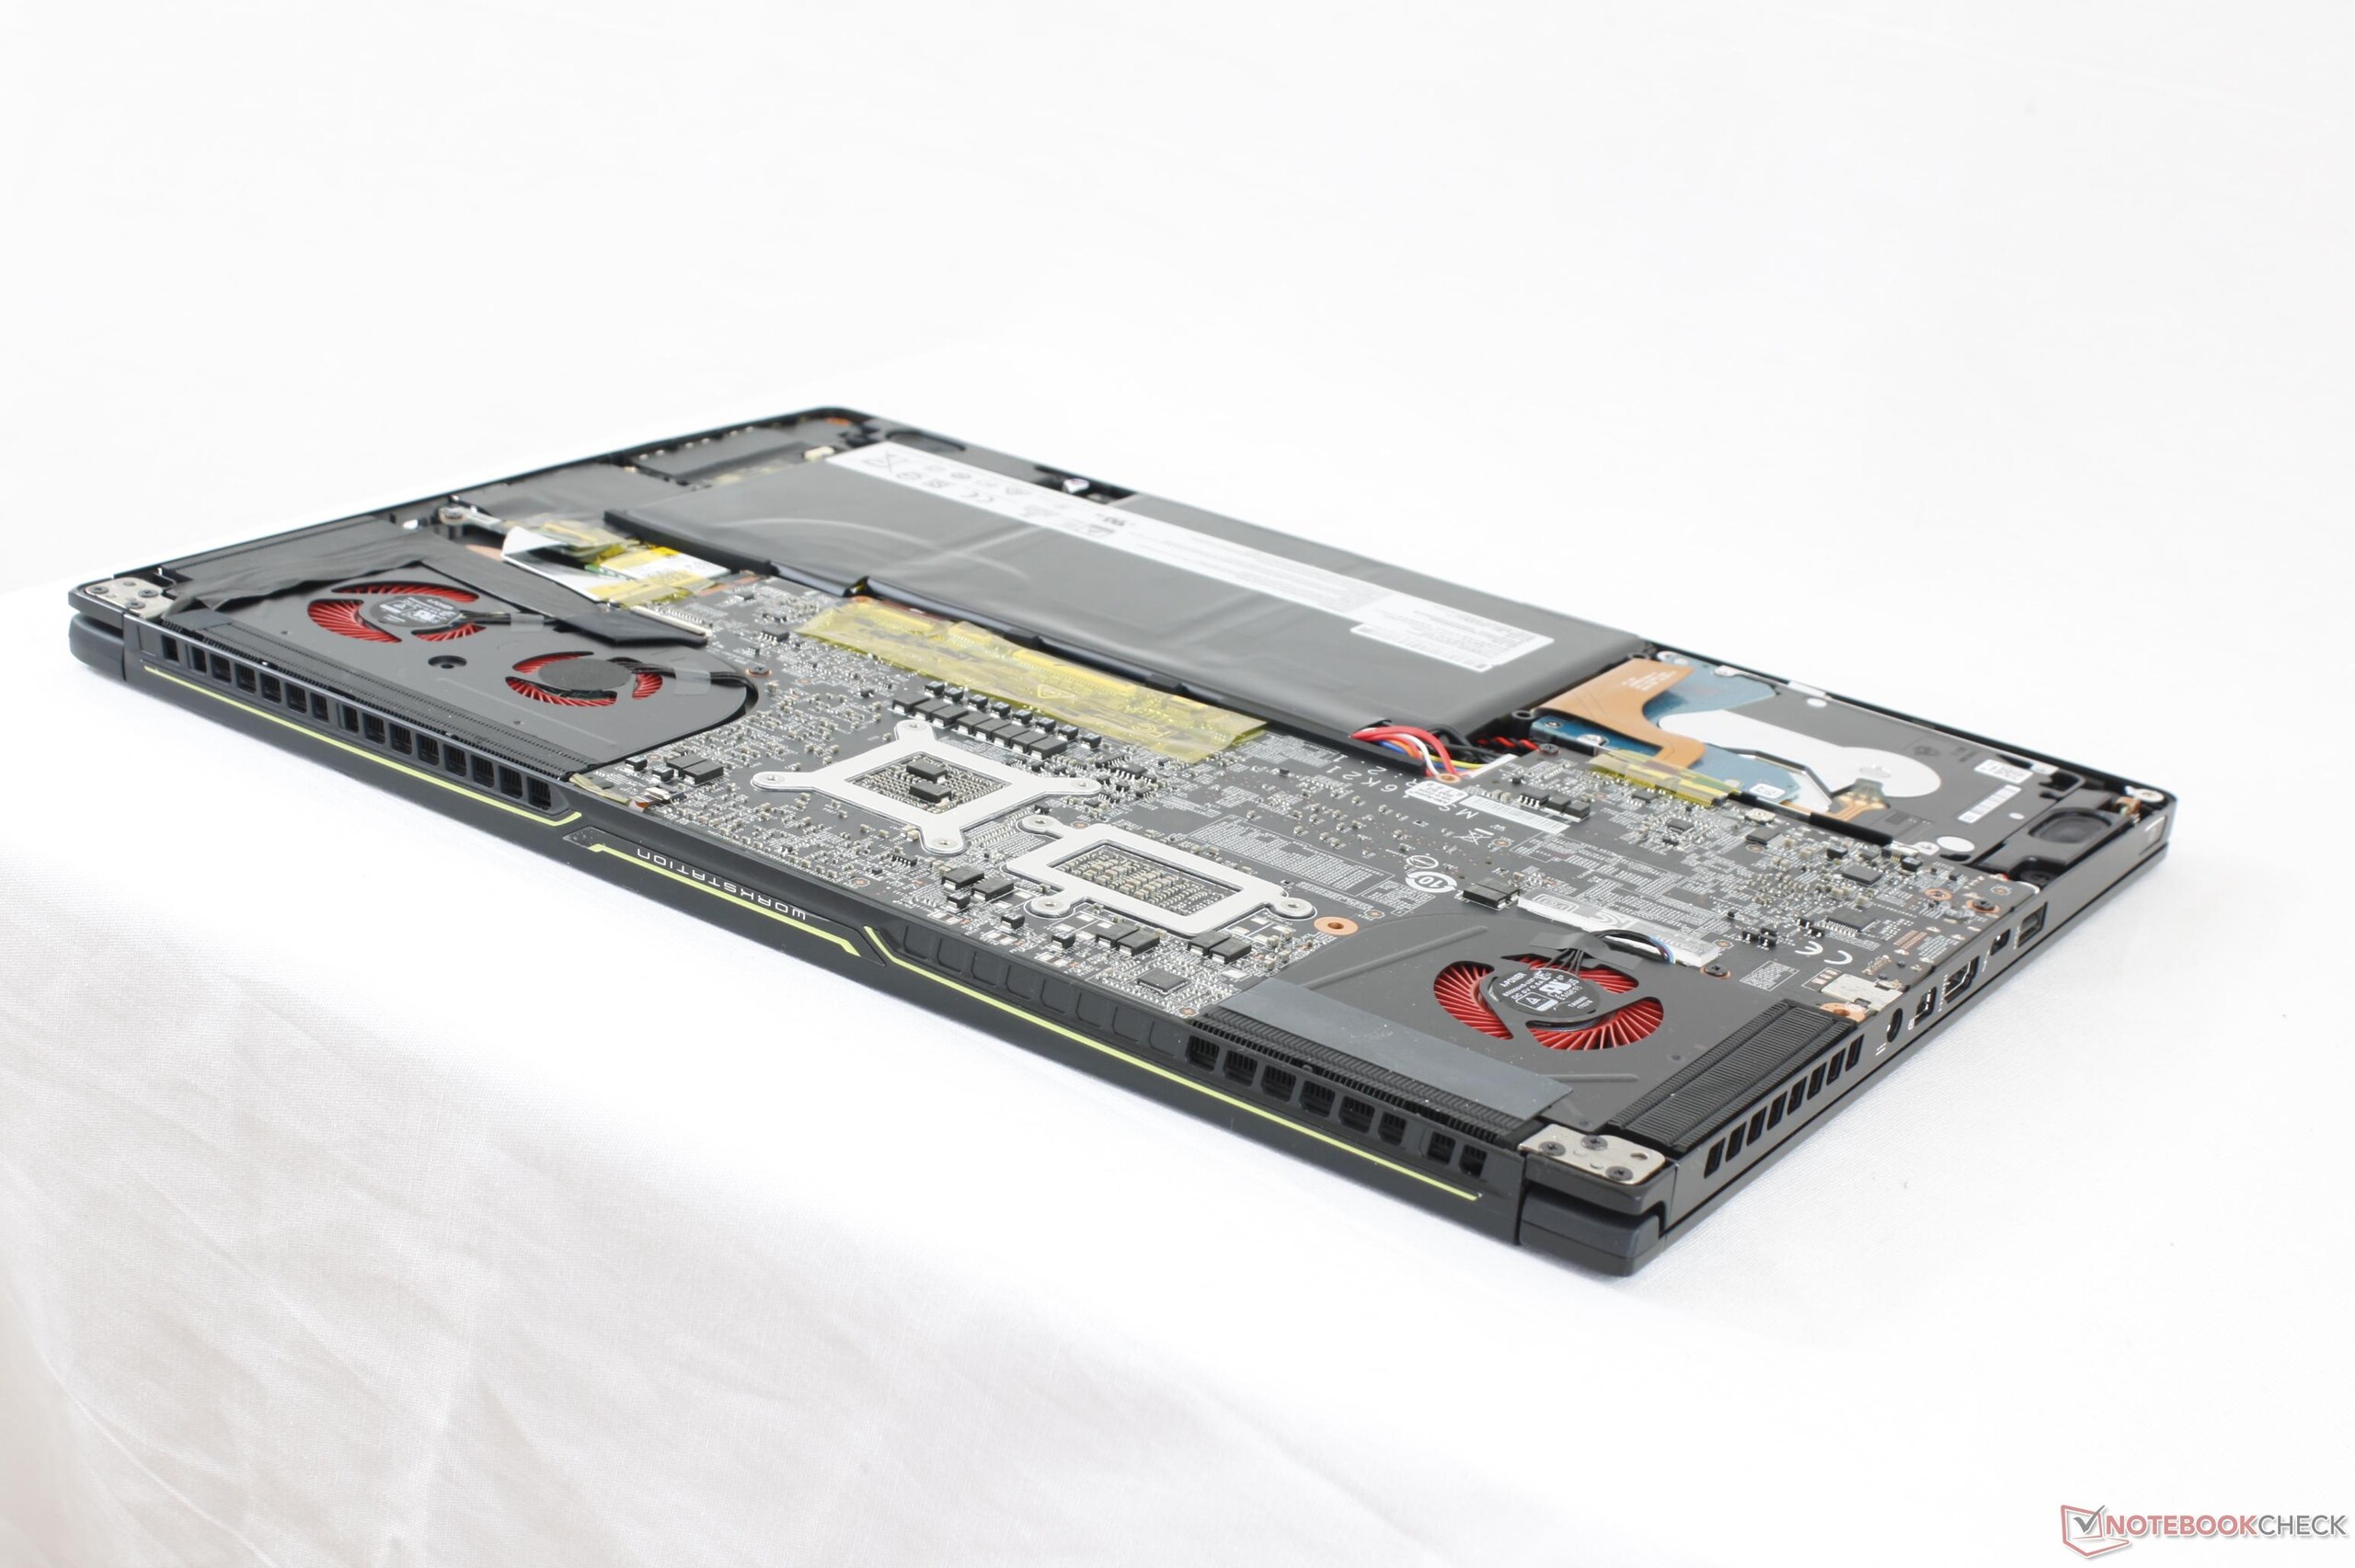
As principais desvantagens são previsíveis, pois o design fino e o peso leve levam naturalmente a menos opções. O chassi é mais flexível, o ruído do ventilador é mais acentuado, e a capacidade de manutenção é mais difícil, como se pode esperar, dado o tamanho menor. As temperaturas da CPU são muito mais altas quando sob uso intenso extremo e as velocidades Turbo Boost tendem a flutuar como resultado. Não ter uma tela significativamente mais clara do que outros workstation também parece ser uma oportunidade perdida, pois teria tornado o sistema já portátil em um companheiro de viagem ainda melhor. Esperamos que as futuras revisões adicionem opções que suportem opções sRGB pleno ou AdobeRGB, além dos recursos da CPU Xeon e RAM ECC para empurrar a série WS mais fundo na categoria de workstaions.
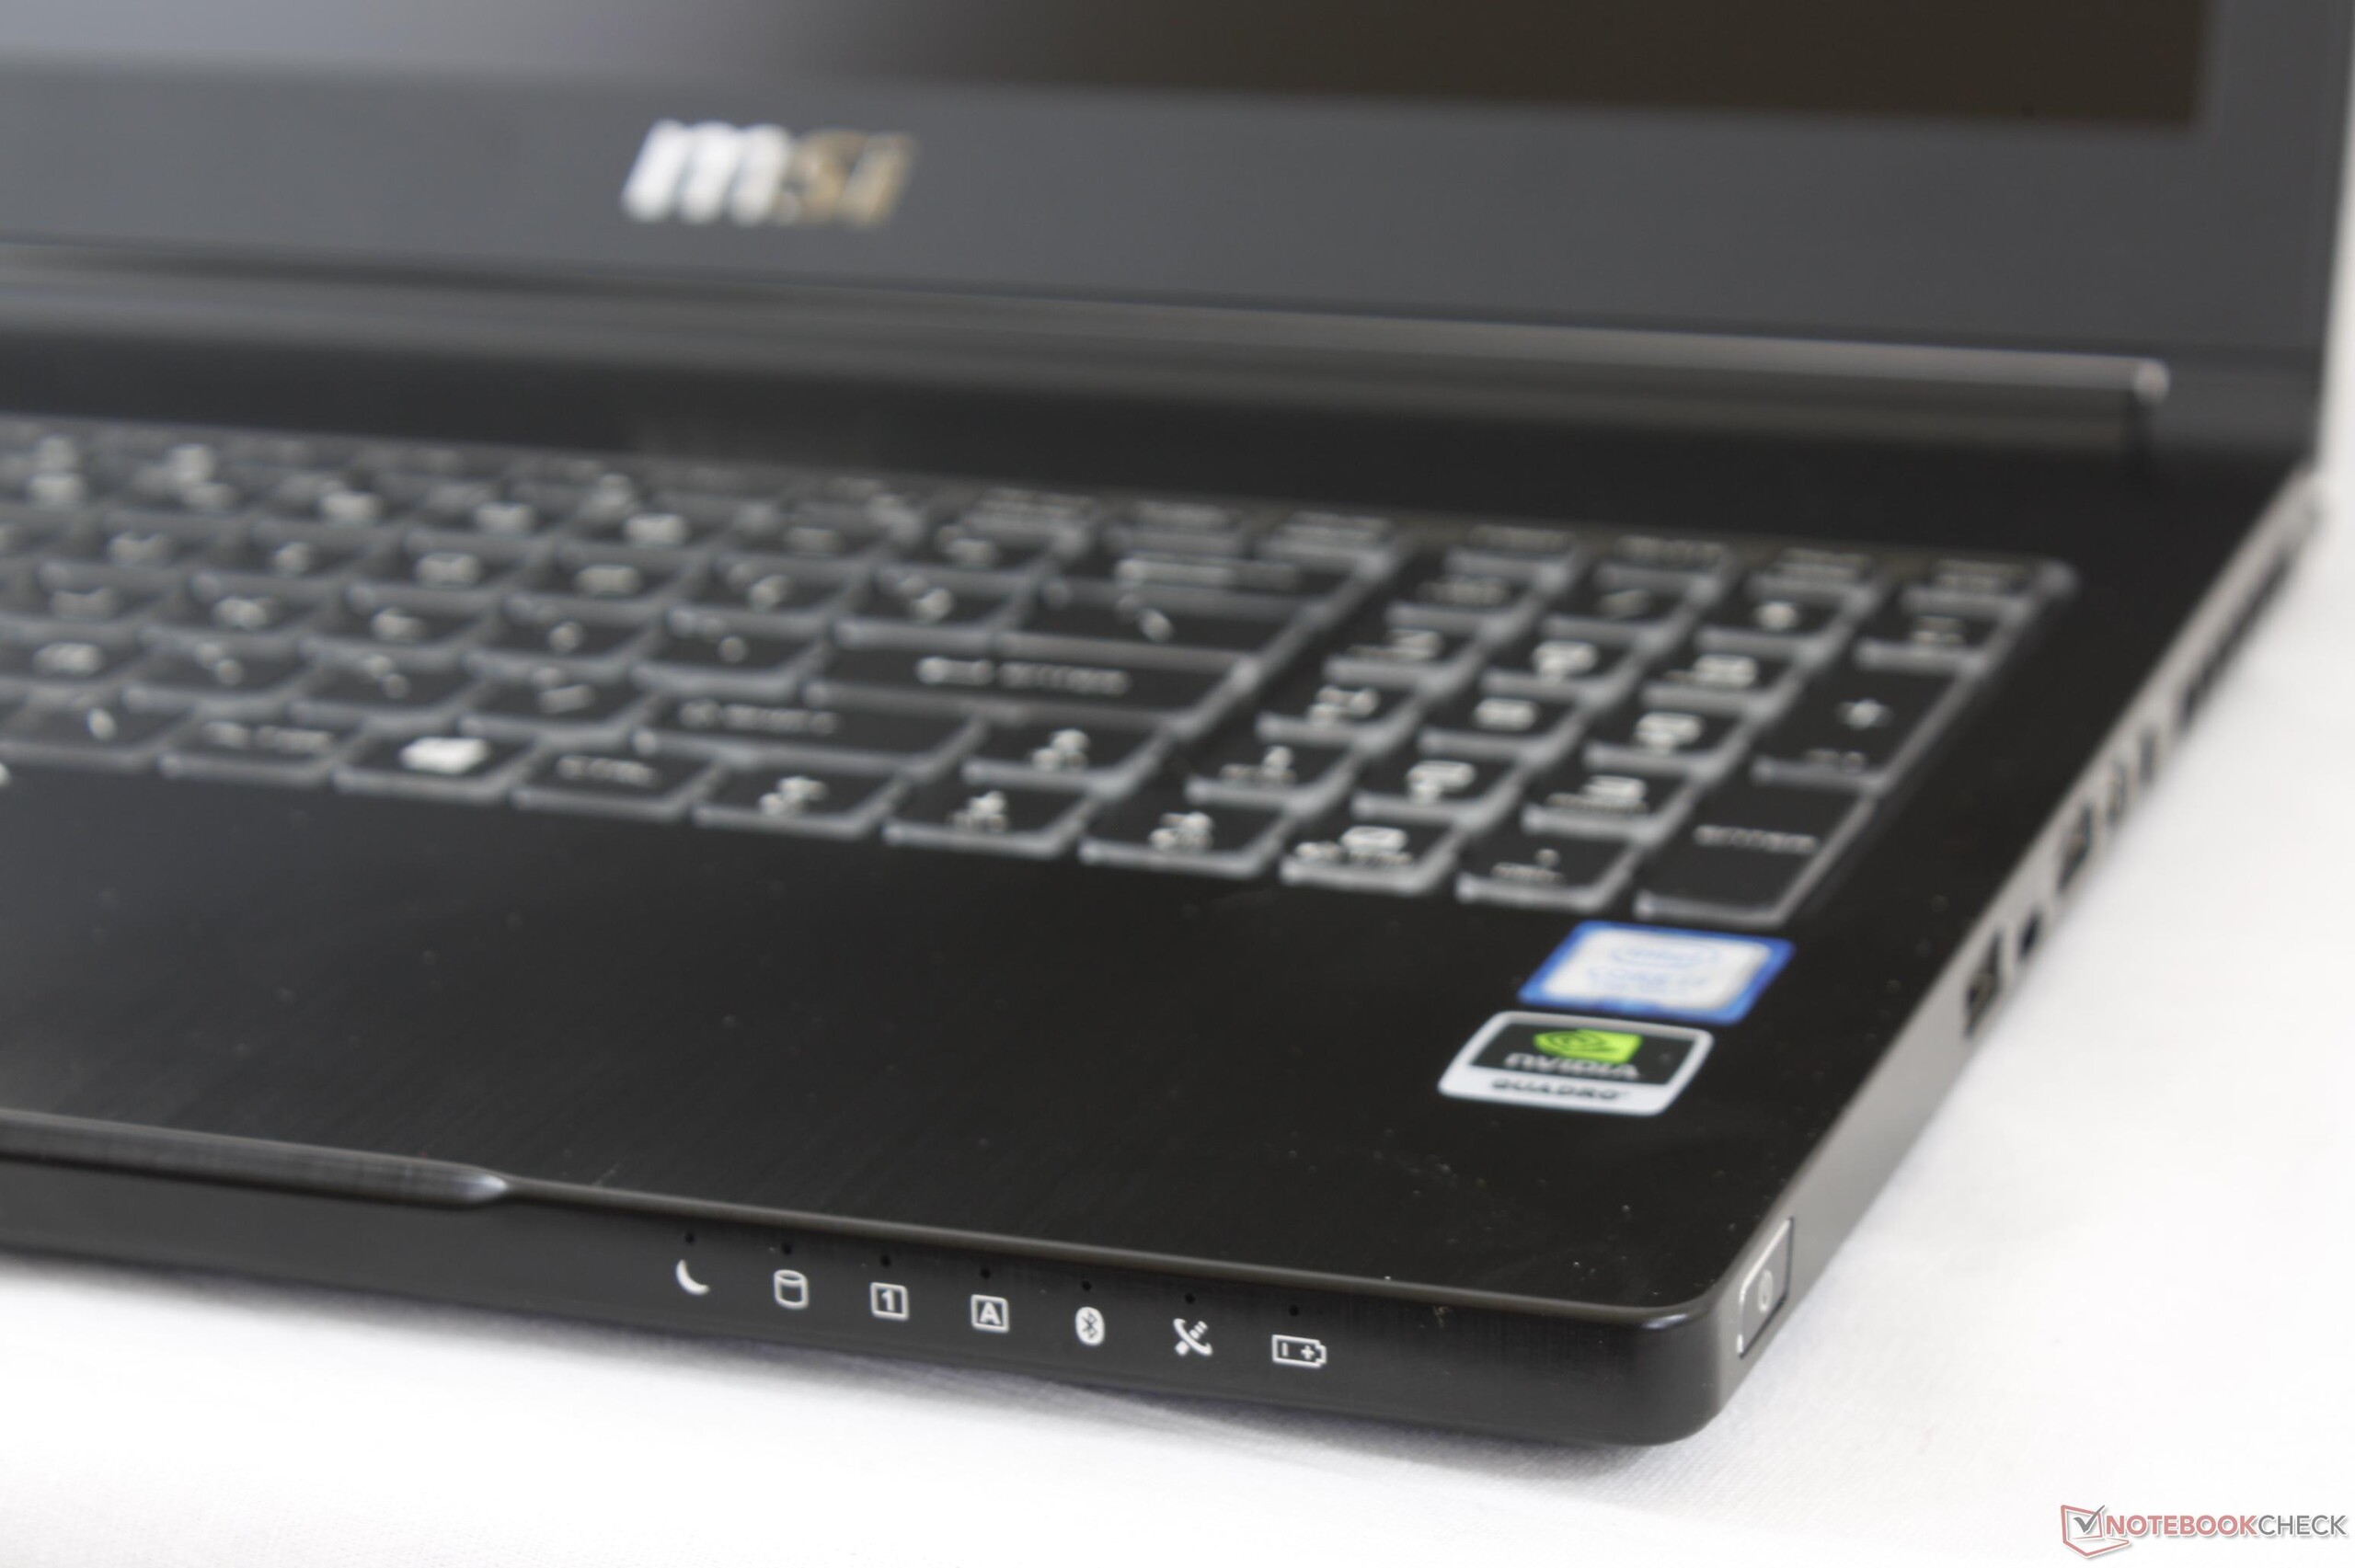
O WS63 é um bom pulo do WS60 desde um ponto de vista de desempenho e design. Ainda é leve em certos recursos e continua a se sentir mais como um híbrido de workstation de jogos em vez de uma estação de trabalho completa.
MSI WS63 7RF-290US
- 07/09/2017 v6 (old)
Allen Ngo
Price comparison
