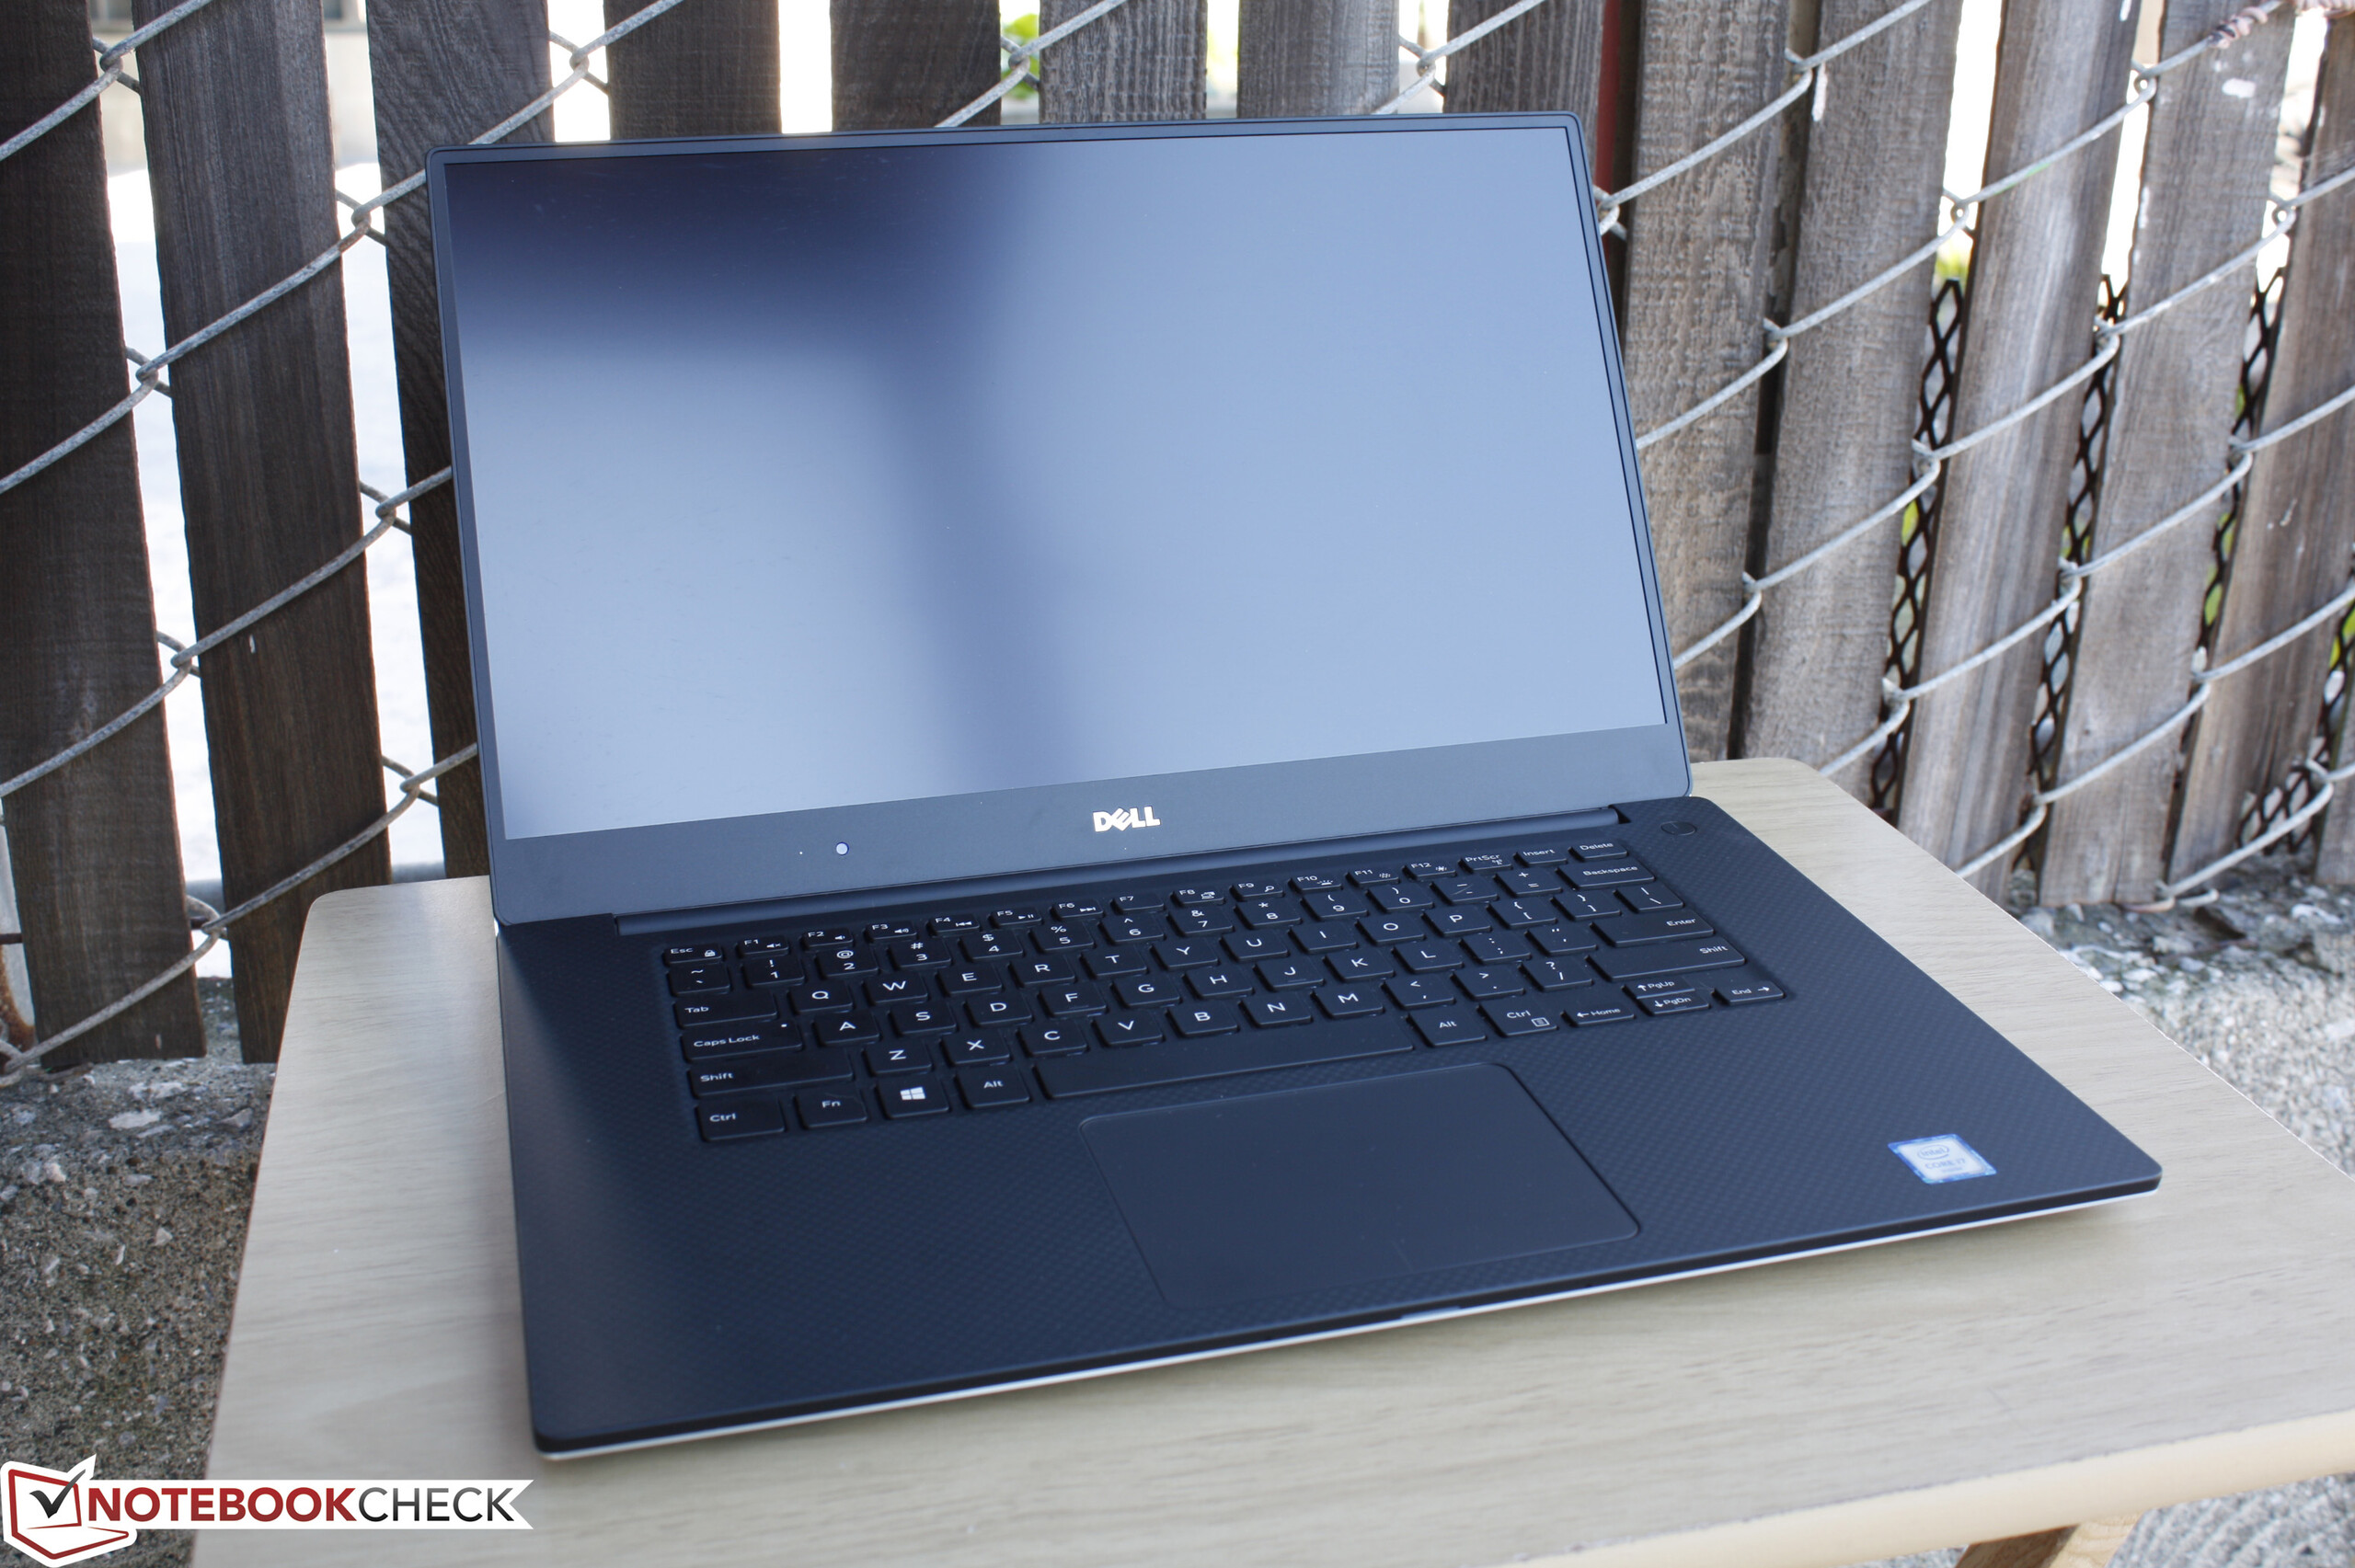
Breve Análise do Portátil Dell XPS 15 9550 (Core i7, FHD)
| |||||||||||||||||||||||||
iluminação: 92 %
iluminação com acumulador: 371.5 cd/m²
Contraste: 1474:1 (Preto: 0.252 cd/m²)
ΔE ColorChecker Calman: 5.55 | ∀{0.5-29.43 Ø4.72}
ΔE Greyscale Calman: 7.1 | ∀{0.09-98 Ø4.97}
97.9% sRGB (Argyll 1.6.3 3D)
63.4% AdobeRGB 1998 (Argyll 1.6.3 3D)
70.4% AdobeRGB 1998 (Argyll 3D)
97.2% sRGB (Argyll 3D)
68.5% Display P3 (Argyll 3D)
Gamma: 2.1
| Dell XPS 15 9550 i7 FHD 15.6", 1920x1080 | Dell XPS 15-9550 i7 15.6", 3840x2160 | Dell XPS 15 2016 9550 15.6", 1920x1080 | Dell XPS 15 (9530-0538) 15.6", 3840x2160 | Dell XPS 15 (Late 2013) 15.6", 3200x1800 | Dell XPS 13 2016 i7 256GB QHD 13.3", 3200x1800 | |
|---|---|---|---|---|---|---|
| Display | 24% | 0% | -4% | 3% | -6% | |
| Display P3 Coverage (%) | 68.5 | 87.8 28% | 68.8 0% | 64.9 -5% | 72.6 6% | 63.6 -7% |
| sRGB Coverage (%) | 97.2 | 100 3% | 97.9 1% | 96.1 -1% | 96.1 -1% | 93.6 -4% |
| AdobeRGB 1998 Coverage (%) | 70.4 | 99.4 41% | 70.7 0% | 66.9 -5% | 72.9 4% | 65.5 -7% |
| Response Times | 20% | 12% | 39% | |||
| Response Time Grey 50% / Grey 80% * (ms) | 64 ? | 58 ? 9% | 62 ? 3% | 40 ? 37% | ||
| Response Time Black / White * (ms) | 50 ? | 35 ? 30% | 40 ? 20% | 30 ? 40% | ||
| PWM Frequency (Hz) | 362 ? | 4900 ? | ||||
| Screen | -2% | 1% | 6% | -6% | 2% | |
| Brightness middle (cd/m²) | 371.5 | 361 -3% | 399 7% | 349 -6% | 349 -6% | 285 -23% |
| Brightness (cd/m²) | 356 | 344 -3% | 394 11% | 365 3% | 322 -10% | 281 -21% |
| Brightness Distribution (%) | 92 | 90 -2% | 89 -3% | 87 -5% | 83 -10% | 90 -2% |
| Black Level * (cd/m²) | 0.252 | 0.38 -51% | 0.24 5% | 0.282 -12% | 0.21 17% | 0.18 29% |
| Contrast (:1) | 1474 | 950 -36% | 1663 13% | 1238 -16% | 1662 13% | 1583 7% |
| Colorchecker dE 2000 * | 5.55 | 5.34 4% | 5.95 -7% | 2.65 52% | 8.27 -49% | 4.89 12% |
| Colorchecker dE 2000 max. * | 10.95 | |||||
| Greyscale dE 2000 * | 7.1 | 4.84 32% | 8.41 -18% | 3.77 47% | 7.99 -13% | 5.16 27% |
| Gamma | 2.1 105% | 2.21 100% | 2.35 94% | 2.41 91% | 3.42 64% | 2.15 102% |
| Color Space (Percent of AdobeRGB 1998) (%) | 63.4 | 89 40% | 64 1% | 61.02 -4% | 69.08 9% | 59 -7% |
| Color Space (Percent of sRGB) (%) | 97.9 | 100 2% | 98 0% | 96.1 -2% | 93 -5% | |
| CCT | 7395 88% | 7010 93% | 6786 96% | 8117 80% | 7106 91% | |
| Média Total (Programa/Configurações) | 14% /
7% | 4% /
2% | 1% /
4% | -2% /
-4% | 12% /
5% |
* ... menor é melhor
Exibir tempos de resposta
| ↔ Tempo de resposta preto para branco | ||
|---|---|---|
| 50 ms ... ascensão ↗ e queda ↘ combinadas | ↗ 12 ms ascensão | 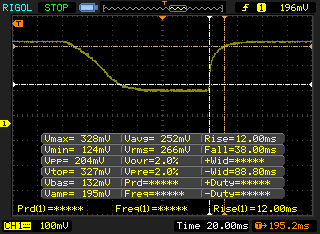 |
| ↘ 38 ms queda | ||
| A tela mostra taxas de resposta lentas em nossos testes e será insatisfatória para os jogadores. Em comparação, todos os dispositivos testados variam de 0.1 (mínimo) a 240 (máximo) ms. » 99 % de todos os dispositivos são melhores. Isso significa que o tempo de resposta medido é pior que a média de todos os dispositivos testados (19.8 ms). | ||
| ↔ Tempo de resposta 50% cinza a 80% cinza | ||
| 64 ms ... ascensão ↗ e queda ↘ combinadas | ↗ 27 ms ascensão | 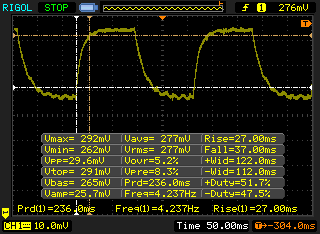 |
| ↘ 37 ms queda | ||
| A tela mostra taxas de resposta lentas em nossos testes e será insatisfatória para os jogadores. Em comparação, todos os dispositivos testados variam de 0.165 (mínimo) a 636 (máximo) ms. » 97 % de todos os dispositivos são melhores. Isso significa que o tempo de resposta medido é pior que a média de todos os dispositivos testados (31 ms). | ||
| Cinebench R11.5 | |
| CPU Single 64Bit (classificar por valor) | |
| Dell XPS 15 9550 i7 FHD | |
| Dell XPS 15-9550 i7 | |
| Dell XPS 15 (9530-0538) | |
| Dell XPS 15 (L521x) PL | |
| Dell XPS 15 2016 9550 | |
| CPU Multi 64Bit (classificar por valor) | |
| Dell XPS 15 9550 i7 FHD | |
| Dell XPS 15-9550 i7 | |
| Dell XPS 15 (9530-0538) | |
| Dell XPS 15 (L521x) PL | |
| Dell XPS 15 2016 9550 | |
| Cinebench R10 | |
| Rendering Single CPUs 64Bit (classificar por valor) | |
| Dell XPS 15-9550 i7 | |
| Dell XPS 15 (9530-0538) | |
| Dell XPS 15 (L521x) PL | |
| Dell XPS 15 2016 9550 | |
| Rendering Multiple CPUs 64Bit (classificar por valor) | |
| Dell XPS 15-9550 i7 | |
| Dell XPS 15 (9530-0538) | |
| Dell XPS 15 (L521x) PL | |
| Dell XPS 15 2016 9550 | |
| Super Pi Mod 1.5 XS 32M - 32M (classificar por valor) | |
| Dell XPS 15 9550 i7 FHD | |
| Dell XPS 15 (L521x) PL | |
| wPrime 2.10 - 1024m (classificar por valor) | |
| Dell XPS 15 9550 i7 FHD | |
* ... menor é melhor
| PCMark 7 - Score (classificar por valor) | |
| Dell XPS 15 9550 i7 FHD | |
| Dell XPS 15 (9530-0538) | |
| Dell XPS 15-9550 i7 | |
| Dell XPS 15 2016 9550 | |
| PCMark 8 | |
| Home Score Accelerated v2 (classificar por valor) | |
| Dell XPS 15 9550 i7 FHD | |
| Dell XPS 15-9550 i7 | |
| Dell XPS 15 2016 9550 | |
| Work Score Accelerated v2 (classificar por valor) | |
| Dell XPS 15 9550 i7 FHD | |
| Dell XPS 15-9550 i7 | |
| Creative Score Accelerated v2 (classificar por valor) | |
| Dell XPS 15 9550 i7 FHD | |
| Dell XPS 15-9550 i7 | |
| Dell XPS 15 2016 9550 | |
| PCMark 7 Score | 5739 pontos | |
| PCMark 8 Home Score Accelerated v2 | 3753 pontos | |
| PCMark 8 Creative Score Accelerated v2 | 4659 pontos | |
| PCMark 8 Work Score Accelerated v2 | 4696 pontos | |
Ajuda | ||
| Dell XPS 15 9550 i7 FHD GeForce GTX 960M, 6700HQ, Samsung PM951 NVMe 512 GB | Dell XPS 15-9550 i7 GeForce GTX 960M, 6700HQ, Samsung PM951 NVMe 512 GB | Dell XPS 15 2016 9550 GeForce GTX 960M, 6300HQ, WDC WD10SPCX-75KHST0 + LiteON CS1-SP32-11 M.2 2242 32GB | Dell XPS 15 (9530-0538) GeForce GT 750M, 4712HQ, Lite-On LMT-512L9M | Dell XPS 15 (Late 2013) GeForce GT 750M, 4702HQ, Samsung SSD SM841 512GB | Dell XPS 13 2016 i7 256GB QHD HD Graphics 520, 6500U, Samsung PM951 NVMe MZ-VLV256D | |
|---|---|---|---|---|---|---|
| AS SSD | -5% | -7397% | -51% | -67% | -32% | |
| Copy Game MB/s (MB/s) | 805 | 785 -2% | 66.4 -92% | 292.6 -64% | 148.9 -82% | |
| Copy Program MB/s (MB/s) | 325.3 | 318.4 -2% | 42.24 -87% | 238.5 -27% | 46.64 -86% | |
| Copy ISO MB/s (MB/s) | 1127 | 716 -36% | 15.75 -99% | 468.2 -58% | 397.7 -65% | |
| Score Total (Points) | 2410 | 2410 0% | 44 -98% | 1021 -58% | 1070 -56% | 1603 -33% |
| Score Write (Points) | 675 | 694 3% | 10 -99% | 352 -48% | 391 -42% | 391 -42% |
| Score Read (Points) | 1180 | 1166 -1% | 24 -98% | 440 -63% | 448 -62% | 809 -31% |
| Access Time Write * (ms) | 0.035 | 0.036 -3% | 17.31 -49357% | 0.058 -66% | 0.061 -74% | 0.034 3% |
| Access Time Read * (ms) | 0.038 | 0.053 -39% | 20.2 -53058% | 0.065 -71% | 0.114 -200% | 0.071 -87% |
| 4K-64 Write (MB/s) | 513 | 532 4% | 0.91 -100% | 253.1 -51% | 290.5 -43% | 263.7 -49% |
| 4K-64 Read (MB/s) | 990 | 975 -2% | 10.11 -99% | 361.5 -63% | 374.5 -62% | 698 -29% |
| 4K Write (MB/s) | 105.4 | 105.6 0% | 0.98 -99% | 62 -41% | 59.6 -43% | 97.6 -7% |
| 4K Read (MB/s) | 31.86 | 34.63 9% | 1.53 -95% | 29.65 -7% | 23.83 -25% | 38.21 20% |
| Seq Write (MB/s) | 570 | 562 -1% | 77.6 -86% | 373.5 -34% | 404.9 -29% | 301.2 -47% |
| Seq Read (MB/s) | 1579 | 1569 -1% | 122.2 -92% | 486.2 -69% | 498.5 -68% | 735 -53% |
* ... menor é melhor
| 3DMark 11 | |
| 1280x720 Performance (classificar por valor) | |
| Dell XPS 15-9550 i7 | |
| Dell XPS 15 2016 9550 | |
| Dell XPS 15 (9530-0538) | |
| Dell XPS 15 (Late 2013) | |
| Dell XPS 15 (L521x) PL | |
| 1280x720 Performance GPU (classificar por valor) | |
| Dell XPS 15-9550 i7 | |
| Dell XPS 15 2016 9550 | |
| Dell XPS 15 (9530-0538) | |
| Dell XPS 15 (Late 2013) | |
| Dell XPS 15 (L521x) PL | |
| 1280x720 Performance Physics (classificar por valor) | |
| Dell XPS 15-9550 i7 | |
| Dell XPS 15 2016 9550 | |
| Dell XPS 15 (9530-0538) | |
| Dell XPS 15 (Late 2013) | |
| Dell XPS 15 (L521x) PL | |
| 3DMark Ice Storm Standard Score | 77565 pontos | |
| 3DMark Cloud Gate Standard Score | 17140 pontos | |
| 3DMark Fire Strike Score | 3939 pontos | |
| 3DMark Fire Strike Extreme Score | 1981 pontos | |
Ajuda | ||
| baixo | média | alto | ultra | |
|---|---|---|---|---|
| Sleeping Dogs (2012) | 89.2 | 23.4 | ||
| Guild Wars 2 (2012) | 52.5 | 28.6 | ||
| Tomb Raider (2013) | 112 | 52.4 | ||
| StarCraft II: Heart of the Swarm (2013) | 140.3 | 71.1 | ||
| BioShock Infinite (2013) | 106.9 | 44.1 | ||
| Metro: Last Light (2013) | 55.7 | 30.9 | ||
| Thief (2014) | 51.2 | 26.6 | ||
| Middle-earth: Shadow of Mordor (2014) | 39.9 | 30.5 | ||
| Batman: Arkham Knight (2015) | 39 | 19 | ||
| Metal Gear Solid V (2015) | 55 | 37.5 | ||
| Fallout 4 (2015) | 31 | 24.2 | ||
| Rise of the Tomb Raider (2016) | 23.8 | 21.2 |
| Dell XPS 15 9550 i7 FHD GeForce GTX 960M, 6700HQ, Samsung PM951 NVMe 512 GB | Dell XPS 15 2016 9550 GeForce GTX 960M, 6300HQ, WDC WD10SPCX-75KHST0 + LiteON CS1-SP32-11 M.2 2242 32GB | Dell XPS 15 (9530-0538) GeForce GT 750M, 4712HQ, Lite-On LMT-512L9M | Dell XPS 13 2016 i7 256GB QHD HD Graphics 520, 6500U, Samsung PM951 NVMe MZ-VLV256D | Asus ZenBook Pro UX501VW-DS71T GeForce GTX 960M, 6700HQ, Samsung SM951 MZVPV512HDGL m.2 PCI-e | Lenovo Ideapad Y700 15ISK 80NW GeForce GTX 960M, 6700HQ, Samsung MZNLN128HCGR-000L2 | |
|---|---|---|---|---|---|---|
| Noise | -9% | -7% | -1% | -1% | -7% | |
| Idle Minimum * (dB) | 29.2 | 32.6 -12% | 29.6 -1% | 31.8 -9% | 28.9 1% | 30.4 -4% |
| Idle Average * (dB) | 29.3 | 33.6 -15% | 31.6 -8% | 31.8 -9% | 28.9 1% | 30.5 -4% |
| Idle Maximum * (dB) | 29.5 | 33.6 -14% | 31.6 -7% | 34.8 -18% | 30.2 -2% | 33.3 -13% |
| Load Average * (dB) | 36.5 | 37.1 -2% | 45.4 -24% | 34.8 5% | 41.8 -15% | 41.4 -13% |
| Load Maximum * (dB) | 47.7 | 47.5 -0% | 45.4 5% | 34.8 27% | 43.9 8% | 47 1% |
* ... menor é melhor
Barulho
| Ocioso |
| 29.2 / 29.3 / 29.5 dB |
| Carga |
| 36.5 / 47.7 dB |
 | ||
30 dB silencioso 40 dB(A) audível 50 dB(A) ruidosamente alto |
||
min: | ||
(-) A temperatura máxima no lado superior é 56.6 °C / 134 F, em comparação com a média de 36.8 °C / 98 F , variando de 21 a 71 °C para a classe Multimedia.
(-) A parte inferior aquece até um máximo de 46.9 °C / 116 F, em comparação com a média de 39.1 °C / 102 F
(+) Em uso inativo, a temperatura média para o lado superior é 23.9 °C / 75 F, em comparação com a média do dispositivo de 31.3 °C / ### class_avg_f### F.
(+) Os apoios para as mãos e o touchpad são mais frios que a temperatura da pele, com um máximo de 26.6 °C / 79.9 F e, portanto, são frios ao toque.
(+) A temperatura média da área do apoio para as mãos de dispositivos semelhantes foi 28.7 °C / 83.7 F (+2.1 °C / 3.8 F).
| Dell XPS 15 9550 i7 FHD 84 Wh | Dell XPS 15-9550 i7 84 Wh | Dell XPS 15 2016 9550 56 Wh | Dell XPS 15 (9530-0538) 88 Wh | Dell XPS 13-9350 56 Wh | |
|---|---|---|---|---|---|
| Duração da bateria | -24% | -19% | -43% | 0% | |
| Reader / Idle (h) | 16.3 | 8.8 -46% | 9.1 -44% | 13 -20% | |
| WiFi v1.3 (h) | 9.1 | 5.2 -43% | 5.5 -40% | 5.2 -43% | 7.5 -18% |
| Load (h) | 1.8 | 2.1 17% | 2.3 28% | 2.5 39% |
Pro
Contra
Embora tenha sido lançado com algumas dores de cabeça, a atualização do XPS 15 2016 é uma melhoria sobre o anterior design em quase todas as áreas, especialmente em termos se gráficos, tamanho e peso. A duração da bateria é incrível com nossa unidade de teste de 84 Wh e o sistema é capaz de manter temperaturas estáveis, agora sem grandes problemas de afogamento.
A retro iluminação pulsante com níveis de brilho muito baixos ainda é um problema com os SKUs FHD e pode ser evitada mantendo a retro iluminação sobre 30 ou 40 por cento. Além disso, os SKUs FHD tem quase cobertura plena de sRGB enquanto os SKUs 4K UHD cobrem uma gama ainda mais ampla de quase todo o padrão AdobeRGB. Estes dois motivos podem ser suficientes para persuadir os artistas digitais a comprar uma configuração 4K UHD sobre opções FHD inclusive se a resolução maior não seja de interesse.
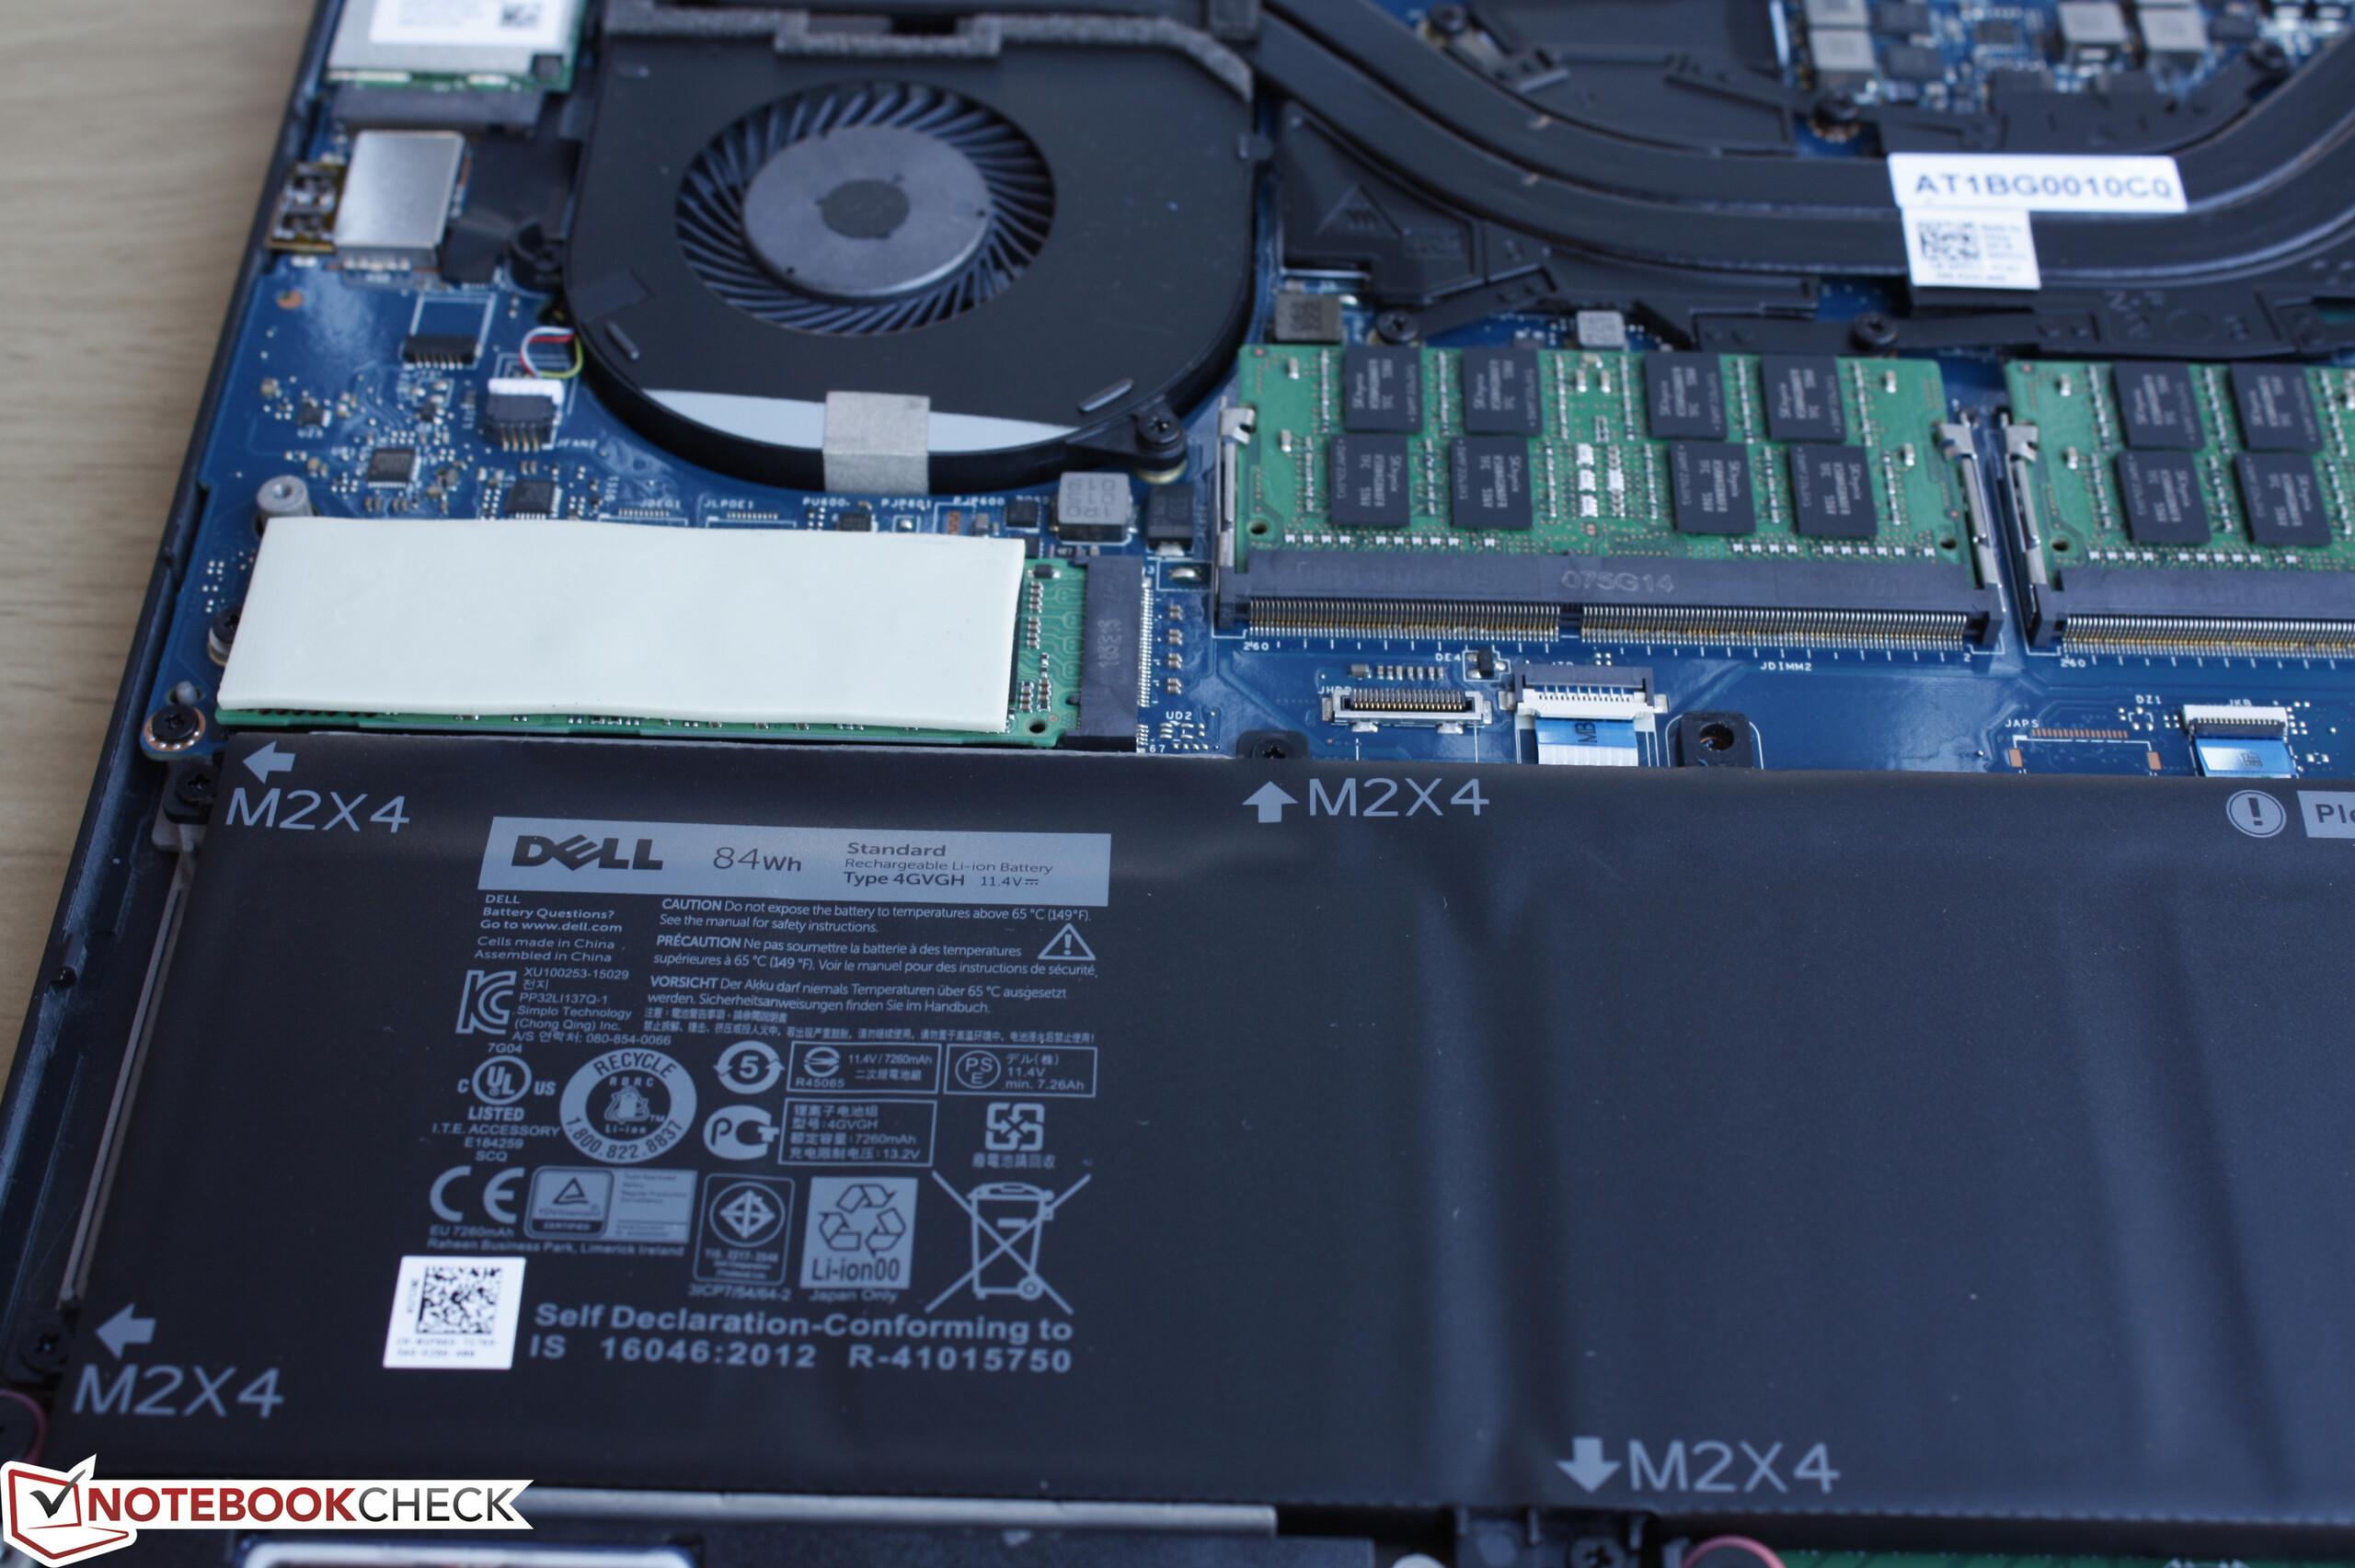
A maior capacidade da bateria virá como o custo do armazenamento secundário e tais configurações podem não estar disponíveis em todas as regiões. Os modelos com a bateria menor podem ser preferíveis para aqueles que pretendem usar o XPS 15 principalmente como uma máquina multimídia e de jogos.
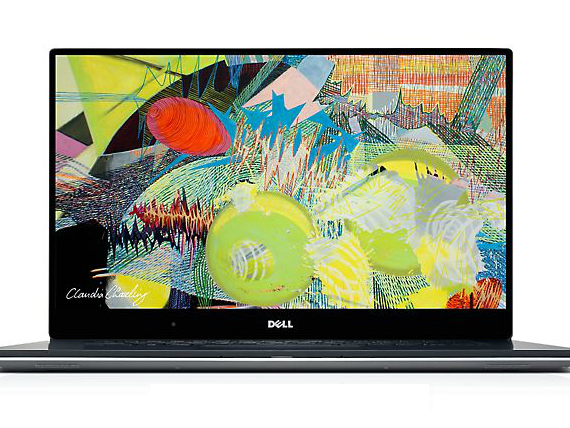
A grande tela, o tamanho pequeno, e o poder gráfico fazem com que o mais recente XPS 15 seja uma excelente solução para viajar, jogar e estudar. É um sistema muito focado, dado que não possui recursos focados para a área empresarial e opções de conectividade aptas para o uso profissional, apesar das profundas opções de cores.
Esta é uma versão reduzida da análise original. Você pode ler a análise completa em inglês aqui.
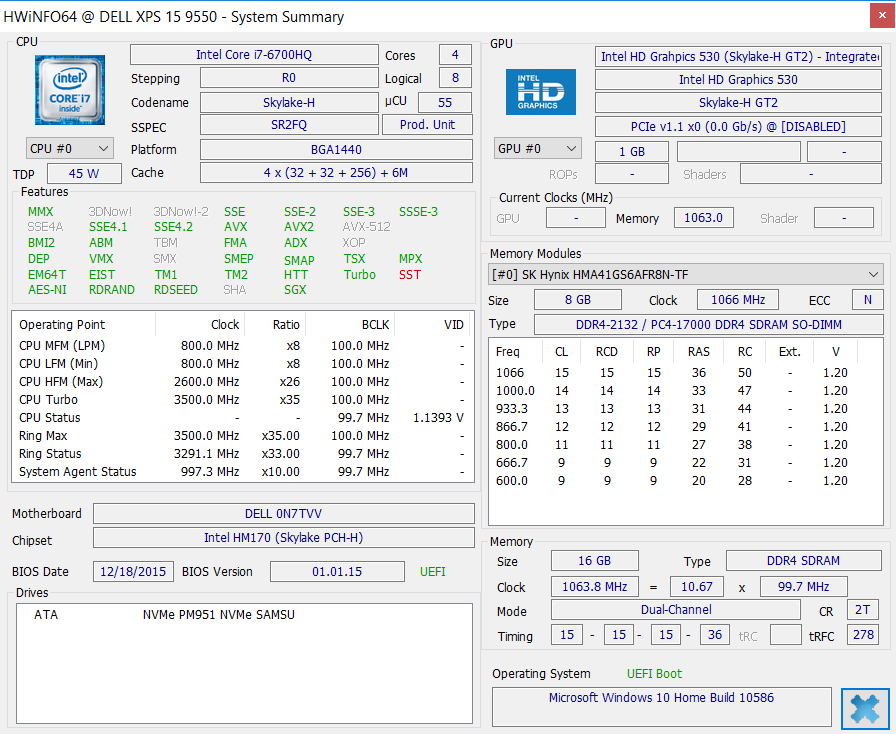
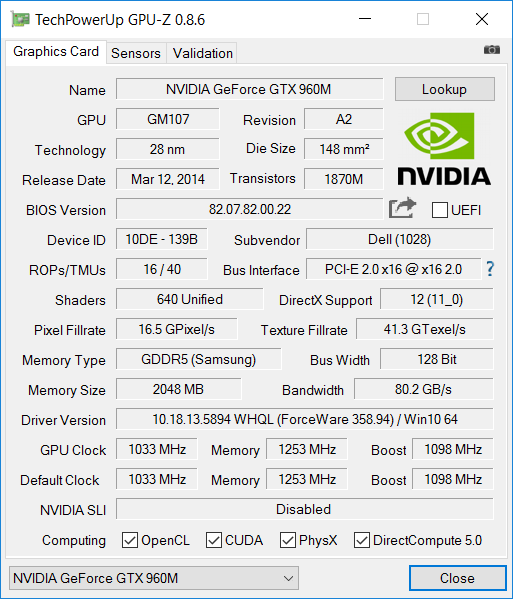
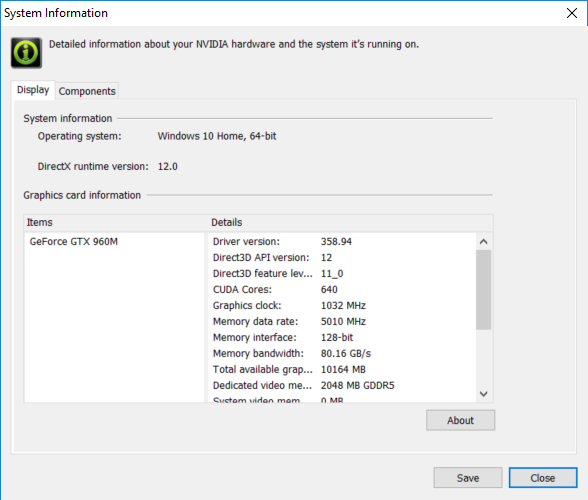
Dell XPS 15 9550 i7 FHD
- 02/08/2016 v4.1 (old)
Allen Ngo
Price comparison
