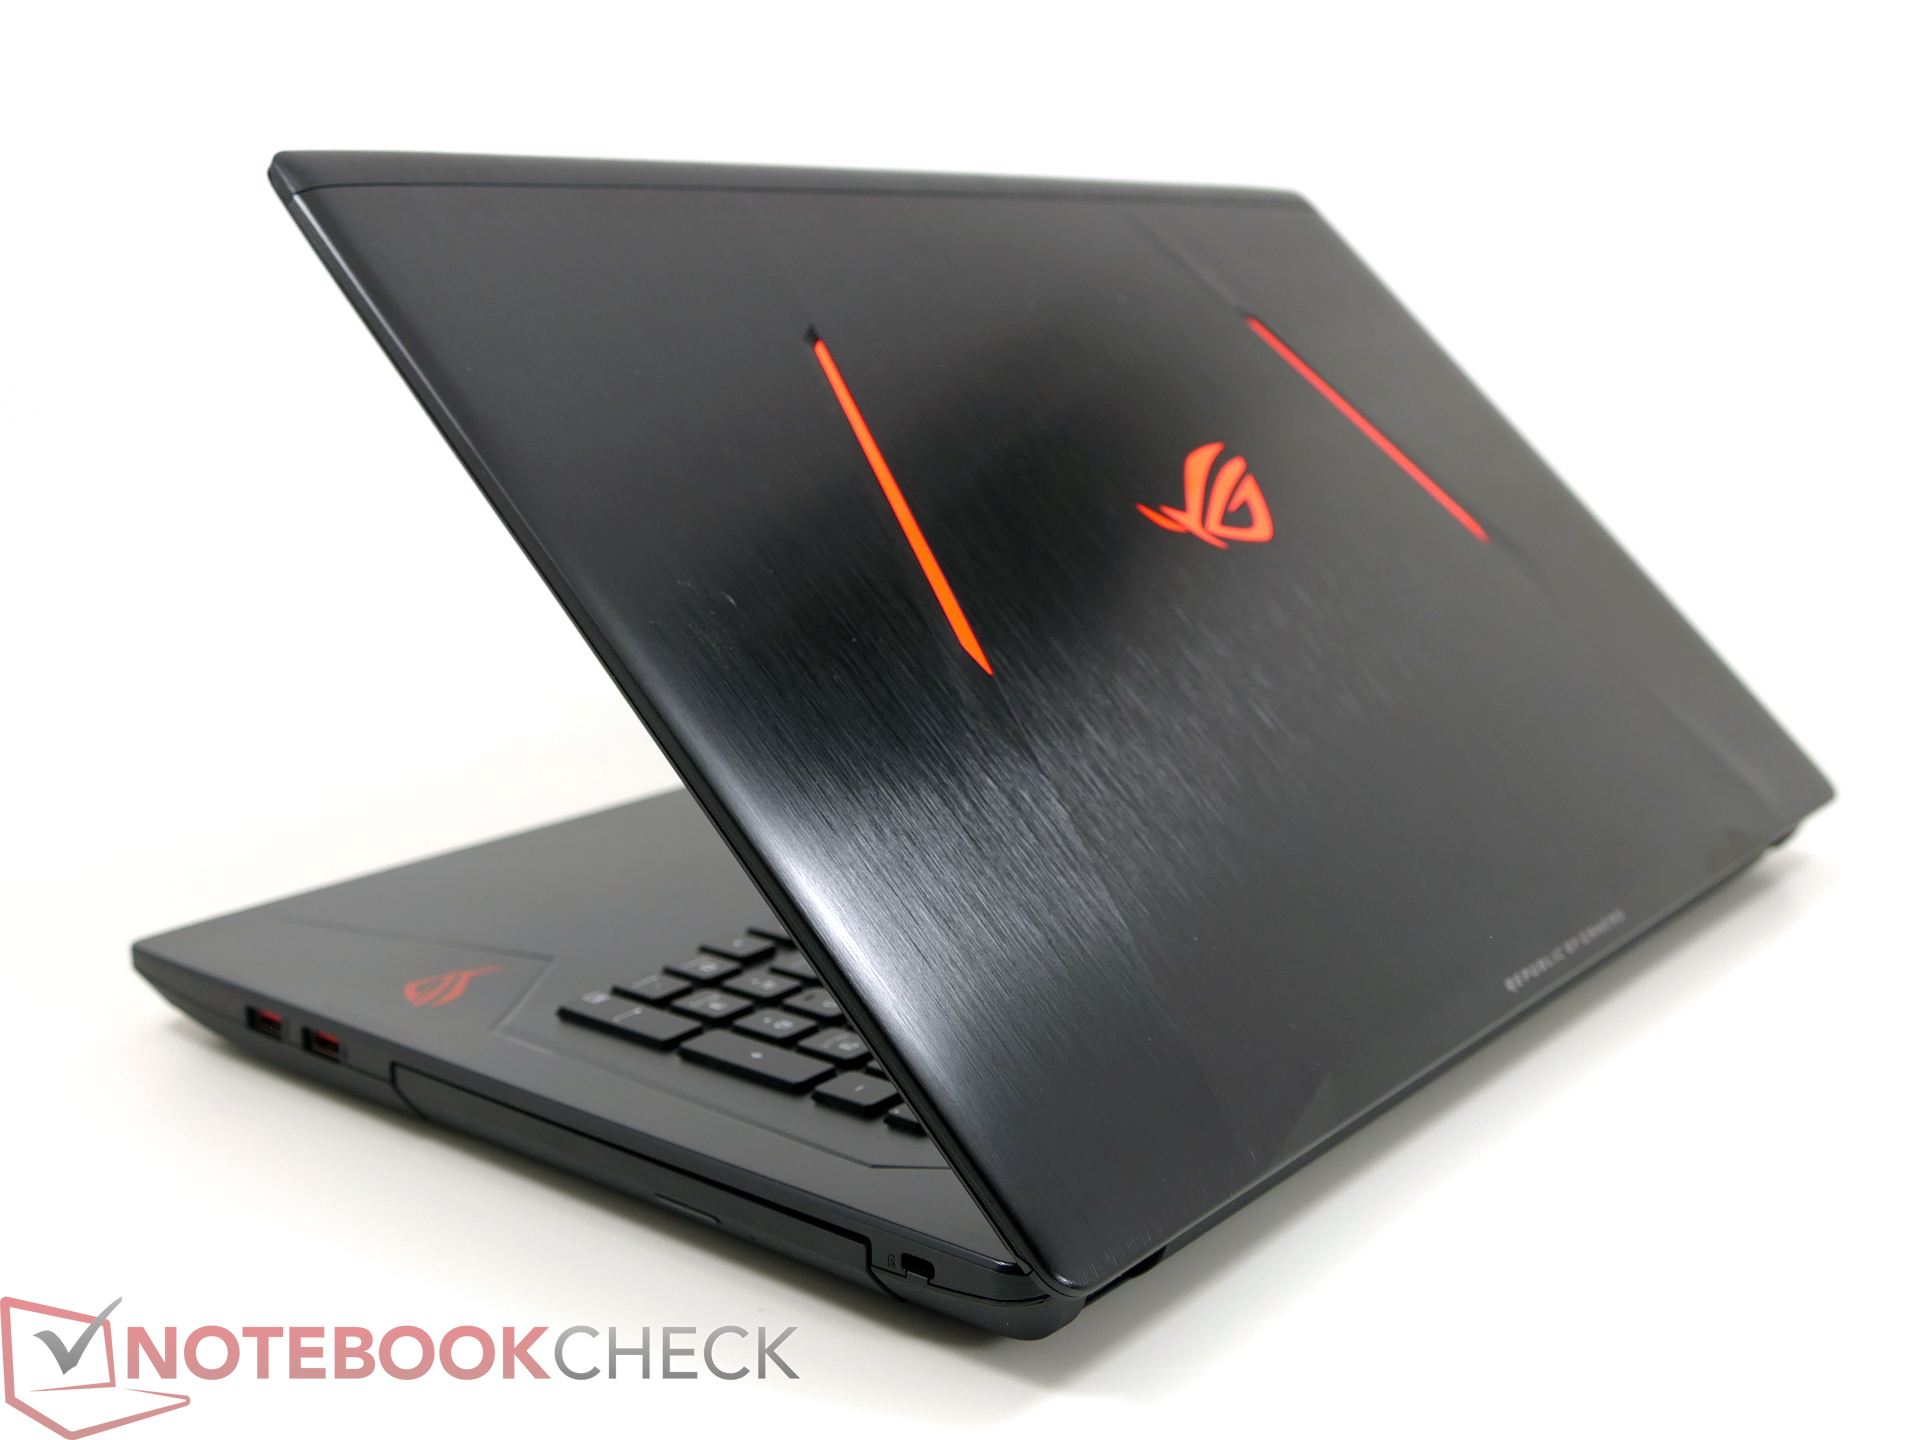
Breve Análise do Portátil Asus ROG Strix GL753VD


| SD Card Reader | |
| average JPG Copy Test (av. of 3 runs) | |
| Asus Strix GL753VD-GC045T | |
| Asus GL702VM-GC102D | |
| HP Omen 17-w010ng | |
| MSI GE72 7RE-046 | |
| MSI GE72VR-6RF16H21 | |
| maximum AS SSD Seq Read Test (1GB) | |
| HP Omen 17-w010ng | |
| Asus Strix GL753VD-GC045T | |
| Asus GL702VM-GC102D | |
| MSI GE72 7RE-046 | |
| MSI GE72VR-6RF16H21 | |
| Networking | |
| iperf3 transmit AX12 | |
| Apple MacBook Pro Retina 13 inch 2013-10 (Klaus I211) | |
| Asus Strix GL753VD-GC045T | |
| Acer Aspire VX5-591G-D0DD | |
| MSI GE72VR-6RF16H21 | |
| MSI GE72 7RE-046 | |
| iperf3 receive AX12 | |
| Apple MacBook Pro Retina 13 inch 2013-10 (Klaus I211) | |
| Asus Strix GL753VD-GC045T | |
| Acer Aspire VX5-591G-D0DD | |
| MSI GE72 7RE-046 | |
| MSI GE72VR-6RF16H21 | |
| |||||||||||||||||||||||||
iluminação: 91 %
iluminação com acumulador: 349 cd/m²
Contraste: 602:1 (Preto: 0.58 cd/m²)
ΔE ColorChecker Calman: 4.5 | ∀{0.5-29.43 Ø4.72}
ΔE Greyscale Calman: 3.3 | ∀{0.09-98 Ø4.97}
75.7% sRGB (Argyll 1.6.3 3D)
55.7% AdobeRGB 1998 (Argyll 1.6.3 3D)
62% AdobeRGB 1998 (Argyll 3D)
84.8% sRGB (Argyll 3D)
67.1% Display P3 (Argyll 3D)
Gamma: 2.15
CCT: 6103 K
| Asus Strix GL753VD-GC045T LP173WF4-SPF3, , 1920x1080, 17.3" | MSI GE72 7RE-046 N173HHE-G32 (CMN1747), , 1920x1080, 17.3" | MSI GS73VR 6RF 1920x1080, 17.3" | Asus G752VS-XB78K LG Philips LP173WF4-SPF3 (LGD04E8), , 1920x1080, 17.3" | Asus GL702VM-GC102D LG Philips LP173WF4-SPF3, , 1920x1080, 17.3" | MSI GE72VR-6RF16H21 N173HHE-G32 (CMN1747), , 1920x1080, 17.3" | HP Omen 17-w010ng AUO119B, , 3840x2160, 17.3" | |
|---|---|---|---|---|---|---|---|
| Display | 30% | 29% | 0% | -2% | 29% | 37% | |
| Display P3 Coverage (%) | 67.1 | 90.7 35% | 90 34% | 66.9 0% | 65.1 -3% | 90.2 34% | 88.5 32% |
| sRGB Coverage (%) | 84.8 | 99.9 18% | 99.9 18% | 85.2 0% | 83.5 -2% | 99.8 18% | 100 18% |
| AdobeRGB 1998 Coverage (%) | 62 | 85.2 37% | 83.6 35% | 62.3 0% | 61.1 -1% | 83.9 35% | 100 61% |
| Response Times | 44% | 42% | 5% | 3% | 44% | -23% | |
| Response Time Grey 50% / Grey 80% * (ms) | 33.2 ? | 27 ? 19% | 28 ? 16% | 38 ? -14% | 38 ? -14% | 28 ? 16% | 49 ? -48% |
| Response Time Black / White * (ms) | 28.8 ? | 9 ? 69% | 9.6 ? 67% | 22 ? 24% | 23 ? 20% | 8 ? 72% | 28 ? 3% |
| PWM Frequency (Hz) | |||||||
| Screen | 0% | 28% | 18% | -16% | 20% | 11% | |
| Brightness middle (cd/m²) | 349 | 253 -28% | 337.2 -3% | 328 -6% | 326 -7% | 270 -23% | 316 -9% |
| Brightness (cd/m²) | 337 | 230 -32% | 315 -7% | 317 -6% | 312 -7% | 254 -25% | 312 -7% |
| Brightness Distribution (%) | 91 | 86 -5% | 86 -5% | 88 -3% | 91 0% | 86 -5% | 90 -1% |
| Black Level * (cd/m²) | 0.58 | 0.24 59% | 0.308 47% | 0.3 48% | 0.5 14% | 0.26 55% | 0.29 50% |
| Contrast (:1) | 602 | 1054 75% | 1095 82% | 1093 82% | 652 8% | 1038 72% | 1090 81% |
| Colorchecker dE 2000 * | 4.5 | 5.01 -11% | 2.96 34% | 3.74 17% | 6.3 -40% | 3.33 26% | 5.69 -26% |
| Colorchecker dE 2000 max. * | 10.2 | 10.4 -2% | 5.45 47% | 8.97 12% | 11.69 -15% | 6.07 40% | 7.94 22% |
| Greyscale dE 2000 * | 3.3 | 7.26 -120% | 2.57 22% | 2.67 19% | 7.37 -123% | 3.46 -5% | 6.12 -85% |
| Gamma | 2.15 102% | 2.09 105% | 2.25 98% | 2.41 91% | 2.37 93% | 2.13 103% | 2.56 86% |
| CCT | 6103 107% | 6329 103% | 7114 91% | 6861 95% | 7116 91% | 7419 88% | 5875 111% |
| Color Space (Percent of AdobeRGB 1998) (%) | 55.7 | 76 36% | 74.3 33% | 56 1% | 55 -1% | 75 35% | 87 56% |
| Color Space (Percent of sRGB) (%) | 75.7 | 100 32% | 100 32% | 85 12% | 83 10% | 100 32% | 100 32% |
| Média Total (Programa/Configurações) | 25% /
12% | 33% /
30% | 8% /
12% | -5% /
-11% | 31% /
25% | 8% /
12% |
* ... menor é melhor
Exibir tempos de resposta
| ↔ Tempo de resposta preto para branco | ||
|---|---|---|
| 28.8 ms ... ascensão ↗ e queda ↘ combinadas | ↗ 7.6 ms ascensão | 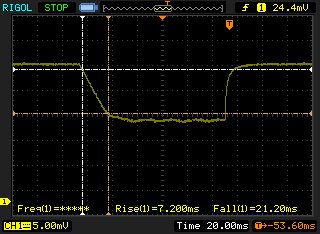 |
| ↘ 21.2 ms queda | ||
| A tela mostra taxas de resposta relativamente lentas em nossos testes e pode ser muito lenta para os jogadores. Em comparação, todos os dispositivos testados variam de 0.1 (mínimo) a 240 (máximo) ms. » 76 % de todos os dispositivos são melhores. Isso significa que o tempo de resposta medido é pior que a média de todos os dispositivos testados (19.8 ms). | ||
| ↔ Tempo de resposta 50% cinza a 80% cinza | ||
| 33.2 ms ... ascensão ↗ e queda ↘ combinadas | ↗ 14.4 ms ascensão | 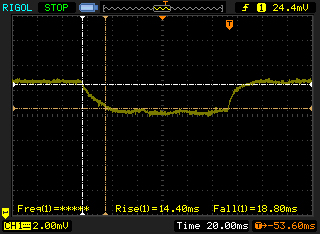 |
| ↘ 18.8 ms queda | ||
| A tela mostra taxas de resposta lentas em nossos testes e será insatisfatória para os jogadores. Em comparação, todos os dispositivos testados variam de 0.165 (mínimo) a 636 (máximo) ms. » 46 % de todos os dispositivos são melhores. Isso significa que o tempo de resposta medido é semelhante à média de todos os dispositivos testados (31 ms). | ||
Cintilação da tela / PWM (modulação por largura de pulso)
| Tela tremeluzindo / PWM não detectado | 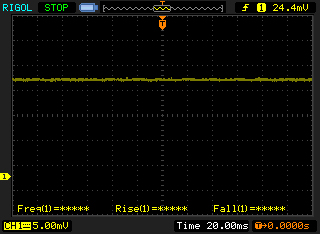 | ||
[pwm_comparison] Em comparação: 52 % de todos os dispositivos testados não usam PWM para escurecer a tela. Se PWM foi detectado, uma média de 7778 (mínimo: 5 - máximo: 343500) Hz foi medida. | |||
| Cinebench R15 | |
| CPU Single 64Bit | |
| Asus G752VS-XB78K | |
| Acer Aspire VX5-591G-D0DD | |
| Asus Strix GL753VD-GC045T | |
| HP Omen 17-w010ng | |
| MSI GE72 7RE-046 | |
| MSI GE72 965M Ti | |
| MSI GE72VR-6RF16H21 | |
| MSI GS73VR 6RF | |
| Asus GL702VM-GC102D | |
| CPU Multi 64Bit | |
| Asus G752VS-XB78K | |
| Asus Strix GL753VD-GC045T | |
| MSI GE72 7RE-046 | |
| Asus GL702VM-GC102D | |
| Acer Aspire VX5-591G-D0DD | |
| HP Omen 17-w010ng | |
| MSI GE72VR-6RF16H21 | |
| MSI GE72 965M Ti | |
| MSI GS73VR 6RF | |
| PCMark 8 - Home Score Accelerated v2 | |
| Asus G752VS-XB78K | |
| Asus GL702VM-GC102D | |
| Asus Strix GL753VD-GC045T | |
| MSI GS73VR 6RF | |
| MSI GE72VR-6RF16H21 | |
| Acer Aspire VX5-591G-D0DD | |
| HP Omen 17-w010ng | |
| PCMark 8 Home Score Accelerated v2 | 4088 pontos | |
| PCMark 10 Score | 3724 pontos | |
Ajuda | ||
| Asus Strix GL753VD-GC045T Micron SSD 1100 (MTFDDAV256TBN) | MSI GE72 7RE-046 Toshiba HG6 THNSNJ256G8NY | MSI GS73VR 6RF SanDisk SD8SN8U1T001122 | Asus G752VS-XB78K Toshiba NVMe THNSN5512GPU7 | HP Omen 17-w010ng Samsung PM951 NVMe MZVLV512 | |
|---|---|---|---|---|---|
| CrystalDiskMark 3.0 | 23% | -25% | 198% | 81% | |
| Read Seq (MB/s) | 475.7 | 540 14% | 334.3 -30% | 1718 261% | 1234 159% |
| Write Seq (MB/s) | 419.1 | 495.7 18% | 319 -24% | 1305 211% | 583 39% |
| Read 512 (MB/s) | 336.1 | 455.1 35% | 242.3 -28% | 1250 272% | 606 80% |
| Write 512 (MB/s) | 346.6 | 481.4 39% | 254.4 -27% | 1438 315% | 428.3 24% |
| Read 4k (MB/s) | 24.7 | 22.7 -8% | 20.3 -18% | 44.42 80% | 41.42 68% |
| Write 4k (MB/s) | 76.8 | 112.9 47% | 42.51 -45% | 154.4 101% | 137.2 79% |
| Read 4k QD32 (MB/s) | 247.6 | 372.5 50% | 251.6 2% | 744 200% | 622 151% |
| Write 4k QD32 (MB/s) | 234.9 | 212.9 -9% | 167.1 -29% | 578 146% | 348.3 48% |

| 3DMark 11 - 1280x720 Performance GPU | |
| Asus GL702VM-GC102D | |
| MSI GE72 7RE-046 | |
| Asus Strix GL502VT-DS74 | |
| Acer Aspire VX5-591G-D0DD | |
| HP Omen 17-w010ng | |
| Asus Strix GL753VD-GC045T | |
| Asus GL752VW-T4168T | |
| Asus N752VX-GC131T | |
| 3DMark 06 Standard Score | 27411 pontos | |
| 3DMark 11 Performance | 7524 pontos | |
| 3DMark Cloud Gate Standard Score | 19688 pontos | |
| 3DMark Fire Strike Score | 4965 pontos | |
| 3DMark Fire Strike Extreme Score | 2444 pontos | |
| 3DMark Time Spy Score | 1665 pontos | |
Ajuda | ||
| The Witcher 3 | |
| 1920x1080 High Graphics & Postprocessing (Nvidia HairWorks Off) | |
| MSI GE72 7RE-046 | |
| Schenker W504 | |
| Acer Aspire VX5-591G-D0DD | |
| MSI GE72 965M Ti | |
| Asus Strix GL753VD-GC045T | |
| Schenker XMG A505 | |
| 1920x1080 Ultra Graphics & Postprocessing (HBAO+) | |
| MSI GE72 7RE-046 | |
| Schenker W504 | |
| Acer Aspire VX5-591G-D0DD | |
| MSI GE72 965M Ti | |
| Asus Strix GL753VD-GC045T | |
| Schenker XMG A505 | |
| World of Warships | |
| 1920x1080 High Preset AF:8x | |
| Asus Strix GL753VD-GC045T | |
| Acer Aspire VX5-591G-D0DD | |
| MSI GE72 965M Ti | |
| 1920x1080 Very High Preset AA:High FX AF:16x | |
| Acer Aspire VX5-591G-D0DD | |
| Asus Strix GL753VD-GC045T | |
| MSI GE72 965M Ti | |
| Fallout 4 | |
| 1920x1080 High Preset AA:T AF:16x | |
| MSI GE72 7RE-046 | |
| Acer Aspire VX5-591G-D0DD | |
| Schenker W504 | |
| MSI GE72 965M Ti | |
| Asus Strix GL753VD-GC045T | |
| Schenker XMG A505 | |
| 1920x1080 Ultra Preset AA:T AF:16x | |
| MSI GE72 7RE-046 | |
| Acer Aspire VX5-591G-D0DD | |
| Schenker W504 | |
| MSI GE72 965M Ti | |
| Asus Strix GL753VD-GC045T | |
| Schenker XMG A505 | |
| Rise of the Tomb Raider | |
| 1920x1080 High Preset AA:FX AF:4x | |
| MSI GE72 7RE-046 | |
| Acer Aspire VX5-591G-D0DD | |
| Schenker W504 | |
| MSI GE72 965M Ti | |
| Asus Strix GL753VD-GC045T | |
| Schenker XMG A505 | |
| 1920x1080 Very High Preset AA:FX AF:16x | |
| MSI GE72 7RE-046 | |
| Acer Aspire VX5-591G-D0DD | |
| Schenker W504 | |
| Asus Strix GL753VD-GC045T | |
| MSI GE72 965M Ti | |
| Schenker XMG A505 | |
| FIFA 17 | |
| 1920x1080 High Preset | |
| Asus GL702VM-GC102D | |
| Schenker W504 | |
| Asus Strix GL753VD-GC045T | |
| MSI GE72 7RE-046 | |
| Schenker XMG A505 | |
| Acer Aspire VX5-591G-D0DD | |
| 1920x1080 Ultra Preset AA:4xMS | |
| Asus GL702VM-GC102D | |
| Schenker W504 | |
| MSI GE72 965M Ti | |
| Asus Strix GL753VD-GC045T | |
| MSI GE72 7RE-046 | |
| Acer Aspire VX5-591G-D0DD | |
| Schenker XMG A505 | |
| Battlefield 1 | |
| 1920x1080 High Preset AA:T | |
| Asus GL702VM-GC102D | |
| Schenker W504 | |
| MSI GE72 7RE-046 | |
| Acer Aspire VX5-591G-D0DD | |
| MSI GE72 965M Ti | |
| Asus Strix GL753VD-GC045T | |
| Schenker XMG A505 | |
| 1920x1080 Ultra Preset AA:T | |
| Asus GL702VM-GC102D | |
| Schenker W504 | |
| MSI GE72 7RE-046 | |
| Acer Aspire VX5-591G-D0DD | |
| MSI GE72 965M Ti | |
| Asus Strix GL753VD-GC045T | |
| Schenker XMG A505 | |
| Titanfall 2 | |
| 1920x1080 High / Enabled AA:TS AF:8x | |
| Asus GL702VM-GC102D | |
| Acer Aspire VX5-591G-D0DD | |
| MSI GE72 7RE-046 | |
| Asus Strix GL753VD-GC045T | |
| Schenker W504 | |
| MSI GE72 965M Ti | |
| Schenker XMG A505 | |
| 1920x1080 Very High (Insane Texture Quality) / Enabled AA:TS AF:16x | |
| Asus GL702VM-GC102D | |
| Acer Aspire VX5-591G-D0DD | |
| Asus Strix GL753VD-GC045T | |
| MSI GE72 7RE-046 | |
| Schenker W504 | |
| MSI GE72 965M Ti | |
| Schenker XMG A505 | |
| baixo | média | alto | ultra | 4K | |
|---|---|---|---|---|---|
| Metro: Last Light (2013) | 74 | 40 | |||
| Sims 4 (2014) | 73 | ||||
| The Witcher 3 (2015) | 112.3 | 66.9 | 29.1 | 19.7 | |
| Dota 2 Reborn (2015) | 154 | 143 | 126 | 117 | |
| World of Warships (2015) | 154 | 131 | 109 | 79 | |
| Anno 2205 (2015) | 113 | 92 | 43.7 | 13.9 | |
| Fallout 4 (2015) | 116.6 | 74.6 | 41.2 | 33.9 | |
| Rainbow Six Siege (2015) | 209 | 133 | 71 | 58 | |
| Rise of the Tomb Raider (2016) | 110.1 | 63.2 | 37.1 | 31.2 | |
| XCOM 2 (2016) | 94 | 44.6 | 27.4 | 13.6 | |
| Far Cry Primal (2016) | 99 | 47 | 41 | 30 | |
| The Division (2016) | 70 | 33.2 | 25.4 | ||
| Ashes of the Singularity (2016) | 32.4 | 28.6 | |||
| Doom (2016) | 51.7 | 48.2 | 16.2 | ||
| Overwatch (2016) | 90 | 53.8 | 27.9 | ||
| Deus Ex Mankind Divided (2016) | 71.7 | 53.6 | 29.6 | 15.3 | |
| FIFA 17 (2016) | 224 | 199 | 144 | 131 | |
| Mafia 3 (2016) | 52.7 | 34.4 | 22 | ||
| Battlefield 1 (2016) | 145.6 | 101.7 | 46.5 | 41.1 | |
| Civilization 6 (2016) | 73 | 60.2 | 39.4 | 31.7 | |
| Farming Simulator 17 (2016) | 74 | 37 () | |||
| Titanfall 2 (2016) | 130.6 | 81.5 | 60.7 | 61 | |
| Call of Duty Infinite Warfare (2016) | 99 | 89 | 51.1 | 46.2 | 19.1 |
| Dishonored 2 (2016) | 76 | 66 | 37.4 | 32.7 | |
| Watch Dogs 2 (2016) | 72 | 61.2 | 32 | 19.8 | |
| Warhammer 40.000: Dawn of War III (2017) | 106 | 33.6 | 22.2 | 18.8 | |
| Team Fortress 2 (2017) | 117 | 111 | 61.5 | ||
| Playerunknown's Battlegrounds (PUBG) (2017) | 87 | 39.6 | 34.5 | 24.2 | |
| F1 2017 (2017) | 133 | 67 | 52 | 33 |
Barulho
| Ocioso |
| 33.9 / 33.9 / 37.8 dB |
| Carga |
| 42.7 / 47.4 dB |
 | ||
30 dB silencioso 40 dB(A) audível 50 dB(A) ruidosamente alto |
||
min: | ||
(+) A temperatura máxima no lado superior é 37.7 °C / 100 F, em comparação com a média de 40.4 °C / 105 F , variando de 21.2 a 68.8 °C para a classe Gaming.
(+) A parte inferior aquece até um máximo de 36.3 °C / 97 F, em comparação com a média de 43.2 °C / 110 F
(+) Em uso inativo, a temperatura média para o lado superior é 24.1 °C / 75 F, em comparação com a média do dispositivo de 33.9 °C / ### class_avg_f### F.
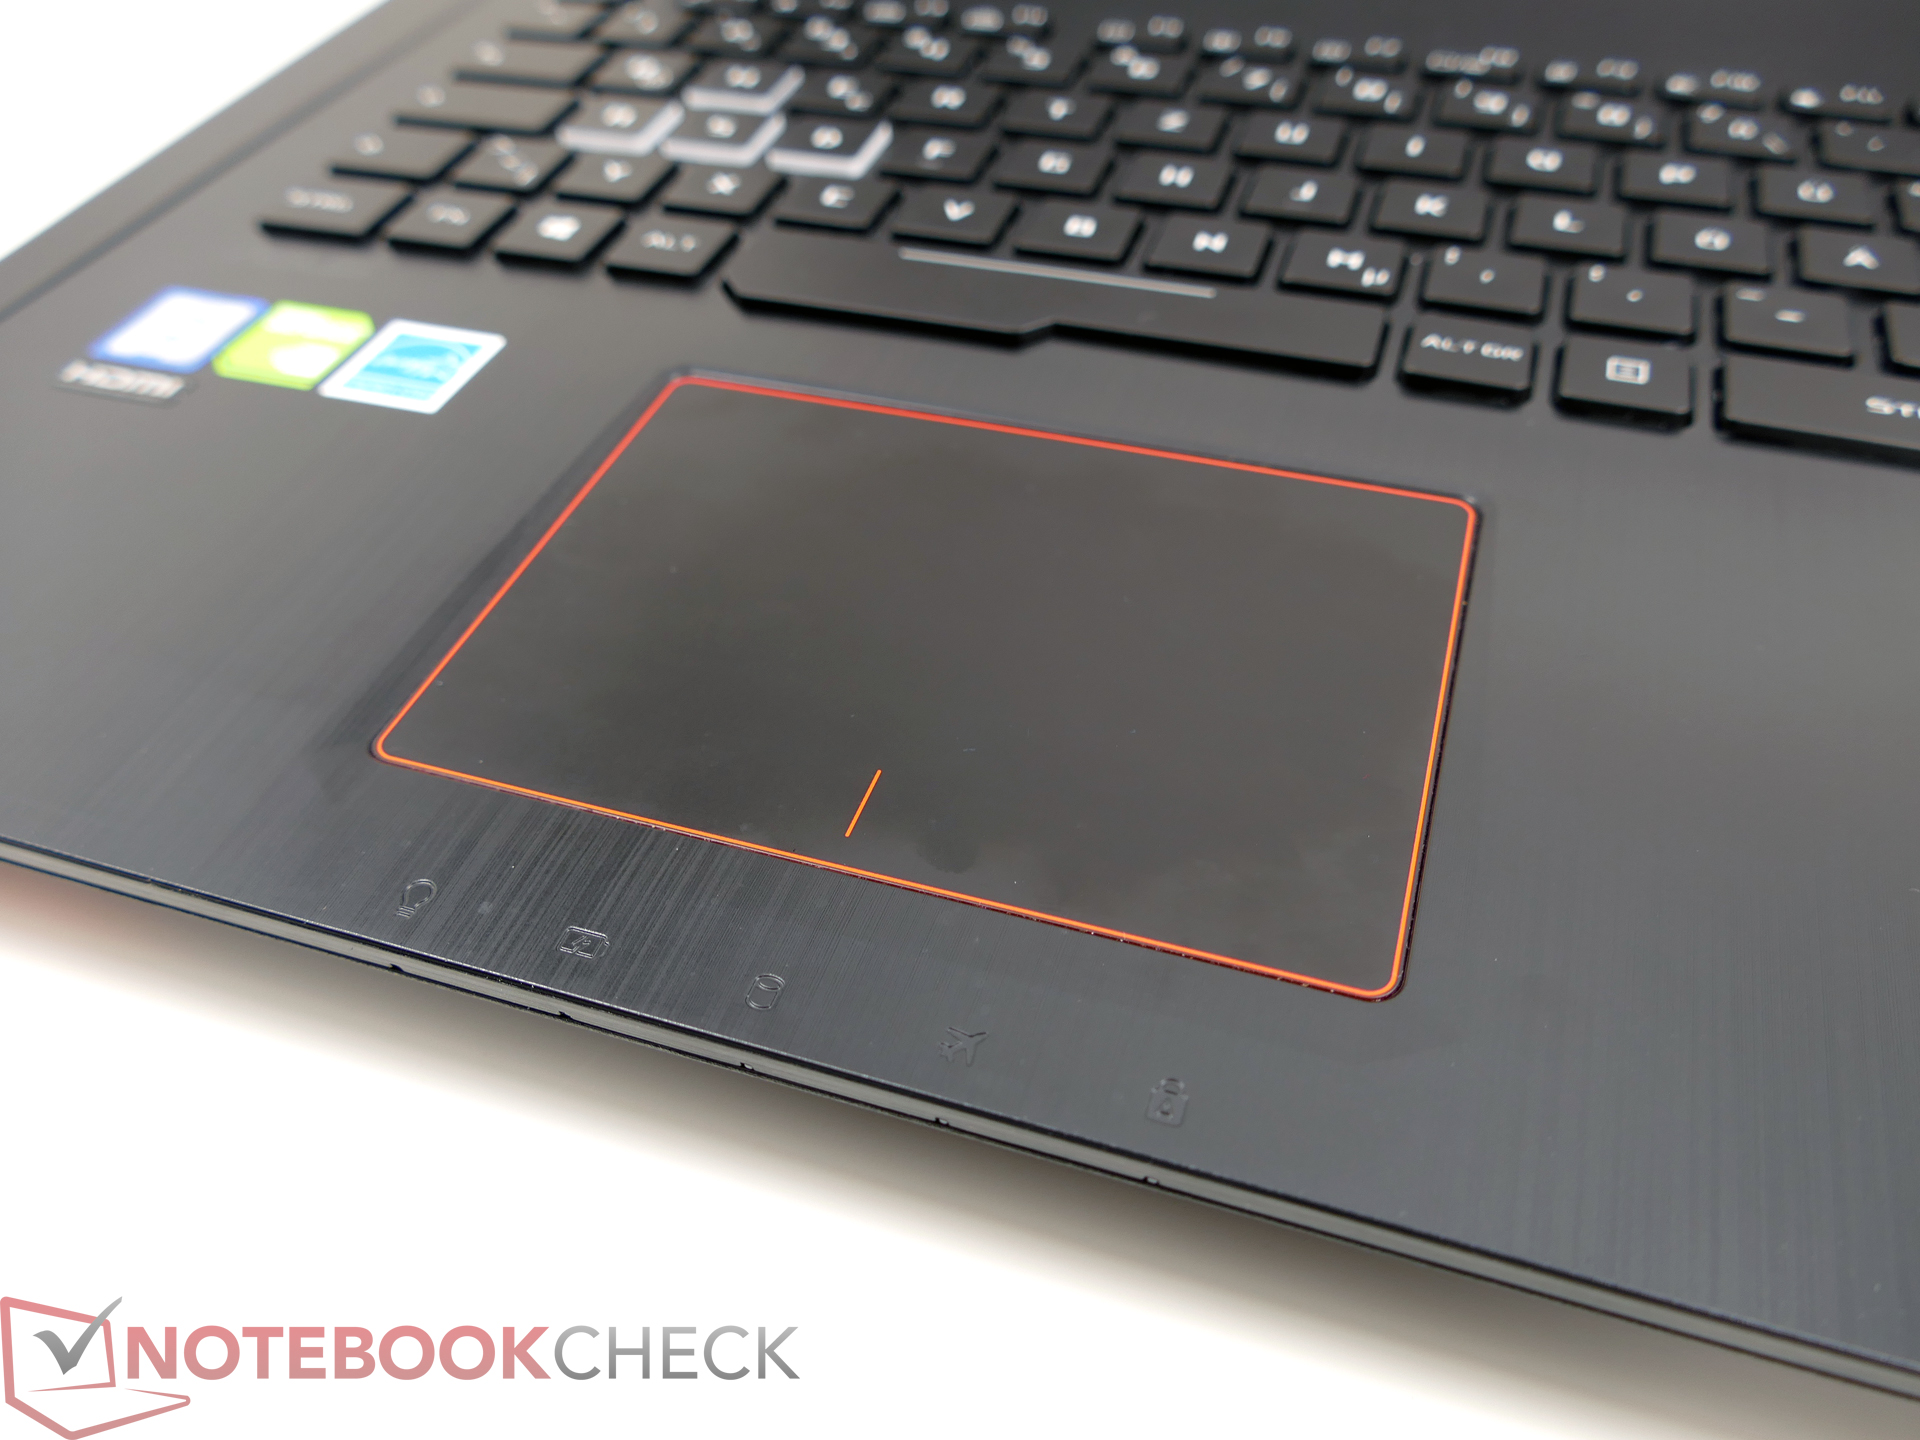
(+) Os apoios para as mãos e o touchpad estão atingindo a temperatura máxima da pele (32.3 °C / 90.1 F) e, portanto, não estão quentes.
(-) A temperatura média da área do apoio para as mãos de dispositivos semelhantes foi 28.8 °C / 83.8 F (-3.5 °C / -6.3 F).
Asus Strix GL753VD-GC045T análise de áudio
(±) | o volume do alto-falante é médio, mas bom (###valor### dB)
Graves 100 - 315Hz
(-) | quase nenhum baixo - em média 15.8% menor que a mediana
(±) | a linearidade dos graves é média (12.2% delta para a frequência anterior)
Médios 400 - 2.000 Hz
(+) | médios equilibrados - apenas 3.1% longe da mediana
(±) | a linearidade dos médios é média (7% delta para frequência anterior)
Altos 2 - 16 kHz
(±) | máximos mais altos - em média 6.3% maior que a mediana
(+) | os máximos são lineares (5.4% delta da frequência anterior)
Geral 100 - 16.000 Hz
(±) | a linearidade do som geral é média (17.2% diferença em relação à mediana)
Comparado com a mesma classe
» 46% de todos os dispositivos testados nesta classe foram melhores, 11% semelhantes, 42% piores
» O melhor teve um delta de 6%, a média foi 18%, o pior foi 132%
Comparado com todos os dispositivos testados
» 32% de todos os dispositivos testados foram melhores, 8% semelhantes, 60% piores
» O melhor teve um delta de 4%, a média foi 24%, o pior foi 134%
Apple MacBook 12 (Early 2016) 1.1 GHz análise de áudio
(+) | os alto-falantes podem tocar relativamente alto (###valor### dB)
Graves 100 - 315Hz
(±) | graves reduzidos - em média 11.3% menor que a mediana
(±) | a linearidade dos graves é média (14.2% delta para a frequência anterior)
Médios 400 - 2.000 Hz
(+) | médios equilibrados - apenas 2.4% longe da mediana
(+) | médios são lineares (5.5% delta para frequência anterior)
Altos 2 - 16 kHz
(+) | agudos equilibrados - apenas 2% longe da mediana
(+) | os máximos são lineares (4.5% delta da frequência anterior)
Geral 100 - 16.000 Hz
(+) | o som geral é linear (10.2% diferença em relação à mediana)
Comparado com a mesma classe
» 7% de todos os dispositivos testados nesta classe foram melhores, 2% semelhantes, 91% piores
» O melhor teve um delta de 5%, a média foi 18%, o pior foi 53%
Comparado com todos os dispositivos testados
» 5% de todos os dispositivos testados foram melhores, 1% semelhantes, 94% piores
» O melhor teve um delta de 4%, a média foi 24%, o pior foi 134%
| desligado | |
| Ocioso | |
| Carga |
|
Key:
min: | |
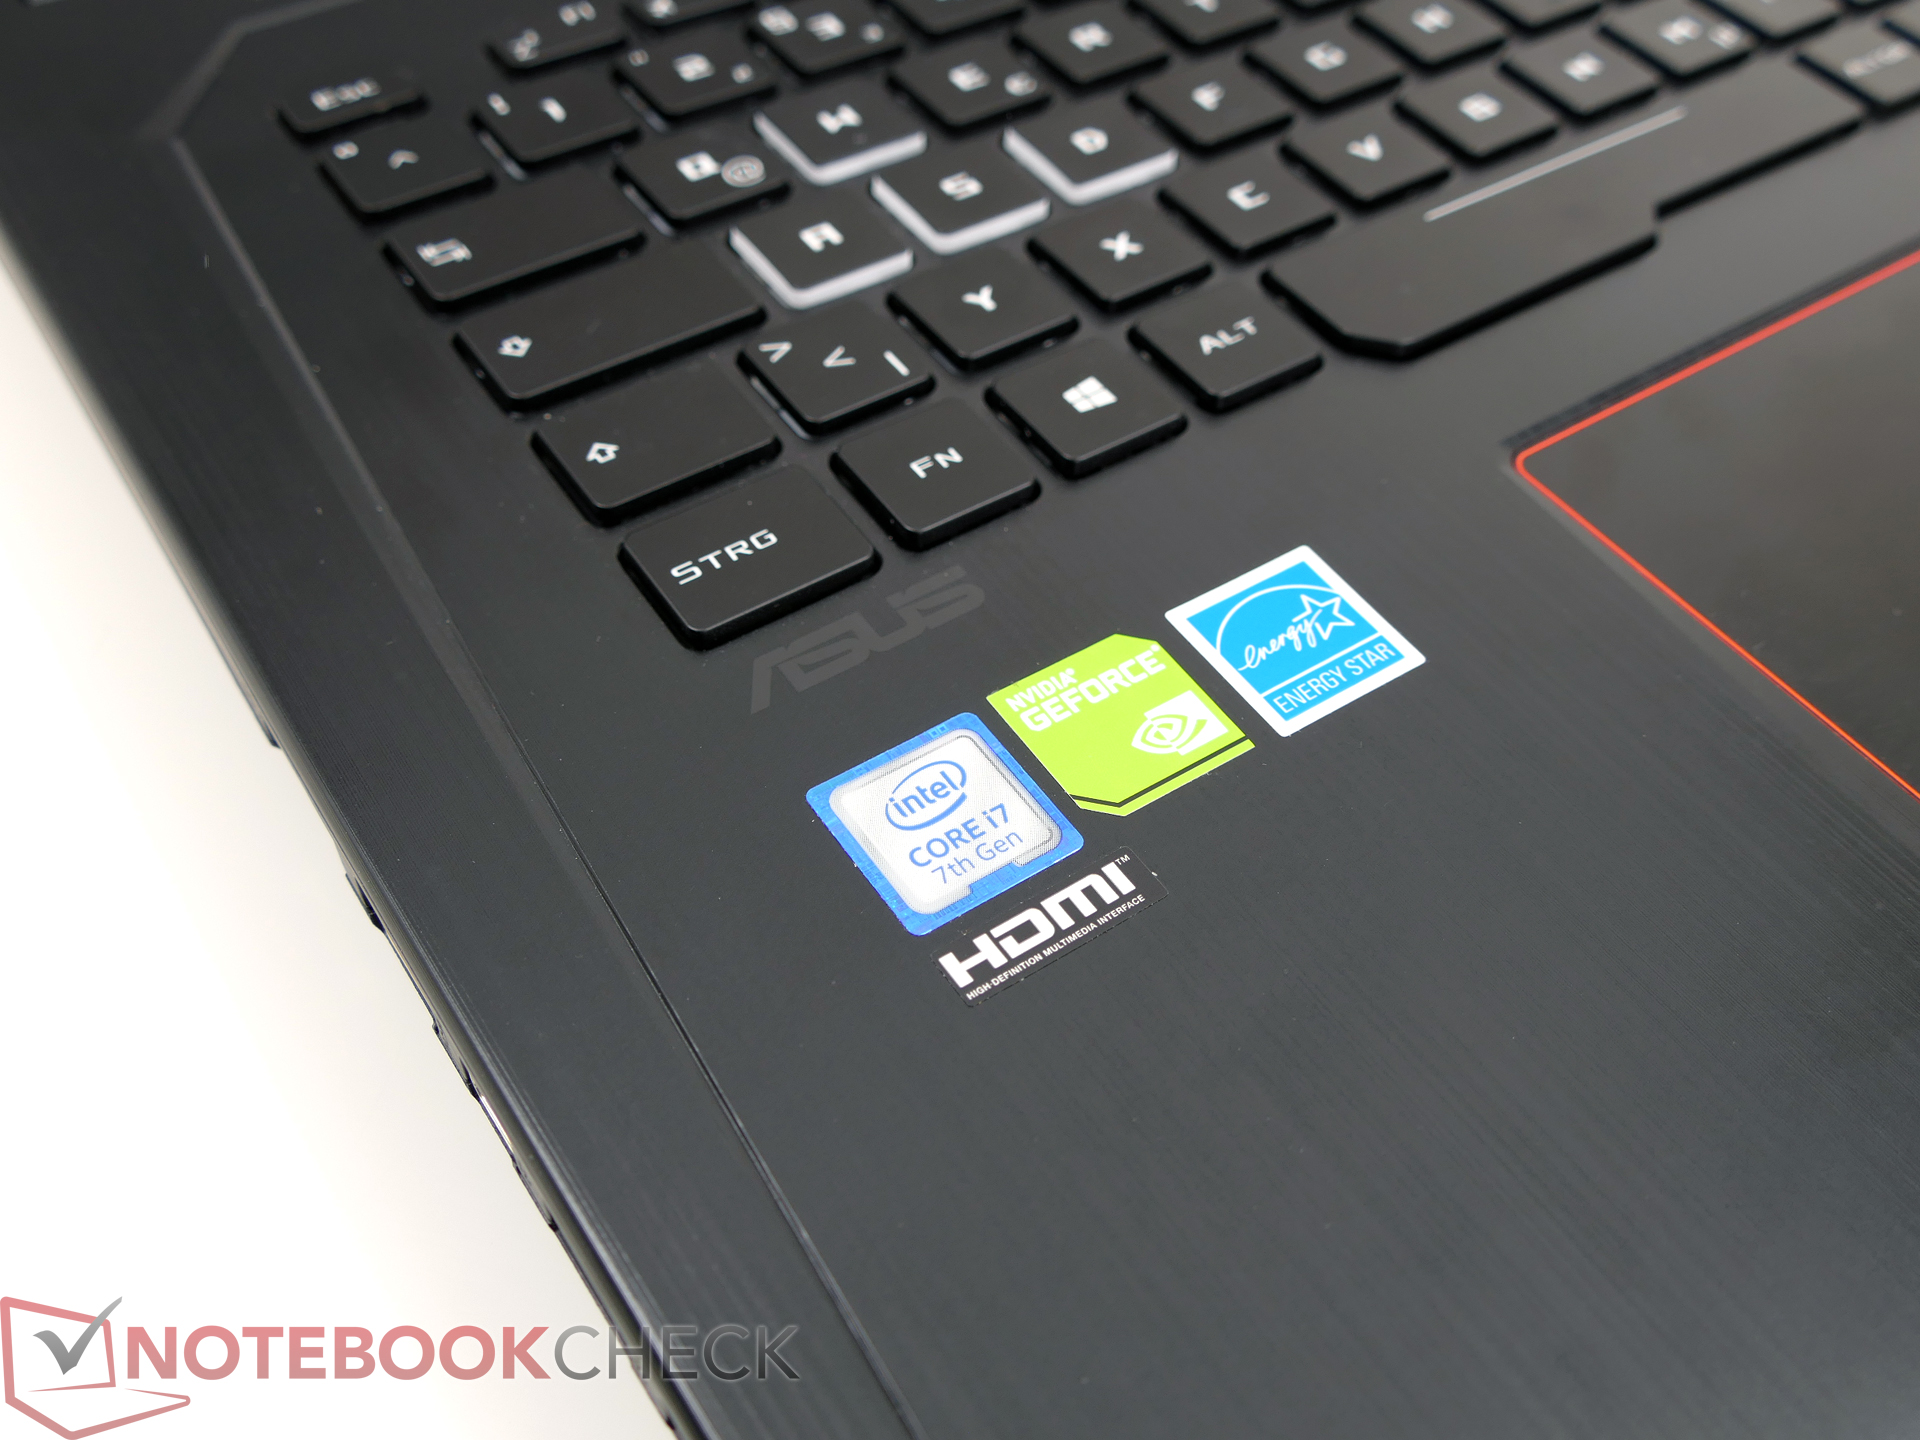
| Asus Strix GL753VD-GC045T i7-7700HQ, GeForce GTX 1050 Mobile, Micron SSD 1100 (MTFDDAV256TBN), LED IPS, 1920x1080, 17.3" | HP Pavilion 17 FHD V3A33AV 6700HQ, GeForce GTX 960M, SanDisk Z400s SD8SNAT-128G, IPS, 1920x1080, 17.3" | MSI GE72 7RE-046 i7-7700HQ, GeForce GTX 1050 Ti Mobile, Toshiba HG6 THNSNJ256G8NY, TN LED, 1920x1080, 17.3" | Asus GL702VM-GC102D 6700HQ, GeForce GTX 1060 Mobile, HGST Travelstar 7K1000 HTS721010A9E630, IPS, 1920x1080, 17.3" | Asus G752VS-XB78K 6820HK, GeForce GTX 1070 Mobile, Toshiba NVMe THNSN5512GPU7, IPS, 1920x1080, 17.3" | |
|---|---|---|---|---|---|
| Power Consumption | 13% | -54% | -58% | -133% | |
| Idle Minimum * (Watt) | 6.2 | 5.3 15% | 14 -126% | 15.6 -152% | 24 -287% |
| Idle Average * (Watt) | 12.2 | 10.6 13% | 20 -64% | 20.2 -66% | 31 -154% |
| Idle Maximum * (Watt) | 14.8 | 11.8 20% | 25 -69% | 21.4 -45% | 36 -143% |
| Load Average * (Watt) | 84.9 | 70.9 16% | 82 3% | 90 -6% | 94 -11% |
| Load Maximum * (Watt) | 120.7 | 119.8 1% | 135 -12% | 147 -22% | 204 -69% |
* ... menor é melhor
| Asus Strix GL753VD-GC045T i7-7700HQ, GeForce GTX 1050 Mobile, 48 Wh | HP Pavilion 17 FHD V3A33AV 6700HQ, GeForce GTX 960M, 62 Wh | HP Omen 17-w010ng 6700HQ, GeForce GTX 965M, 62 Wh | MSI GE72 7RE-046 i7-7700HQ, GeForce GTX 1050 Ti Mobile, 51.4 Wh | Asus GL702VM-GC102D 6700HQ, GeForce GTX 1060 Mobile, 76 Wh | Asus G752VS-XB78K 6820HK, GeForce GTX 1070 Mobile, 90 Wh | |
|---|---|---|---|---|---|---|
| Duração da bateria | 64% | 13% | -30% | 17% | 5% | |
| Reader / Idle (h) | 8.6 | 12.5 45% | 7.3 -15% | 5.9 -31% | 5.2 -40% | |
| WiFi v1.3 (h) | 4.4 | 5.9 34% | 4 -9% | 3.1 -30% | 4.2 -5% | 3.5 -20% |
| Load (h) | 0.8 | 1.7 113% | 1.3 63% | 1.5 88% | 1.4 75% | |
| H.264 (h) | 3.6 | 3.3 | 4.4 | 3.1 |
Pro
Contra
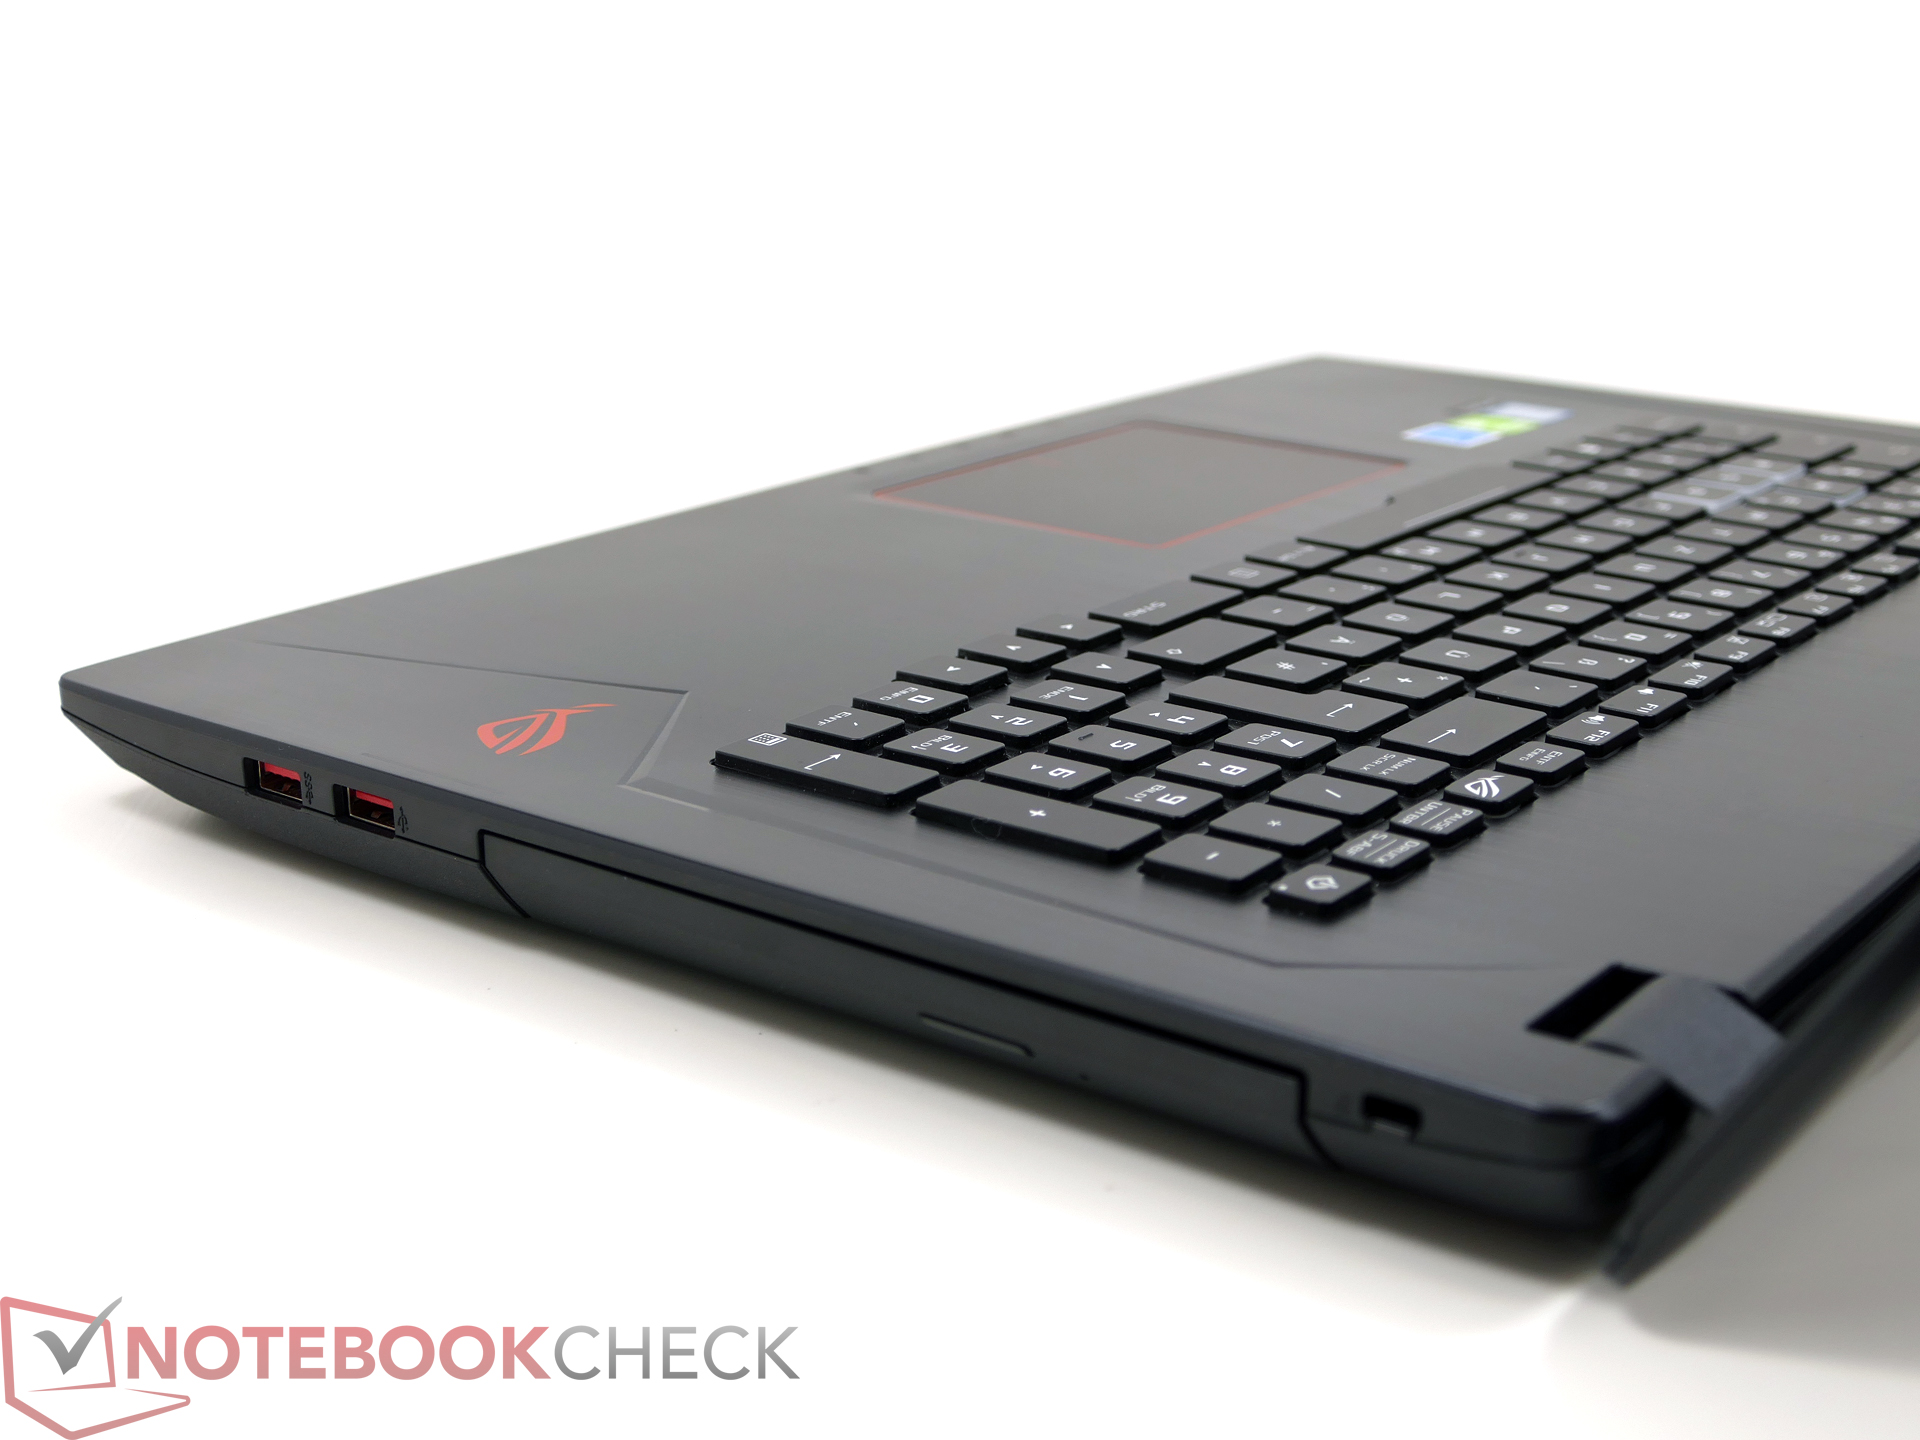
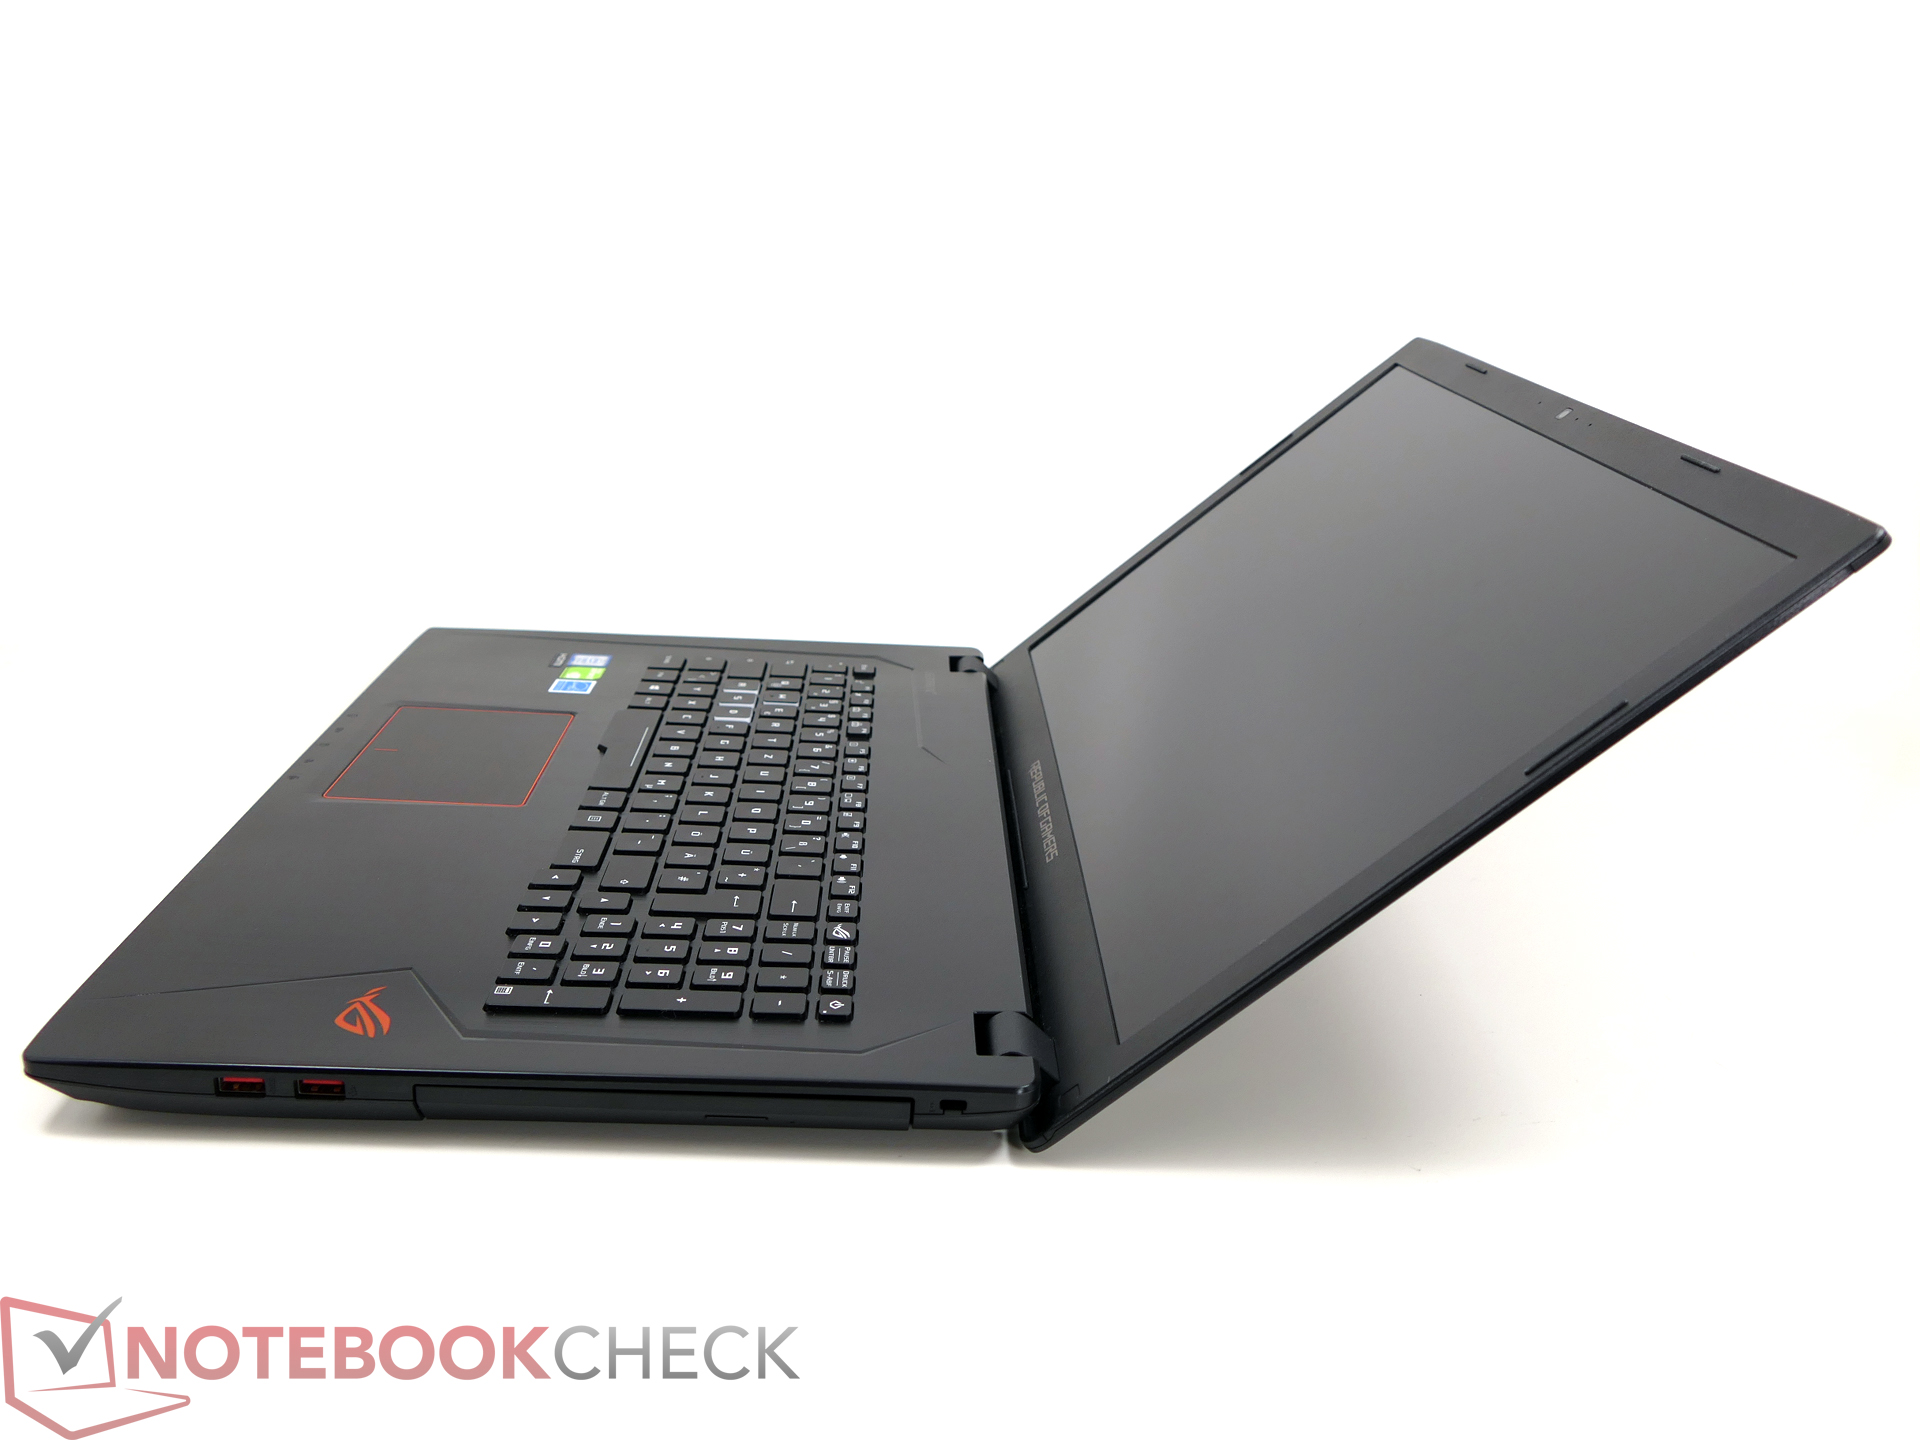
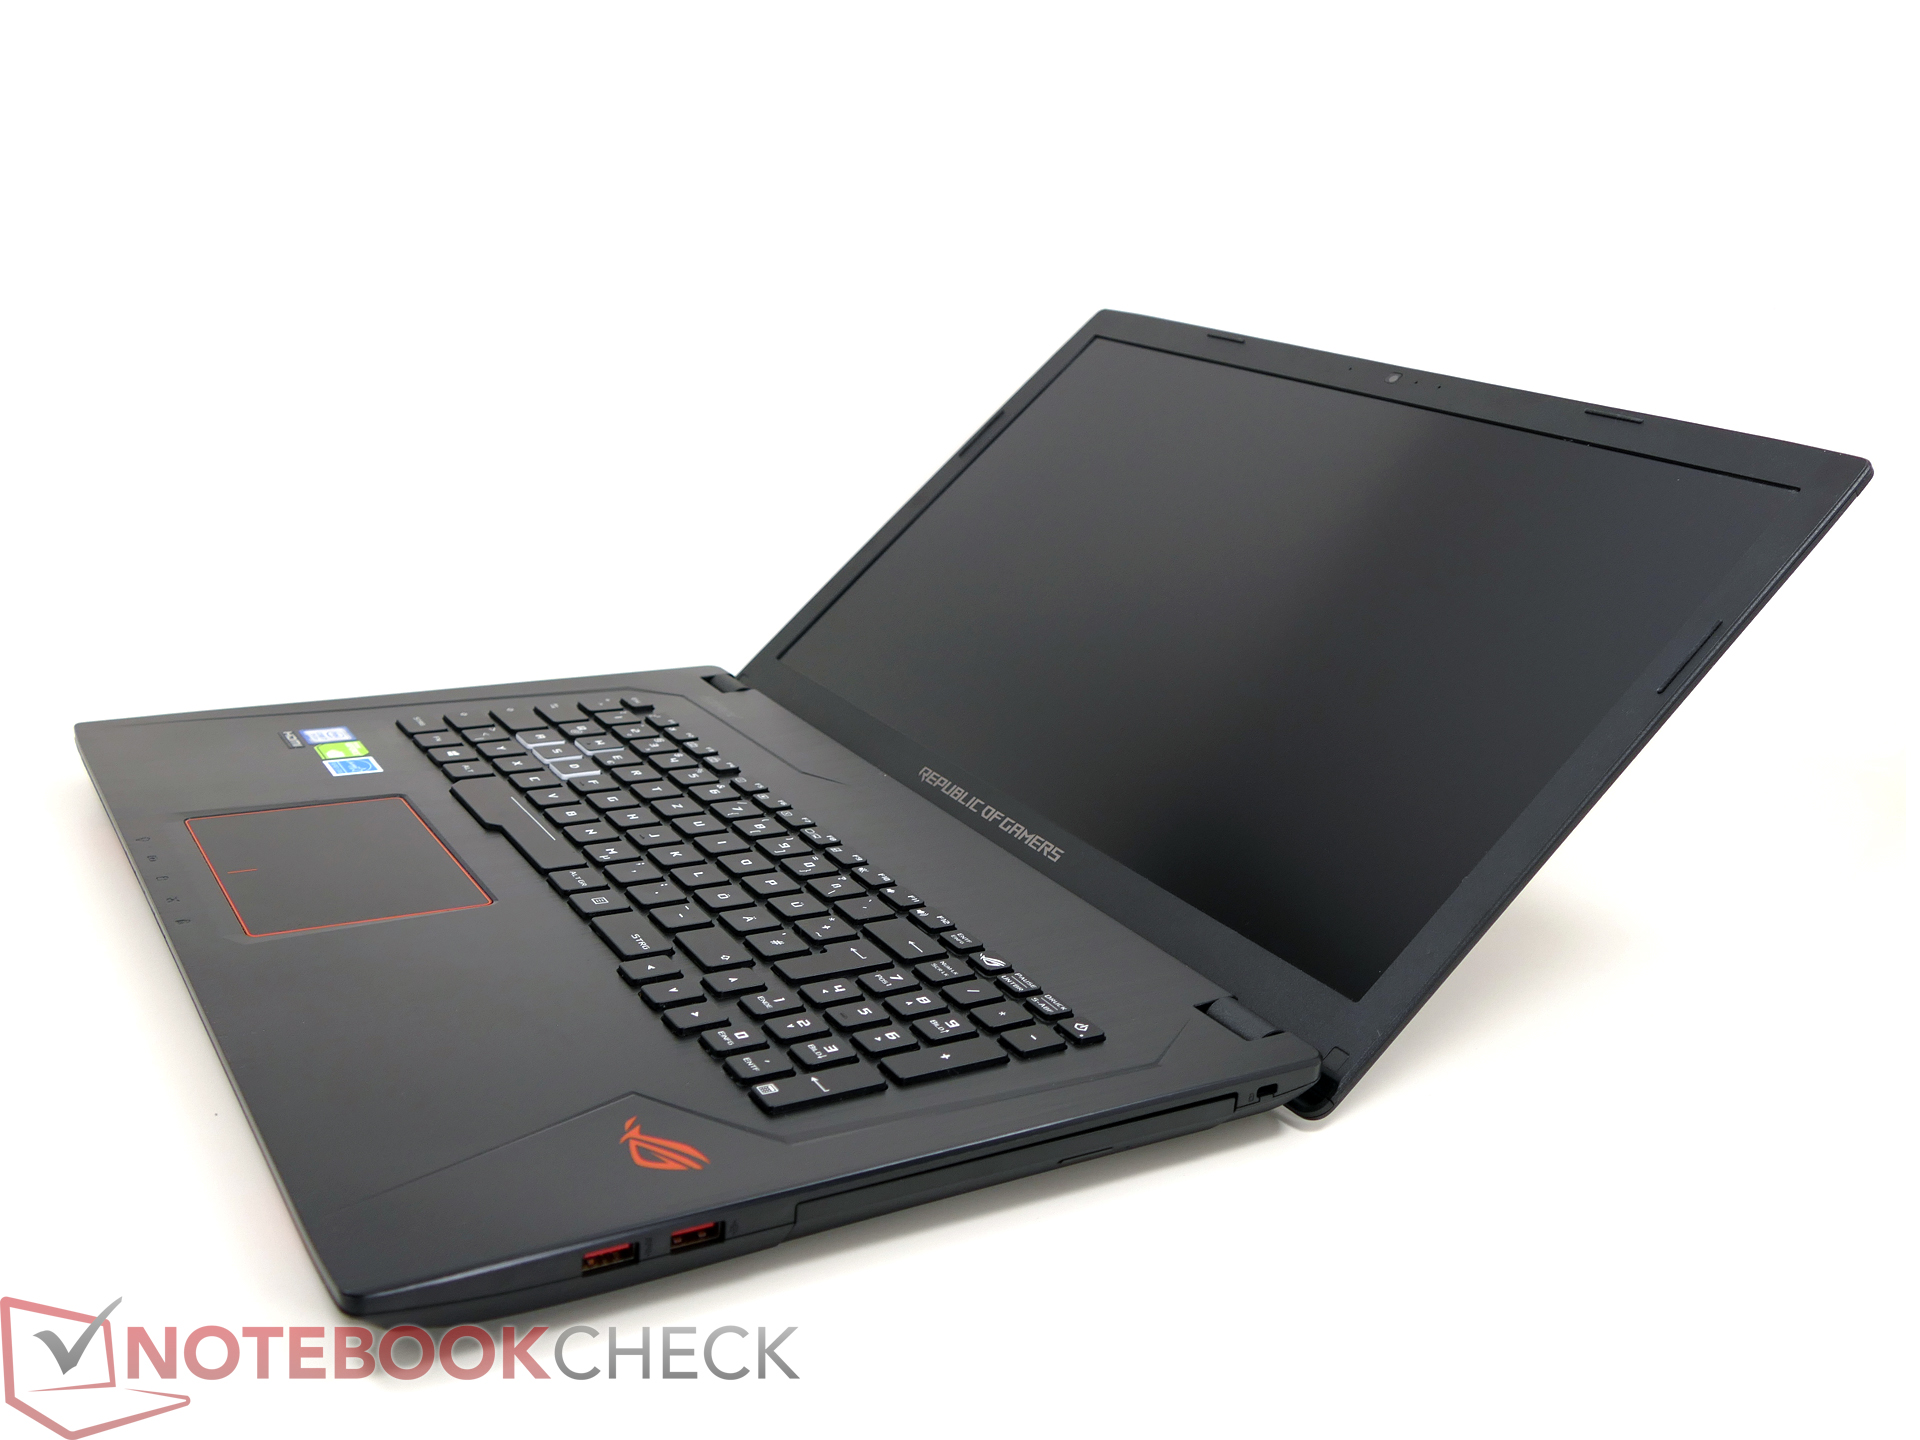
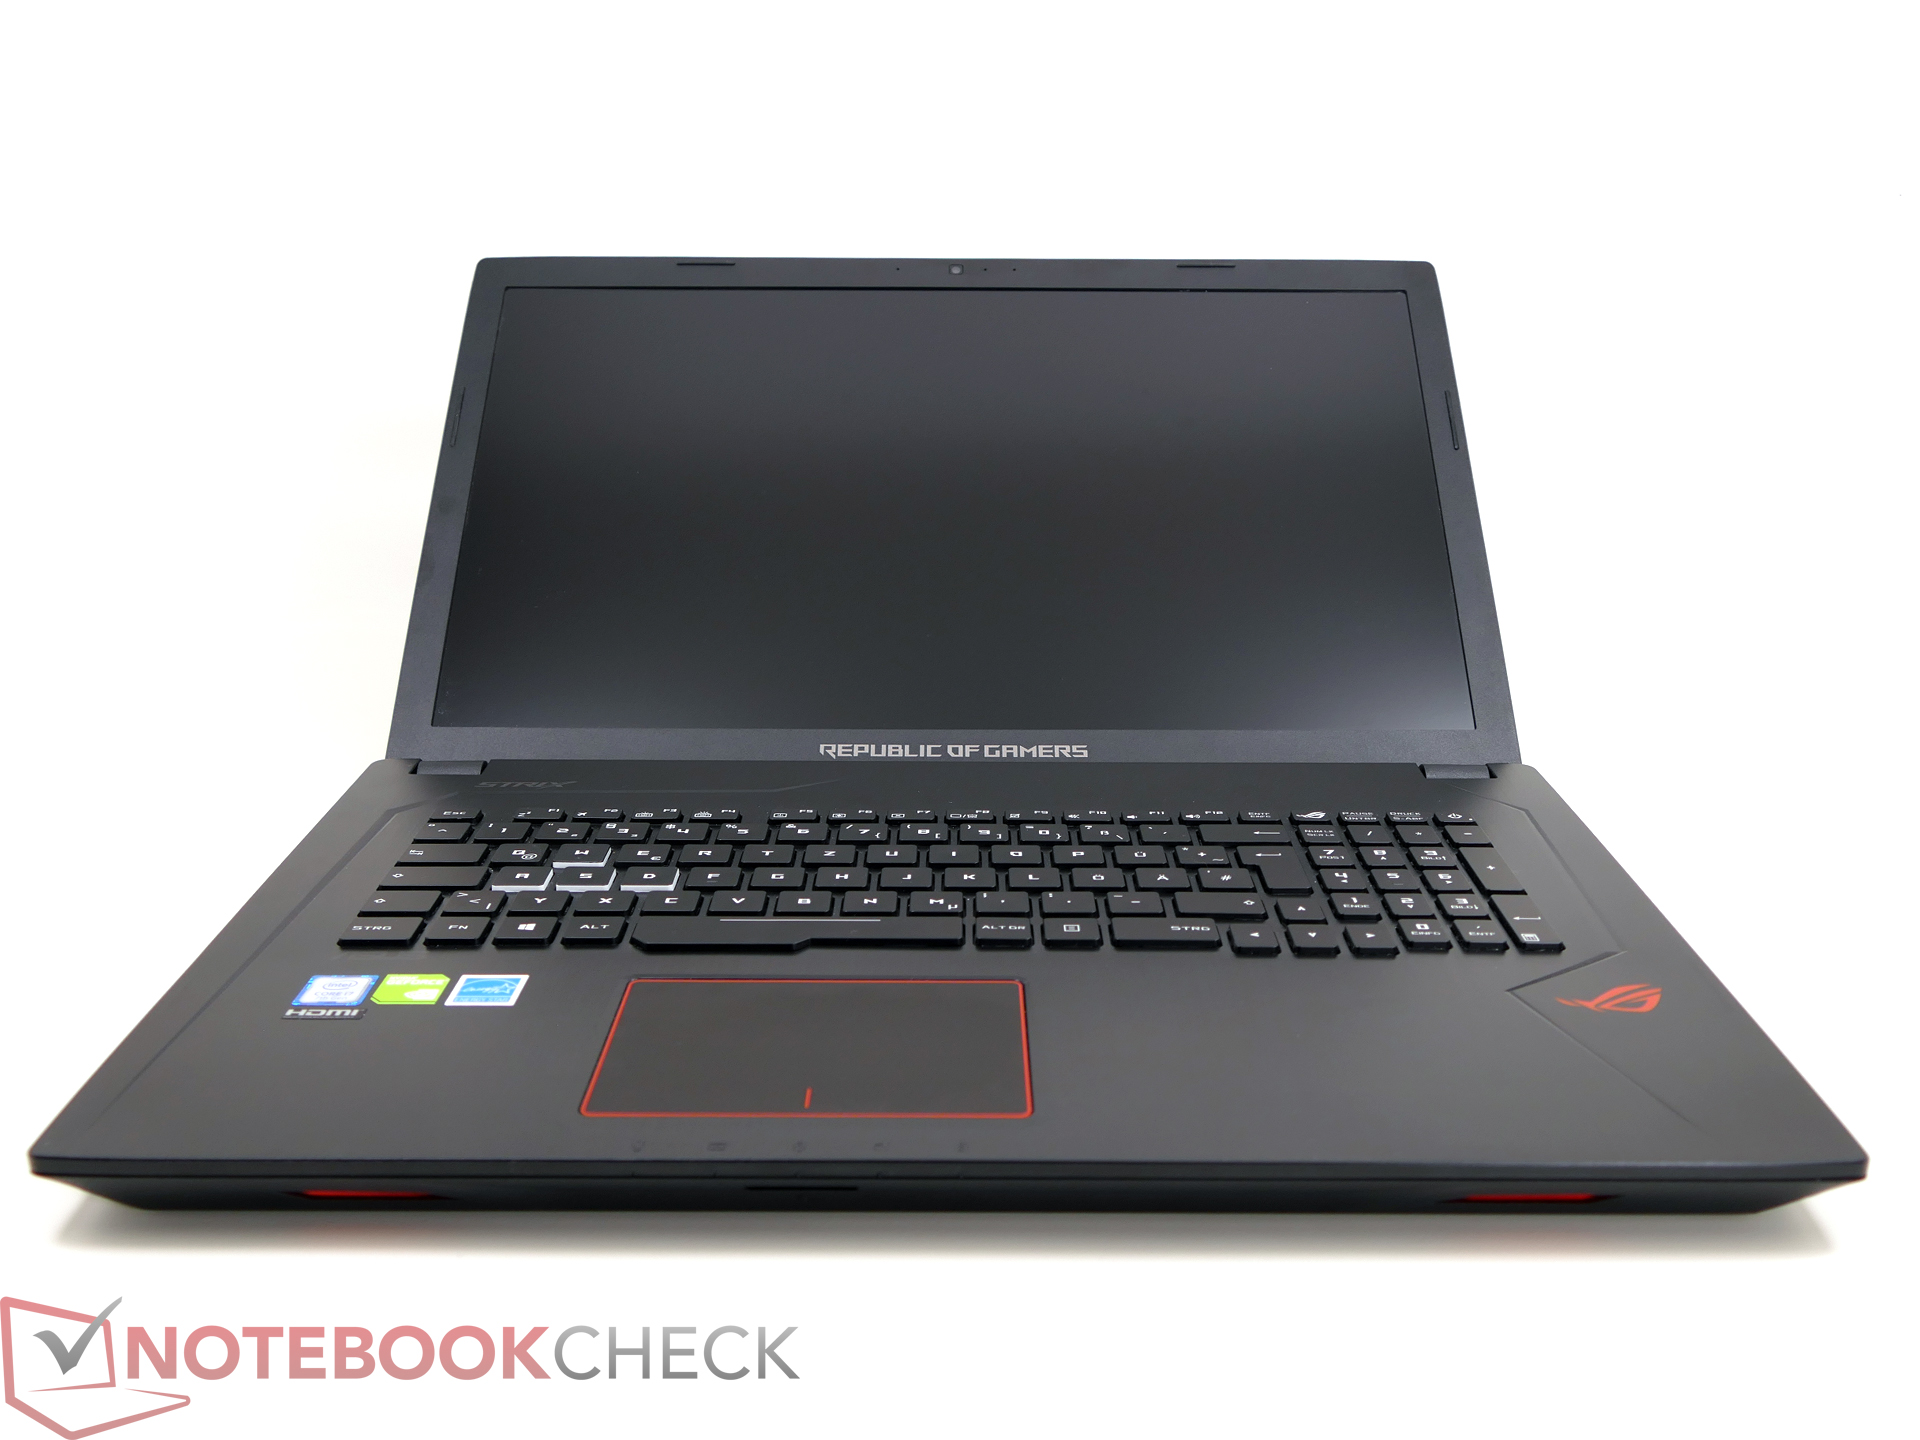
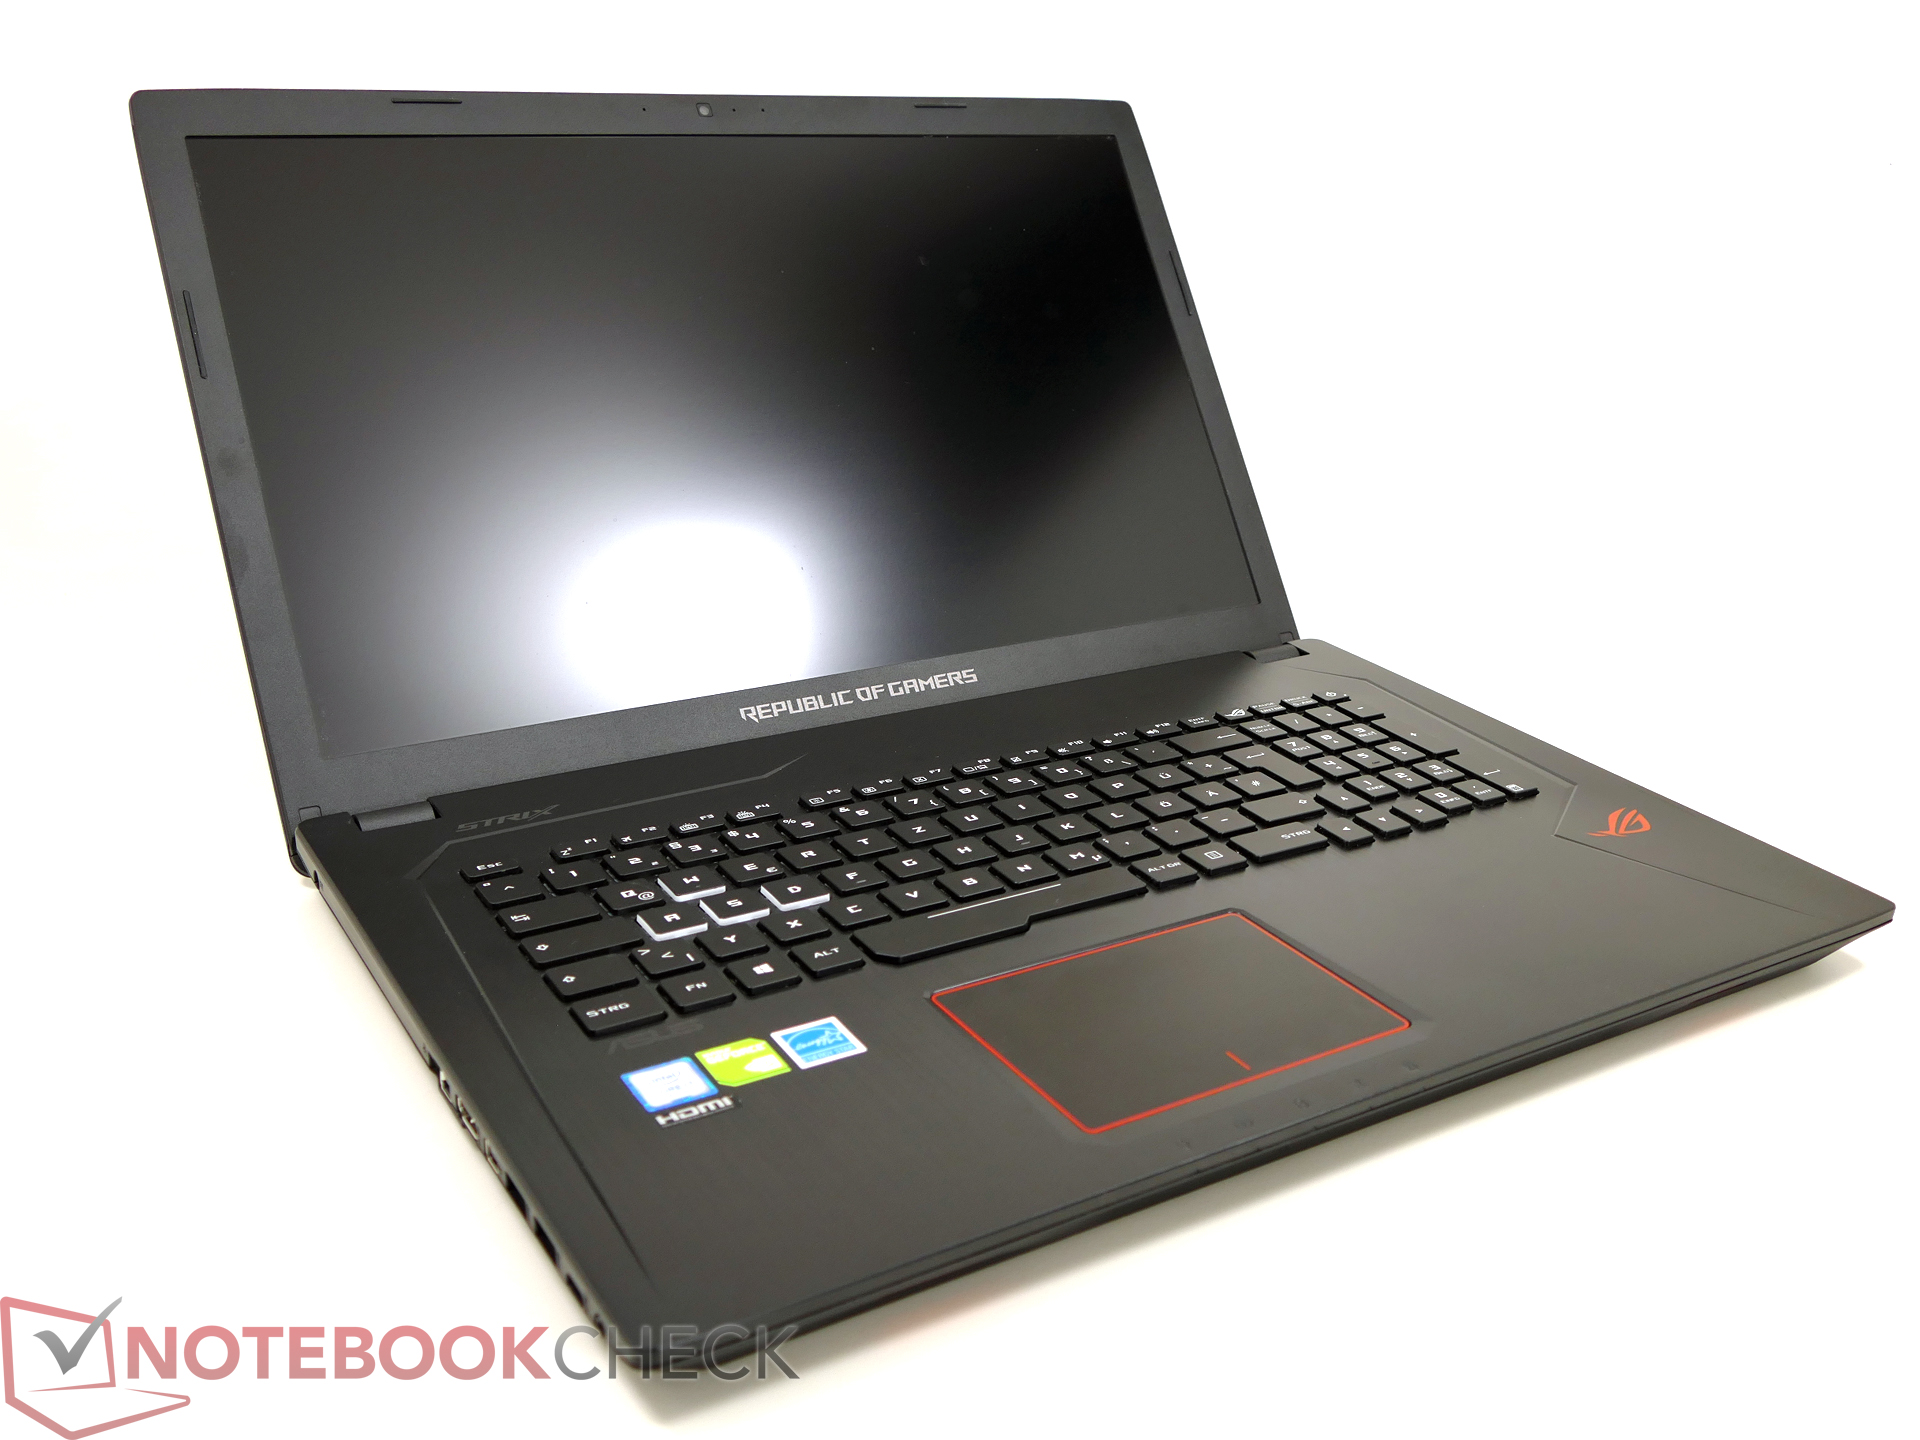
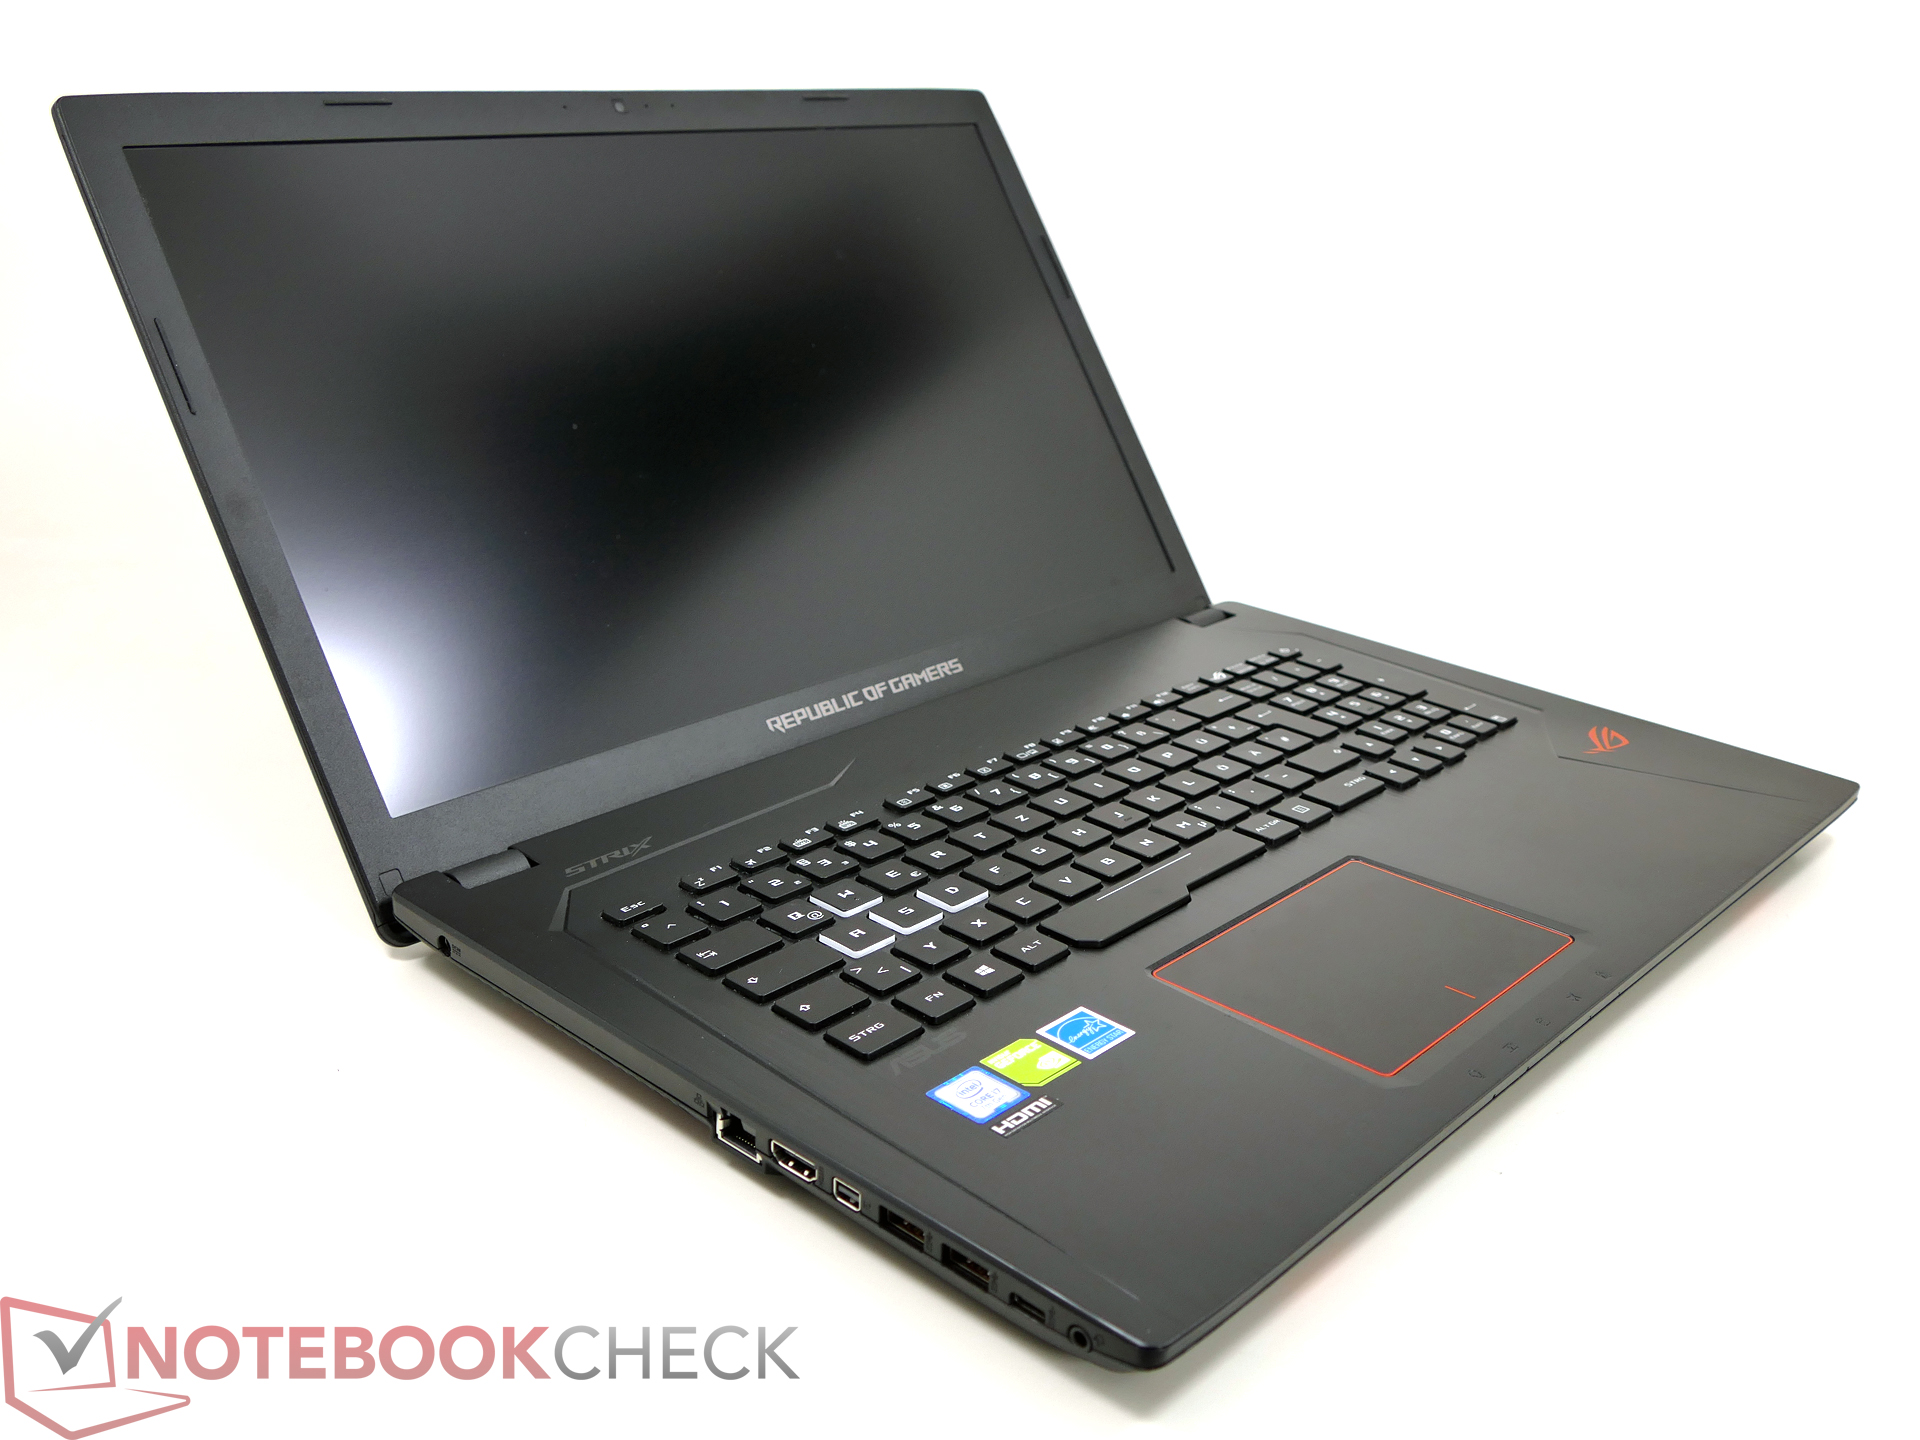
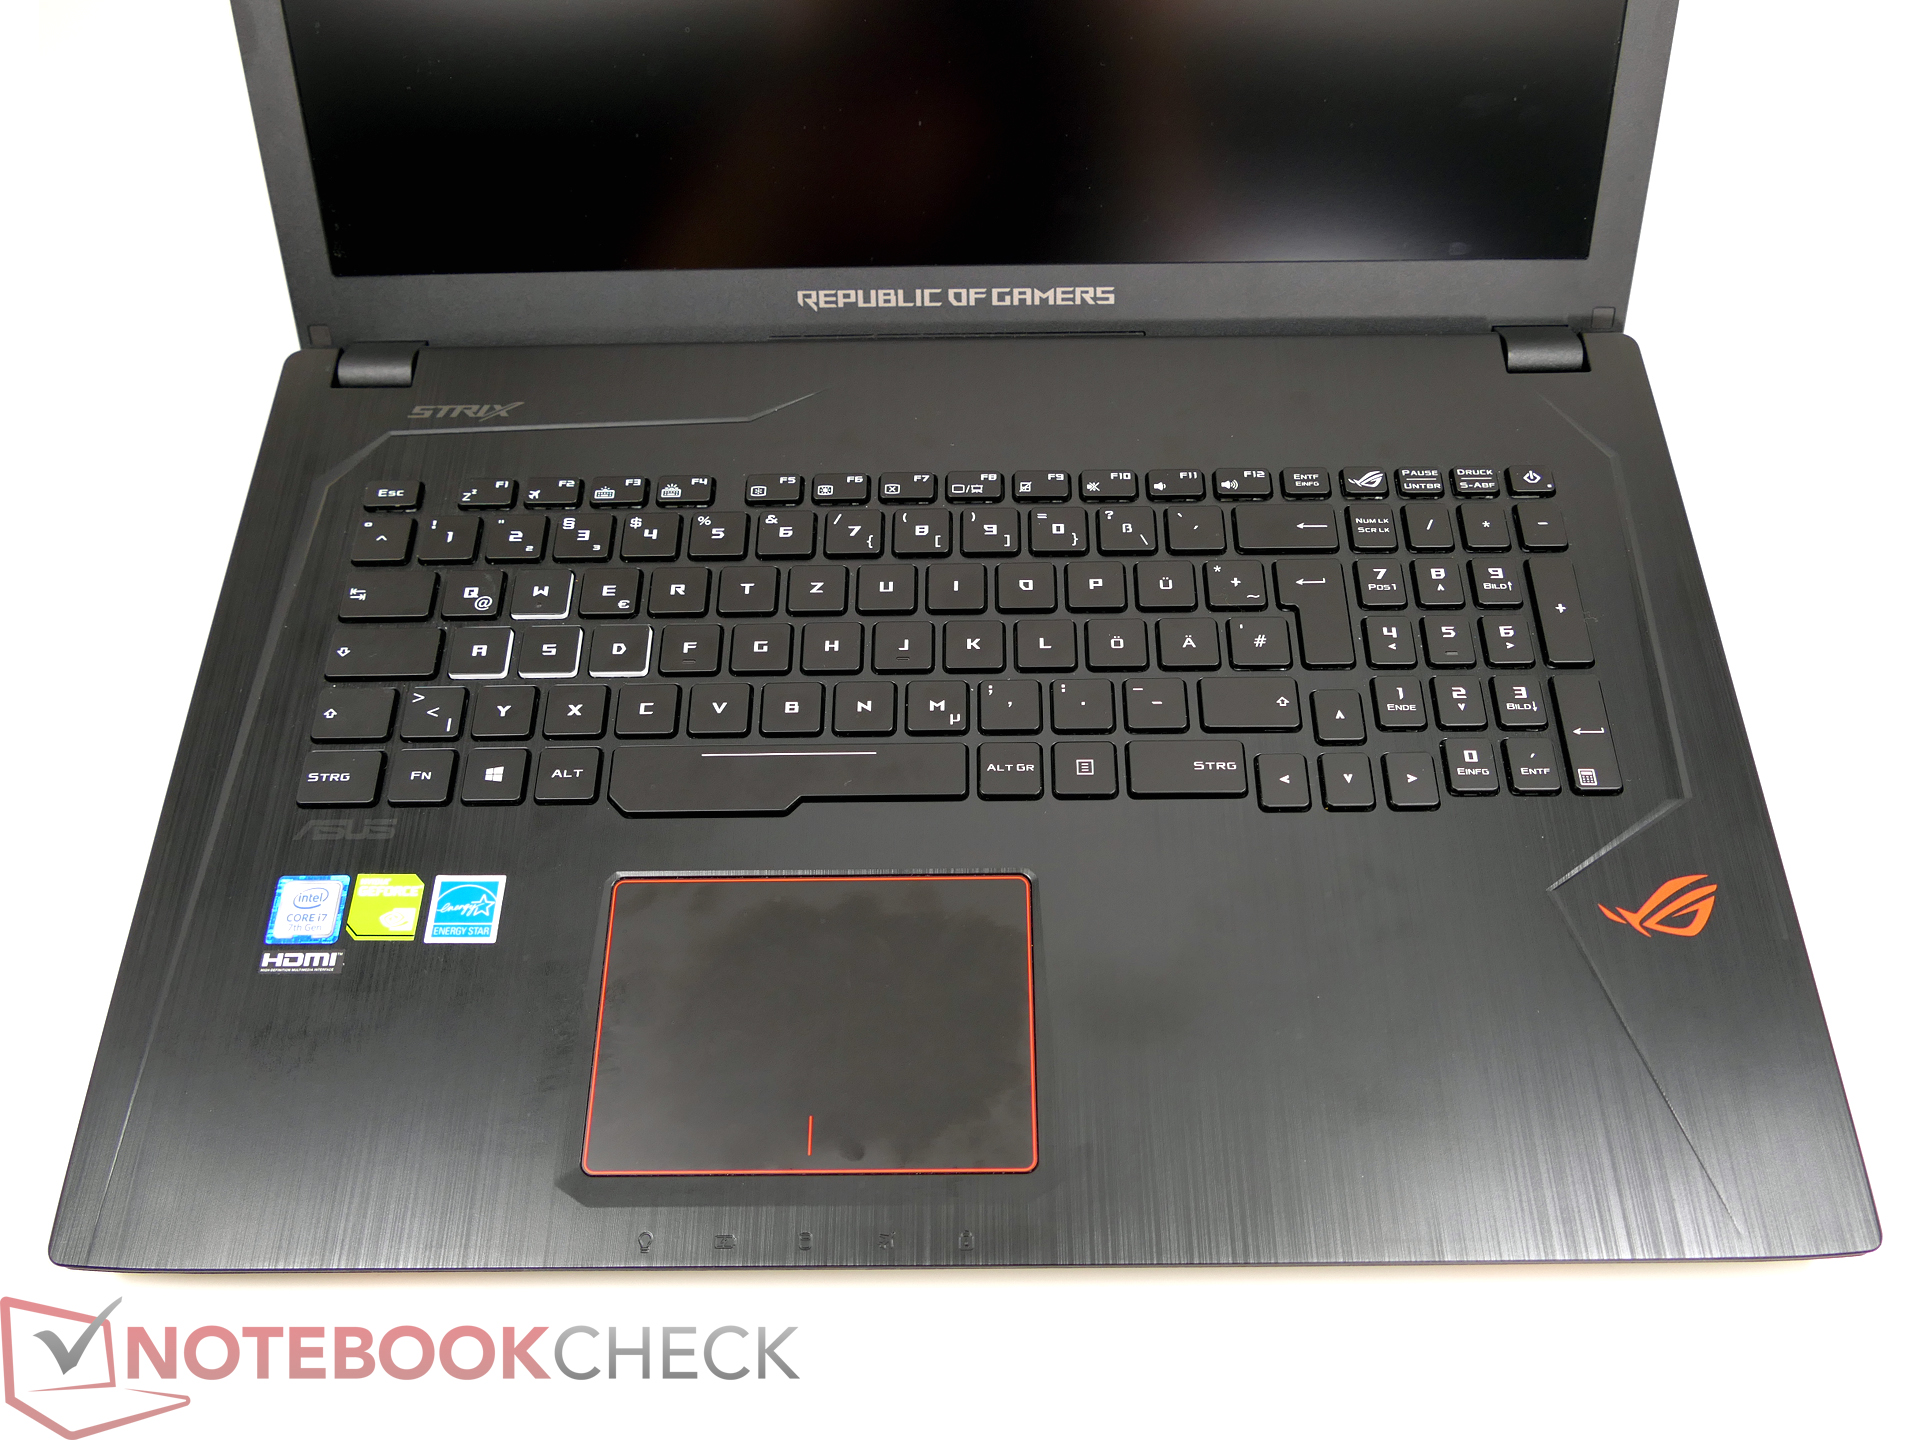
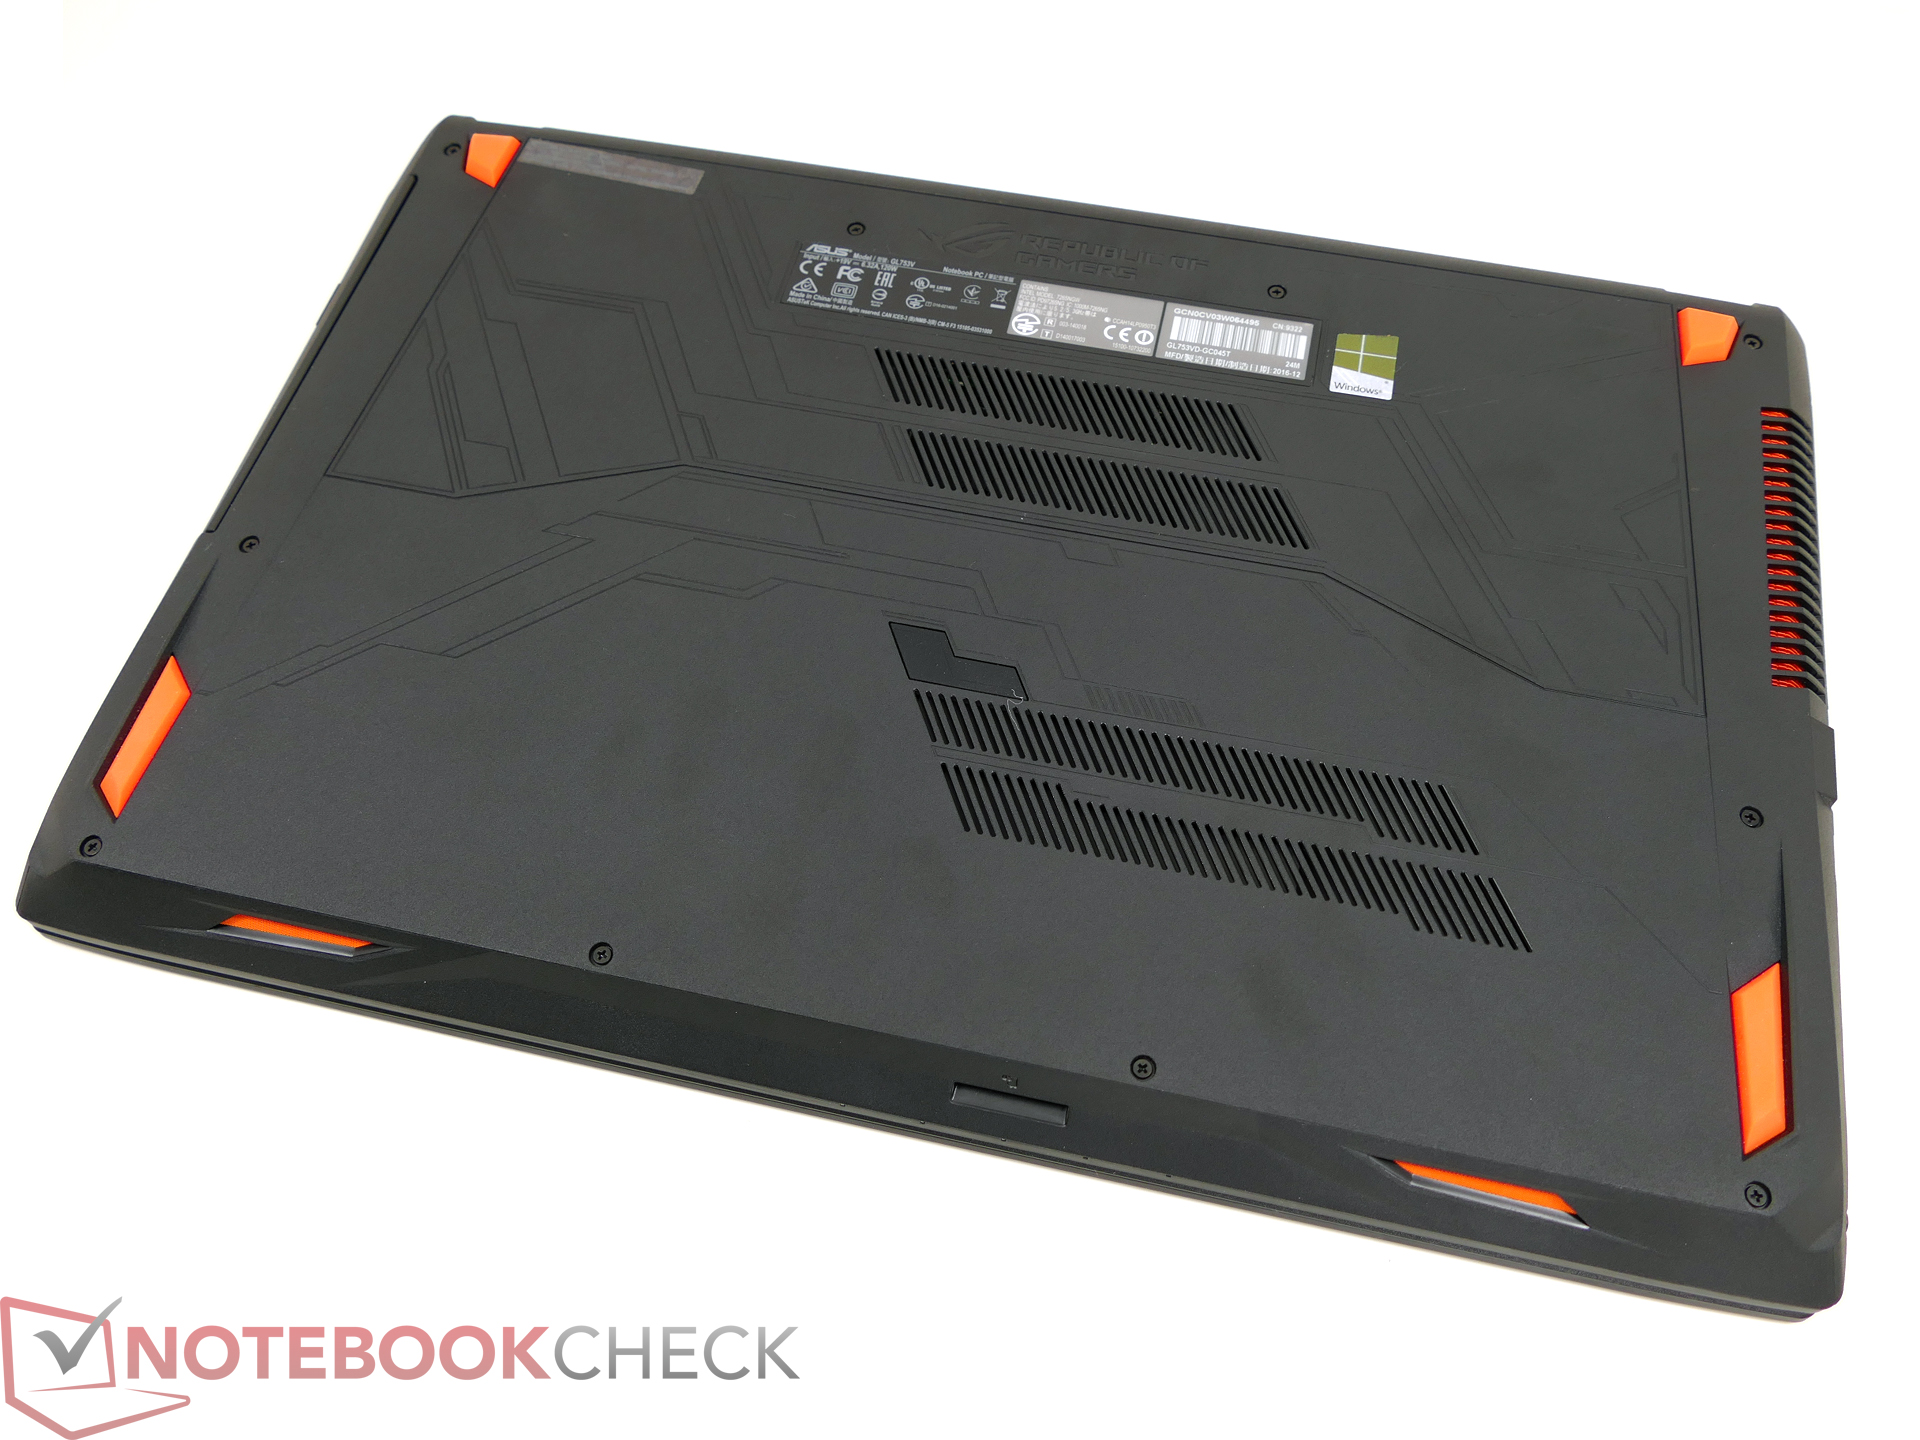
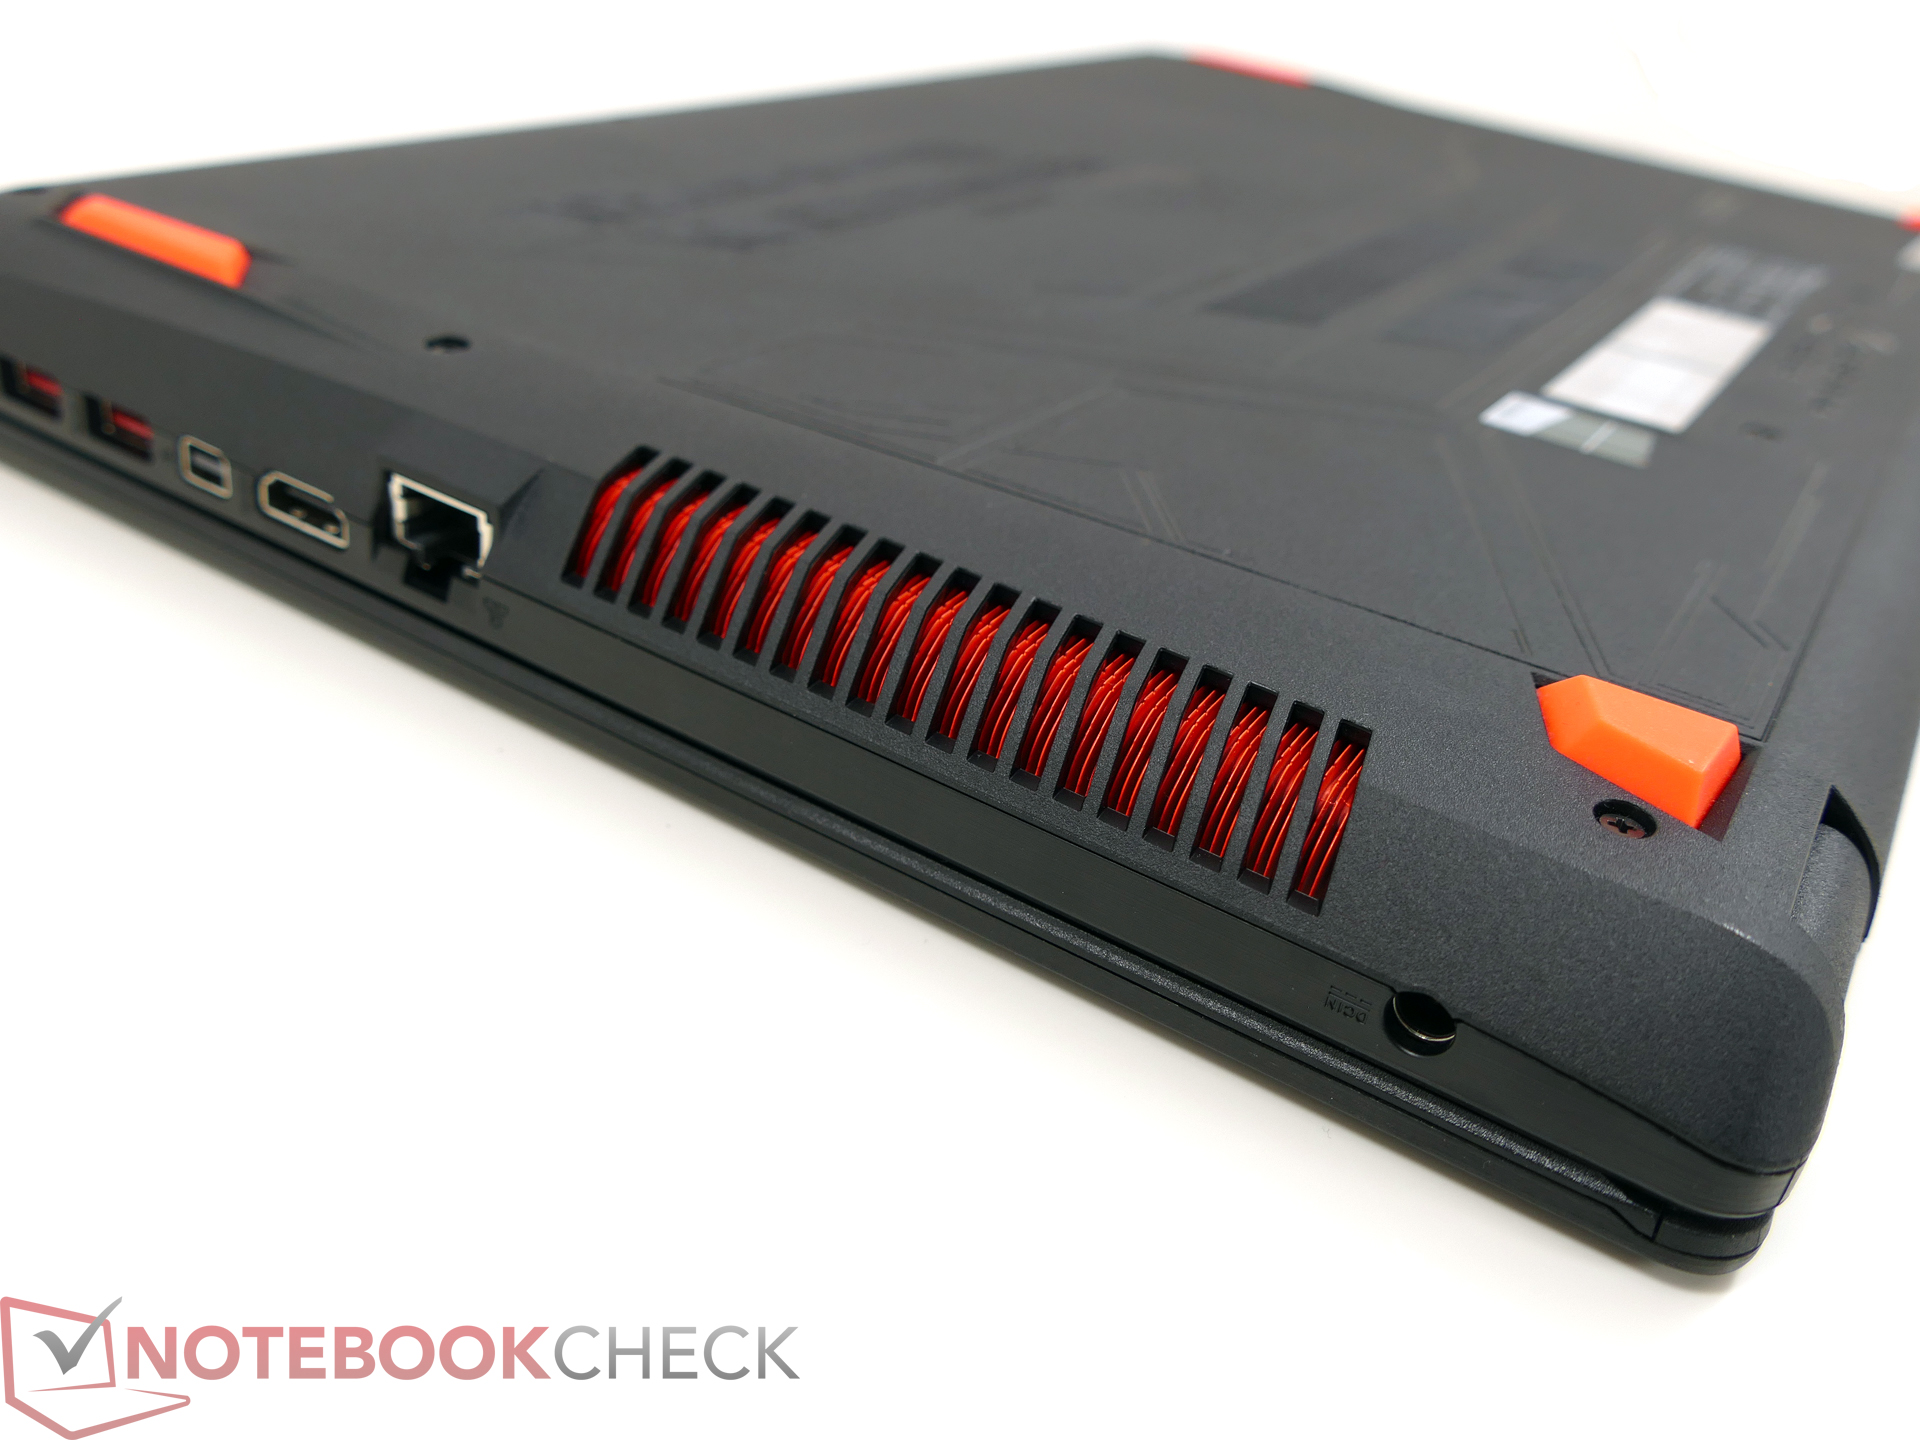
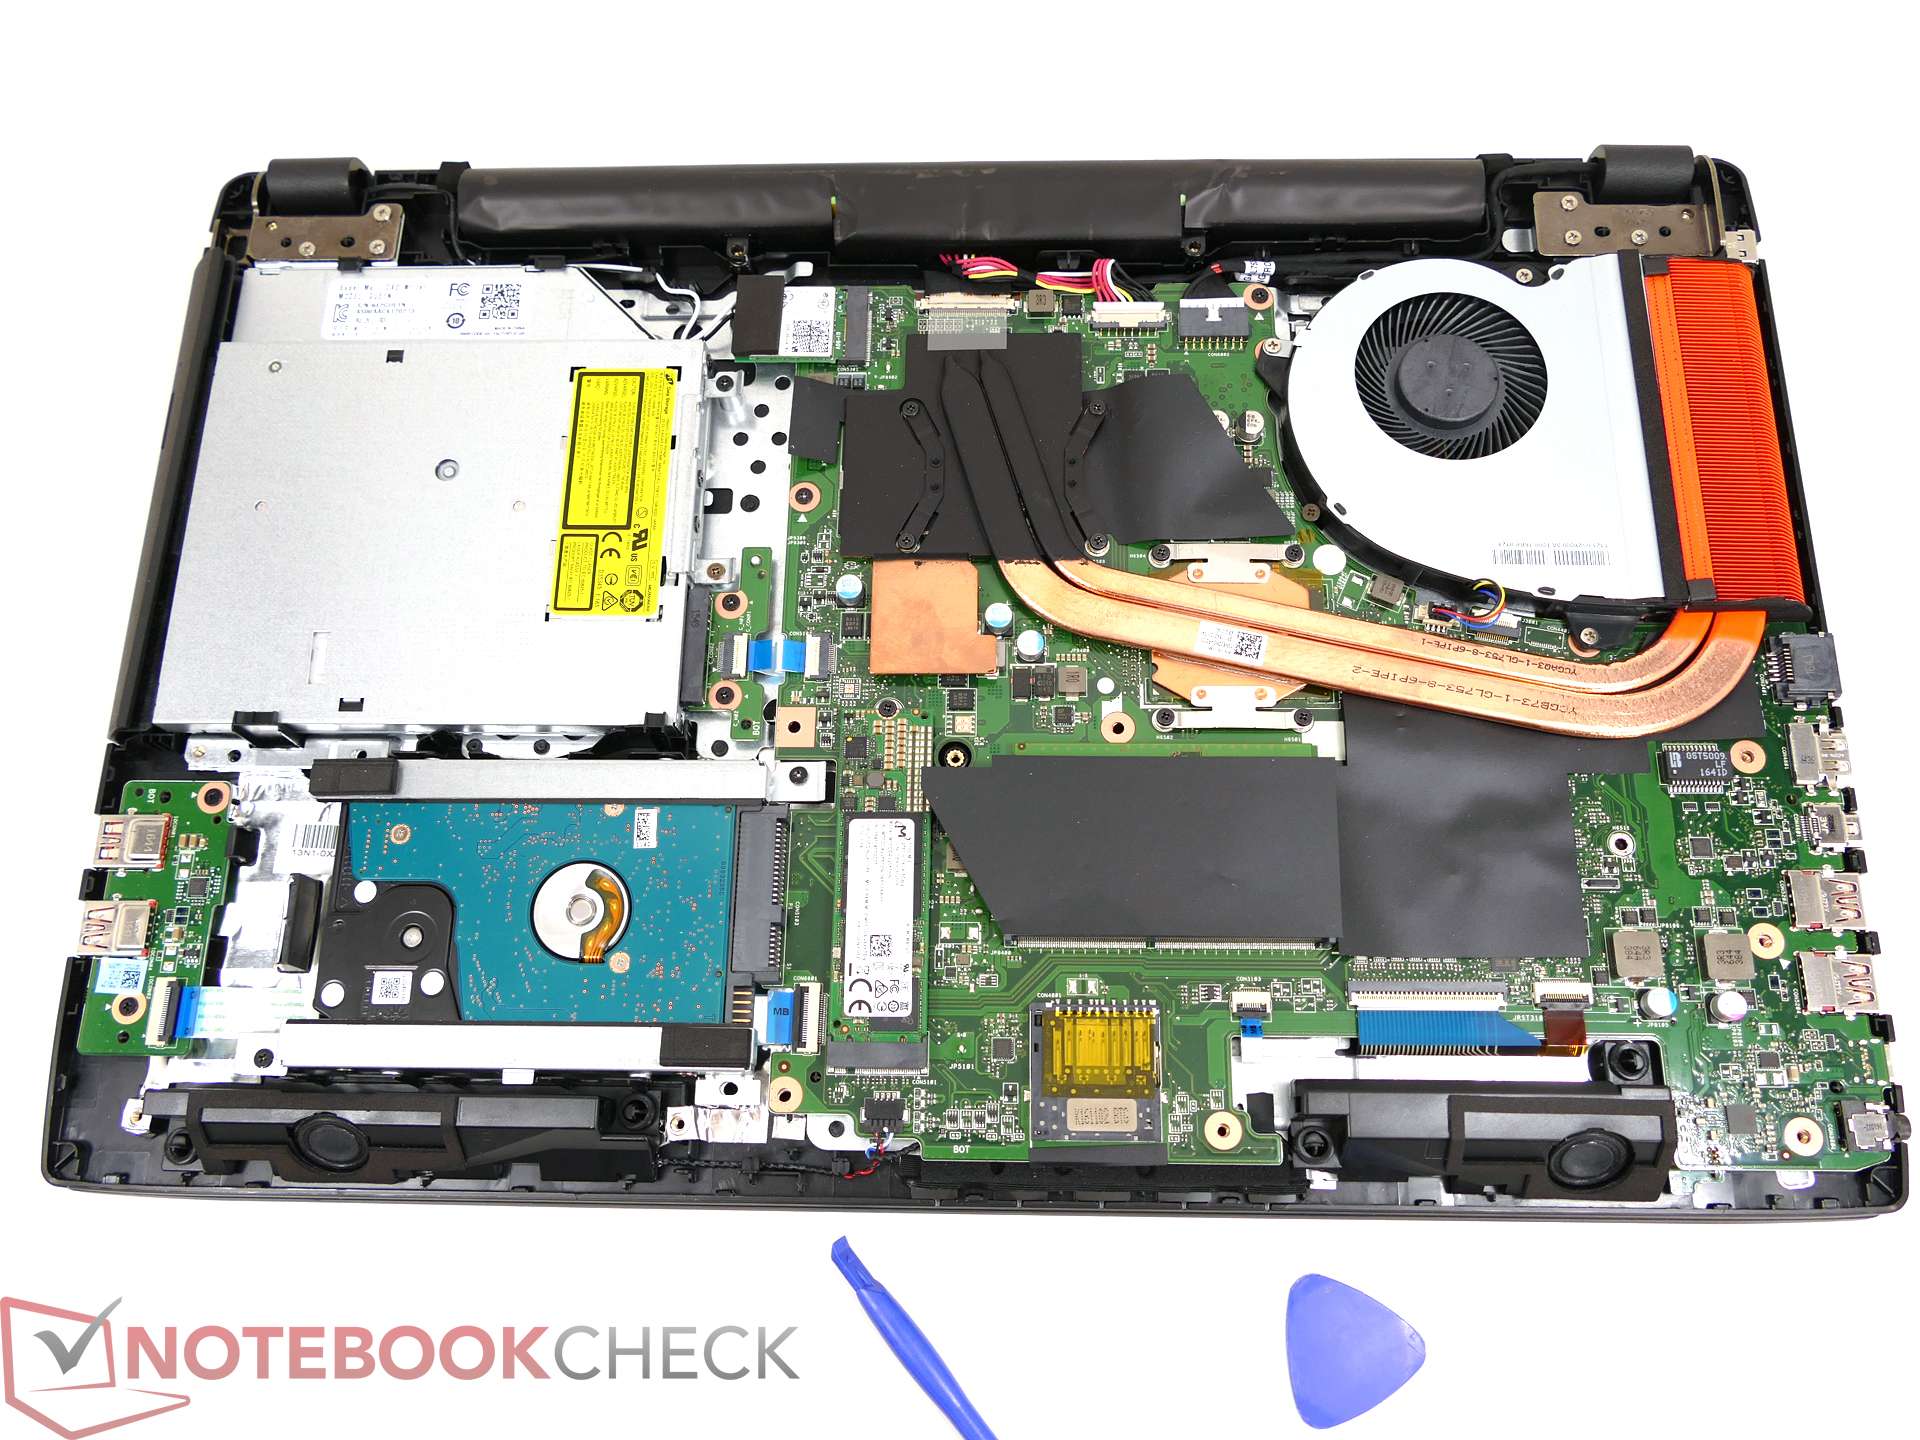
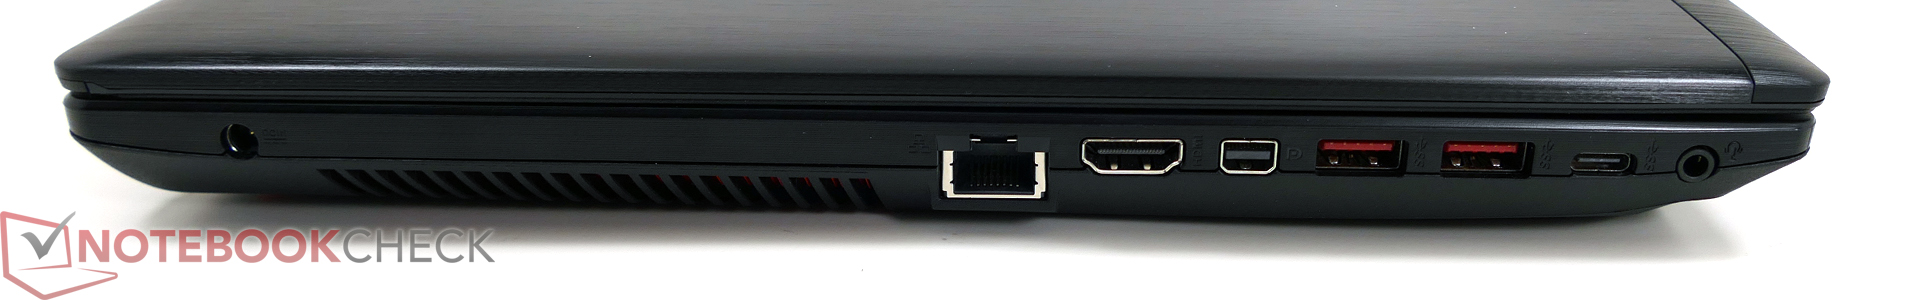
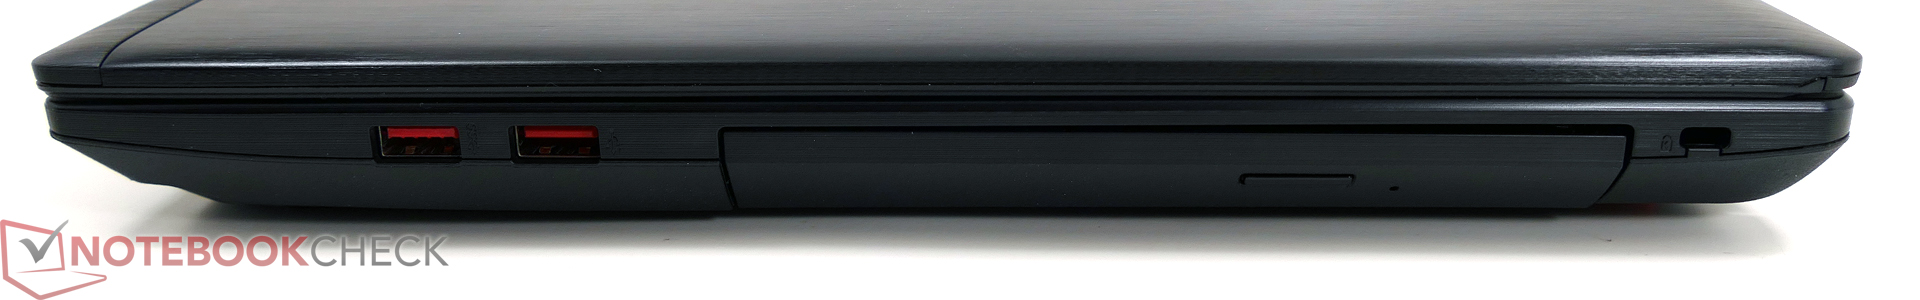
Queremos resumir nossas observações. O Asus ROG GL753VD vem em um chassi aceitavelmente elegante com boa estabilidade e qualidade de construção. A seleção de portas é satisfatória, mas não há destaques e o layout na parte frontal das laterais também não é o ideal. O desempenho do Wi-Fi é exemplar e as taxas de transferência do leitor de cartões SD são boas. Outro aspecto positivo é que os usuários obtêm acesso aos dispositivos de armazenamento e os slots de memória (embora precise de uma chave de fenda). A Asus melhorou um pouco os dispositivos de entrada, em comparação com o GL702. A tela é familiar e muito brilhante; o contraste e as cores são apenas bons. Positivo: A Asus não utiliza PWM, mas a tela não consegue lidar com painéis de 120 Hz em termos de tempos de resposta.
O desempenho é um pouco mais interessante: A combinação da CPU quad-core Intel i7-7700HQ e a GPU Nvidia GeForce GTX 1050 normalmente consegue taxas de fotogramas fluentes na maiora dos jogos modernos na resolução Full HD nativa e configurações altas. A GTX 960M é derrotada por cerca de 30%, mas a nova GTX 1060 ainda é o dobro de veloz. A GTX 1050 Ti é cerca de 30% mais veloz que a GTX 1050 regular. Finalmente dependerá do preço dos portáteis de jogos com a GTX 1050, GTX 1050 Ti, e GTX 1060. O Asus ROG Strix GL502VM e outros sistemas equipados de forma similar já começam a partir de cerca de 1.300 Euros (~$1367) e prometem muito mais desempenho nos jogos com uma combinação de CPU i7-6700HQ e GPU GTX 1060.
Os critérios de pontuação restantes do GL753 são igualmente discretos. O sistema permanece sempre frio, mas a ventoinha é muito barulhenta sob uso intenso e também há espaço para melhorias durante o modo inativo. A qualidade do som é boa, assim como a duração da bateria, embora 4-5 horas na prática, dificilmente é impressionante.
O sucesso do GL753 dependerá principalmente do preço, porque você pode obter muito mais desempenho nos jogos por 1.300 Euros (~$1367). O Strix GL753 deverá ser consideravelmente mais acessível quando chegar às prateleiras.
Asus Strix GL753VD-GC045T
- 12/29/2016 v6 (old)
J. Simon Leitner
Price comparison
