Breve Análise do Portátil Schenker Key 16 (Clevo P960EN-K): O portátil fino agrada com muito poder de computação
| SD Card Reader | |
| average JPG Copy Test (av. of 3 runs) | |
| Gigabyte Aero 15-X9 (Toshiba Exceria Pro SDXC 64 GB UHS-II) | |
| Schenker Key 16 (Toshiba Exceria Pro SDXC 64 GB UHS-II) | |
| Schenker Key 15 Coffee Lake (Toshiba Exceria Pro SDXC 64 GB UHS-II) | |
| Média da turma Gaming (20.9 - 210, n=54, últimos 2 anos) | |
| HP Omen 15-dc1303ng (Toshiba Exceria Pro SDXC 64 GB UHS-II) | |
| maximum AS SSD Seq Read Test (1GB) | |
| Gigabyte Aero 15-X9 (Toshiba Exceria Pro SDXC 64 GB UHS-II) | |
| Schenker Key 16 (Toshiba Exceria Pro SDXC 64 GB UHS-II) | |
| Schenker Key 15 Coffee Lake (Toshiba Exceria Pro SDXC 64 GB UHS-II) | |
| Média da turma Gaming (25.5 - 261, n=51, últimos 2 anos) | |
| HP Omen 15-dc1303ng (Toshiba Exceria Pro SDXC 64 GB UHS-II) | |
| |||||||||||||||||||||||||
iluminação: 88 %
iluminação com acumulador: 296 cd/m²
Contraste: 1138:1 (Preto: 0.26 cd/m²)
ΔE ColorChecker Calman: 2.24 | ∀{0.5-29.43 Ø4.72}
calibrated: 0.72
ΔE Greyscale Calman: 2.76 | ∀{0.09-98 Ø4.97}
99% sRGB (Argyll 1.6.3 3D)
60% AdobeRGB 1998 (Argyll 1.6.3 3D)
65.9% AdobeRGB 1998 (Argyll 3D)
94.9% sRGB (Argyll 3D)
63.8% Display P3 (Argyll 3D)
Gamma: 2.52
CCT: 6830 K
| Schenker Key 16 Chi Mei N161HCA-GA1 (CMN1602), IPS, 1920x1080, 16.1" | MSI GS65 Stealth 9SG Sharp LQ156M1JW03 (SHP14C5), IPS, 1920x1080, 15.6" | Acer Predator Triton 500 AU Optronics B156HAN08.2 (AUO82ED), IPS, 1920x1080, 15.6" | HP Omen 15-dc1303ng LG Philips LGD05C0, IPS, 1920x1080, 15.6" | Alienware m15 P79F Samsung SDCA029, 156WR04, OLED, 3840x2160, 15.6" | Razer Blade 15 RTX 2080 Max-Q Sharp LQ156M1JW03 (SHP14C5), IPS, 1920x1080, 15.6" | Gigabyte Aero 15-X9 LGD05C0, IPS, 1920x1080, 15.6" | |
|---|---|---|---|---|---|---|---|
| Display | 5% | -0% | -1% | 38% | 4% | -1% | |
| Display P3 Coverage (%) | 63.8 | 67.6 6% | 64.2 1% | 63.8 0% | 99.9 57% | 66.9 5% | 63.5 0% |
| sRGB Coverage (%) | 94.9 | 97.5 3% | 92.6 -2% | 93.4 -2% | 100 5% | 98.1 3% | 93.1 -2% |
| AdobeRGB 1998 Coverage (%) | 65.9 | 68.9 5% | 65.7 0% | 65 -1% | 100 52% | 68.5 4% | 64.5 -2% |
| Response Times | 5% | 24% | 8% | 82% | 15% | -11% | |
| Response Time Grey 50% / Grey 80% * (ms) | 18 ? | 13.6 ? 24% | 8 ? 56% | 14 ? 22% | 2.6 ? 86% | 12.8 ? 29% | 16.4 ? 9% |
| Response Time Black / White * (ms) | 10.4 ? | 12 ? -15% | 11.2 ? -8% | 11 ? -6% | 2.3 ? 78% | 10.4 ? -0% | 13.6 ? -31% |
| PWM Frequency (Hz) | 25510 ? | 23260 ? | 60.2 ? | 23810 ? | |||
| Screen | 3% | -44% | -23% | -29% | -3% | 5% | |
| Brightness middle (cd/m²) | 296 | 282.3 -5% | 304 3% | 316 7% | 452.1 53% | 293 -1% | 250 -16% |
| Brightness (cd/m²) | 271 | 269 -1% | 299 10% | 295 9% | 452 67% | 270 0% | 235 -13% |
| Brightness Distribution (%) | 88 | 90 2% | 89 1% | 84 -5% | 90 2% | 87 -1% | 85 -3% |
| Black Level * (cd/m²) | 0.26 | 0.32 -23% | 0.27 -4% | 0.42 -62% | 0.29 -12% | 0.29 -12% | |
| Contrast (:1) | 1138 | 882 -22% | 1126 -1% | 752 -34% | 1010 -11% | 862 -24% | |
| Colorchecker dE 2000 * | 2.24 | 1.17 48% | 4.66 -108% | 2.7 -21% | 6.34 -183% | 1.69 25% | 1.46 35% |
| Colorchecker dE 2000 max. * | 4.04 | 3.29 19% | 9.65 -139% | 5.65 -40% | 12.97 -221% | 3.37 17% | 2.47 39% |
| Colorchecker dE 2000 calibrated * | 0.72 | 1.06 -47% | 1.72 -139% | 1.58 -119% | 1.24 -72% | ||
| Greyscale dE 2000 * | 2.76 | 1.3 53% | 5.53 -100% | 2.35 15% | 2.8 -1% | 2.3 17% | 1.27 54% |
| Gamma | 2.52 87% | 2.2 100% | 2.5 88% | 2.41 91% | 2.21 100% | 2.3 96% | 2.4 92% |
| CCT | 6830 95% | 6643 98% | 8028 81% | 6904 94% | 6114 106% | 6758 96% | 6749 96% |
| Color Space (Percent of AdobeRGB 1998) (%) | 60 | 63.8 6% | 60 0% | 60 0% | 91 52% | 63 5% | 60 0% |
| Color Space (Percent of sRGB) (%) | 99 | 97.5 -2% | 93 -6% | 93 -6% | 100 1% | 98.5 -1% | 93 -6% |
| Média Total (Programa/Configurações) | 4% /
3% | -7% /
-27% | -5% /
-15% | 30% /
4% | 5% /
0% | -2% /
2% |
* ... menor é melhor
Exibir tempos de resposta
| ↔ Tempo de resposta preto para branco | ||
|---|---|---|
| 10.4 ms ... ascensão ↗ e queda ↘ combinadas | ↗ 6 ms ascensão | 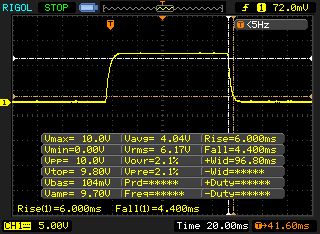 |
| ↘ 4.4 ms queda | ||
| A tela mostra boas taxas de resposta em nossos testes, mas pode ser muito lenta para jogadores competitivos. Em comparação, todos os dispositivos testados variam de 0.1 (mínimo) a 240 (máximo) ms. » 28 % de todos os dispositivos são melhores. Isso significa que o tempo de resposta medido é melhor que a média de todos os dispositivos testados (19.8 ms). | ||
| ↔ Tempo de resposta 50% cinza a 80% cinza | ||
| 18 ms ... ascensão ↗ e queda ↘ combinadas | ↗ 8.8 ms ascensão | 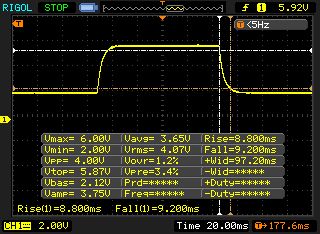 |
| ↘ 9.2 ms queda | ||
| A tela mostra boas taxas de resposta em nossos testes, mas pode ser muito lenta para jogadores competitivos. Em comparação, todos os dispositivos testados variam de 0.165 (mínimo) a 636 (máximo) ms. » 32 % de todos os dispositivos são melhores. Isso significa que o tempo de resposta medido é melhor que a média de todos os dispositivos testados (31 ms). | ||
Cintilação da tela / PWM (modulação por largura de pulso)
| Tela tremeluzindo/PWM detectado | 25510 Hz | ≤ 20 % configuração de brilho | 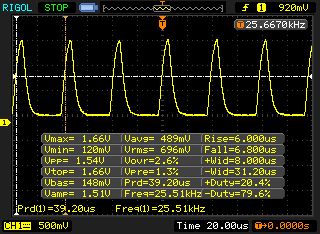 |
A luz de fundo da tela pisca em 25510 Hz (pior caso, por exemplo, utilizando PWM) Cintilação detectada em uma configuração de brilho de 20 % e abaixo. Não deve haver cintilação ou PWM acima desta configuração de brilho. A frequência de 25510 Hz é bastante alta, então a maioria dos usuários sensíveis ao PWM não deve notar nenhuma oscilação. [pwm_comparison] Em comparação: 52 % de todos os dispositivos testados não usam PWM para escurecer a tela. Se PWM foi detectado, uma média de 7772 (mínimo: 5 - máximo: 343500) Hz foi medida. | |||
| Cinebench R10 | |
| Rendering Single 32Bit | |
| Média da turma Gaming (7457 - 11779, n=8, últimos 2 anos) | |
| Schenker Key 16 | |
| Gigabyte Aero 15-X9 | |
| Rendering Multiple CPUs 32Bit | |
| Média da turma Gaming (42932 - 81339, n=8, últimos 2 anos) | |
| Gigabyte Aero 15-X9 | |
| Schenker Key 16 | |
| Cinebench R20 | |
| CPU (Single Core) | |
| Média da turma Gaming (442 - 895, n=110, últimos 2 anos) | |
| Schenker Key 16 | |
| CPU (Multi Core) | |
| Média da turma Gaming (4029 - 16108, n=110, últimos 2 anos) | |
| Schenker Key 16 | |
| Geekbench 3 | |
| 32 Bit Multi-Core Score | |
| Schenker Key 16 | |
| Gigabyte Aero 15-X9 | |
| 32 Bit Single-Core Score | |
| Schenker Key 16 | |
| Gigabyte Aero 15-X9 | |
| Geekbench 4.4 | |
| 64 Bit Multi-Core Score | |
| Média da turma Gaming (89200 - 97490, n=2, últimos 2 anos) | |
| Schenker Key 16 | |
| Gigabyte Aero 15-X9 | |
| 64 Bit Single-Core Score | |
| Média da turma Gaming (9335 - 9492, n=2, últimos 2 anos) | |
| Schenker Key 16 | |
| Gigabyte Aero 15-X9 | |
| Mozilla Kraken 1.1 - Total | |
| Gigabyte Aero 15-X9 (Edge 44) | |
| MSI GS65 Stealth 9SG (Edge 44.17763.1.0) | |
| Alienware m15 P79F | |
| Schenker Key 16 (Edge 44) | |
| Razer Blade 15 RTX 2080 Max-Q (Edge 44.17763.1.0) | |
| HP Omen 15-dc1303ng | |
| Média da turma Gaming (391 - 590, n=106, últimos 2 anos) | |
| Octane V2 - Total Score | |
| Média da turma Gaming (89353 - 139447, n=28, últimos 2 anos) | |
| HP Omen 15-dc1303ng | |
| Razer Blade 15 RTX 2080 Max-Q (Edge 44.17763.1.0) | |
| Schenker Key 16 (Edge 44) | |
| MSI GS65 Stealth 9SG (Edge 44.17763.1.0) | |
| Alienware m15 P79F (Edge 44.17763.1.0) | |
| Gigabyte Aero 15-X9 (Edge 44) | |
| JetStream 1.1 - 1.1 Total | |
| Média da turma Gaming (549 - 647, n=3, últimos 2 anos) | |
| Razer Blade 15 RTX 2080 Max-Q (Edge 44.17763.1.0) | |
| Schenker Key 16 (Edge 44) | |
| MSI GS65 Stealth 9SG (Edge 44.17763.1.0) | |
| Gigabyte Aero 15-X9 (Edge 44) | |
| Alienware m15 P79F (Edge 44.17763.1.0) | |
| HP Omen 15-dc1303ng | |
* ... menor é melhor
| PCMark 7 Score | 6701 pontos | |
| PCMark 8 Home Score Accelerated v2 | 4277 pontos | |
| PCMark 8 Creative Score Accelerated v2 | 4037 pontos | |
| PCMark 8 Work Score Accelerated v2 | 5617 pontos | |
| PCMark 10 Score | 5694 pontos | |
Ajuda | ||

| Schenker Key 16 Samsung SSD 970 EVO Plus 1TB | MSI GS65 Stealth 9SG Samsung SSD PM981 MZVLB512HAJQ | Acer Predator Triton 500 2x WDC PC SN720 SDAPNTW-256G-1014 (RAID 0) | HP Omen 15-dc1303ng Samsung SSD PM981 MZVLB256HAHQ | Alienware m15 P79F Toshiba XG5 KXG50ZNV512G | Razer Blade 15 RTX 2080 Max-Q Samsung SSD PM981 MZVLB512HAJQ | Gigabyte Aero 15-X9 Intel SSD 760p SSDPEKKW010T8 | |
|---|---|---|---|---|---|---|---|
| CrystalDiskMark 5.2 / 6 | -7% | -2% | -15% | 6% | 4% | -14% | |
| Write 4K (MB/s) | 112.5 | 91.3 -19% | 93.6 -17% | 50.2 -55% | 148.4 32% | 137.2 22% | 97.1 -14% |
| Read 4K (MB/s) | 43.79 | 40.73 -7% | 38.82 -11% | 35.32 -19% | 49.65 13% | 46.82 7% | 53.7 23% |
| Write Seq (MB/s) | 1944 | 1915 -1% | 2455 26% | 991 -49% | 1139 -41% | 1221 -37% | 1526 -22% |
| Read Seq (MB/s) | 1656 | 2051 24% | 2107 27% | 1526 -8% | 2353 42% | 1217 -27% | 2020 22% |
| Write 4K Q32T1 (MB/s) | 324.6 | 308.3 -5% | 298.7 -8% | 445.1 37% | 484.7 49% | 527 62% | 285.6 -12% |
| Read 4K Q32T1 (MB/s) | 407 | 417.4 3% | 338.7 -17% | 526 29% | 542 33% | 614 51% | 321.8 -21% |
| Write Seq Q32T1 (MB/s) | 3296 | 1922 -42% | 2902 -12% | 1647 -50% | 1139 -65% | 1986 -40% | 1533 -53% |
| Read Seq Q32T1 (MB/s) | 3555 | 3395 -5% | 3536 -1% | 3427 -4% | 3108 -13% | 3234 -9% | 2351 -34% |
| 3DMark 06 Standard Score | 36601 pontos | |
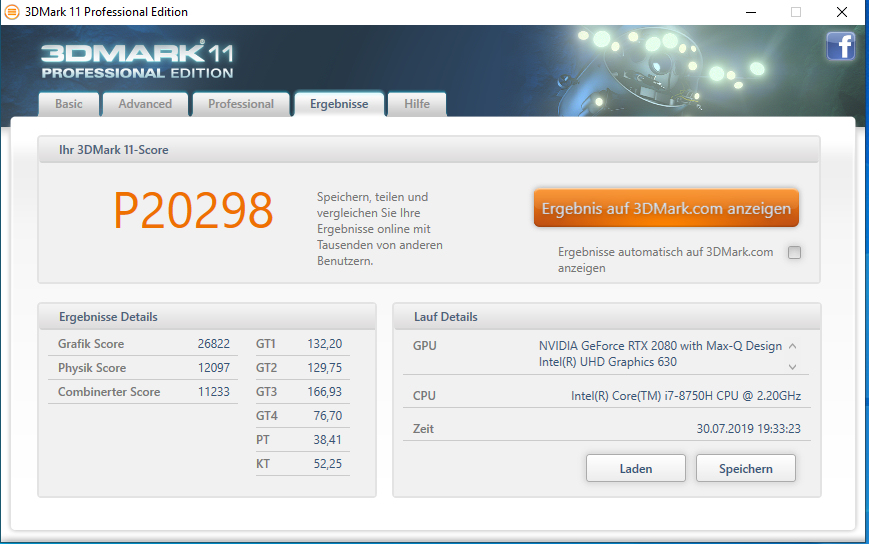
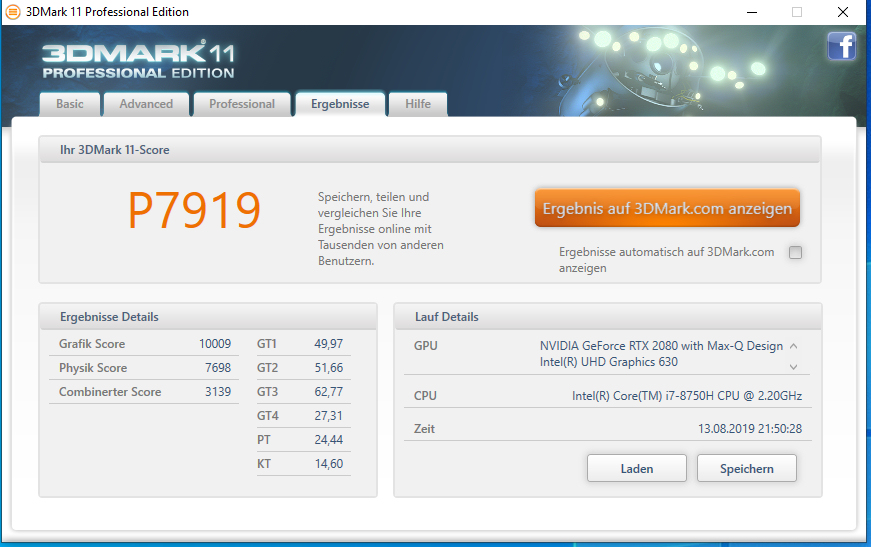
| 3DMark 11 Performance | 20298 pontos | |
| 3DMark Ice Storm Standard Score | 116851 pontos | |
| 3DMark Cloud Gate Standard Score | 34938 pontos | |
| 3DMark Fire Strike Score | 17301 pontos | |
| 3DMark Time Spy Score | 7484 pontos | |
Ajuda | ||
| The Witcher 3 - 1920x1080 Ultra Graphics & Postprocessing (HBAO+) | |
| Média da turma Gaming (95 - 240, n=8, últimos 2 anos) | |
| Razer Blade 15 RTX 2080 Max-Q | |
| Schenker Key 16 | |
| Acer Predator Triton 500 | |
| MSI GS65 Stealth 9SG | |
| Alienware m15 P79F | |
| Gigabyte Aero 15-X9 | |
| BioShock Infinite - 1920x1080 Ultra Preset, DX11 (DDOF) | |
| Razer Blade 15 RTX 2080 Max-Q | |
| Schenker Key 16 | |
| MSI GS65 Stealth 9SG | |
| Alienware m15 P79F | |
| Gigabyte Aero 15-X9 | |
| HP Omen 15-dc1303ng | |
| Far Cry New Dawn - 1920x1080 Ultra Preset | |
| Schenker Key 16 | |
| Rage 2 - 1920x1080 Ultra Preset (Resolution Scale Off) | |
| Schenker Key 16 | |
| For Honor - 1920x1080 Extreme Preset AA:T AF:16x | |
| Schenker Key 16 | |
| X-Plane 11.11 - 1920x1080 high (fps_test=3) | |
| Média da turma Gaming (52.1 - 143.5, n=114, últimos 2 anos) | |
| Schenker Key 16 | |
| Gigabyte Aero 15-X9 | |
| baixo | média | alto | ultra | |
|---|---|---|---|---|
| BioShock Infinite (2013) | 297.6 | 268 | 255.1 | 165.7 |
| The Witcher 3 (2015) | 294.7 | 236.6 | 146.6 | 77.4 |
| For Honor (2017) | 267.2 | 165.2 | 156.5 | 123.4 |
| Final Fantasy XV Benchmark (2018) | 125.2 | 100.1 | 75.9 | |
| X-Plane 11.11 (2018) | 101.9 | 89.2 | 74.8 | |
| Far Cry 5 (2018) | 122 | 103 | 97 | 93 |
| Far Cry New Dawn (2019) | 110 | 95 | 90 | 81 |
| Rage 2 (2019) | 204.2 | 111 | 93.5 | 91.9 |
| Total War: Three Kingdoms (2019) | 224.8 | 126.1 | 88.8 | 65.5 |
| F1 2019 (2019) | 188 | 165 | 137 | 114 |
Barulho
| Ocioso |
| 30 / 31 / 34 dB |
| Carga |
| 47 / 49 dB |
 | ||
30 dB silencioso 40 dB(A) audível 50 dB(A) ruidosamente alto |
||
min: | ||
| Schenker Key 16 i7-8750H, GeForce RTX 2080 Max-Q | MSI GS65 Stealth 9SG i7-9750H, GeForce RTX 2080 Max-Q | Acer Predator Triton 500 i7-8750H, GeForce RTX 2080 Max-Q | HP Omen 15-dc1303ng i7-8750H, GeForce RTX 2070 Max-Q | Alienware m15 P79F i7-8750H, GeForce RTX 2070 Max-Q | Razer Blade 15 RTX 2080 Max-Q i7-9750H, GeForce RTX 2080 Max-Q | Gigabyte Aero 15-X9 i7-8750H, GeForce RTX 2070 Max-Q | Média da turma Gaming | |
|---|---|---|---|---|---|---|---|---|
| Noise | 4% | 2% | 0% | -10% | 11% | -0% | 10% | |
| desligado / ambiente * (dB) | 30 | 28.3 6% | 29 3% | 30.5 -2% | 28.2 6% | 28.3 6% | 30 -0% | 24.1 ? 20% |
| Idle Minimum * (dB) | 30 | 30.4 -1% | 30 -0% | 32.8 -9% | 30.3 -1% | 28.8 4% | 32 -7% | 25.9 ? 14% |
| Idle Average * (dB) | 31 | 30.5 2% | 32 -3% | 32.8 -6% | 35.4 -14% | 28.8 7% | 34 -10% | 27.4 ? 12% |
| Idle Maximum * (dB) | 34 | 30.6 10% | 34 -0% | 32.8 4% | 50.3 -48% | 29 15% | 36 -6% | 29.9 ? 12% |
| Load Average * (dB) | 47 | 37.6 20% | 44 6% | 42.5 10% | 50.3 -7% | 33.5 29% | 42 11% | 43 ? 9% |
| Witcher 3 ultra * (dB) | 48 | 46 4% | 46 4% | 50.2 -5% | 45 6% | 44 8% | ||
| Load Maximum * (dB) | 49 | 55.1 -12% | 47 4% | 47.5 3% | 50.2 -2% | 45.2 8% | 48 2% | 54.1 ? -10% |
* ... menor é melhor
(-) A temperatura máxima no lado superior é 51 °C / 124 F, em comparação com a média de 40.4 °C / 105 F , variando de 21.2 a 68.8 °C para a classe Gaming.
(-) A parte inferior aquece até um máximo de 59 °C / 138 F, em comparação com a média de 43.2 °C / 110 F
(+) Em uso inativo, a temperatura média para o lado superior é 30.4 °C / 87 F, em comparação com a média do dispositivo de 33.9 °C / ### class_avg_f### F.
(-) Jogando The Witcher 3, a temperatura média para o lado superior é 43.9 °C / 111 F, em comparação com a média do dispositivo de 33.9 °C / ## #class_avg_f### F.
(-) Os apoios para as mãos e o touchpad podem ficar muito quentes ao toque, com um máximo de 44 °C / 111.2 F.
(-) A temperatura média da área do apoio para as mãos de dispositivos semelhantes foi 28.8 °C / 83.8 F (-15.2 °C / -27.4 F).
| Schenker Key 16 i7-8750H, GeForce RTX 2080 Max-Q | MSI GS65 Stealth 9SG i7-9750H, GeForce RTX 2080 Max-Q | Acer Predator Triton 500 i7-8750H, GeForce RTX 2080 Max-Q | HP Omen 15-dc1303ng i7-8750H, GeForce RTX 2070 Max-Q | Alienware m15 P79F i7-8750H, GeForce RTX 2070 Max-Q | Razer Blade 15 RTX 2080 Max-Q i7-9750H, GeForce RTX 2080 Max-Q | Gigabyte Aero 15-X9 i7-8750H, GeForce RTX 2070 Max-Q | Média da turma Gaming | |
|---|---|---|---|---|---|---|---|---|
| Heat | 10% | 3% | -0% | -7% | 12% | 5% | 9% | |
| Maximum Upper Side * (°C) | 51 | 45.6 11% | 49 4% | 47.6 7% | 55.6 -9% | 47 8% | 56 -10% | 45.2 ? 11% |
| Maximum Bottom * (°C) | 59 | 53.8 9% | 58 2% | 59.6 -1% | 62.4 -6% | 49.2 17% | 66 -12% | 48.1 ? 18% |
| Idle Upper Side * (°C) | 32 | 28.6 11% | 33 -3% | 33.8 -6% | 36 -13% | 28.6 11% | 27 16% | 31.1 ? 3% |
| Idle Bottom * (°C) | 36 | 33.2 8% | 33 8% | 36.5 -1% | 36 -0% | 31.4 13% | 27 25% | 34.2 ? 5% |
* ... menor é melhor
Schenker Key 16 análise de áudio
(+) | os alto-falantes podem tocar relativamente alto (###valor### dB)
Graves 100 - 315Hz
(-) | quase nenhum baixo - em média 35.5% menor que a mediana
(±) | a linearidade dos graves é média (12.3% delta para a frequência anterior)
Médios 400 - 2.000 Hz
(+) | médios equilibrados - apenas 4.2% longe da mediana
(±) | a linearidade dos médios é média (9.7% delta para frequência anterior)
Altos 2 - 16 kHz
(+) | agudos equilibrados - apenas 3.2% longe da mediana
(+) | os máximos são lineares (2.6% delta da frequência anterior)
Geral 100 - 16.000 Hz
(±) | a linearidade do som geral é média (24.5% diferença em relação à mediana)
Comparado com a mesma classe
» 88% de todos os dispositivos testados nesta classe foram melhores, 4% semelhantes, 8% piores
» O melhor teve um delta de 6%, a média foi 18%, o pior foi 132%
Comparado com todos os dispositivos testados
» 74% de todos os dispositivos testados foram melhores, 6% semelhantes, 20% piores
» O melhor teve um delta de 4%, a média foi 24%, o pior foi 134%
Schenker Key 15 Coffee Lake análise de áudio
(±) | o volume do alto-falante é médio, mas bom (###valor### dB)
Graves 100 - 315Hz
(-) | quase nenhum baixo - em média 26.7% menor que a mediana
(±) | a linearidade dos graves é média (10.8% delta para a frequência anterior)
Médios 400 - 2.000 Hz
(±) | médios mais altos - em média 5.7% maior que a mediana
(±) | a linearidade dos médios é média (9.6% delta para frequência anterior)
Altos 2 - 16 kHz
(+) | agudos equilibrados - apenas 1.4% longe da mediana
(+) | os máximos são lineares (3.8% delta da frequência anterior)
Geral 100 - 16.000 Hz
(±) | a linearidade do som geral é média (24.6% diferença em relação à mediana)
Comparado com a mesma classe
» 89% de todos os dispositivos testados nesta classe foram melhores, 3% semelhantes, 8% piores
» O melhor teve um delta de 6%, a média foi 18%, o pior foi 132%
Comparado com todos os dispositivos testados
» 75% de todos os dispositivos testados foram melhores, 5% semelhantes, 20% piores
» O melhor teve um delta de 4%, a média foi 24%, o pior foi 134%
| desligado | |
| Ocioso | |
| Carga |
|
Key:
min: | |
| Schenker Key 16 i7-8750H, GeForce RTX 2080 Max-Q | MSI GS65 Stealth 9SG i7-9750H, GeForce RTX 2080 Max-Q | Acer Predator Triton 500 i7-8750H, GeForce RTX 2080 Max-Q | HP Omen 15-dc1303ng i7-8750H, GeForce RTX 2070 Max-Q | Alienware m15 P79F i7-8750H, GeForce RTX 2070 Max-Q | Razer Blade 15 RTX 2080 Max-Q i7-9750H, GeForce RTX 2080 Max-Q | Gigabyte Aero 15-X9 i7-8750H, GeForce RTX 2070 Max-Q | Média da turma Gaming | |
|---|---|---|---|---|---|---|---|---|
| Power Consumption | -30% | -24% | -8% | -3% | -8% | -9% | -25% | |
| Idle Minimum * (Watt) | 10 | 18.3 -83% | 16 -60% | 14.7 -47% | 10.9 -9% | 12.5 -25% | 16 -60% | 13.1 ? -31% |
| Idle Average * (Watt) | 15 | 22 -47% | 22 -47% | 18.6 -24% | 12.3 18% | 15.3 -2% | 18 -20% | 18.8 ? -25% |
| Idle Maximum * (Watt) | 22 | 28.8 -31% | 32 -45% | 22.6 -3% | 19 14% | 20.7 6% | 23 -5% | 24.4 ? -11% |
| Load Average * (Watt) | 88 | 93 -6% | 89 -1% | 90 -2% | 96 -9% | 90.2 -3% | 88 -0% | 108.5 ? -23% |
| Witcher 3 ultra * (Watt) | 145 | 142.6 2% | 147 -1% | 161.7 -12% | 162 -12% | 120 17% | ||
| Load Maximum * (Watt) | 191 | 215.9 -13% | 173 9% | 120 37% | 229.1 -20% | 209.3 -10% | 167 13% | 254 ? -33% |
* ... menor é melhor
| Schenker Key 16 i7-8750H, GeForce RTX 2080 Max-Q, 62 Wh | MSI GS65 Stealth 9SG i7-9750H, GeForce RTX 2080 Max-Q, 82 Wh | Acer Predator Triton 500 i7-8750H, GeForce RTX 2080 Max-Q, 82 Wh | HP Omen 15-dc1303ng i7-8750H, GeForce RTX 2070 Max-Q, 70 Wh | Alienware m15 P79F i7-8750H, GeForce RTX 2070 Max-Q, 90 Wh | Razer Blade 15 RTX 2080 Max-Q i7-9750H, GeForce RTX 2080 Max-Q, 80 Wh | Gigabyte Aero 15-X9 i7-8750H, GeForce RTX 2070 Max-Q, 94.24 Wh | Média da turma Gaming | |
|---|---|---|---|---|---|---|---|---|
| Duração da bateria | 9% | -23% | -30% | -5% | 41% | 39% | 19% | |
| Reader / Idle (h) | 9.8 | 5.6 -43% | 5 -49% | 15.9 62% | 9.2 -6% | 8.71 ? -11% | ||
| H.264 (h) | 6 | 6.1 2% | 8.26 ? 38% | |||||
| WiFi v1.3 (h) | 5.5 | 6 9% | 3.2 -42% | 3.3 -40% | 5.2 -5% | 6.6 20% | 6.4 16% | 6.98 ? 27% |
| Load (h) | 1.2 | 1.4 17% | 1.2 0% | 1.7 42% | 2.9 142% | 1.47 ? 23% |
Pro
Contra
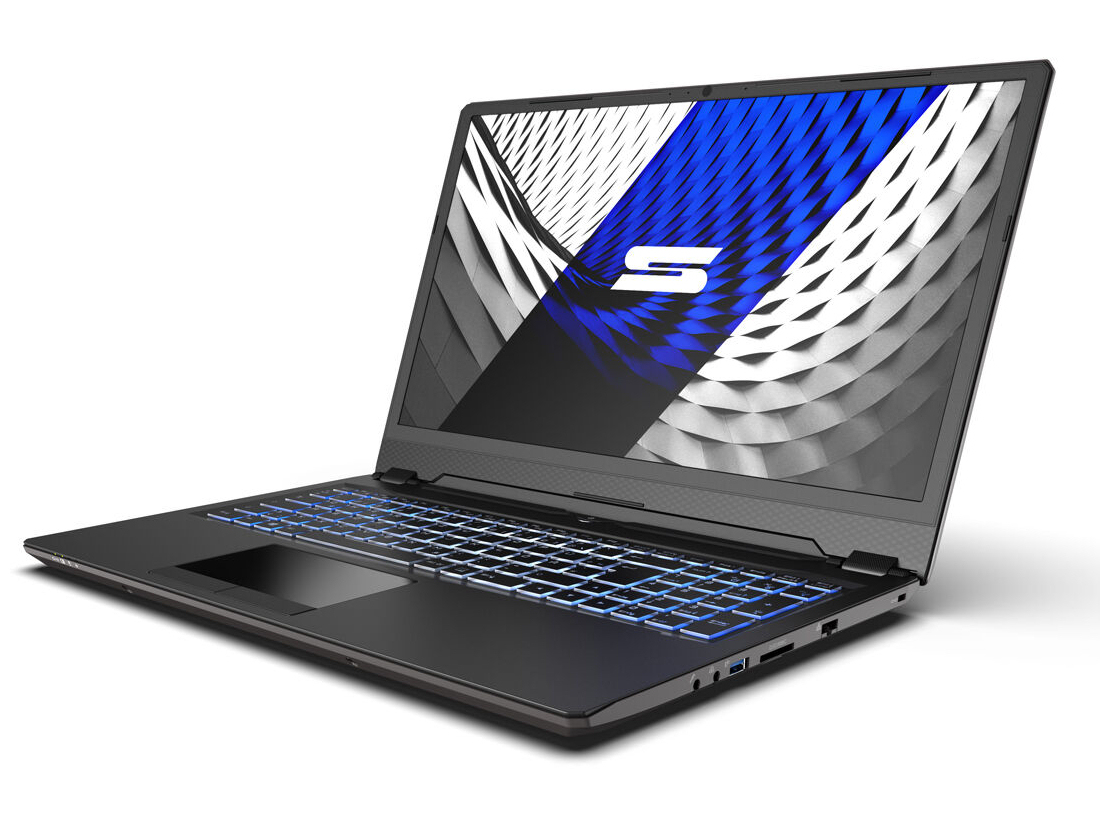
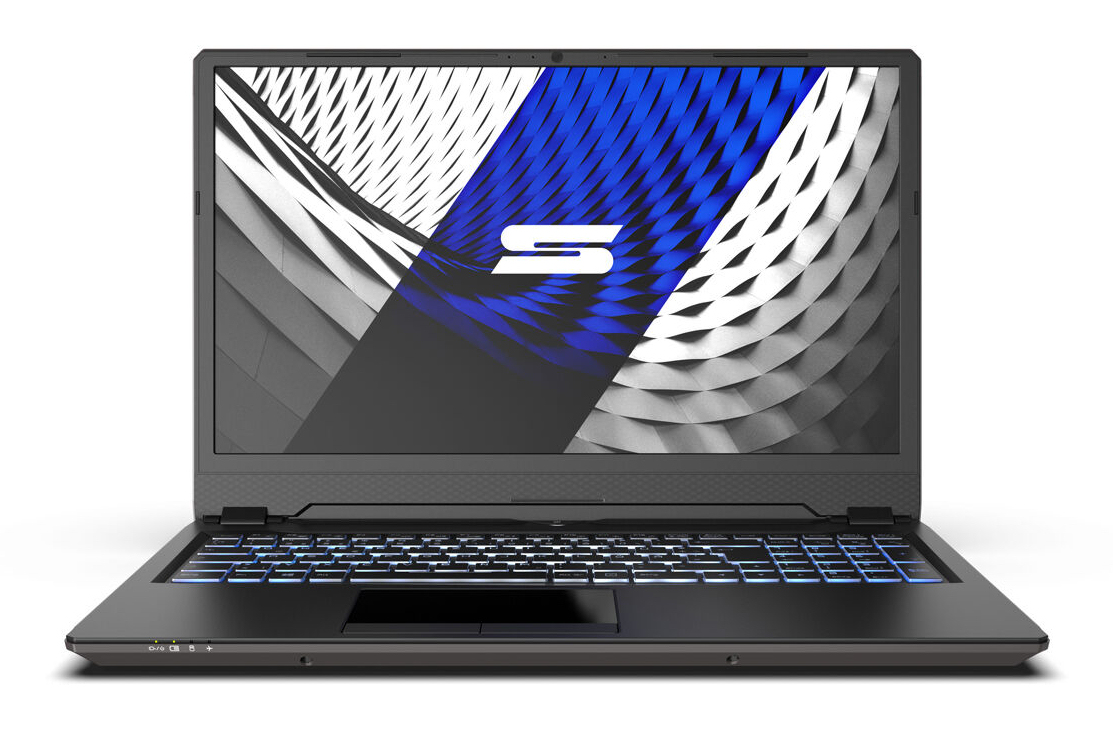
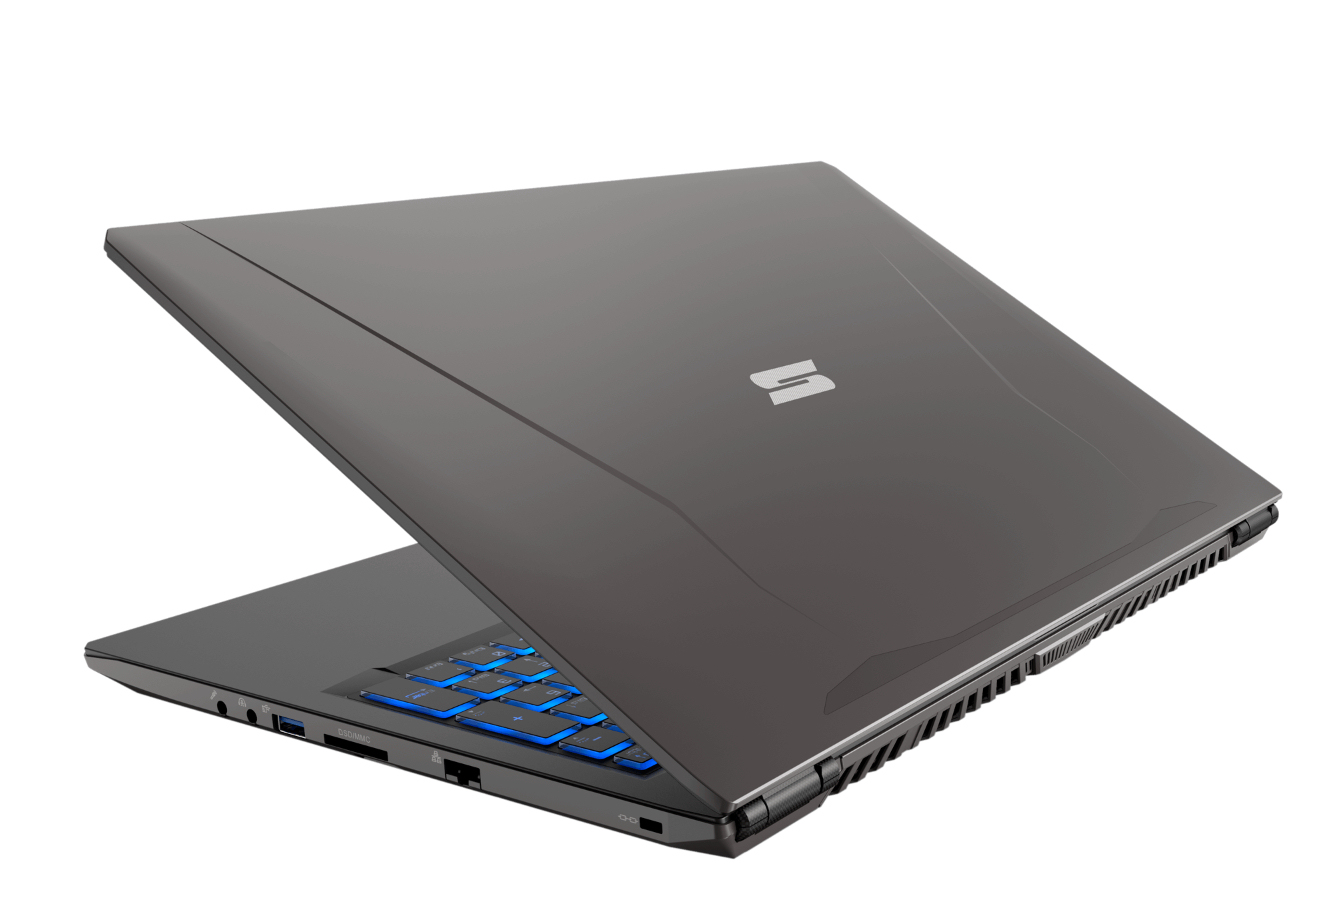
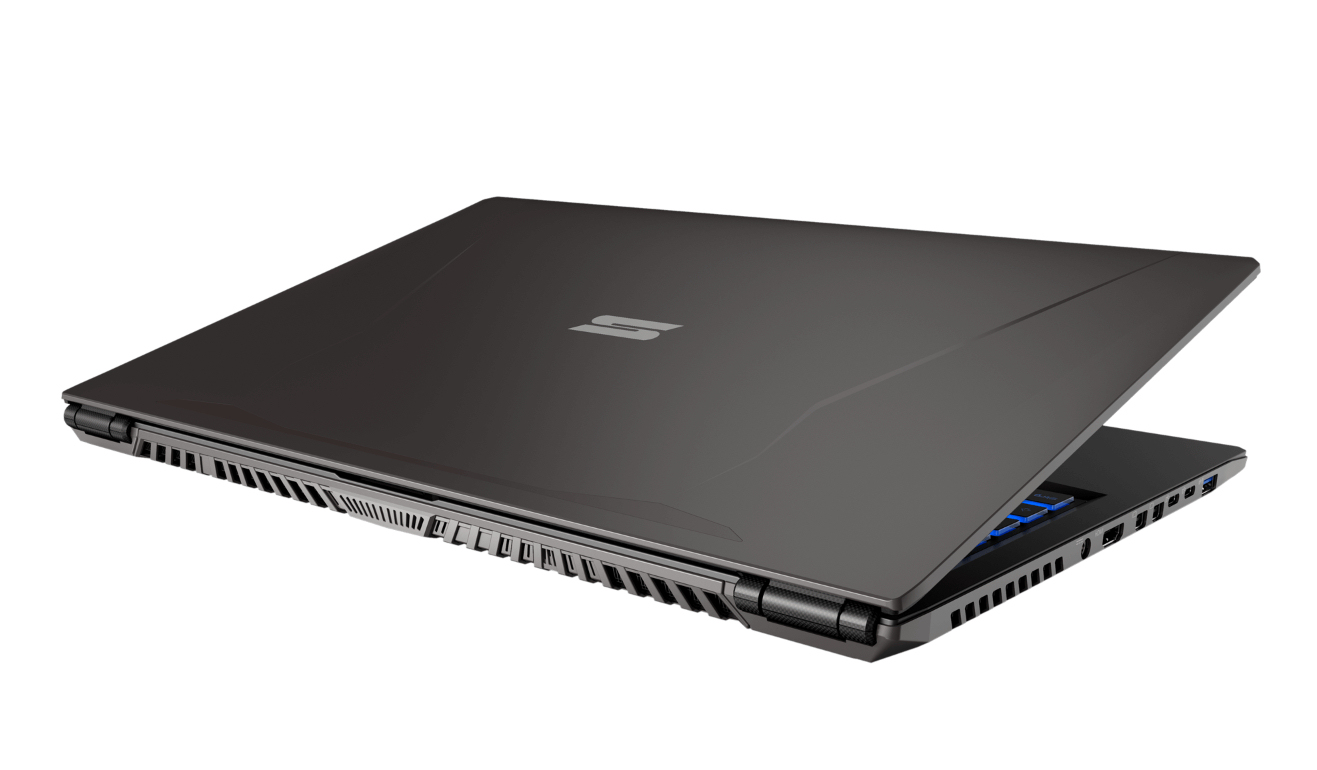
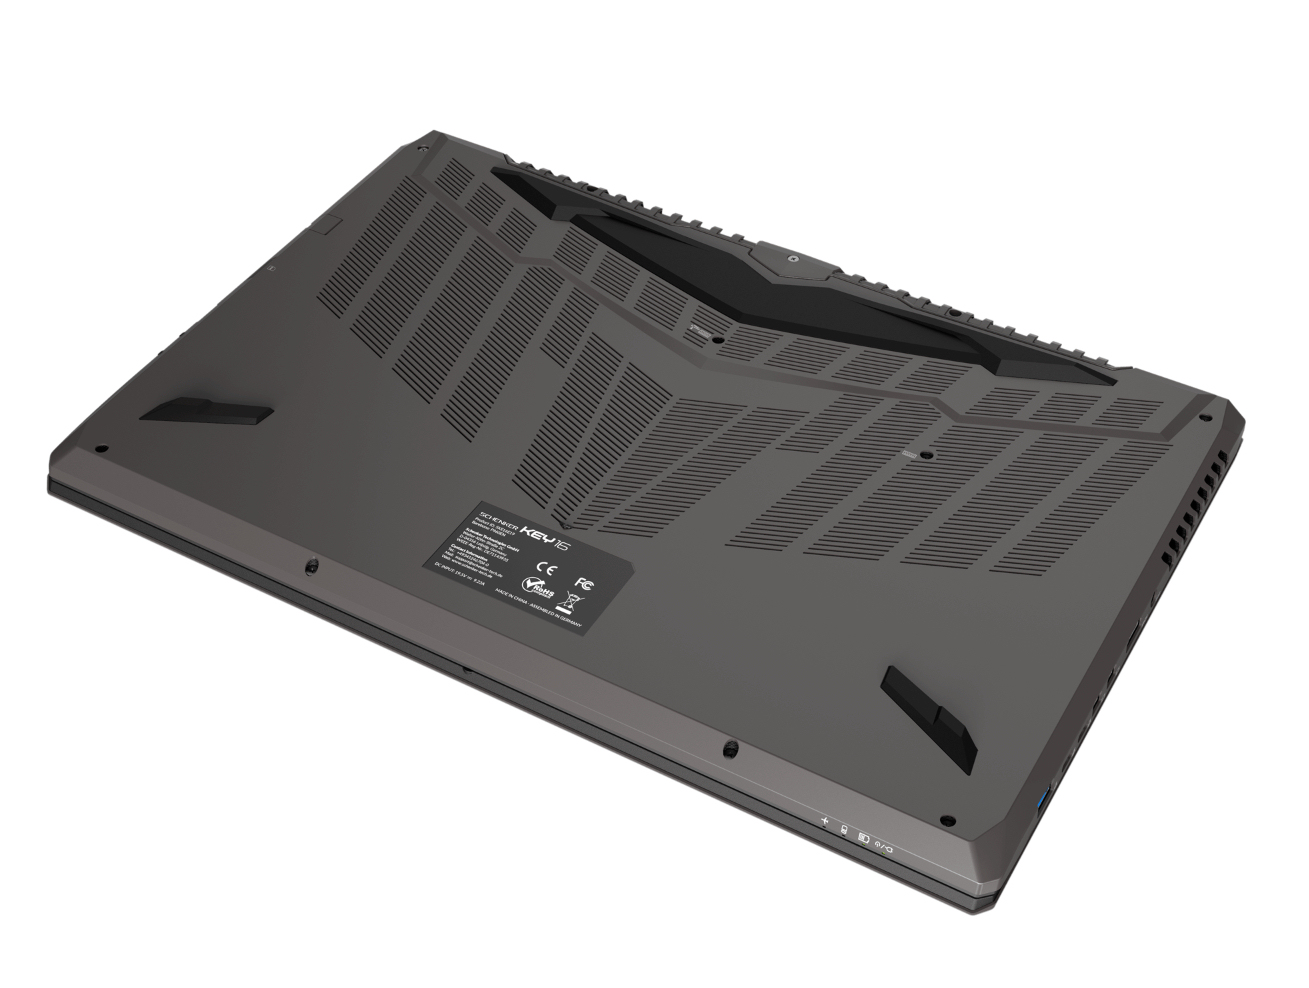
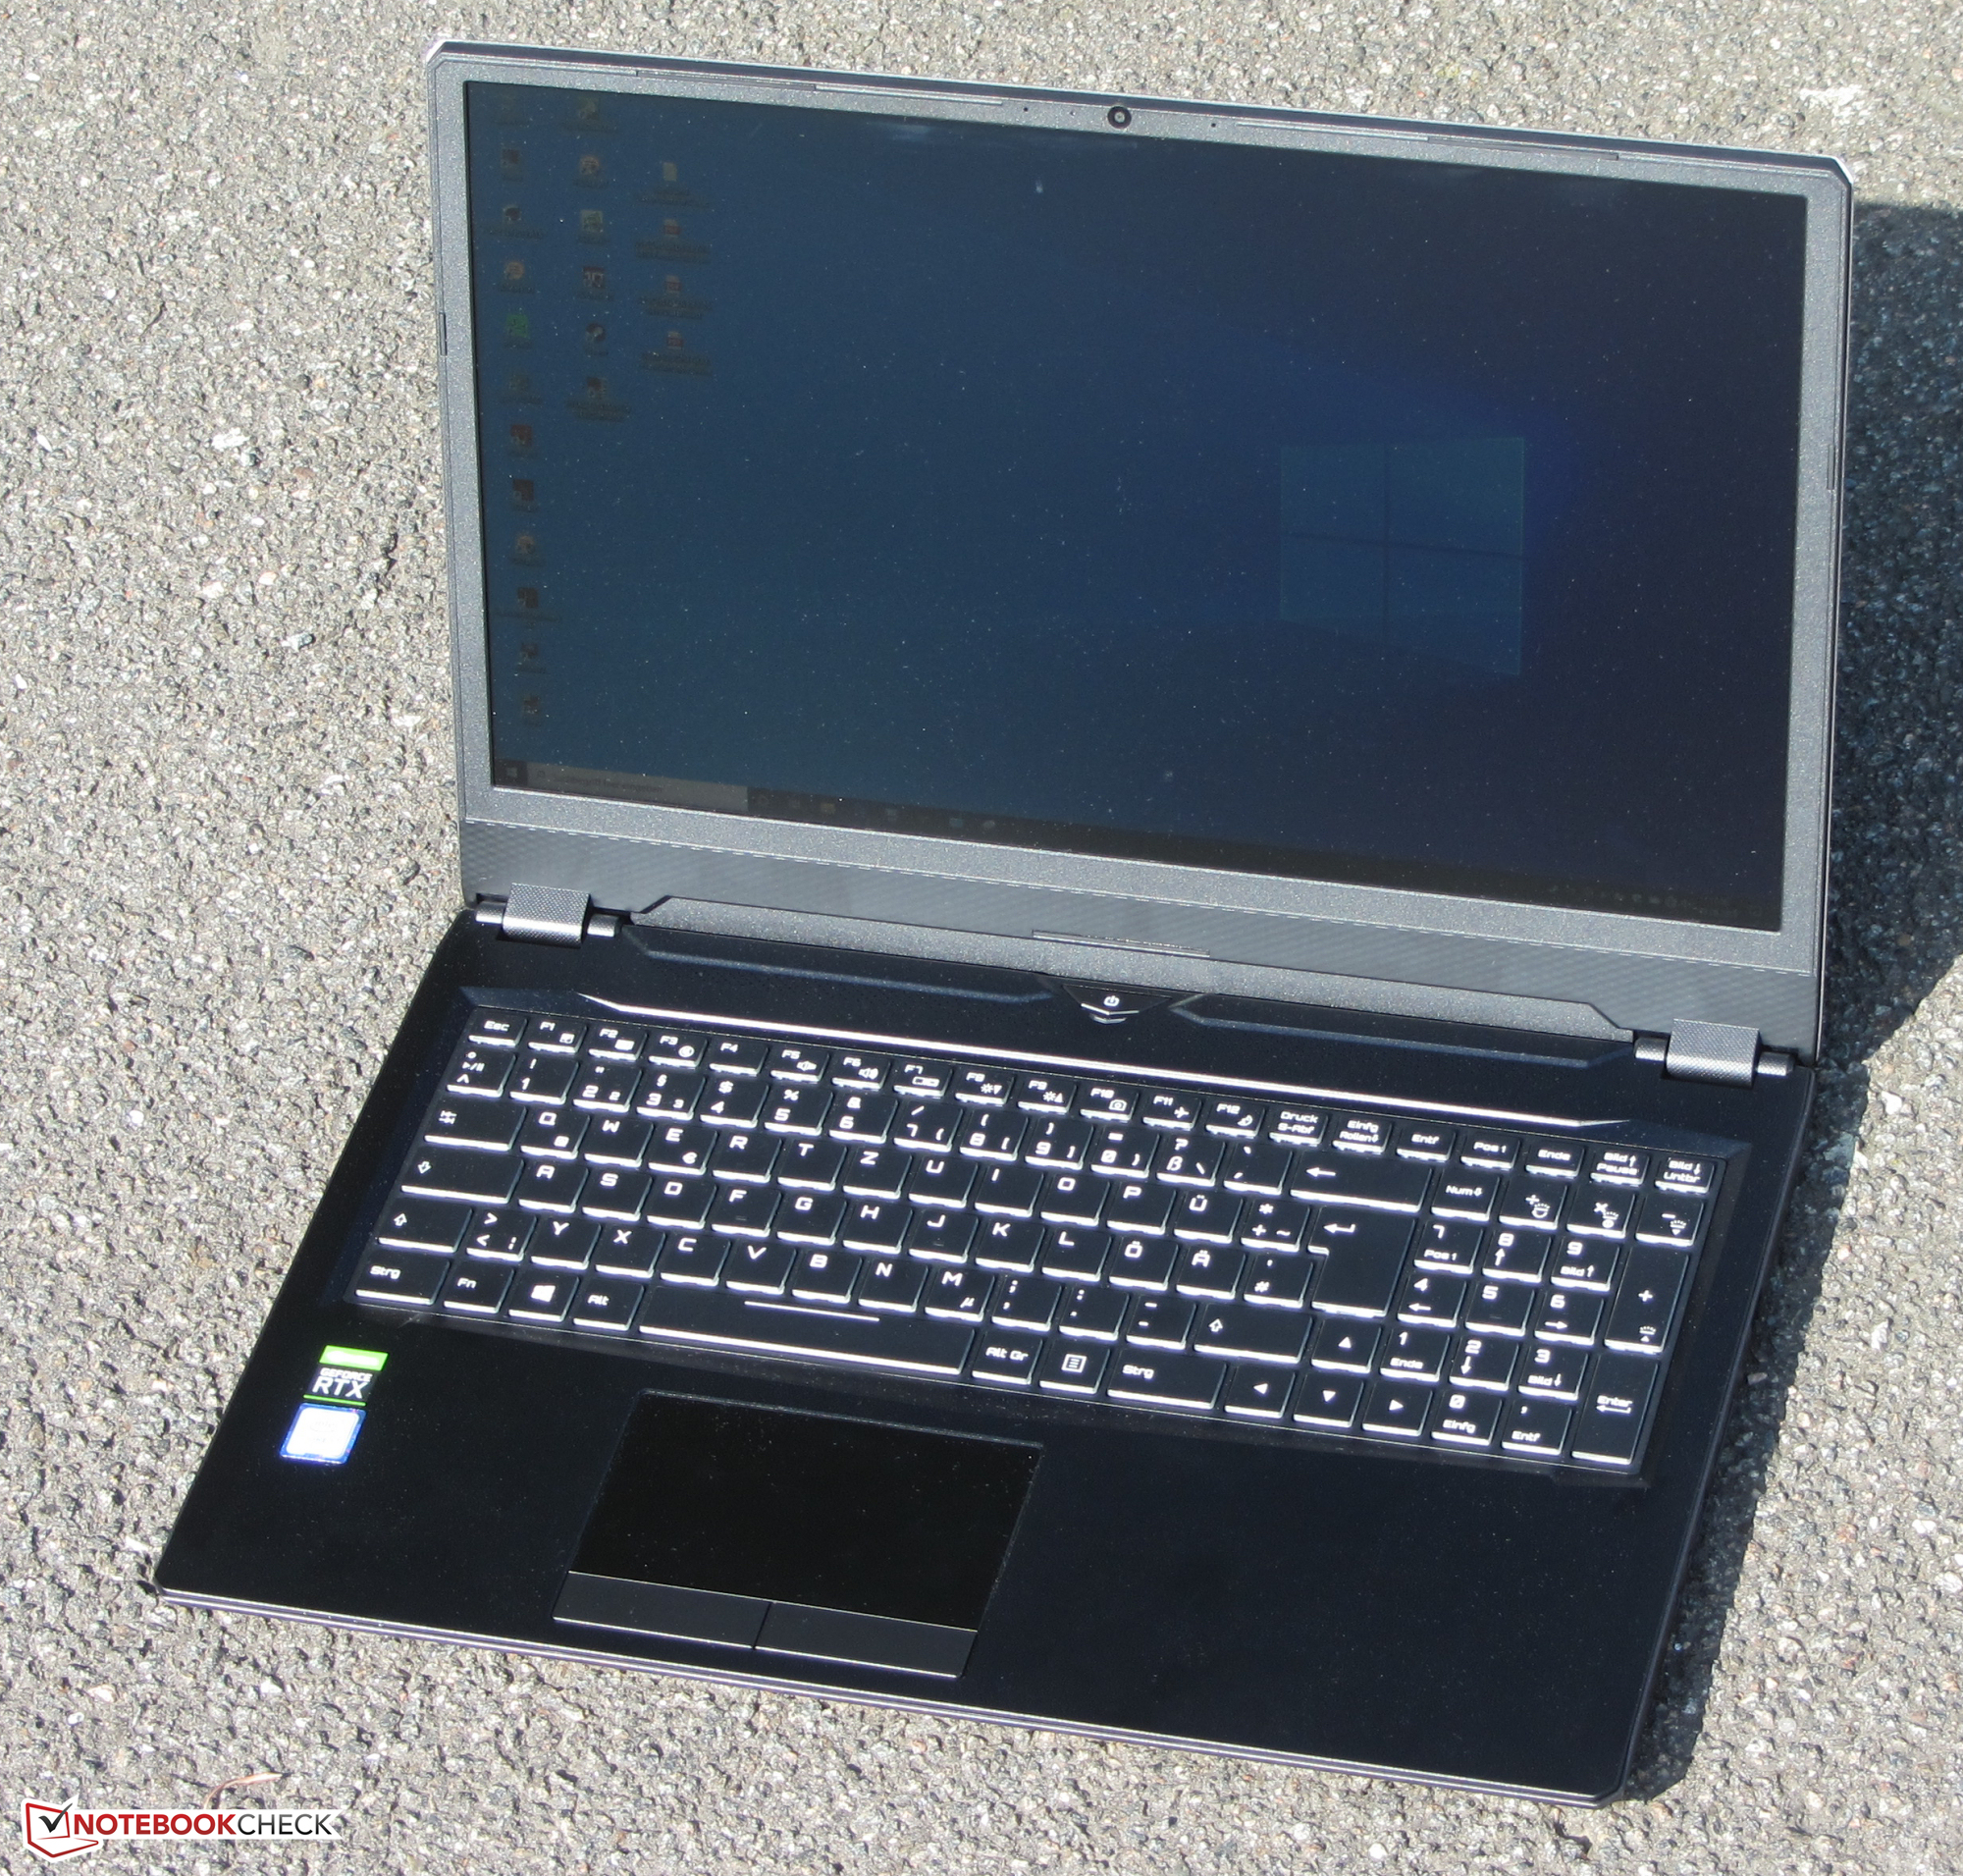
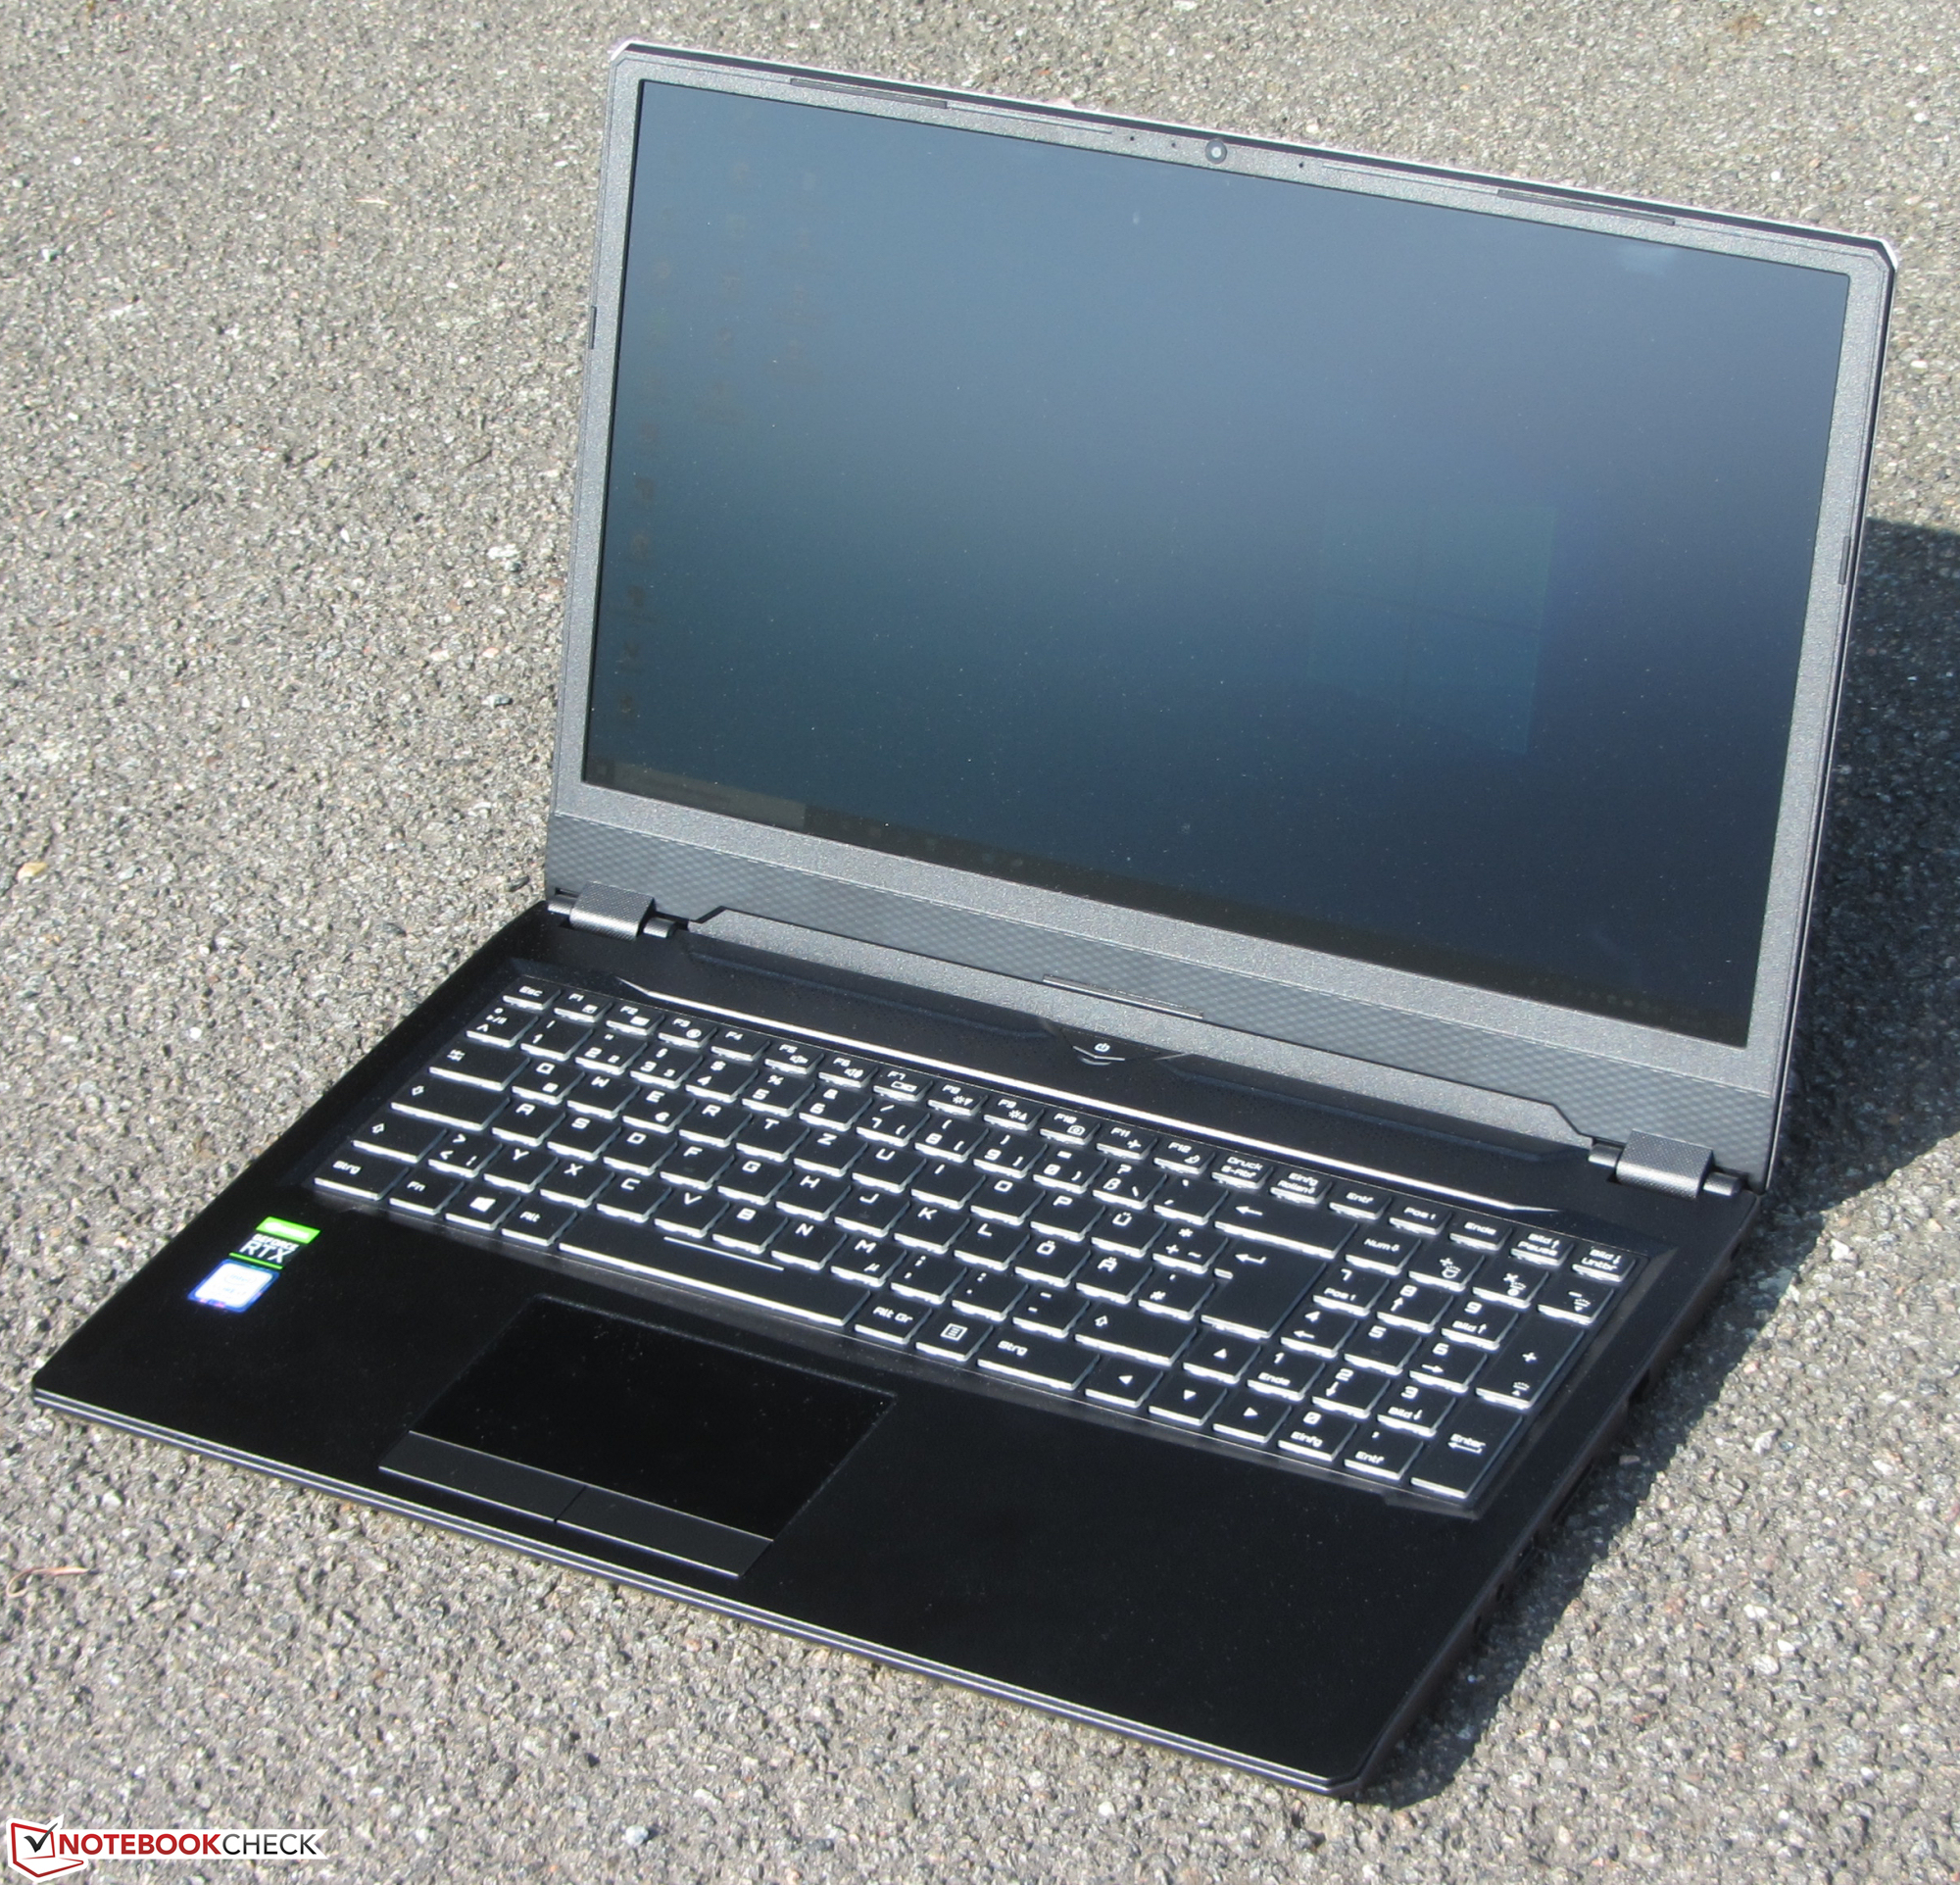
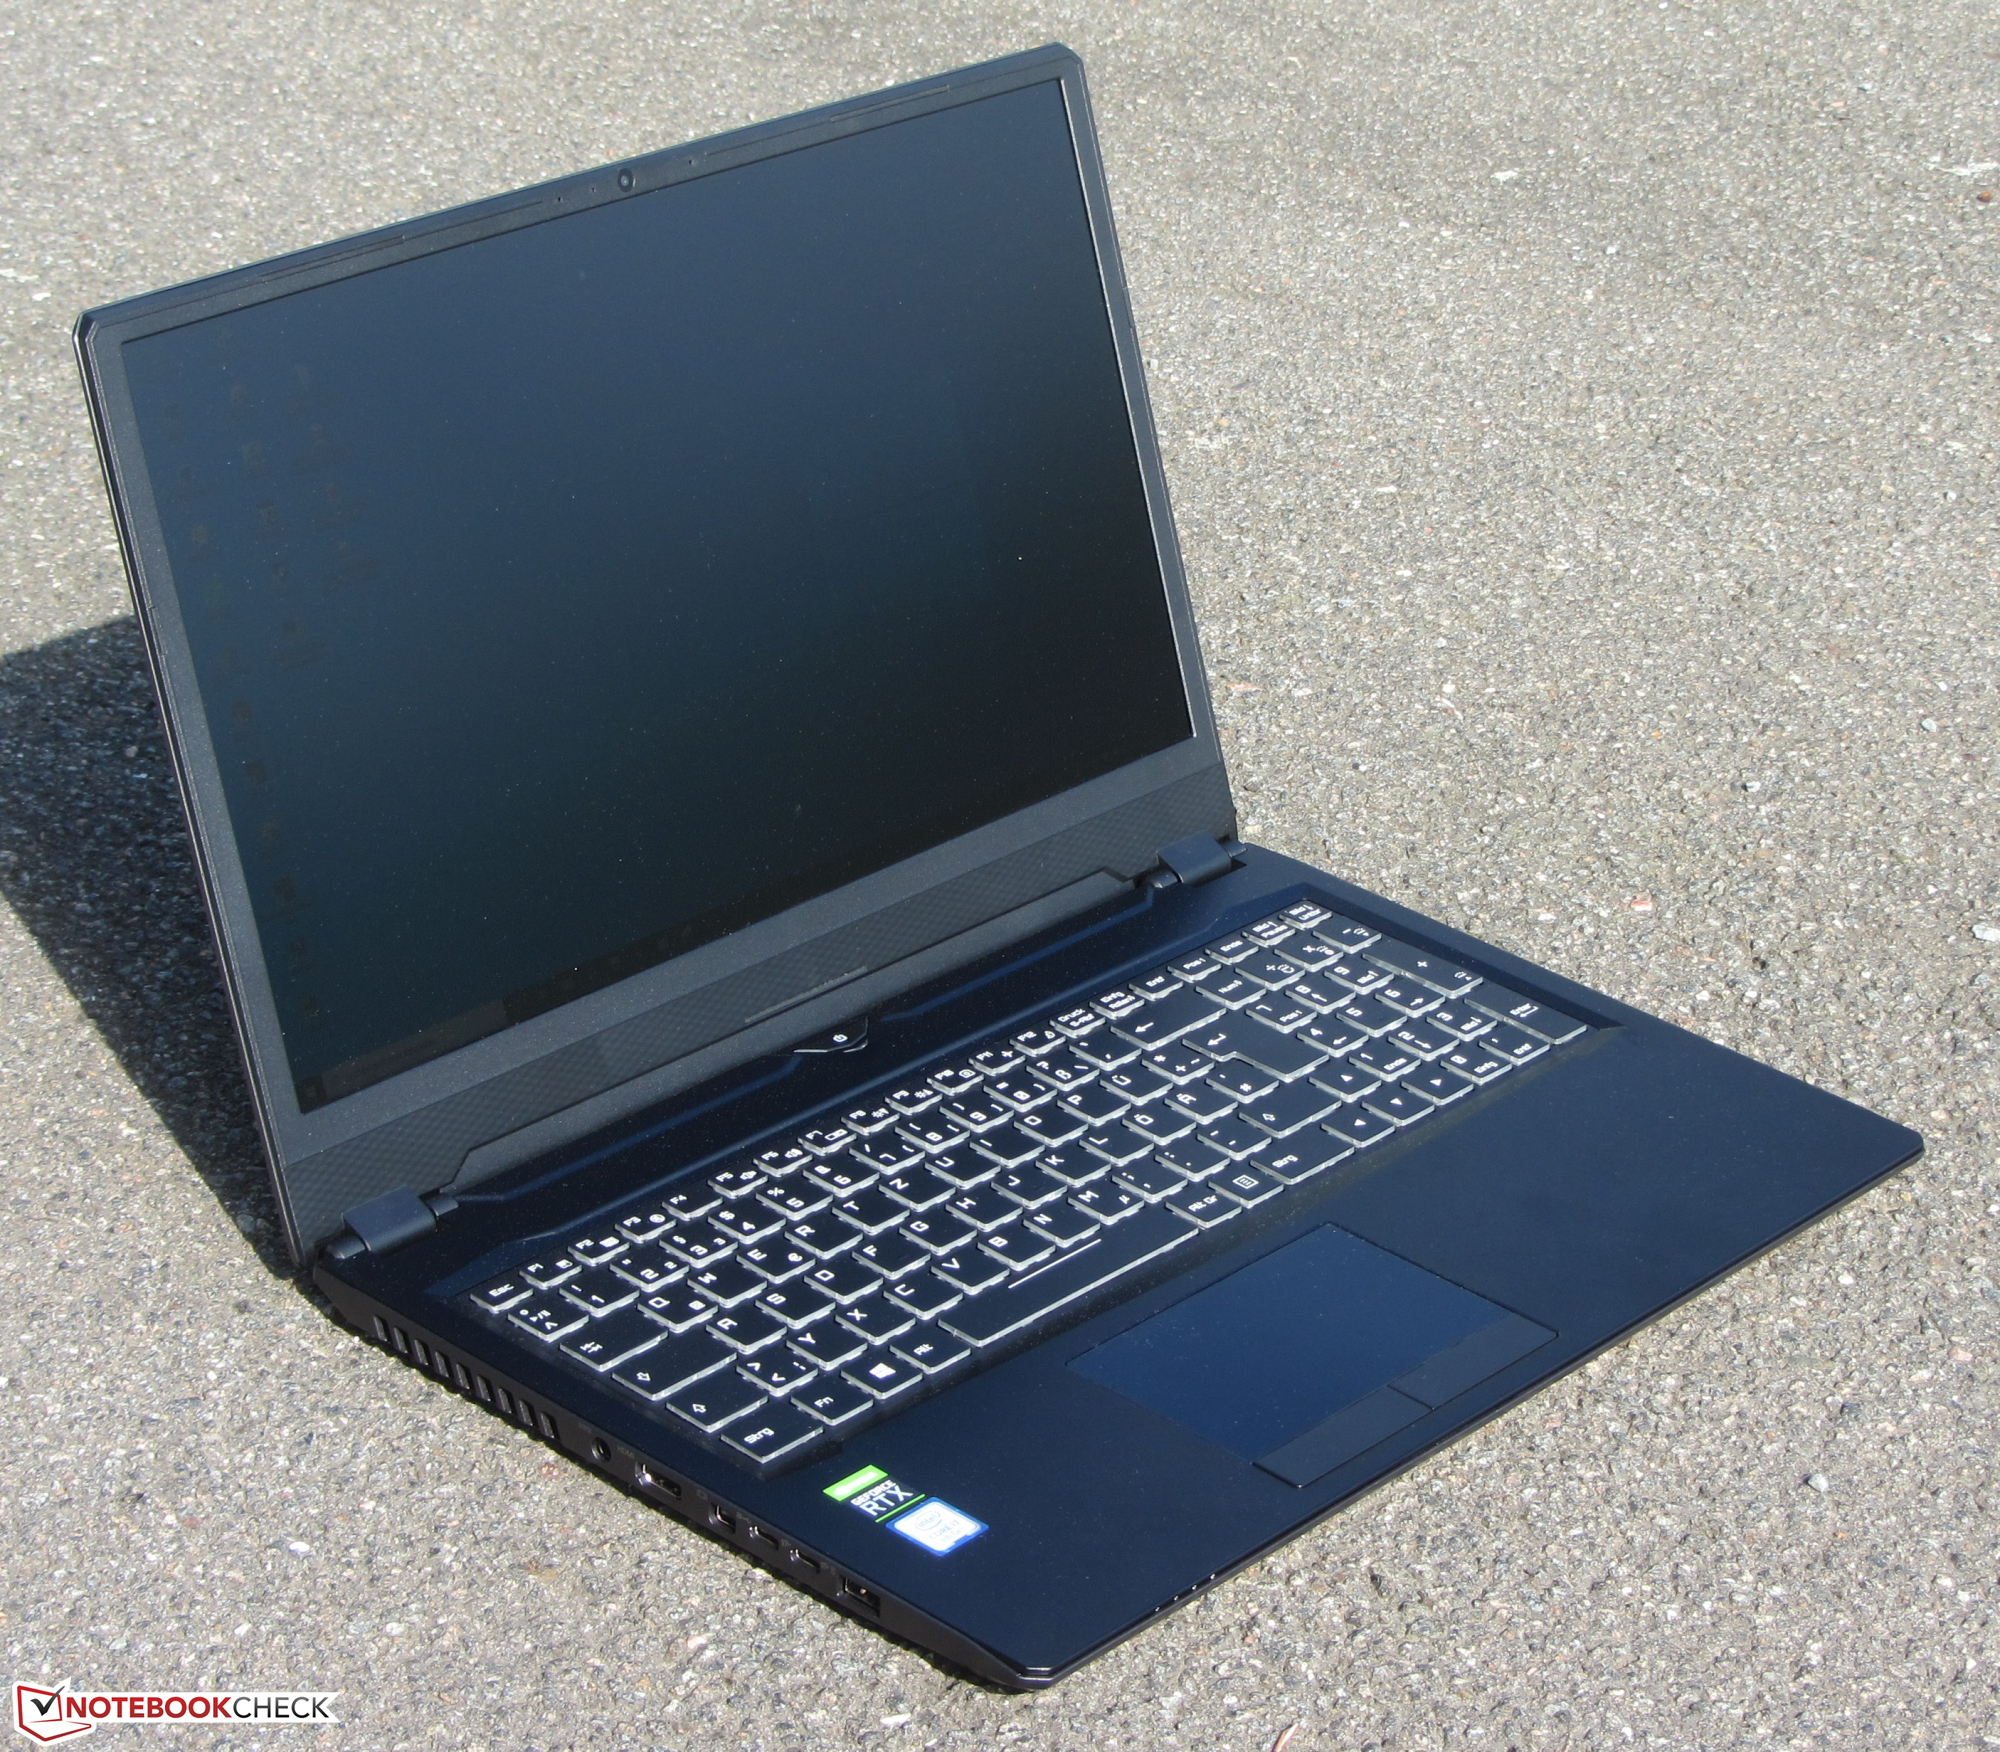
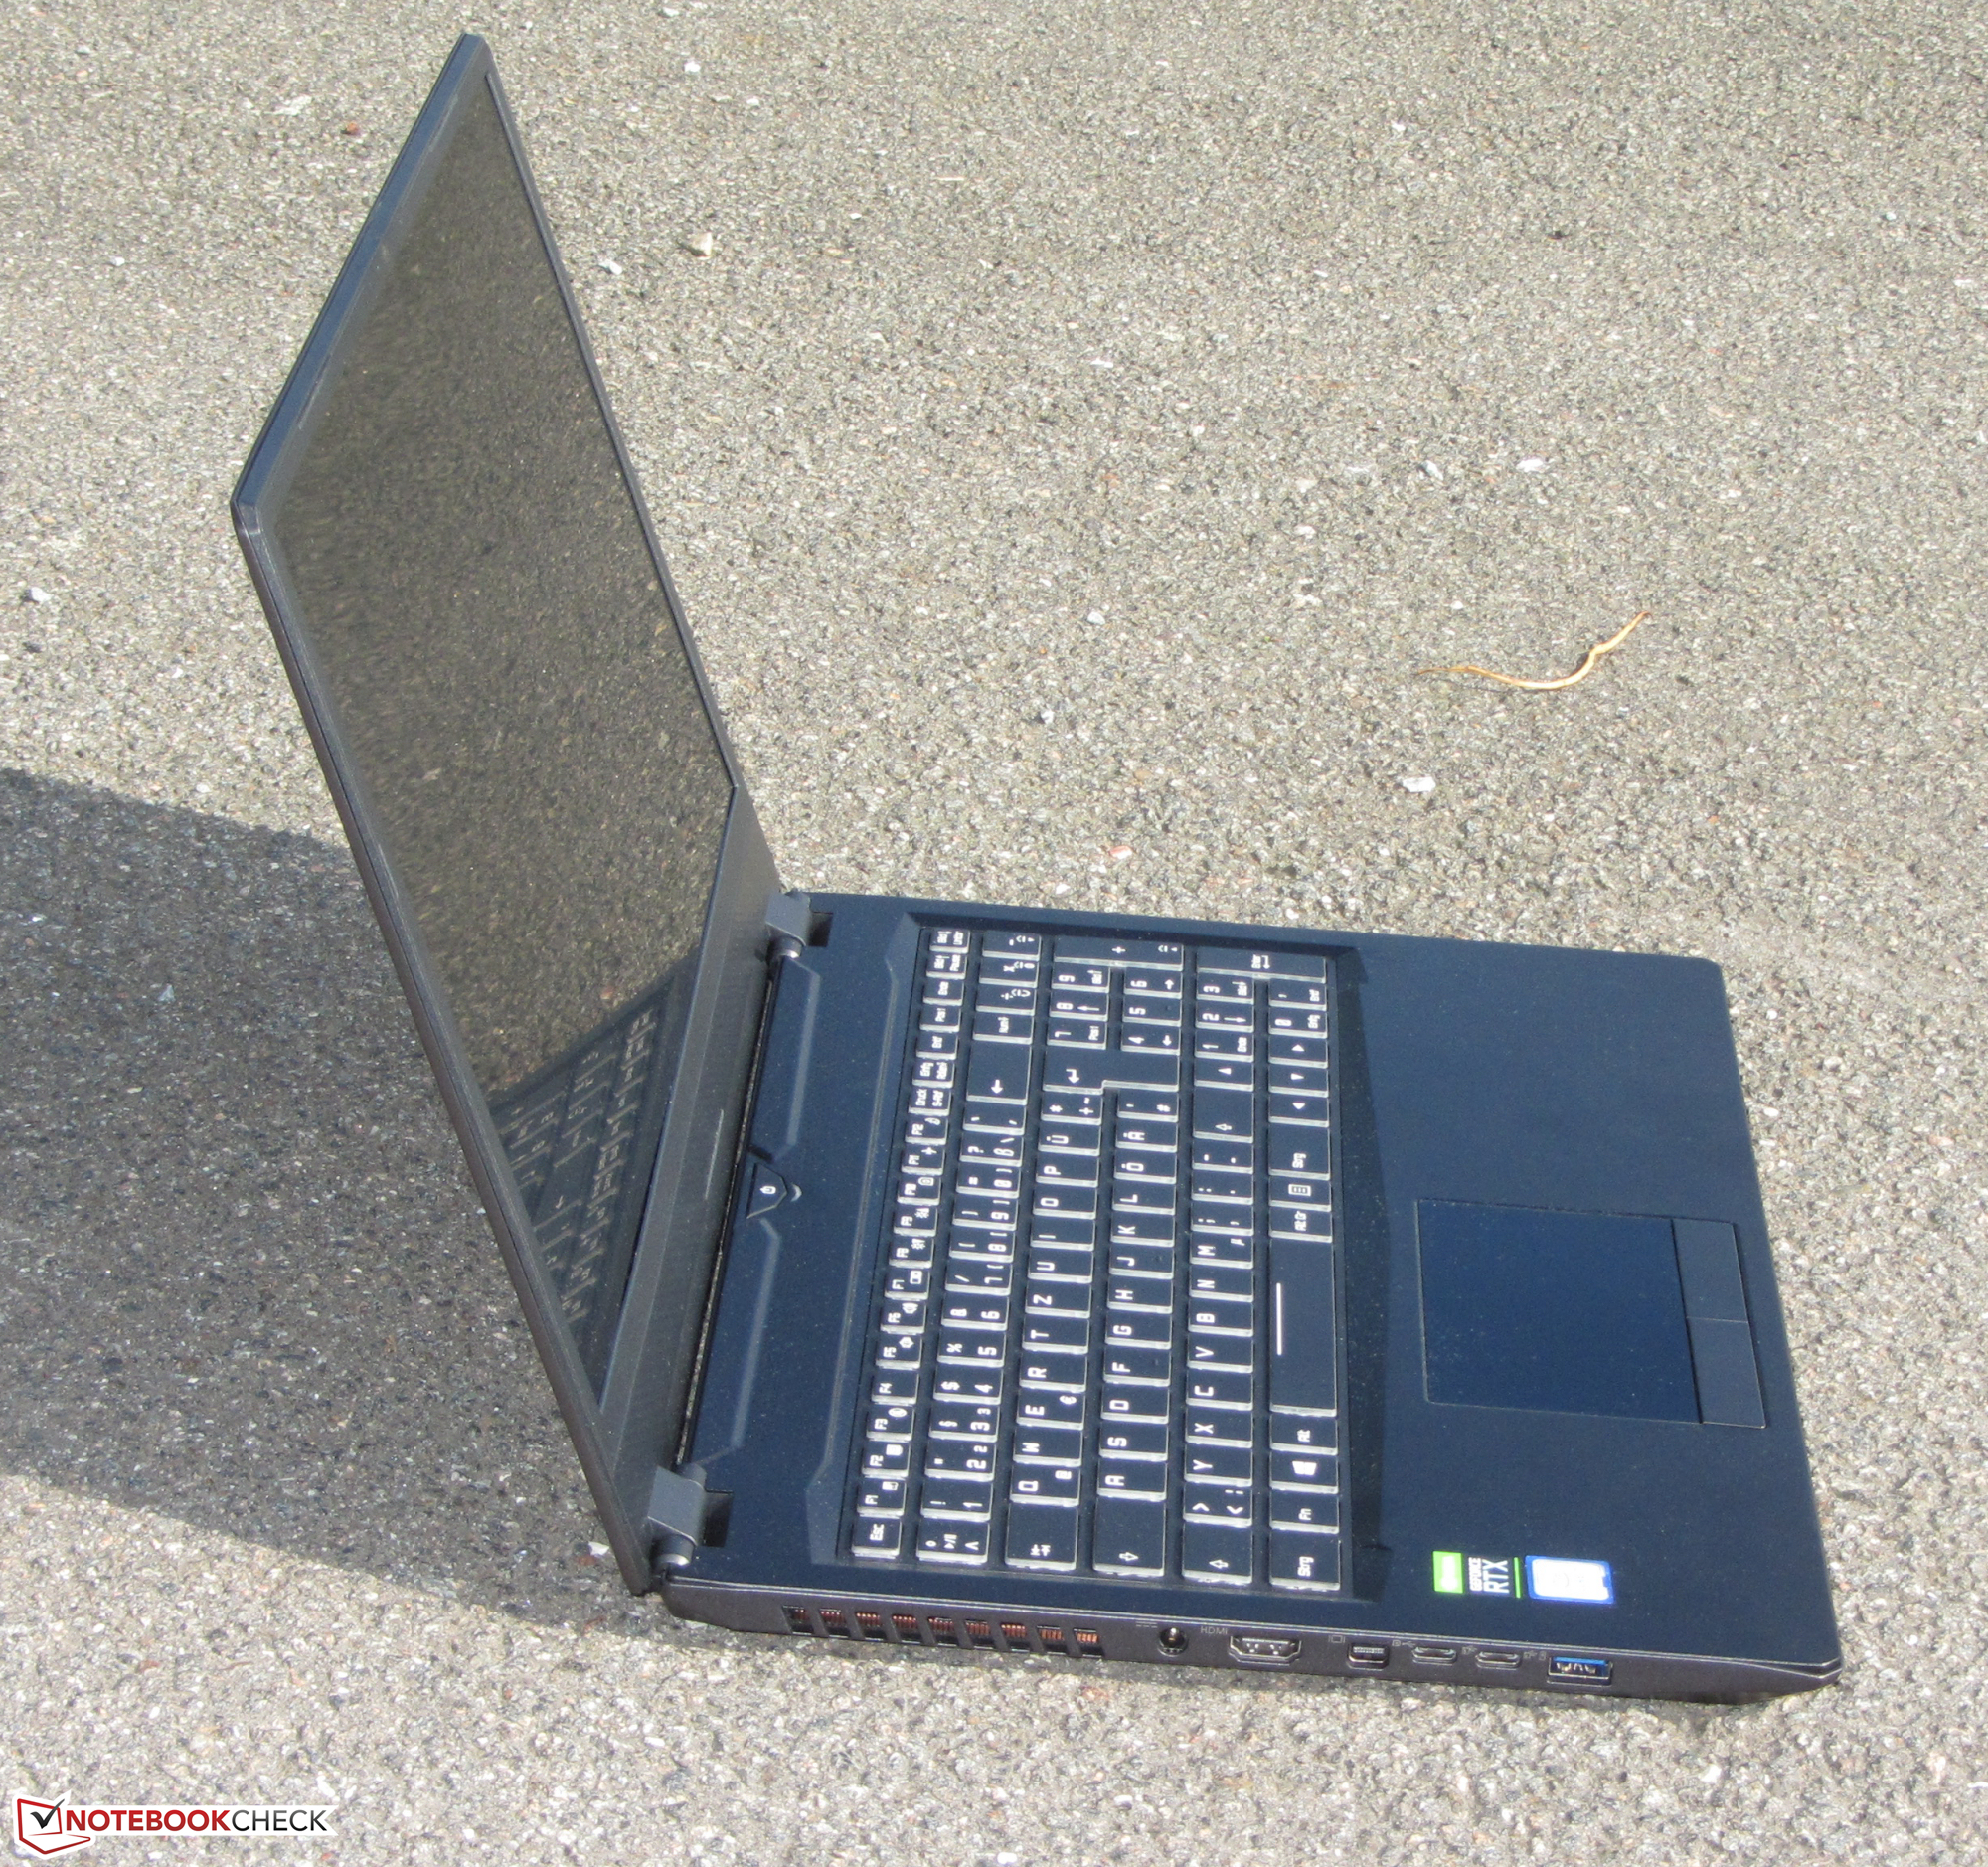
Com o Key 16, a Schenker está oferecendo um portátil fino para jogos, capaz de ganhar pontos com uma elegante carcaça de metal. Mesmo que seja usado um monitor com uma diagonal de 16,1 polegadas, o portátil é, no geral, pouco maior do que os dispositivos usuais de 15,6 polegadas.
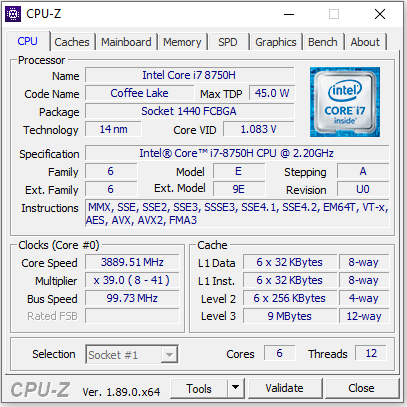
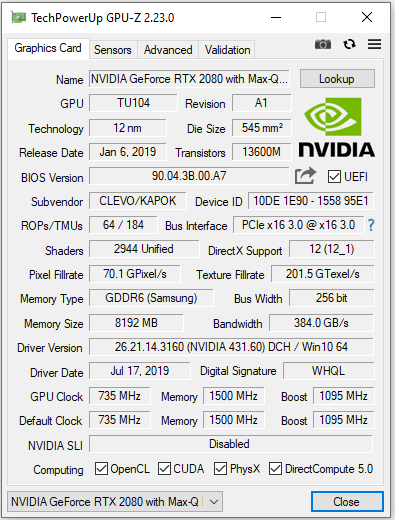
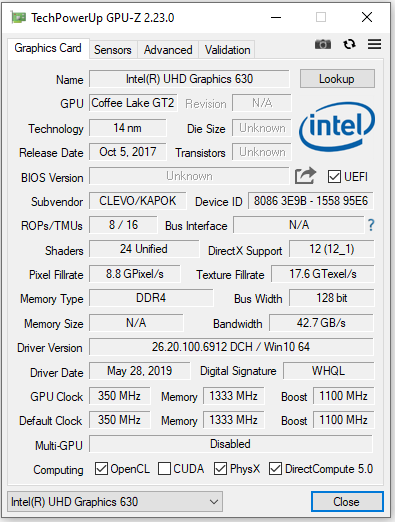
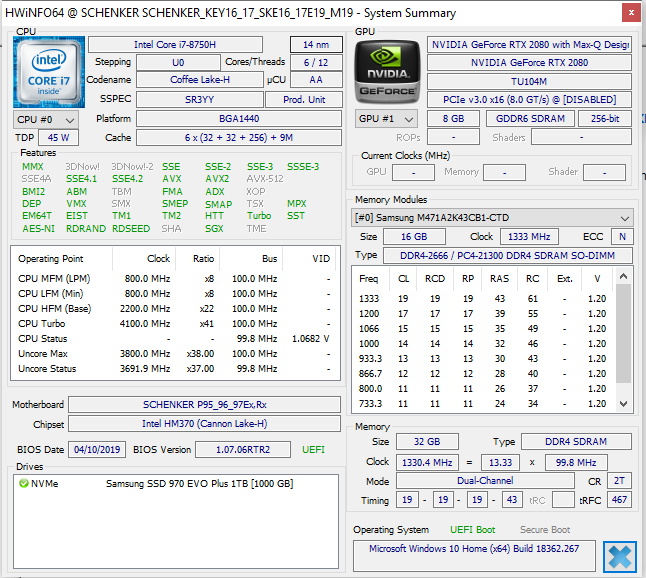
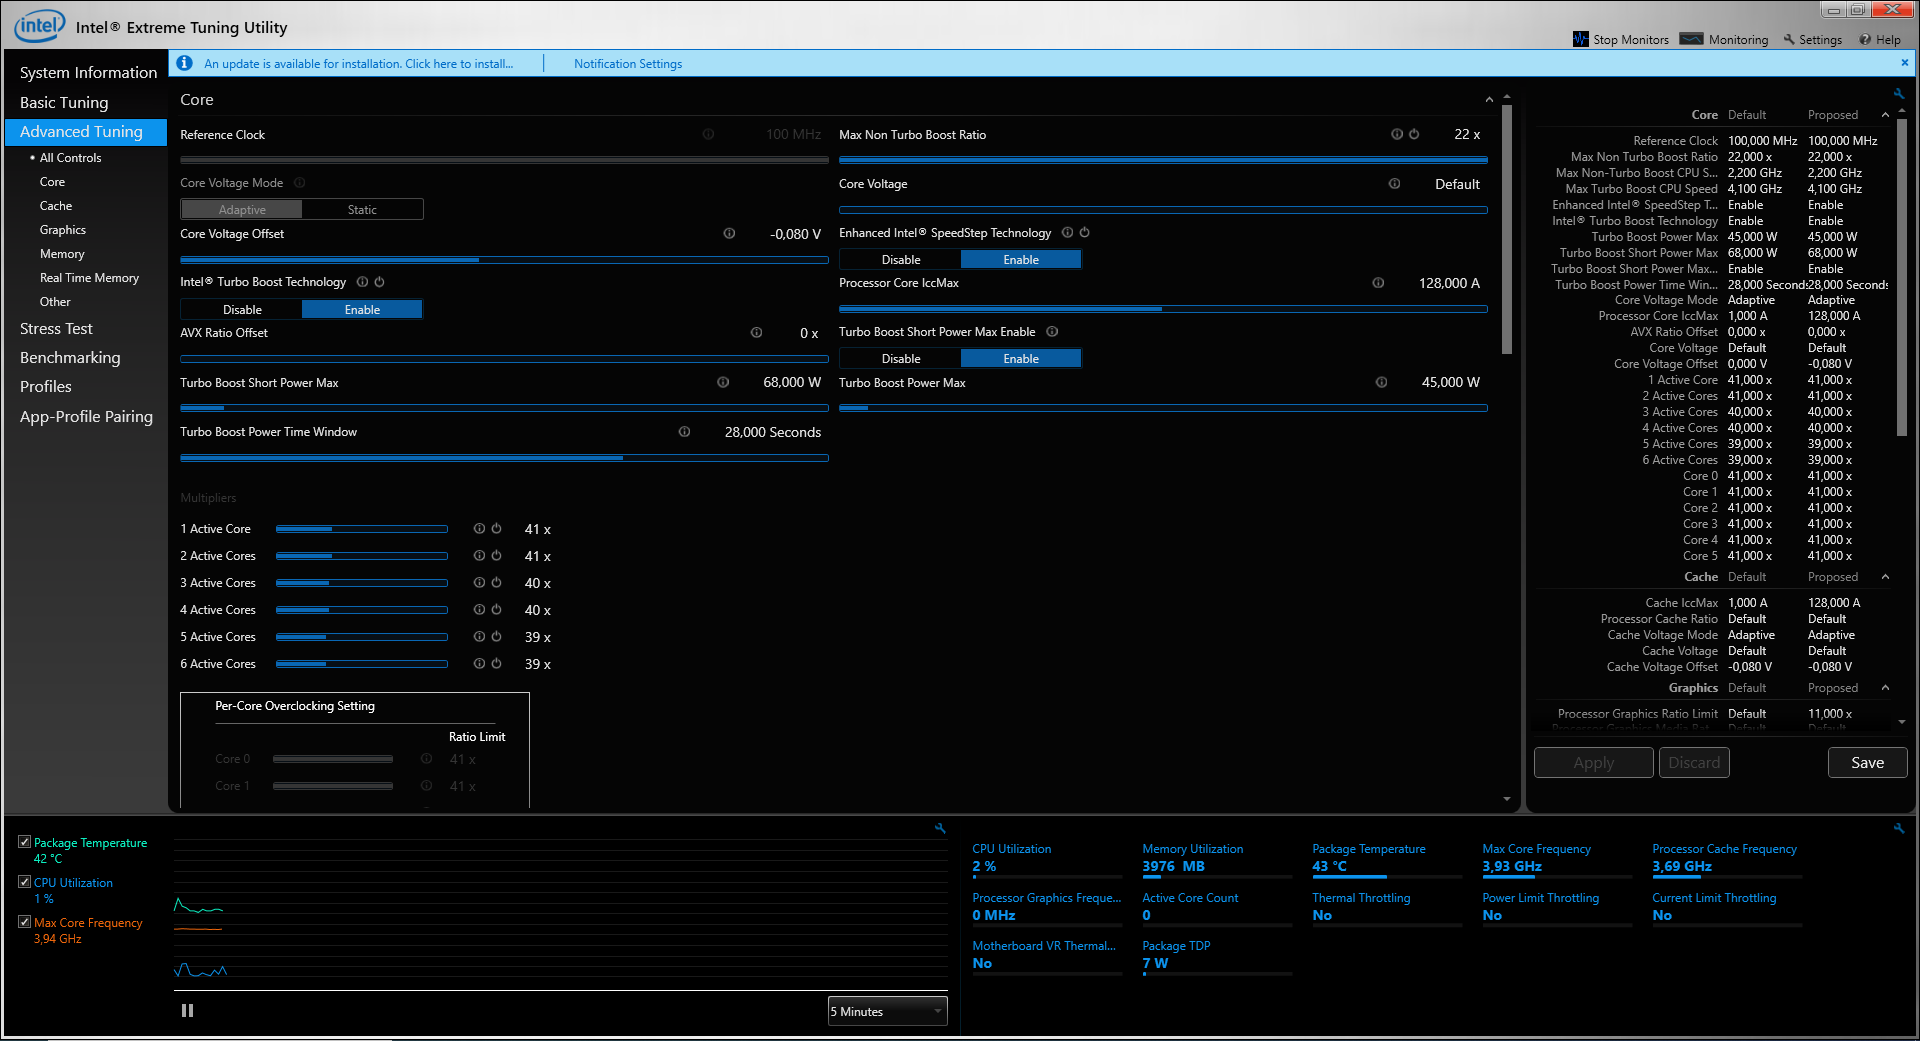
A combinação de um processador Core i7-8750H e gráficos GeForce GTX 2080 Max-Q é capaz de rodar todos os jogos atuais na tela Full-HD mate. Você sempre pode selecionar configurações de qualidade de gráficos altas a máximas.
A Schenker colocou muito poder de computação em uma carcaça elegante e fina.
Um veloz SSD NVMe garante um sistema veloz e fluente. Também há um slot para um segundo SSD M.2 (NVMe ou SATA). Se você usar dois SSDs NVMe, eles poderão ser unidos em uma configuração RAID (0 ou 1). Além disso, você também pode adicionar um disco de 2,5 polegadas. Qualquer atualização ou manutenção requer a abertura da carcaça, o que acaba sendo bastante complicado.
A tela IPS de 144 Hz tem tempos de resposta curtos, ângulos de visão estáveis, bom contraste e uma ótima reprodução de cores. No entanto, o brilho da tela poderia ter sido melhor. Para usá-lo em interiores, o brilho é suficiente.
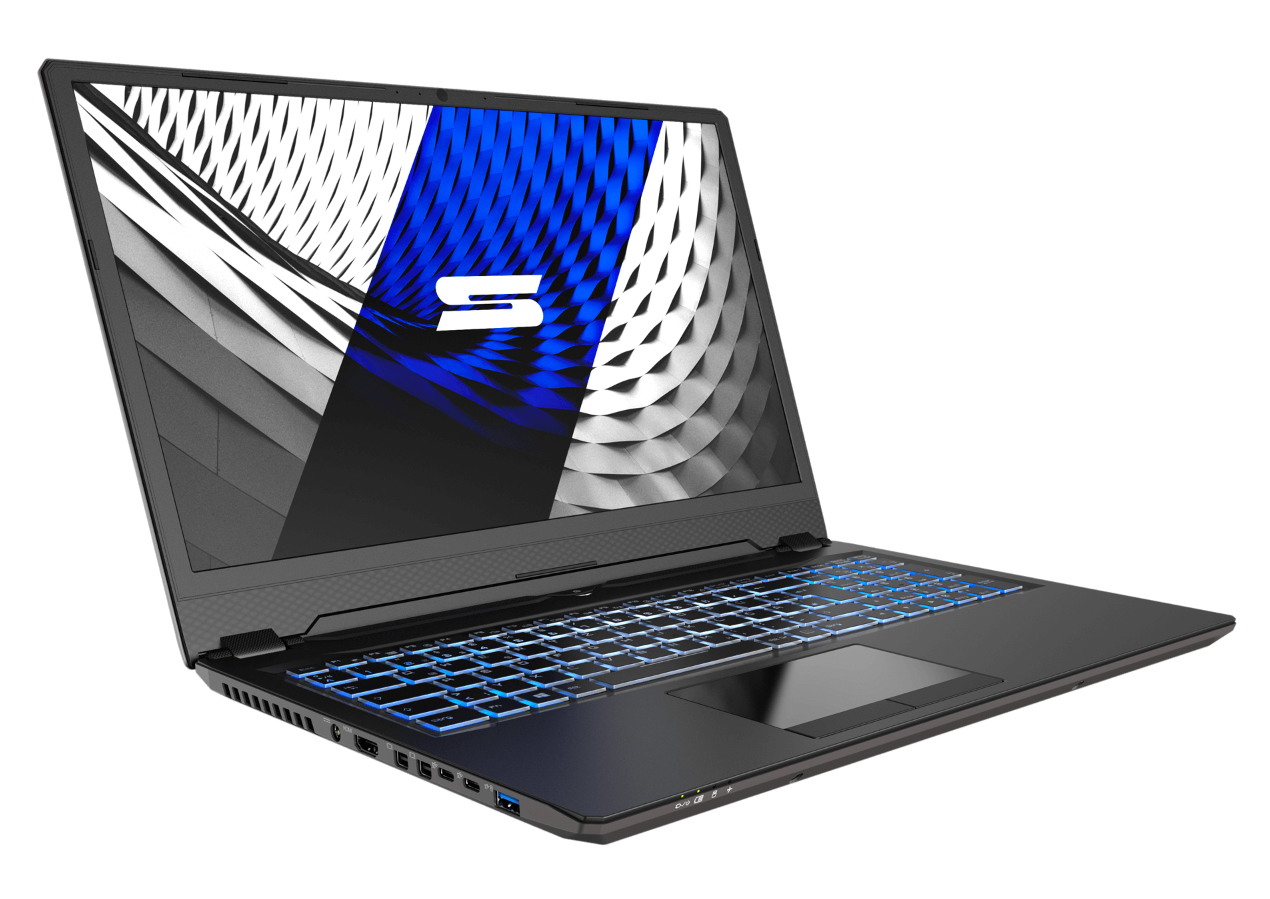
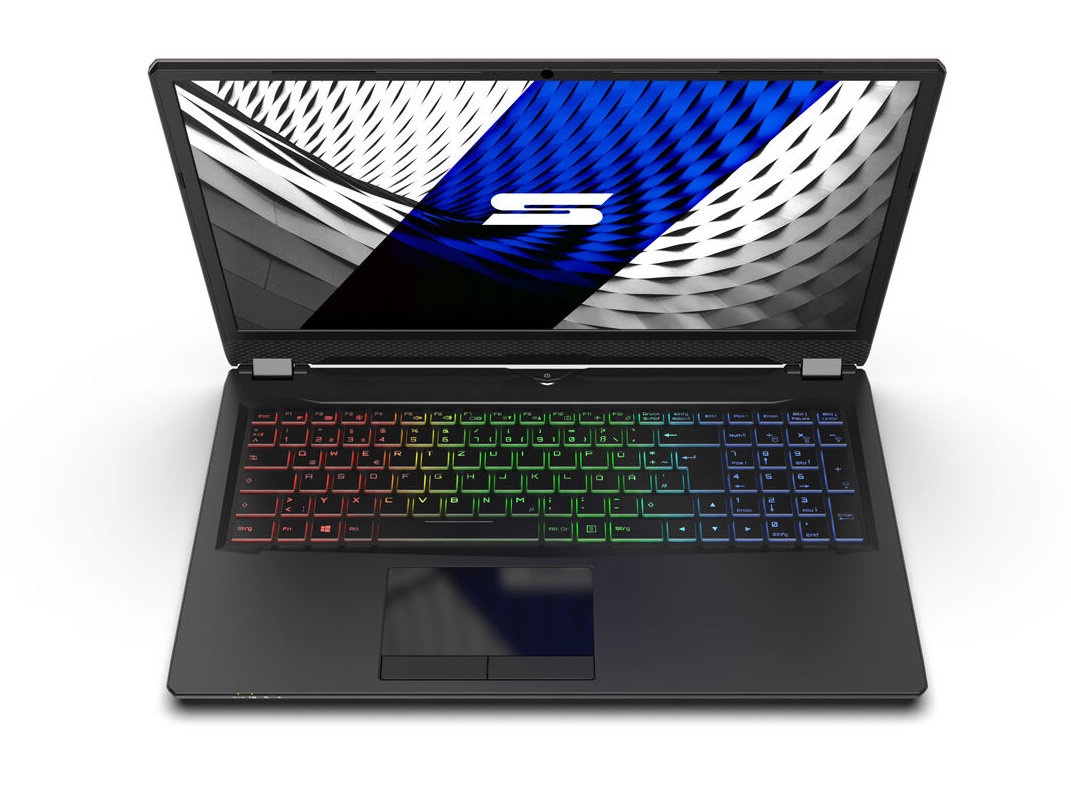
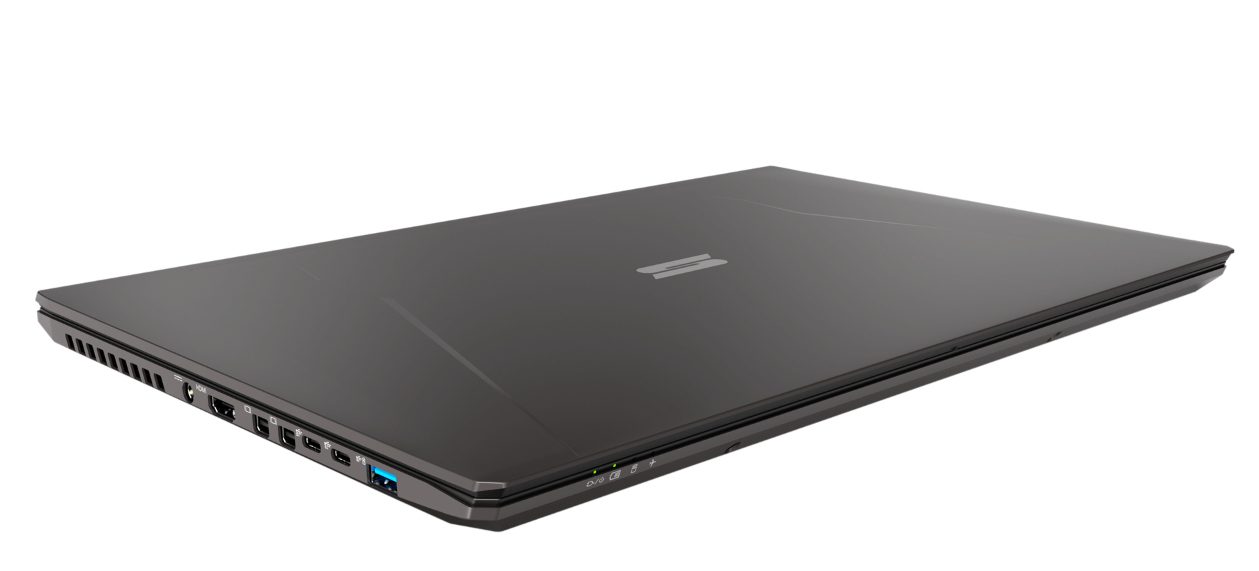
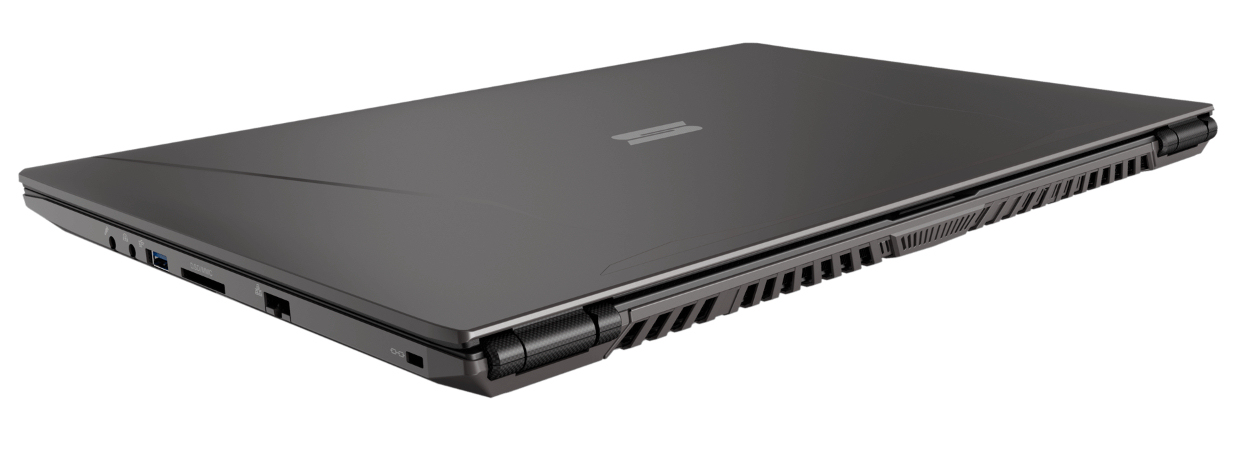
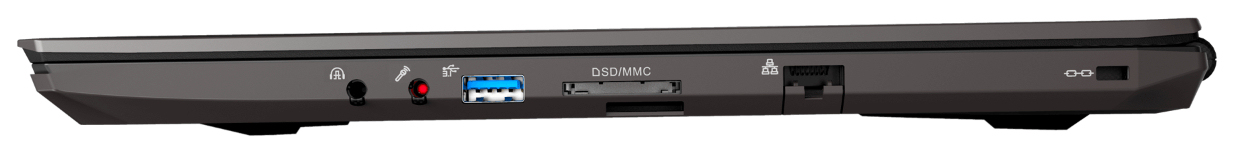
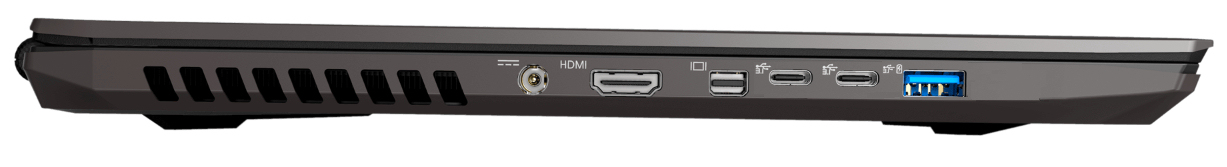
Embora a duração da bateria não inspire muito entusiasmo, não há problema em um portátil dessa classe de desempenho. O teclado chiclet (iluminação RGB) provou ser adequado para tarefas diárias. Isso é acompanhado por uma boa quantidade de conexões. No entanto sentimos falta de uma conexão Thunderbolt-3.
Schenker Key 16
- 09/20/2019 v7 (old)
Sascha Mölck
Price comparison
