Breve Análise do Portátil MSI GP63 Leopard 8RE (i7-8750H, GTX 1060, FHD) Xotic PC Edition
| SD Card Reader | |
| average JPG Copy Test (av. of 3 runs) (classificar por valor) | |
| MSI GP63 Leopard 8RE-013US (Toshiba Exceria Pro SDXC 64 GB UHS-II) | |
| HP Omen 15-ce002ng (Toshiba Exceria Pro SDXC 64 GB UHS-II) | |
| Acer Aspire VN7-593G-73HP V15 Nitro BE | |
| Asus Strix GL703VM-DB74 (Toshiba Exceria Pro SDXC 64 GB UHS-II) | |
| Eurocom Q6 (Toshiba Exceria Pro SDXC 64 GB UHS-II) | |
| maximum AS SSD Seq Read Test (1GB) (classificar por valor) | |
| MSI GP63 Leopard 8RE-013US (Toshiba Exceria Pro SDXC 64 GB UHS-II) | |
| HP Omen 15-ce002ng (Toshiba Exceria Pro SDXC 64 GB UHS-II) | |
| Acer Aspire VN7-593G-73HP V15 Nitro BE | |
| Asus Strix GL703VM-DB74 (Toshiba Exceria Pro SDXC 64 GB UHS-II) | |
| Eurocom Q6 (Toshiba Exceria Pro SDXC 64 GB UHS-II) | |
| |||||||||||||||||||||||||
iluminação: 87 %
iluminação com acumulador: 368.5 cd/m²
Contraste: 1084:1 (Preto: 0.34 cd/m²)
ΔE ColorChecker Calman: 8.91 | ∀{0.5-29.43 Ø4.71}
calibrated: 2.87
ΔE Greyscale Calman: 12 | ∀{0.09-98 Ø4.96}
99.98% sRGB (Argyll 1.6.3 3D)
85.94% AdobeRGB 1998 (Argyll 1.6.3 3D)
85.9% AdobeRGB 1998 (Argyll 3D)
100% sRGB (Argyll 3D)
91.5% Display P3 (Argyll 3D)
Gamma: 1.825
CCT: 11519 K
| MSI GP63 Leopard 8RE-013US Chi Mei CMN15F4 (N156HHE-GA1 CMN), TN LED, 120 Hz, 15.6", 1920x1080 | HP Omen 15-ce002ng AUO42ED, IPS, 15.6", 1920x1080 | Lenovo Legion Y720 80VR002XGE LG Philips LGD0533 LP156WF6-SPK3, IPS, 15.6", 1920x1080 | Acer Aspire VN7-593G-73HP V15 Nitro BE LG Display LP156WF6-SPP1, AH-IPS, Normally Black, Transmissive, 15.6", 1920x1080 | MSI GE63VR 7RF Raider Chi Mei N156HHE-GA1 (CMN15F4), TN LED, 15.6", 1920x1080 | |
|---|---|---|---|---|---|
| Display | -20% | -52% | -24% | 0% | |
| Display P3 Coverage (%) | 91.5 | 65.8 -28% | 38.43 -58% | 65.8 -28% | 91.3 0% |
| sRGB Coverage (%) | 100 | 90.9 -9% | 57.5 -43% | 85.1 -15% | 100 0% |
| AdobeRGB 1998 Coverage (%) | 85.9 | 66.5 -23% | 39.75 -54% | 62.2 -28% | 86.7 1% |
| Response Times | -176% | -133% | -188% | 37% | |
| Response Time Grey 50% / Grey 80% * (ms) | 24 ? | 43.2 ? -80% | 43 ? -79% | 41 ? -71% | 9.6 ? 60% |
| Response Time Black / White * (ms) | 8.4 ? | 31.2 ? -271% | 24 ? -186% | 34 ? -305% | 7.2 ? 14% |
| PWM Frequency (Hz) | 26040 ? | 21000 ? | 26000 ? | ||
| Screen | 14% | -4% | 6% | 19% | |
| Brightness middle (cd/m²) | 368.5 | 304 -18% | 288 -22% | 322 -13% | 285 -23% |
| Brightness (cd/m²) | 341 | 289 -15% | 275 -19% | 297 -13% | 273 -20% |
| Brightness Distribution (%) | 87 | 86 -1% | 86 -1% | 86 -1% | 84 -3% |
| Black Level * (cd/m²) | 0.34 | 0.26 24% | 0.36 -6% | 0.31 9% | 0.23 32% |
| Contrast (:1) | 1084 | 1169 8% | 800 -26% | 1039 -4% | 1239 14% |
| Colorchecker dE 2000 * | 8.91 | 3.46 61% | 5.29 41% | 4.73 47% | 3.52 60% |
| Colorchecker dE 2000 max. * | 14.39 | 7.72 46% | 9.97 31% | 12.37 14% | 5.18 64% |
| Colorchecker dE 2000 calibrated * | 2.87 | ||||
| Greyscale dE 2000 * | 12 | 2.46 79% | 4.5 62% | 2.99 75% | 3.41 72% |
| Gamma | 1.825 121% | 2.38 92% | 2.39 92% | 2.32 95% | 2.05 107% |
| CCT | 11519 56% | 6915 94% | 6839 95% | 6905 94% | 7077 92% |
| Color Space (Percent of AdobeRGB 1998) (%) | 85.94 | 59 -31% | 37 -57% | 56 -35% | 77 -10% |
| Color Space (Percent of sRGB) (%) | 99.98 | 91 -9% | 57 -43% | 85 -15% | 100 0% |
| Média Total (Programa/Configurações) | -61% /
-18% | -63% /
-31% | -69% /
-26% | 19% /
17% |
* ... menor é melhor
Exibir tempos de resposta
| ↔ Tempo de resposta preto para branco | ||
|---|---|---|
| 8.4 ms ... ascensão ↗ e queda ↘ combinadas | ↗ 6 ms ascensão | 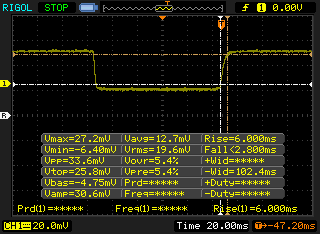 |
| ↘ 2.4 ms queda | ||
| A tela mostra taxas de resposta rápidas em nossos testes e deve ser adequada para jogos. Em comparação, todos os dispositivos testados variam de 0.1 (mínimo) a 240 (máximo) ms. » 24 % de todos os dispositivos são melhores. Isso significa que o tempo de resposta medido é melhor que a média de todos os dispositivos testados (19.8 ms). | ||
| ↔ Tempo de resposta 50% cinza a 80% cinza | ||
| 24 ms ... ascensão ↗ e queda ↘ combinadas | ↗ 12.8 ms ascensão | 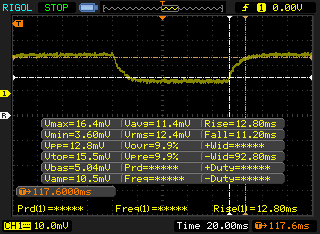 |
| ↘ 11.2 ms queda | ||
| A tela mostra boas taxas de resposta em nossos testes, mas pode ser muito lenta para jogadores competitivos. Em comparação, todos os dispositivos testados variam de 0.165 (mínimo) a 636 (máximo) ms. » 35 % de todos os dispositivos são melhores. Isso significa que o tempo de resposta medido é melhor que a média de todos os dispositivos testados (31 ms). | ||
Cintilação da tela / PWM (modulação por largura de pulso)
| Tela tremeluzindo/PWM detectado | 26040 Hz | ≤ 19 % configuração de brilho | 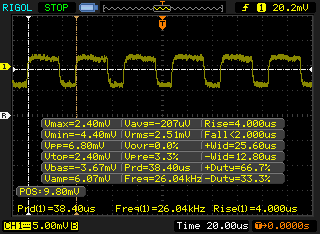 |
A luz de fundo da tela pisca em 26040 Hz (pior caso, por exemplo, utilizando PWM) Cintilação detectada em uma configuração de brilho de 19 % e abaixo. Não deve haver cintilação ou PWM acima desta configuração de brilho. A frequência de 26040 Hz é bastante alta, então a maioria dos usuários sensíveis ao PWM não deve notar nenhuma oscilação. [pwm_comparison] Em comparação: 52 % de todos os dispositivos testados não usam PWM para escurecer a tela. Se PWM foi detectado, uma média de 7754 (mínimo: 5 - máximo: 343500) Hz foi medida. | |||

| PCMark 8 Home Score Accelerated v2 | 4415 pontos | |
| PCMark 8 Creative Score Accelerated v2 | 5336 pontos | |
| PCMark 8 Work Score Accelerated v2 | 5354 pontos | |
Ajuda | ||
| MSI GP63 Leopard 8RE-013US Samsung PM871b MZNLN128HAHQ | Gigabyte Aero 15X Samsung SM961 MZVKW512HMJP m.2 PCI-e | Eurocom Q6 Samsung SSD 960 Pro 512 GB m.2 | MSI GE63VR 7RF Raider Toshiba HG6 THNSNJ256G8NY | Dell Inspiron 15 7000 7577 Samsung PM961 MZVLW256HEHP | |
|---|---|---|---|---|---|
| AS SSD | 259% | 282% | 16% | 145% | |
| Copy Game MB/s (MB/s) | 220.7 | 933 323% | 633 187% | 382.5 73% | |
| Copy Program MB/s (MB/s) | 328.1 | 323.8 -1% | 363.4 11% | 274.8 -16% | |
| Copy ISO MB/s (MB/s) | 690 | 1851 168% | 1768 156% | 814 18% | |
| Score Total (Points) | 742 | 3570 381% | 3894 425% | 930 25% | 2405 224% |
| Score Write (Points) | 245 | 1333 444% | 1693 591% | 293 20% | 594 142% |
| Score Read (Points) | 325 | 1522 368% | 1477 354% | 420 29% | 1241 282% |
| Access Time Write * (ms) | 0.072 | 0.033 54% | 0.039 46% | 0.045 37% | 0.037 49% |
| Access Time Read * (ms) | 0.155 | 0.068 56% | 0.049 68% | 0.168 -8% | 0.058 63% |
| 4K-64 Write (MB/s) | 137.8 | 1106 703% | 1403 918% | 170.6 24% | 375.8 173% |
| 4K-64 Read (MB/s) | 253 | 1225 384% | 1195 372% | 350.3 38% | 929 267% |
| 4K Write (MB/s) | 60.8 | 113.8 87% | 96.2 58% | 77.3 27% | 100.2 65% |
| 4K Read (MB/s) | 21.88 | 46.56 113% | 29.62 35% | 19.55 -11% | 46.95 115% |
| Seq Write (MB/s) | 462.9 | 1124 143% | 1943 320% | 447 -3% | 1181 155% |
| Seq Read (MB/s) | 504 | 2508 398% | 2523 401% | 506 0% | 2652 426% |
* ... menor é melhor

| 3DMark 11 Performance | 14174 pontos | |
| 3DMark Cloud Gate Standard Score | 32310 pontos | |
| 3DMark Fire Strike Score | 10722 pontos | |
| 3DMark Fire Strike Extreme Score | 5536 pontos | |
Ajuda | ||
| The Witcher 3 | |
| 1366x768 Medium Graphics & Postprocessing | |
| Eurocom Q6 | |
| MSI GP63 Leopard 8RE-013US | |
| Asus GL702ZC-GC104T | |
| HP Omen 15-ce002ng | |
| Lenovo Legion Y720 80VR002XGE | |
| 1920x1080 High Graphics & Postprocessing (Nvidia HairWorks Off) | |
| Eurocom Q6 | |
| Gigabyte Aero 15X v8 | |
| Dell Inspiron 15 7000 7577 | |
| MSI GP63 Leopard 8RE-013US | |
| Asus GL702ZC-GC104T | |
| Lenovo Legion Y720 80VR002XGE | |
| HP Omen 15-ce002ng | |
| 1920x1080 Ultra Graphics & Postprocessing (HBAO+) | |
| MSI GE63VR 7RF Raider | |
| Gigabyte Aero 15X v8 | |
| Eurocom Q6 | |
| MSI GP63 Leopard 8RE-013US | |
| Asus Strix GL703VM-DB74 | |
| Asus GL702ZC-GC104T | |
| Lenovo Legion Y720 80VR002XGE | |
| Dell Inspiron 15 7000 7577 | |
| HP Omen 15-ce002ng | |
| Rise of the Tomb Raider | |
| 1366x768 Medium Preset AF:2x | |
| Eurocom Q6 | |
| MSI GP63 Leopard 8RE-013US | |
| HP Omen 15-ce002ng | |
| Asus GL702ZC-GC104T | |
| MSI GP62 7REX-1045US | |
| 1920x1080 High Preset AA:FX AF:4x | |
| MSI GE63VR 7RF Raider | |
| Eurocom Q6 | |
| MSI GP63 Leopard 8RE-013US | |
| Dell Inspiron 15 7000 7577 | |
| HP Omen 15-ce002ng | |
| Asus GL702ZC-GC104T | |
| MSI GP62 7REX-1045US | |
| 1920x1080 Very High Preset AA:FX AF:16x | |
| MSI GE63VR 7RF Raider | |
| Eurocom Q6 | |
| MSI GP63 Leopard 8RE-013US | |
| Asus Strix GL703VM-DB74 | |
| Dell Inspiron 15 7000 7577 | |
| Asus GL702ZC-GC104T | |
| HP Omen 15-ce002ng | |
| MSI GP62 7REX-1045US | |
| BioShock Infinite | |
| 1366x768 Medium Preset | |
| Eurocom Q6 | |
| MSI GP63 Leopard 8RE-013US | |
| Lenovo Legion Y720 80VR002XGE | |
| MSI GP62 7REX-1045US | |
| 1366x768 High Preset | |
| Eurocom Q6 | |
| MSI GP63 Leopard 8RE-013US | |
| Lenovo Legion Y720 80VR002XGE | |
| MSI GP62 7REX-1045US | |
| 1920x1080 Ultra Preset, DX11 (DDOF) | |
| Eurocom Q6 | |
| MSI GP63 Leopard 8RE-013US | |
| Asus Strix GL703VM-DB74 | |
| Lenovo Legion Y720 80VR002XGE | |
| Dell Inspiron 15 7000 7577 | |
| MSI GP62 7REX-1045US | |
| baixo | média | alto | ultra | |
|---|---|---|---|---|
| BioShock Infinite (2013) | 272.4 | 233.2 | 225.4 | 115.4 |
| The Witcher 3 (2015) | 197.4 | 138.7 | 68.5 | 42.3 |
| Rise of the Tomb Raider (2016) | 180.3 | 138.2 | 77.3 | 66.6 |
Barulho
| Ocioso |
| 32.8 / 32.8 / 33 dB |
| Carga |
| 35.8 / 52.3 dB |
 | ||
30 dB silencioso 40 dB(A) audível 50 dB(A) ruidosamente alto |
||
min: | ||
| MSI GP63 Leopard 8RE-013US GeForce GTX 1060 Mobile, i7-8750H, Samsung PM871b MZNLN128HAHQ | HP Omen 15-ce002ng GeForce GTX 1060 Max-Q, i7-7700HQ, Samsung PM961 MZVLW256HEHP | Lenovo Legion Y720 80VR002XGE GeForce GTX 1060 Mobile, i7-7700HQ, Samsung PM961 MZVLW256HEHP | Acer Aspire VN7-593G-73HP V15 Nitro BE GeForce GTX 1060 Mobile, i7-7700HQ, Seagate Mobile HDD 1TB ST1000LM035 | Asus Strix GL703VM-DB74 GeForce GTX 1060 Mobile, i7-7700HQ, Seagate Mobile HDD 1TB ST1000LX015-1U7172 | |
|---|---|---|---|---|---|
| Noise | -0% | 6% | 3% | 2% | |
| desligado / ambiente * (dB) | 28.4 | 30 -6% | 30.3 -7% | 30.4 -7% | 28.4 -0% |
| Idle Minimum * (dB) | 32.8 | 30 9% | 31 5% | 30.9 6% | 30.2 8% |
| Idle Average * (dB) | 32.8 | 33 -1% | 30.9 6% | 30.9 6% | 30.2 8% |
| Idle Maximum * (dB) | 33 | 37 -12% | 31.5 5% | 31.5 5% | 30.2 8% |
| Load Average * (dB) | 35.8 | 41 -15% | 38.7 -8% | 40.7 -14% | 38.4 -7% |
| Witcher 3 ultra * (dB) | 51 | 42 18% | 42 18% | 45.5 11% | 49.7 3% |
| Load Maximum * (dB) | 52.3 | 50 4% | 41.9 20% | 43.9 16% | 54.5 -4% |
* ... menor é melhor
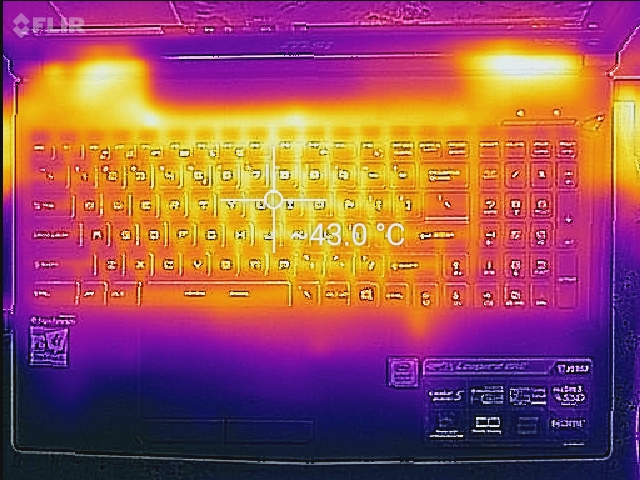
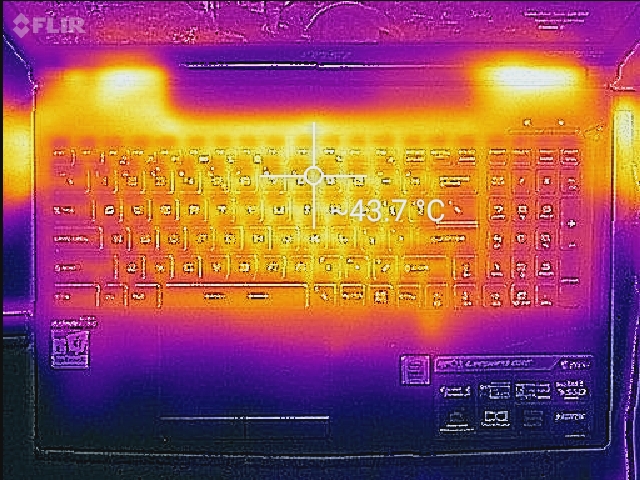
(±) A temperatura máxima no lado superior é 42.2 °C / 108 F, em comparação com a média de 40.4 °C / 105 F , variando de 21.2 a 68.8 °C para a classe Gaming.
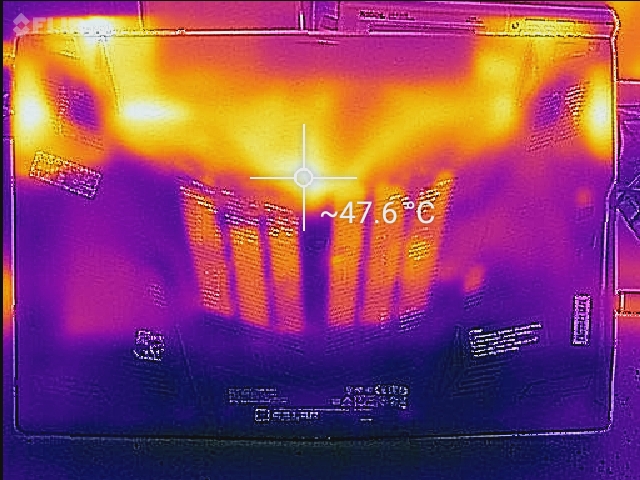
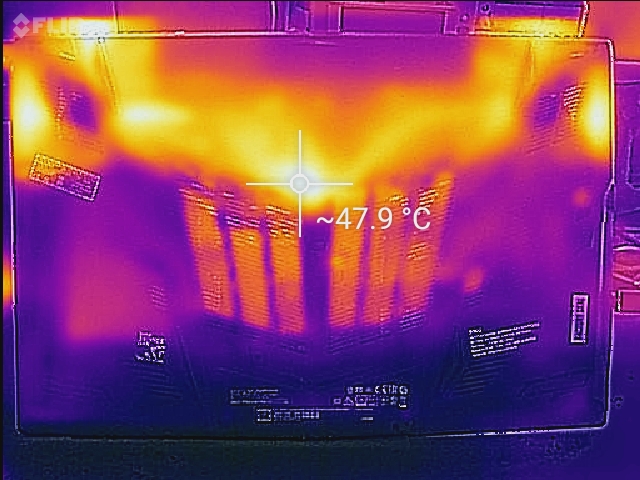
(-) A parte inferior aquece até um máximo de 47.8 °C / 118 F, em comparação com a média de 43.2 °C / 110 F
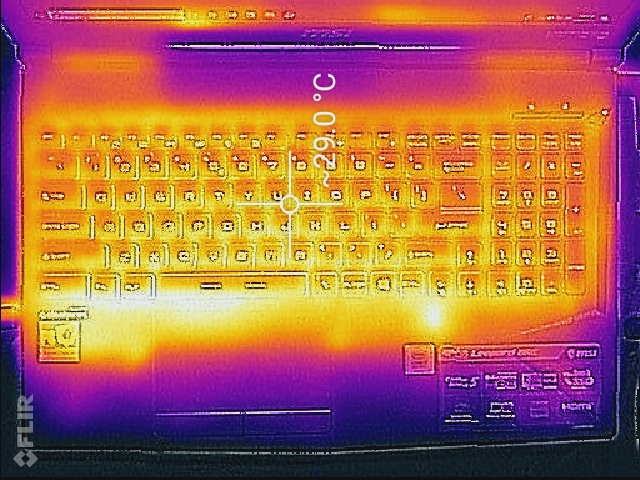
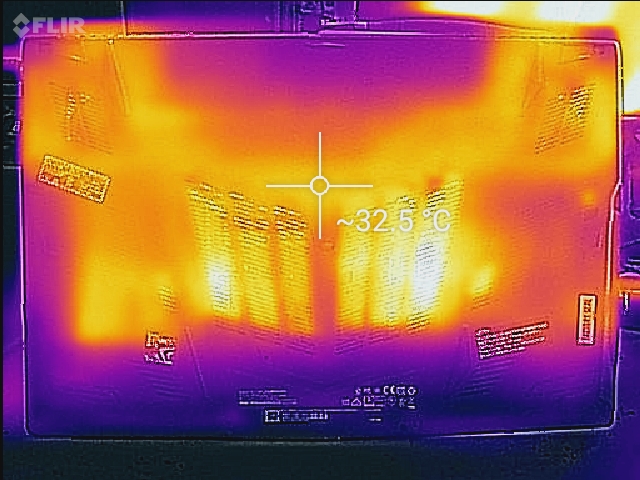
(+) Em uso inativo, a temperatura média para o lado superior é 25.9 °C / 79 F, em comparação com a média do dispositivo de 33.9 °C / ### class_avg_f### F.
(±) Jogando The Witcher 3, a temperatura média para o lado superior é 34.7 °C / 94 F, em comparação com a média do dispositivo de 33.9 °C / ## #class_avg_f### F.
(+) Os apoios para as mãos e o touchpad são mais frios que a temperatura da pele, com um máximo de 29.6 °C / 85.3 F e, portanto, são frios ao toque.
(±) A temperatura média da área do apoio para as mãos de dispositivos semelhantes foi 28.8 °C / 83.8 F (-0.8 °C / -1.5 F).
MSI GP63 Leopard 8RE-013US análise de áudio
(±) | o volume do alto-falante é médio, mas bom (###valor### dB)
Graves 100 - 315Hz
(-) | quase nenhum baixo - em média 23.1% menor que a mediana
(±) | a linearidade dos graves é média (10.6% delta para a frequência anterior)
Médios 400 - 2.000 Hz
(+) | médios equilibrados - apenas 3% longe da mediana
(±) | a linearidade dos médios é média (7.1% delta para frequência anterior)
Altos 2 - 16 kHz
(±) | máximos mais altos - em média 5.8% maior que a mediana
(+) | os máximos são lineares (6% delta da frequência anterior)
Geral 100 - 16.000 Hz
(±) | a linearidade do som geral é média (21.2% diferença em relação à mediana)
Comparado com a mesma classe
» 76% de todos os dispositivos testados nesta classe foram melhores, 4% semelhantes, 19% piores
» O melhor teve um delta de 6%, a média foi 18%, o pior foi 132%
Comparado com todos os dispositivos testados
» 59% de todos os dispositivos testados foram melhores, 7% semelhantes, 34% piores
» O melhor teve um delta de 4%, a média foi 23%, o pior foi 134%
Apple MacBook 12 (Early 2016) 1.1 GHz análise de áudio
(+) | os alto-falantes podem tocar relativamente alto (###valor### dB)
Graves 100 - 315Hz
(±) | graves reduzidos - em média 11.3% menor que a mediana
(±) | a linearidade dos graves é média (14.2% delta para a frequência anterior)
Médios 400 - 2.000 Hz
(+) | médios equilibrados - apenas 2.4% longe da mediana
(+) | médios são lineares (5.5% delta para frequência anterior)
Altos 2 - 16 kHz
(+) | agudos equilibrados - apenas 2% longe da mediana
(+) | os máximos são lineares (4.5% delta da frequência anterior)
Geral 100 - 16.000 Hz
(+) | o som geral é linear (10.2% diferença em relação à mediana)
Comparado com a mesma classe
» 7% de todos os dispositivos testados nesta classe foram melhores, 2% semelhantes, 90% piores
» O melhor teve um delta de 5%, a média foi 18%, o pior foi 53%
Comparado com todos os dispositivos testados
» 5% de todos os dispositivos testados foram melhores, 1% semelhantes, 94% piores
» O melhor teve um delta de 4%, a média foi 23%, o pior foi 134%
| desligado | |
| Ocioso | |
| Carga |
|
Key:
min: | |
| MSI GP63 Leopard 8RE-013US i7-8750H, GeForce GTX 1060 Mobile, Samsung PM871b MZNLN128HAHQ, TN LED, 120 Hz, 1920x1080, 15.6" | HP Omen 15-ce002ng i7-7700HQ, GeForce GTX 1060 Max-Q, Samsung PM961 MZVLW256HEHP, IPS, 1920x1080, 15.6" | Lenovo Legion Y720 80VR002XGE i7-7700HQ, GeForce GTX 1060 Mobile, Samsung PM961 MZVLW256HEHP, IPS, 1920x1080, 15.6" | Dell Inspiron 15 7000 7577 i5-7300HQ, GeForce GTX 1060 Max-Q, Samsung PM961 MZVLW256HEHP, IPS, 1920x1080, 15.6" | MSI GP62 7REX-1045US i7-7700HQ, GeForce GTX 1050 Ti Mobile, Toshiba NVMe THNSN5128GP, TN LED, 1920x1080, 15.6" | |
|---|---|---|---|---|---|
| Power Consumption | -46% | 17% | 34% | -14% | |
| Idle Minimum * (Watt) | 7.99 | 18 -125% | 8 -0% | 7.1 11% | 14.6 -83% |
| Idle Average * (Watt) | 12.15 | 23 -89% | 10.9 10% | 7.6 37% | 17.2 -42% |
| Idle Maximum * (Watt) | 13.4 | 30 -124% | 11.8 12% | 8.6 36% | 17.3 -29% |
| Load Average * (Watt) | 103.62 | 85 18% | 70 32% | 59.5 43% | 82.7 20% |
| Witcher 3 ultra * (Watt) | 156.1 | 96 39% | 102 35% | 89 43% | 107 31% |
| Load Maximum * (Watt) | 164.29 | 158 4% | 148 10% | 112.8 31% | 136.7 17% |
* ... menor é melhor
| MSI GP63 Leopard 8RE-013US i7-8750H, GeForce GTX 1060 Mobile, 51 Wh | HP Omen 15-ce002ng i7-7700HQ, GeForce GTX 1060 Max-Q, 70 Wh | Lenovo Legion Y720 80VR002XGE i7-7700HQ, GeForce GTX 1060 Mobile, 60 Wh | Acer Aspire VN7-593G-73HP V15 Nitro BE i7-7700HQ, GeForce GTX 1060 Mobile, 69 Wh | MSI GP62 7REX-1045US i7-7700HQ, GeForce GTX 1050 Ti Mobile, 41 Wh | Dell Inspiron 15 7000 7577 i5-7300HQ, GeForce GTX 1060 Max-Q, 56 Wh | |
|---|---|---|---|---|---|---|
| Duração da bateria | -10% | 40% | 68% | -35% | 56% | |
| Reader / Idle (h) | 7.5 | 4.3 -43% | 11.8 57% | 8.4 12% | 4.3 -43% | 11 47% |
| WiFi v1.3 (h) | 4.8 | 3.3 -31% | 6.3 31% | 6 25% | 2.9 -40% | 6.9 44% |
| Load (h) | 0.9 | 1.3 44% | 1.2 33% | 2.4 167% | 0.7 -22% | 1.6 78% |
Pro
Contra

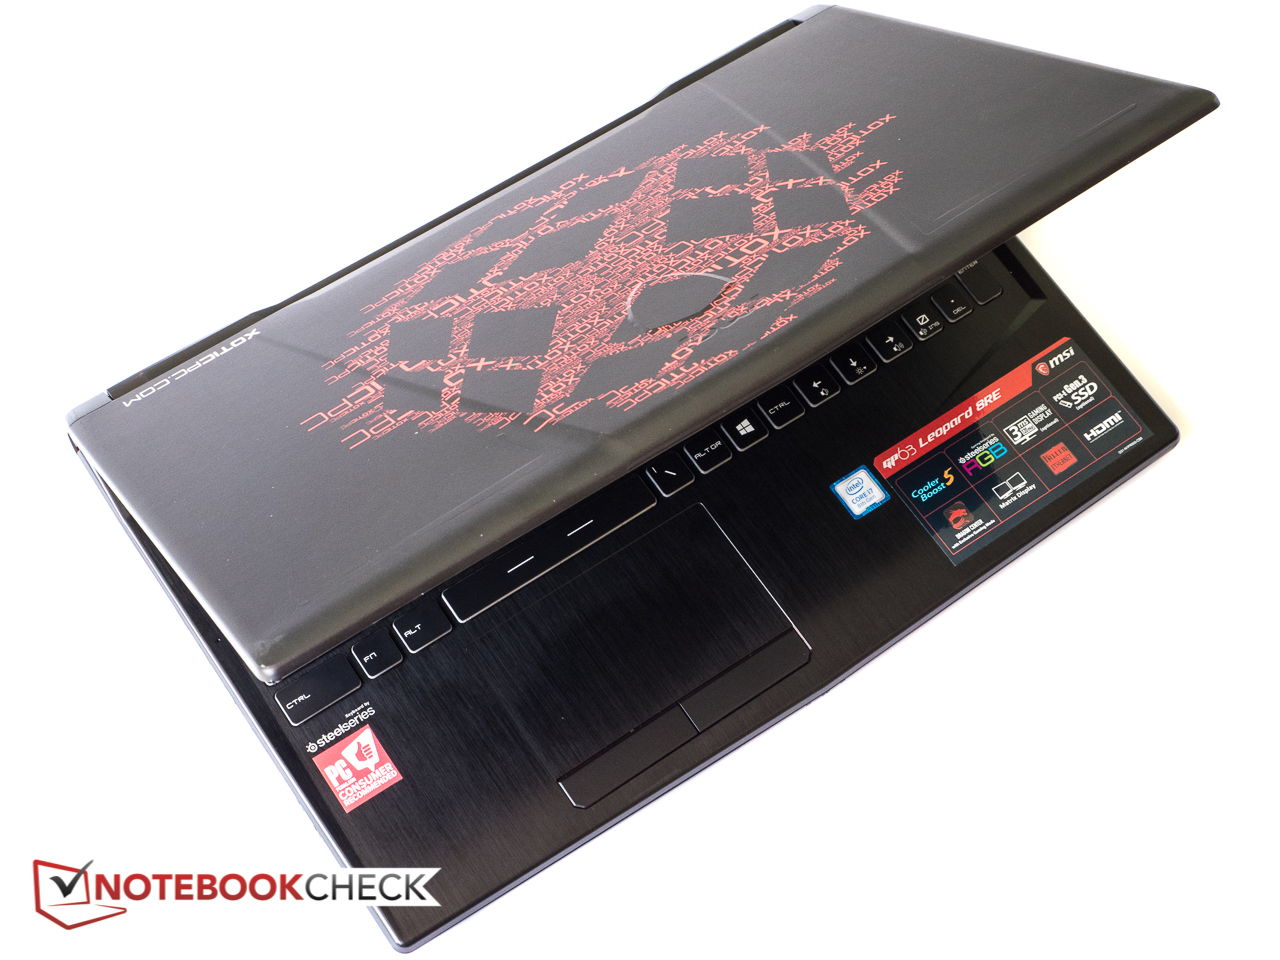
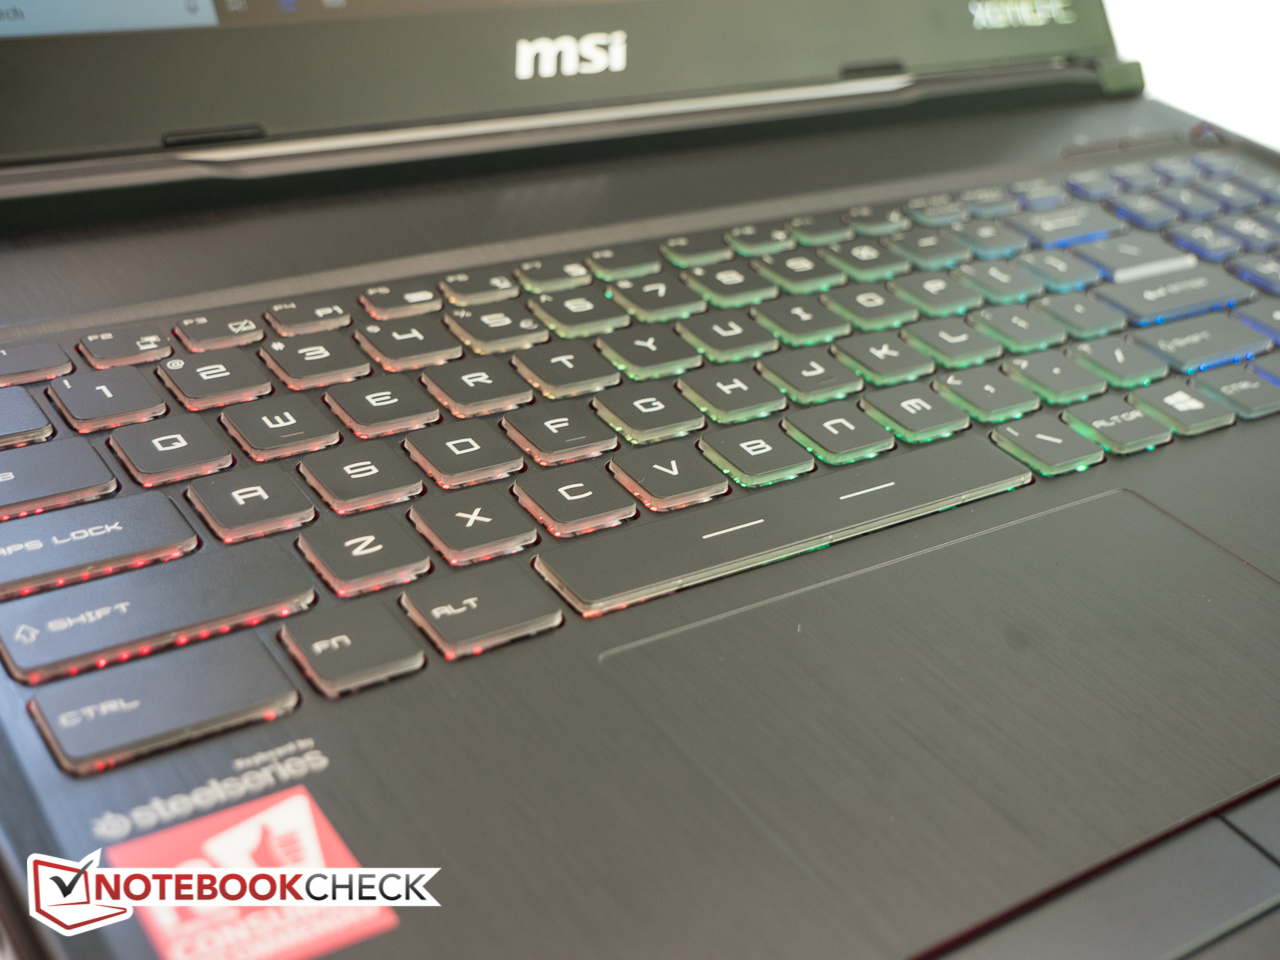
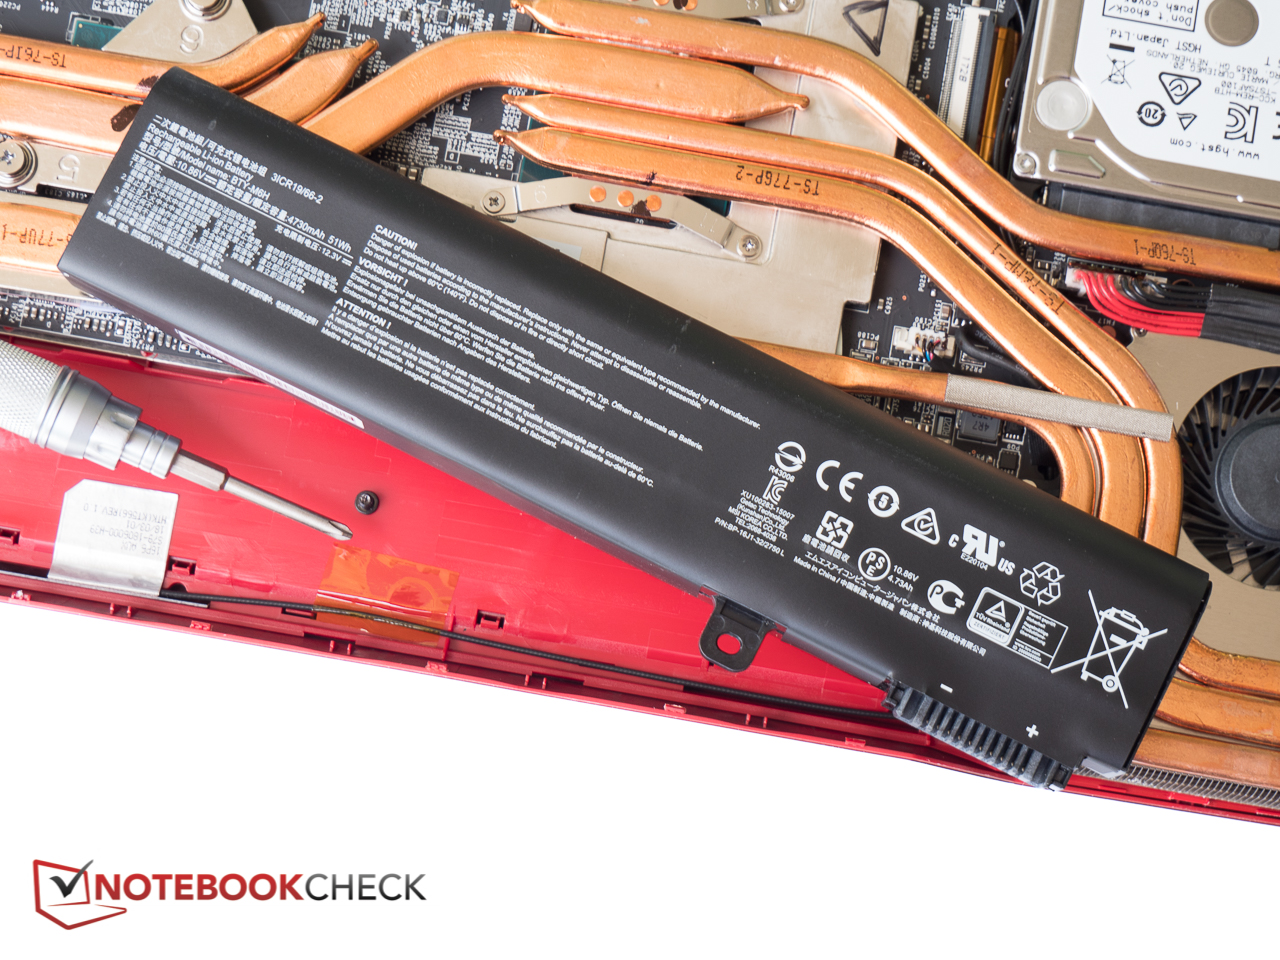
O MSI GP63 Leopard Xotic PC Edition assume onde o predecessor GP62 parou. A qualidade do chassi ainda não é tão impressionante, mas o hardware atualizado na forma do CPU hexa-core Coffee Lake-H e uma placa gráfica GTX 1060 ligeiramente superior garantem um aumento significativo no desempenho e uma experiência de jogo mais agradável. Também apreciamos a porta USB 3.0 adicional em vez da unidade DVD+/-RW integrada anteriormente. O teclado RGB retro iluminado de três zonas é um prazer de usar e o touchpad faz bem o seu trabalho. A tela TN de 120 Hz é brilhante com ângulos de visão ainda aceitáveis e - pelo menos após uma calibração - precisão decente de cores e tons de cinza. A capacidade da bateria também foi aumentada, de modo que a máquina possa servir também para tarefas limitadas como um portátil poli funcional.
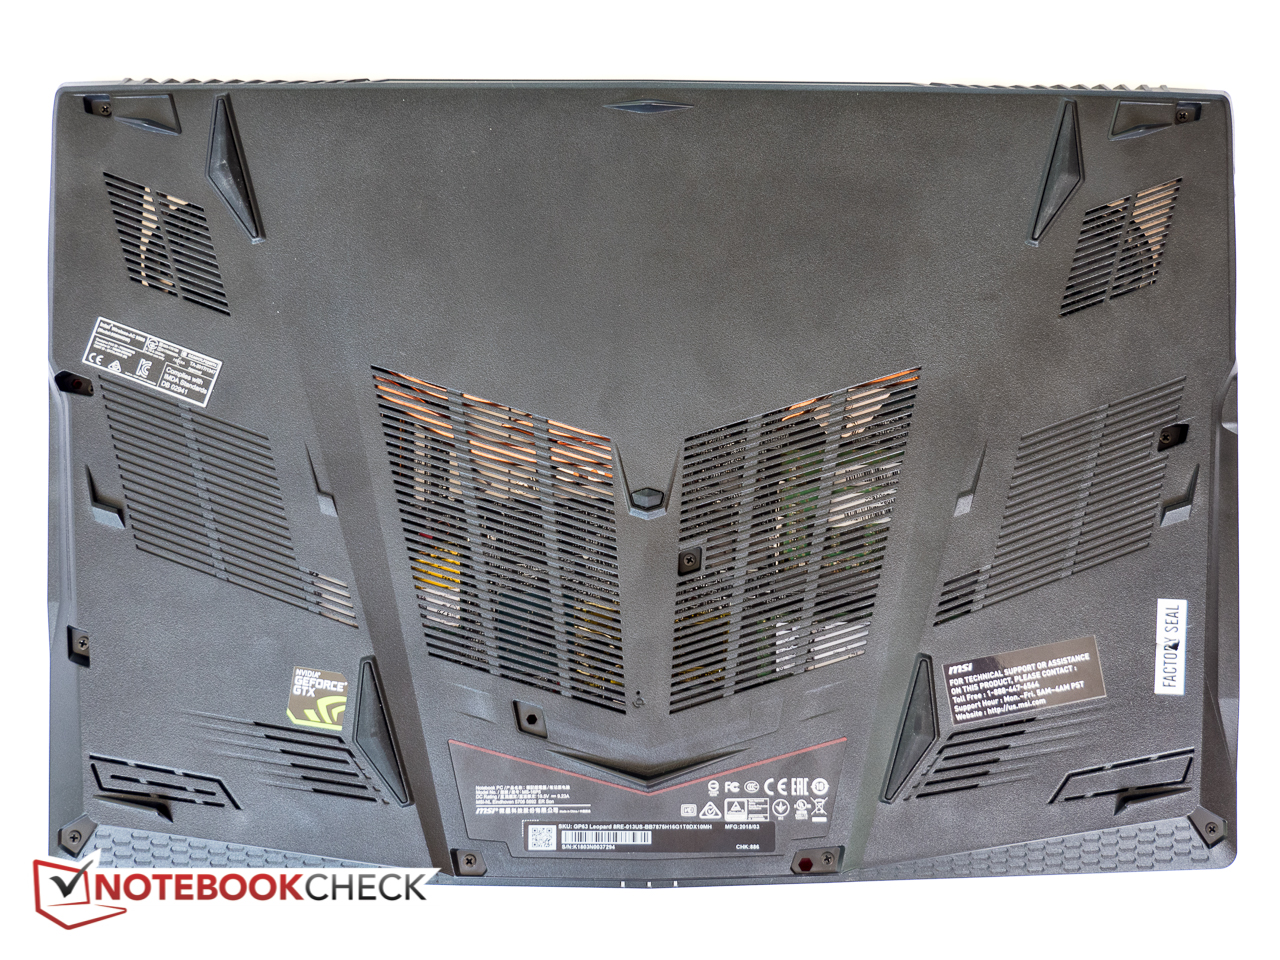
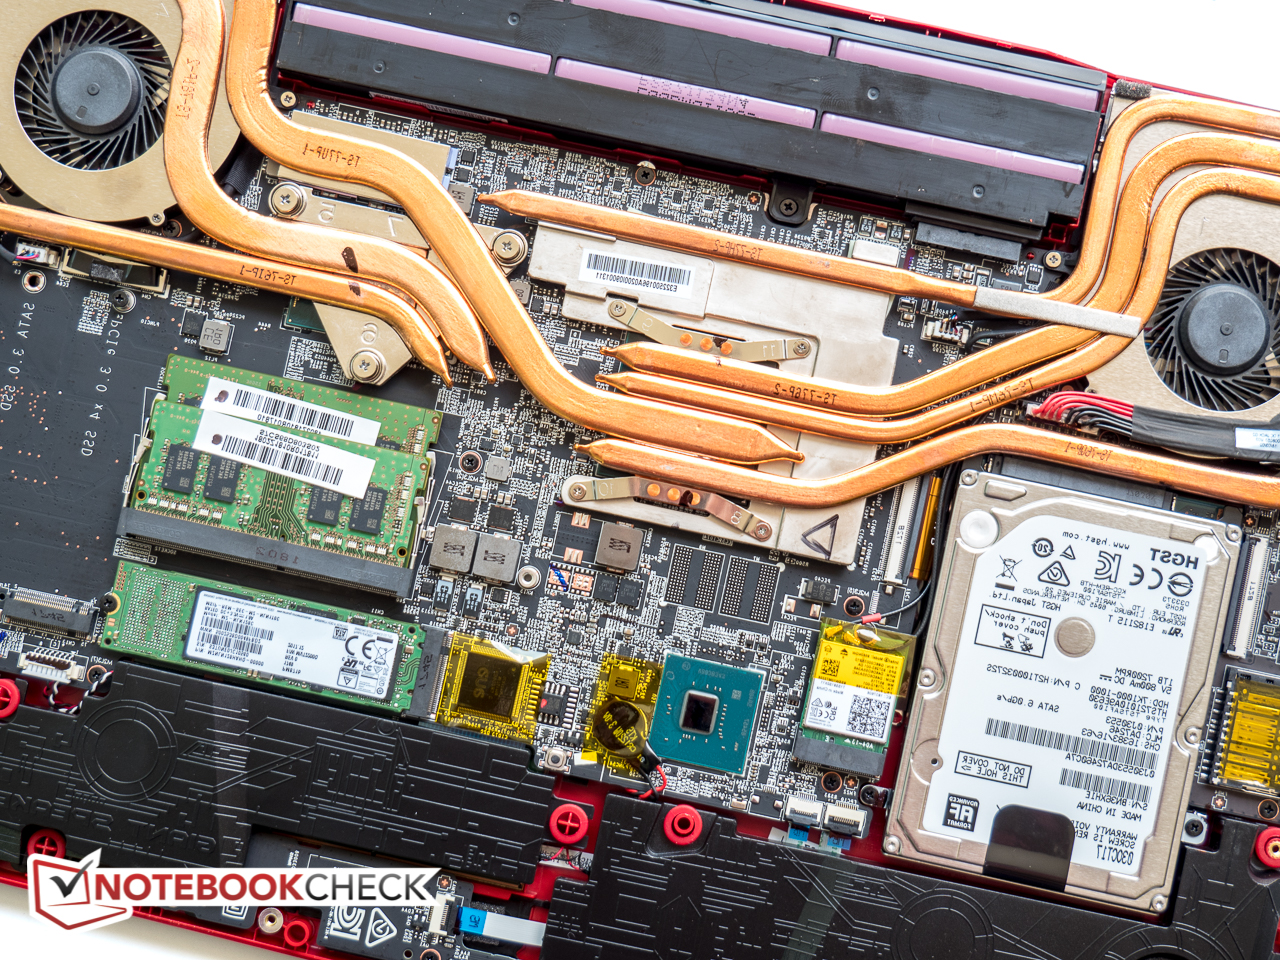
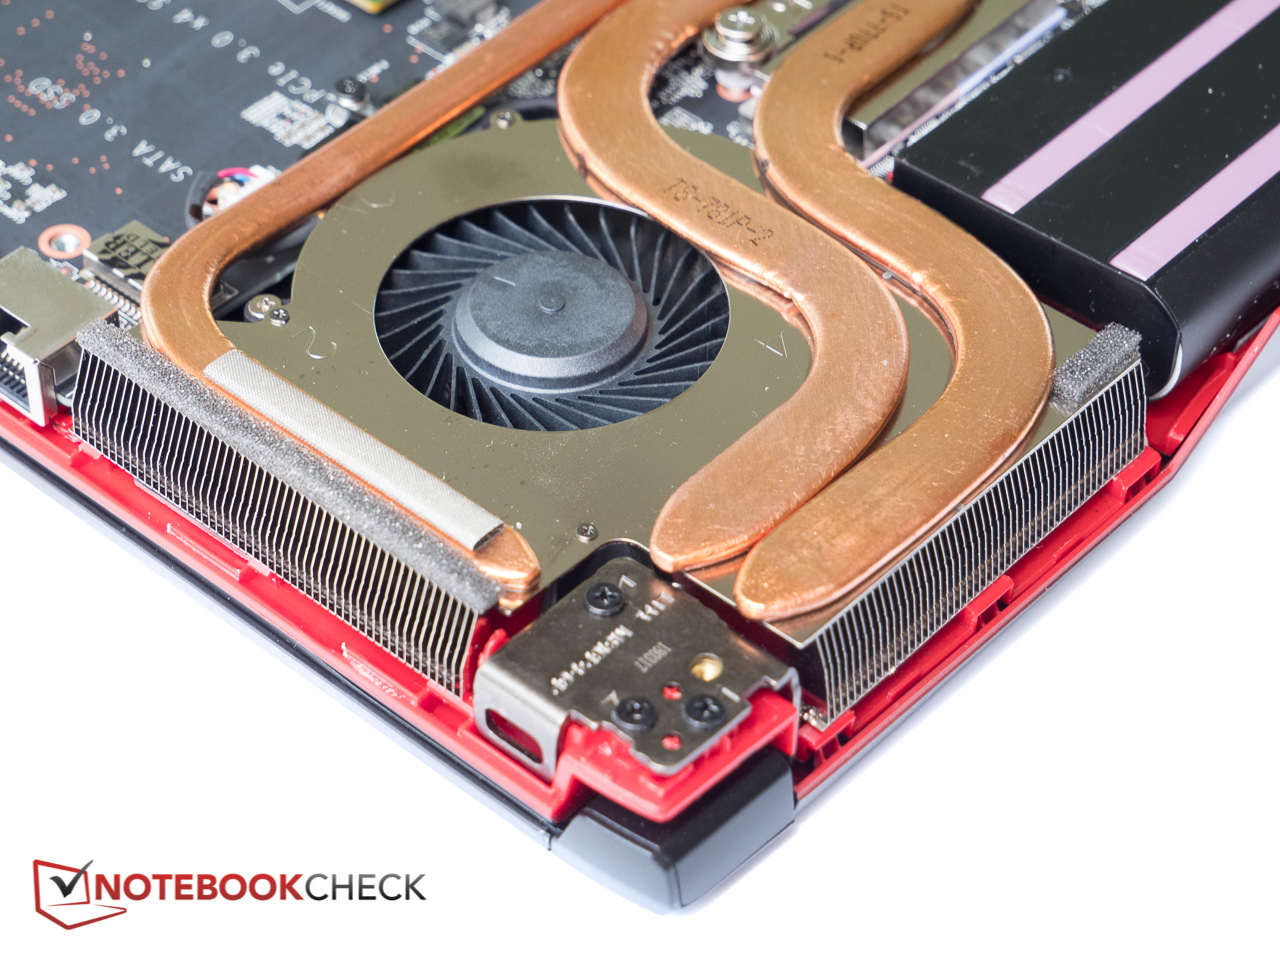
O gerenciamento térmico da MSI permanece bastante conservador apesar do sistema de resfriamento atualizado e muito melhorado, que agora possui sete tubos de calor em vez de seis. Embora as temperaturas do processador permaneçam geralmente mais baixas do que poderíamos esperar, o poder de processamento bruto também é atingido. Acreditamos que um SSD primário de 128 GB é o mínimo nos dias de hoje e, se tivermos a opção, provavelmente faremos o upgrade para um SSD PCIe NVMe maior e mais rápido de 256 GB. Apesar da tela de 120 Hz, o G-Sync não está disponível.
O MSI GP63 Leopard Xotic PC Edition é um portátil de jogos bem comportado com desempenho perfeitamente adequado - mas não é oferecido a preço de banana.
MSI GP63 Leopard 8RE-013US
- 06/13/2018 v6 (old)
Bernie Pechlaner
Price comparison
