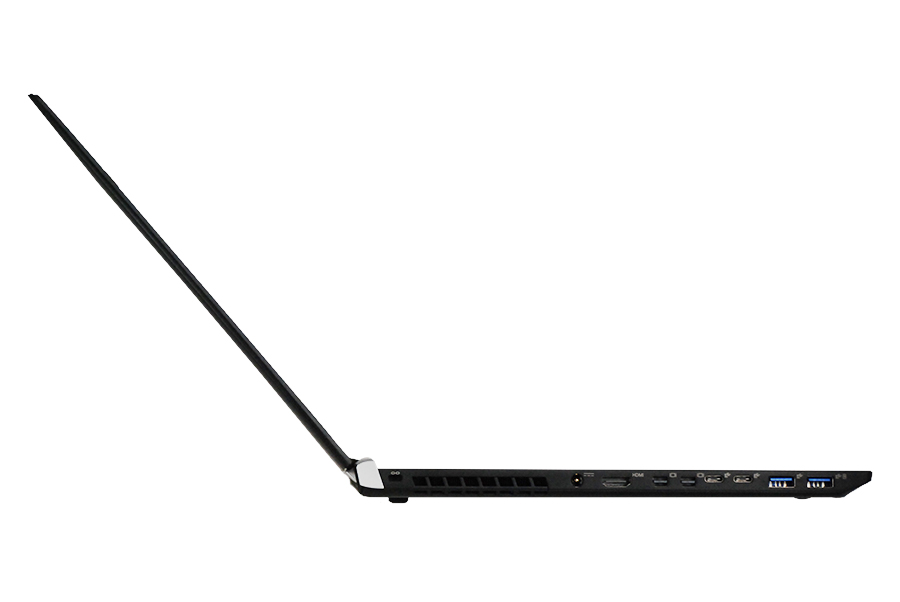
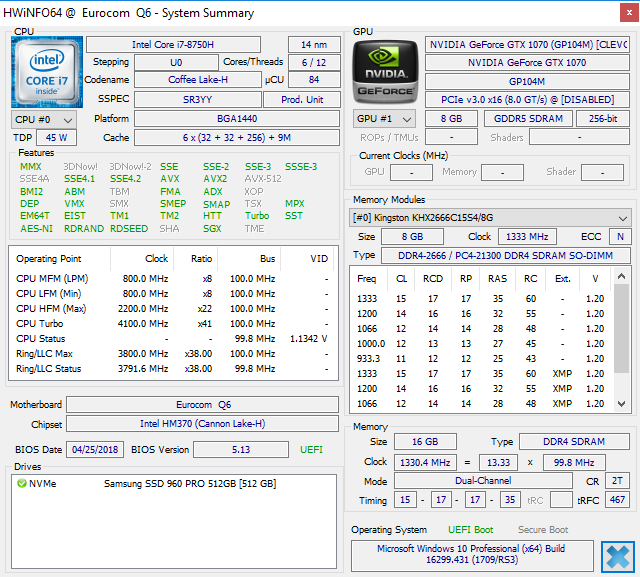
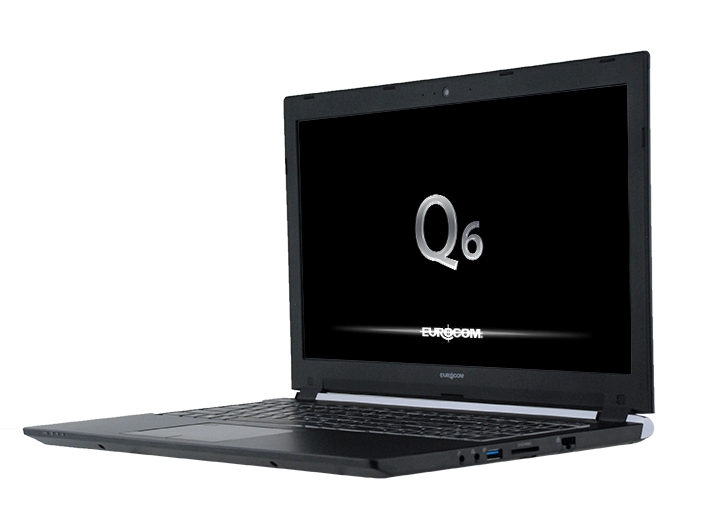
Breve Análise do Portátil Eurocom Q6 (i7-8750H, GTX 1070 Max-Q, FHD)
| SD Card Reader | |
| average JPG Copy Test (av. of 3 runs) | |
| Aorus X5 v8 (Toshiba Exceria Pro SDXC 64 GB UHS-II) | |
| Gigabyte Aero 15X v8 (Toshiba Exceria Pro SDXC 64 GB UHS-II) | |
| Eurocom Q6 (Toshiba Exceria Pro SDXC 64 GB UHS-II) | |
| maximum AS SSD Seq Read Test (1GB) | |
| Gigabyte Aero 15X v8 (Toshiba Exceria Pro SDXC 64 GB UHS-II) | |
| Aorus X5 v8 (Toshiba Exceria Pro SDXC 64 GB UHS-II) | |
| Eurocom Q6 (Toshiba Exceria Pro SDXC 64 GB UHS-II) | |
| Networking | |
| iperf3 transmit AX12 | |
| MSI GS65 8RF-019DE Stealth Thin | |
| Eurocom Q6 | |
| Aorus X5 v8 | |
| iperf3 receive AX12 | |
| Aorus X5 v8 | |
| MSI GS65 8RF-019DE Stealth Thin | |
| Eurocom Q6 | |
| |||||||||||||||||||||||||
iluminação: 88 %
iluminação com acumulador: 326.6 cd/m²
Contraste: 778:1 (Preto: 0.42 cd/m²)
ΔE ColorChecker Calman: 2.54 | ∀{0.5-29.43 Ø4.71}
calibrated: 1.63
ΔE Greyscale Calman: 1.9 | ∀{0.09-98 Ø4.96}
94.5% sRGB (Argyll 1.6.3 3D)
60.9% AdobeRGB 1998 (Argyll 1.6.3 3D)
66.2% AdobeRGB 1998 (Argyll 3D)
94.4% sRGB (Argyll 3D)
65.1% Display P3 (Argyll 3D)
Gamma: 2.14
CCT: 6562 K
| Eurocom Q6 LG Philips LGD05C0, IPS, 15.6", 1920x1080 | Eurocom Q5 ID: LGD04D4, Name: LG Philips LP156UD1-SPB1, IPS, 15.6", 3840x2160 | Aorus X5 v8 AU Optronics B156HAN07.0 (AUO70ED), IPS, 15.6", 1920x1080 | Apple MacBook Pro 15 2017 (2.9 GHz, 560) 15.4", 2880x1800 | MSI GS65 8RF-019DE Stealth Thin AU Optronics B156HAN08.0 (AUO80ED), IPS, 15.6", 1920x1080 | Gigabyte Aero 15X v8 LGD05C0, IPS, 15.6", 1920x1080 | |
|---|---|---|---|---|---|---|
| Display | -3% | 2% | 1% | -2% | ||
| Display P3 Coverage (%) | 65.1 | 63 -3% | 67.1 3% | 66.2 2% | 63.6 -2% | |
| sRGB Coverage (%) | 94.4 | 92.7 -2% | 93.4 -1% | 92.1 -2% | 93.8 -1% | |
| AdobeRGB 1998 Coverage (%) | 66.2 | 64.4 -3% | 68.1 3% | 67.2 2% | 64.9 -2% | |
| Response Times | -145% | -20% | -174% | -20% | -10% | |
| Response Time Grey 50% / Grey 80% * (ms) | 15.2 ? | 32.4 ? -113% | 18.8 ? -24% | 42.4 ? -179% | 17.6 ? -16% | 16.8 ? -11% |
| Response Time Black / White * (ms) | 10.4 ? | 28.8 ? -177% | 12 ? -15% | 28 ? -169% | 12.8 ? -23% | 11.2 ? -8% |
| PWM Frequency (Hz) | ||||||
| Screen | -44% | 13% | 33% | 6% | 19% | |
| Brightness middle (cd/m²) | 326.6 | 287.5 -12% | 271 -17% | 534 64% | 254 -22% | 313 -4% |
| Brightness (cd/m²) | 312 | 279 -11% | 259 -17% | 502 61% | 262 -16% | 300 -4% |
| Brightness Distribution (%) | 88 | 87 -1% | 87 -1% | 86 -2% | 89 1% | 78 -11% |
| Black Level * (cd/m²) | 0.42 | 0.65 -55% | 0.27 36% | 0.31 26% | 0.22 48% | 0.33 21% |
| Contrast (:1) | 778 | 442 -43% | 1004 29% | 1723 121% | 1155 48% | 948 22% |
| Colorchecker dE 2000 * | 2.54 | 4.5 -77% | 1.81 29% | 1.8 29% | 2.37 7% | 1.29 49% |
| Colorchecker dE 2000 max. * | 4.7 | 8.9 -89% | 3.33 29% | 3.8 19% | 4.71 -0% | 2.04 57% |
| Colorchecker dE 2000 calibrated * | 1.63 | 1.84 -13% | ||||
| Greyscale dE 2000 * | 1.9 | 4.6 -142% | 1.09 43% | 2.4 -26% | 1.58 17% | 0.69 64% |
| Gamma | 2.14 103% | 2.39 92% | 2.45 90% | 2.27 97% | 2.48 89% | 2.43 91% |
| CCT | 6562 99% | 7393 88% | 6435 101% | 6563 99% | 6785 96% | 6550 99% |
| Color Space (Percent of AdobeRGB 1998) (%) | 60.9 | 59 -3% | 61 0% | 77.92 28% | 60 -1% | 60 -1% |
| Color Space (Percent of sRGB) (%) | 94.5 | 92.3 -2% | 93 -2% | 99.94 6% | 92 -3% | 94 -1% |
| Média Total (Programa/Configurações) | -64% /
-49% | -2% /
6% | -71% /
-2% | -4% /
2% | 2% /
11% |
* ... menor é melhor
Exibir tempos de resposta
| ↔ Tempo de resposta preto para branco | ||
|---|---|---|
| 10.4 ms ... ascensão ↗ e queda ↘ combinadas | ↗ 6 ms ascensão | 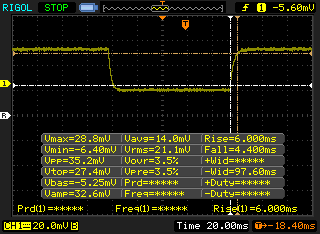 |
| ↘ 4.4 ms queda | ||
| A tela mostra boas taxas de resposta em nossos testes, mas pode ser muito lenta para jogadores competitivos. Em comparação, todos os dispositivos testados variam de 0.1 (mínimo) a 240 (máximo) ms. » 28 % de todos os dispositivos são melhores. Isso significa que o tempo de resposta medido é melhor que a média de todos os dispositivos testados (19.8 ms). | ||
| ↔ Tempo de resposta 50% cinza a 80% cinza | ||
| 15.2 ms ... ascensão ↗ e queda ↘ combinadas | ↗ 8.4 ms ascensão | 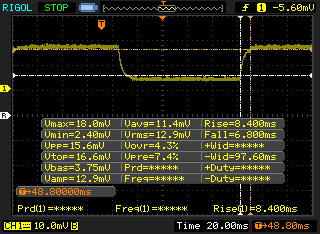 |
| ↘ 6.8 ms queda | ||
| A tela mostra boas taxas de resposta em nossos testes, mas pode ser muito lenta para jogadores competitivos. Em comparação, todos os dispositivos testados variam de 0.165 (mínimo) a 636 (máximo) ms. » 29 % de todos os dispositivos são melhores. Isso significa que o tempo de resposta medido é melhor que a média de todos os dispositivos testados (30.9 ms). | ||
Cintilação da tela / PWM (modulação por largura de pulso)
| Tela tremeluzindo / PWM não detectado |  | ||
[pwm_comparison] Em comparação: 52 % de todos os dispositivos testados não usam PWM para escurecer a tela. Se PWM foi detectado, uma média de 7744 (mínimo: 5 - máximo: 343500) Hz foi medida. | |||
* ... menor é melhor
| PCMark 10 - Score | |
| Eurocom Sky X4C | |
| Aorus X5 v8 | |
| Eurocom Q6 | |
| Eurocom Q5 | |
| MSI GS65 8RF-019DE Stealth Thin | |
| PCMark 8 | |
| Home Score Accelerated v2 | |
| Aorus X5 v8 | |
| Eurocom Sky X4C | |
| MSI GS65 8RF-019DE Stealth Thin | |
| Eurocom Q6 | |
| Eurocom Q5 | |
| Work Score Accelerated v2 | |
| Aorus X5 v8 | |
| Eurocom Q6 | |
| MSI GS65 8RF-019DE Stealth Thin | |
| Eurocom Sky X4C | |
| Eurocom Q5 | |
| PCMark 8 Home Score Accelerated v2 | 4644 pontos | |
| PCMark 8 Work Score Accelerated v2 | 5751 pontos | |
| PCMark 10 Score | 5362 pontos | |
Ajuda | ||
| Eurocom Q6 Samsung SSD 960 Pro 512 GB m.2 | Gigabyte Aero 15X v8 Toshiba NVMe THNSN5512GPU7 | Eurocom Q5 Samsung SSD 960 Pro 512 GB m.2 | Eurocom Sky X4C Samsung SSD 960 Pro 1TB m.2 NVMe | MSI GS65 8RF-019DE Stealth Thin Samsung SSD PM981 MZVLB512HAJQ | |
|---|---|---|---|---|---|
| AS SSD | -39% | 13% | 24% | 2% | |
| Copy Game MB/s (MB/s) | 633 | 682 8% | 1055 67% | ||
| Copy Program MB/s (MB/s) | 363.4 | 301.5 -17% | 467.2 29% | ||
| Copy ISO MB/s (MB/s) | 1768 | 1967 11% | 1908 8% | ||
| Score Total (Points) | 3894 | 2536 -35% | 4001 3% | 4615 19% | 4122 6% |
| Score Write (Points) | 1693 | 939 -45% | 1705 1% | 1703 1% | 2051 21% |
| Score Read (Points) | 1477 | 1092 -26% | 1529 4% | 1945 32% | 1346 -9% |
| Access Time Write * (ms) | 0.039 | 0.046 -18% | 0.028 28% | 0.03 23% | 0.035 10% |
| Access Time Read * (ms) | 0.049 | 0.119 -143% | 0.036 27% | 0.032 35% | 0.073 -49% |
| 4K-64 Write (MB/s) | 1403 | 742 -47% | 1366 -3% | 1375 -2% | 1760 25% |
| 4K-64 Read (MB/s) | 1195 | 847 -29% | 1231 3% | 1646 38% | 1170 -2% |
| 4K Write (MB/s) | 96.2 | 80.4 -16% | 136.2 42% | 129.6 35% | 107.2 11% |
| 4K Read (MB/s) | 29.62 | 23.36 -21% | 49.3 66% | 44.83 51% | 48.94 65% |
| Seq Write (MB/s) | 1943 | 1163 -40% | 2029 4% | 1989 2% | 1834 -6% |
| Seq Read (MB/s) | 2523 | 2213 -12% | 2493 -1% | 2541 1% | 1266 -50% |
* ... menor é melhor

| 3DMark | |
| 1920x1080 Fire Strike Graphics | |
| MSI Gaming X GeForce GTX 1080 Desktop PC | |
| MSI GT75 8RG-090 Titan | |
| Alienware 15 R3 Max-Q | |
| Asus Zephyrus M GM501 | |
| Média NVIDIA GeForce GTX 1070 Max-Q (14146 - 16165, n=16) | |
| Eurocom Q6 | |
| Eurocom Q5 | |
| Asus ROG Strix GL702ZC-GC204T | |
| Asus FX503VM-EH73 | |
| Asus Strix GL502VY-DS71 | |
| Asus GL552VW-DH74 | |
| 3840x2160 Fire Strike Ultra Graphics | |
| Alienware 15 R3 Max-Q | |
| Média NVIDIA GeForce GTX 1070 Max-Q (3210 - 3662, n=8) | |
| Eurocom Q6 | |
| Eurocom Q5 | |
| Asus Strix GL502VY-DS71 | |
| Asus GL552VW-DH74 | |
| 3DMark 11 | |
| 1280x720 Performance GPU | |
| MSI Gaming X GeForce GTX 1080 Desktop PC | |
| MSI GT75 8RG-090 Titan | |
| Alienware 15 R3 Max-Q | |
| Asus Zephyrus M GM501 | |
| Média NVIDIA GeForce GTX 1070 Max-Q (17680 - 20829, n=18) | |
| Eurocom Q5 | |
| Eurocom Q6 | |
| Asus ROG Strix GL702ZC-GC204T | |
| Asus FX503VM-EH73 | |
| Asus Strix GL502VY-DS71 | |
| Asus GL552VW-DH74 | |
| 1280x720 Performance Combined | |
| MSI GT75 8RG-090 Titan | |
| Asus Zephyrus M GM501 | |
| MSI Gaming X GeForce GTX 1080 Desktop PC | |
| Eurocom Q6 | |
| Média NVIDIA GeForce GTX 1070 Max-Q (7458 - 12069, n=18) | |
| Alienware 15 R3 Max-Q | |
| Eurocom Q5 | |
| Asus Strix GL502VY-DS71 | |
| Asus ROG Strix GL702ZC-GC204T | |
| Asus FX503VM-EH73 | |
| Asus GL552VW-DH74 | |
| 3DMark 11 Performance | 15801 pontos | |
| 3DMark Cloud Gate Standard Score | 34682 pontos | |
| 3DMark Fire Strike Score | 12903 pontos | |
| 3DMark Fire Strike Extreme Score | 6588 pontos | |
Ajuda | ||
| baixo | média | alto | ultra | |
|---|---|---|---|---|
| BioShock Infinite (2013) | 327.9 | 246.7 | 230.8 | 132.1 |
| The Witcher 3 (2015) | 236.2 | 165.2 | 97 | 48.9 |
| Rise of the Tomb Raider (2016) | 202.7 | 166.2 | 97.8 | 82.4 |
| The Witcher 3 - 1920x1080 Ultra Graphics & Postprocessing (HBAO+) | |
| MSI GT75 8RG-090 Titan | |
| Alienware 15 R3 Max-Q | |
| Aorus X5 v8 | |
| Média NVIDIA GeForce GTX 1070 Max-Q (46 - 55.3, n=19) | |
| Eurocom Q6 | |
| Eurocom Q5 | |
| Asus FX503VM-EH73 | |
| Dell Inspiron 15 7000 7577 4K | |
| BioShock Infinite - 1920x1080 Ultra Preset, DX11 (DDOF) | |
| Alienware 15 R3 Max-Q | |
| Eurocom Q6 | |
| Eurocom Q5 | |
| Média NVIDIA GeForce GTX 1070 Max-Q (109.6 - 139.4, n=10) | |
| Dell Inspiron 15 7000 7577 4K | |
| Rise of the Tomb Raider - 1920x1080 Very High Preset AA:FX AF:16x | |
| Eurocom Q6 | |
| Média NVIDIA GeForce GTX 1070 Max-Q (77.1 - 85.9, n=7) | |
| Eurocom Q5 | |
| Asus FX503VM-EH73 | |
| Dell Inspiron 15 7000 7577 4K | |
Barulho
| Ocioso |
| 30.4 / 30.5 / 33.3 dB |
| Carga |
| 42.3 / 50.8 dB |
 | ||
30 dB silencioso 40 dB(A) audível 50 dB(A) ruidosamente alto |
||
min: | ||
| Eurocom Q6 GeForce GTX 1070 Max-Q, i7-8750H, Samsung SSD 960 Pro 512 GB m.2 | Eurocom Q5 GeForce GTX 1070 Max-Q, i7-7700HQ, Samsung SSD 960 Pro 512 GB m.2 | Aorus X5 v8 GeForce GTX 1070 Mobile, i7-8850H, Toshiba NVMe THNSN5512GPU7 | Gigabyte Aero 15X v8 GeForce GTX 1070 Max-Q, i7-8750H, Toshiba NVMe THNSN5512GPU7 | MSI GS65 8RF-019DE Stealth Thin GeForce GTX 1070 Max-Q, i7-8750H, Samsung SSD PM981 MZVLB512HAJQ | Asus Zephyrus M GM501 GeForce GTX 1070 Mobile, i7-8750H, Samsung SM961 MZVKW512HMJP m.2 PCI-e | |
|---|---|---|---|---|---|---|
| Noise | -3% | -11% | -7% | 1% | -5% | |
| desligado / ambiente * (dB) | 28.3 | 29 -2% | 30 -6% | 29 -2% | 30 -6% | 29 -2% |
| Idle Minimum * (dB) | 30.4 | 31.5 -4% | 33 -9% | 30 1% | 30 1% | 30 1% |
| Idle Average * (dB) | 30.5 | 33.8 -11% | 35 -15% | 31 -2% | 31 -2% | 31 -2% |
| Idle Maximum * (dB) | 33.3 | 33.8 -2% | 40 -20% | 35 -5% | 34 -2% | 33 1% |
| Load Average * (dB) | 42.3 | 41.7 1% | 45 -6% | 49 -16% | 43 -2% | 49 -16% |
| Witcher 3 ultra * (dB) | 43.3 | 41.7 4% | 50 -15% | 51 -18% | 42 3% | 50 -15% |
| Load Maximum * (dB) | 50.8 | 54.2 -7% | 55 -8% | 54 -6% | 44 13% | 52 -2% |
* ... menor é melhor
(-) A temperatura máxima no lado superior é 49 °C / 120 F, em comparação com a média de 40.4 °C / 105 F , variando de 21.2 a 68.8 °C para a classe Gaming.
(-) A parte inferior aquece até um máximo de 53 °C / 127 F, em comparação com a média de 43.2 °C / 110 F
(+) Em uso inativo, a temperatura média para o lado superior é 28.5 °C / 83 F, em comparação com a média do dispositivo de 33.9 °C / ### class_avg_f### F.
(-) Jogando The Witcher 3, a temperatura média para o lado superior é 41.6 °C / 107 F, em comparação com a média do dispositivo de 33.9 °C / ## #class_avg_f### F.
(±) Os apoios para as mãos e o touchpad podem ficar muito quentes ao toque, com um máximo de 37.6 °C / 99.7 F.
(-) A temperatura média da área do apoio para as mãos de dispositivos semelhantes foi 28.8 °C / 83.8 F (-8.8 °C / -15.9 F).
| desligado | |
| Ocioso | |
| Carga |
|
Key:
min: | |
| Eurocom Q6 i7-8750H, GeForce GTX 1070 Max-Q, Samsung SSD 960 Pro 512 GB m.2, IPS, 1920x1080, 15.6" | Eurocom Q5 i7-7700HQ, GeForce GTX 1070 Max-Q, Samsung SSD 960 Pro 512 GB m.2, IPS, 3840x2160, 15.6" | Aorus X5 v8 i7-8850H, GeForce GTX 1070 Mobile, Toshiba NVMe THNSN5512GPU7, IPS, 1920x1080, 15.6" | MSI GS65 8RF-019DE Stealth Thin i7-8750H, GeForce GTX 1070 Max-Q, Samsung SSD PM981 MZVLB512HAJQ, IPS, 1920x1080, 15.6" | HP Omen 15t-ce000 i7-7700HQ, GeForce GTX 1060 Max-Q, Samsung PM961 NVMe MZVLW128HEGR, IPS, 3840x2160, 15.6" | Asus Zephyrus M GM501 i7-8750H, GeForce GTX 1070 Mobile, Samsung SM961 MZVKW512HMJP m.2 PCI-e, IPS, 1920x1080, 15.6" | |
|---|---|---|---|---|---|---|
| Power Consumption | 15% | -60% | 11% | -2% | -24% | |
| Idle Minimum * (Watt) | 11.6 | 9 22% | 25 -116% | 7 40% | 15.4 -33% | 16 -38% |
| Idle Average * (Watt) | 16.3 | 13.5 17% | 31 -90% | 11 33% | 22.4 -37% | 19 -17% |
| Idle Maximum * (Watt) | 21.5 | 13.7 36% | 33 -53% | 20 7% | 22.4 -4% | 26 -21% |
| Load Average * (Watt) | 100.7 | 87.8 13% | 102 -1% | 98 3% | 78.1 22% | 103 -2% |
| Witcher 3 ultra * (Watt) | 140.1 | 129 8% | 194 -38% | 132 6% | 97.5 30% | 164 -17% |
| Load Maximum * (Watt) | 150.3 | 158.6 -6% | 239 -59% | 182 -21% | 133.52 11% | 223 -48% |
* ... menor é melhor
| Eurocom Q6 i7-8750H, GeForce GTX 1070 Max-Q, 55 Wh | Eurocom Q5 i7-7700HQ, GeForce GTX 1070 Max-Q, 55 Wh | Aorus X5 v8 i7-8850H, GeForce GTX 1070 Mobile, 92.24 Wh | MSI GS65 8RF-019DE Stealth Thin i7-8750H, GeForce GTX 1070 Max-Q, 82 Wh | Gigabyte Aero 15X v8 i7-8750H, GeForce GTX 1070 Max-Q, 94.24 Wh | HP Omen 15t-ce000 i7-7700HQ, GeForce GTX 1060 Max-Q, 70 Wh | |
|---|---|---|---|---|---|---|
| Duração da bateria | 12% | 11% | 49% | 133% | 3% | |
| Reader / Idle (h) | 5.1 | 7.8 53% | 4.9 -4% | 8.5 67% | 12.7 149% | 5 -2% |
| WiFi v1.3 (h) | 3.7 | 4.3 16% | 6 62% | 8.6 132% | 3.5 -5% | |
| Load (h) | 1.2 | 0.8 -33% | 1.5 25% | 1.4 17% | 2.6 117% | 1.4 17% |
Pro
Contra
Nossos comentários gerais para o Q5 ainda se aplicam aqui, para o Q6. Os usuários potenciais interessados no Q6 devem aproveitar ao máximo o sistema, utilizando a sua baia SATA III acessível de 2,5 polegadas e conectividade 4G LTE, pois eles são incomuns no mundo dos portáteis para jogos super-finos.
O maior desafio para o Q6 é que ele não oferece muito mais do que o Q5 em termos de recursos e desempenho em jogos. Isso não é necessariamente ruim porque o Q5 é um sistema para jogos respeitável para começar, mas o Q6 está sendo lançado no mesmo trimestre que os pesos pesados como o MSI GS60 e Gigabyte Aero 15X. Ambas as alternativas oferecem marcos estreitos, as mesmas opções de CPU e GPU, e painéis similares de 144 Hz, sendo ao mesmo tempo mais leves e mais portáteis pelo mesmo preço de ~$2.000. Mesmo os recém-chegados com "marcos grossos", como o Asus Zephyrus M GM501 ou Aorus X5 v8 oferecem Thunderbolt 3, iluminação RGB por tecla, ou ambos. Em suma, a série Eurocom Q está começando a mostrar sua idade e corre o risco de ficar ainda mais para trás, caso a atualização do próximo ano seja outra atualização menor. O preço do Q6 terá que cair se deseja ser mais competitivo em relação aos modelos mais recentes da MSI, Asus, Aorus e Razer.
O desempenho é sólido, se não um pouco quente demais. Pelo preço, no entanto, o Q6 está perdendo muito os luxos modernos que as alternativas estão oferecendo, como Thunderbolt 3, iluminação RGB por tecla e aberturas estreitas. A série está paralisada no momento, enquanto os concorrentes estão ampliando com designs mais frescos e mais recursos.
Eurocom Q6
- 06/22/2018 v6 (old)
Allen Ngo
Price comparison
