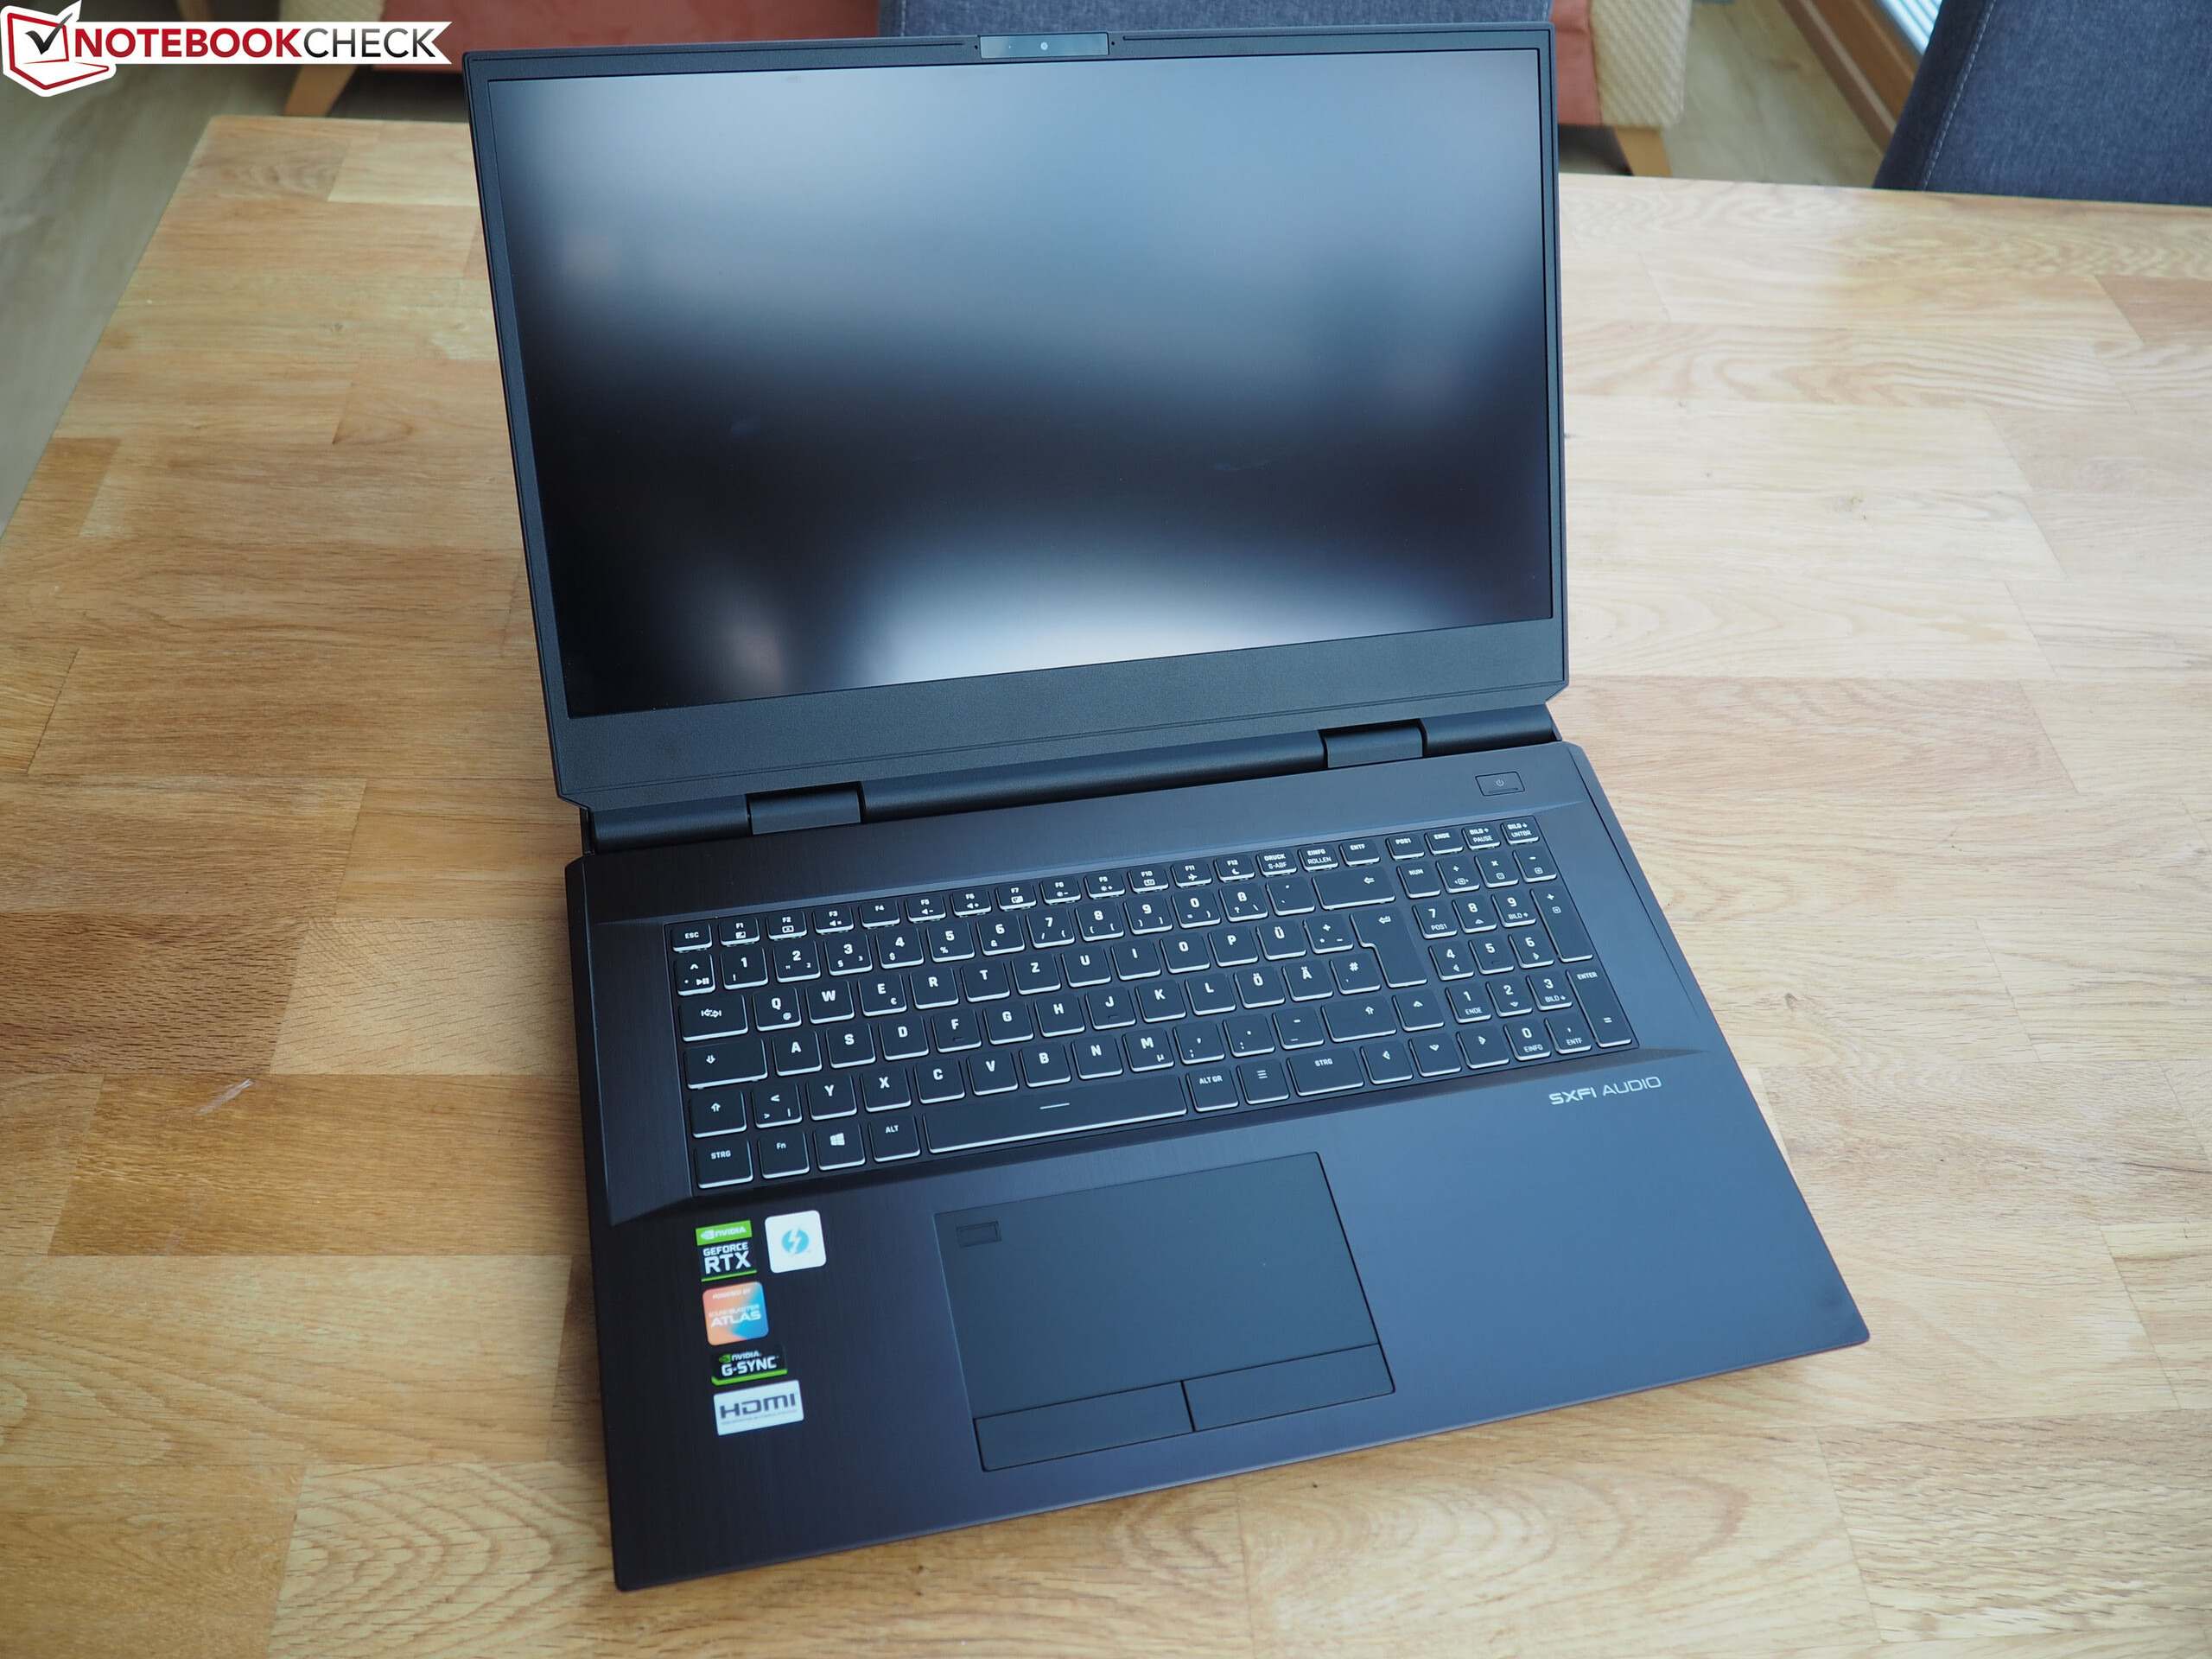
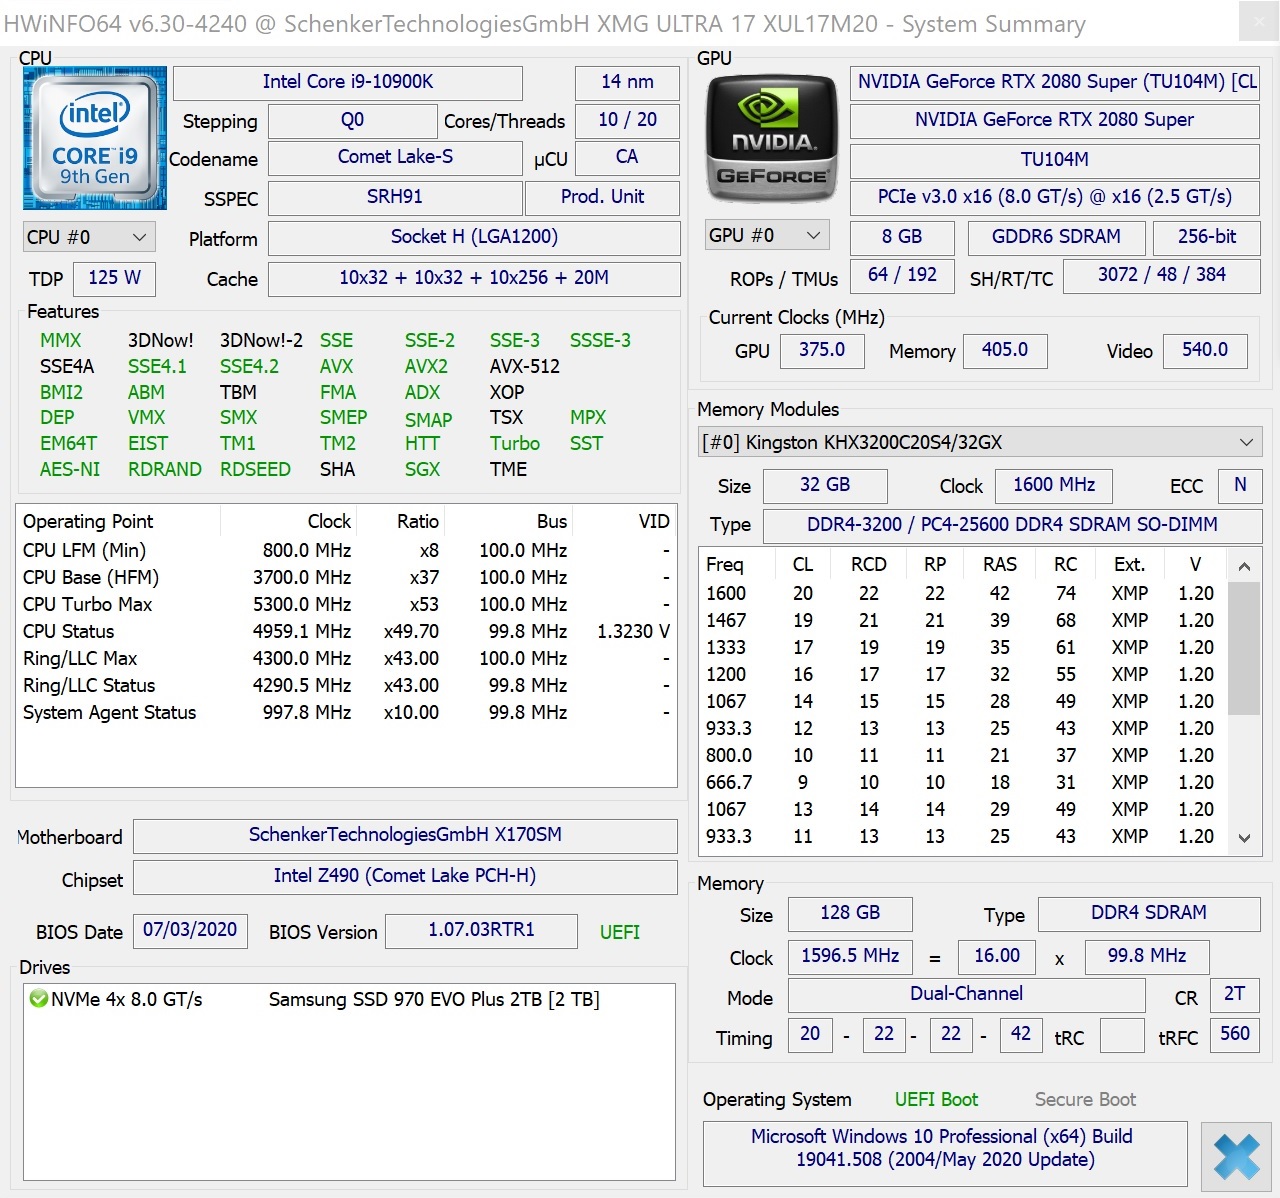
Breve Análise do Portátil Schenker XMG Ultra 17 (Clevo X170SM-G): Poder sem fim
Avaliação | Data | Modelo | Peso | Altura | Size | Resolução | Preço |
|---|---|---|---|---|---|---|---|
| 85 % v7 (old) | 10/2020 | Schenker XMG Ultra 17 Comet Lake i9-10900K, GeForce RTX 2080 Super Mobile | 4.7 kg | 43.5 mm | 17.30" | 3840x2160 | |
| 87.4 % v7 (old) | 10/2020 | MSI GT76 Titan DT 10SGS i9-10900K, GeForce RTX 2080 Super Mobile | 4.2 kg | 42 mm | 17.30" | 3840x2160 | |
| 85.3 % v7 (old) | 09/2020 | Alienware m17 R3 P45E i9-10980HK, GeForce RTX 2080 Super Mobile | 3 kg | 20.7 mm | 17.30" | 1920x1080 | |
| 82.7 % v7 (old) | 07/2020 | Asus Strix Scar 17 G732LXS i9-10980HK, GeForce RTX 2080 Super Mobile | 2.9 kg | 26.5 mm | 17.30" | 1920x1080 |
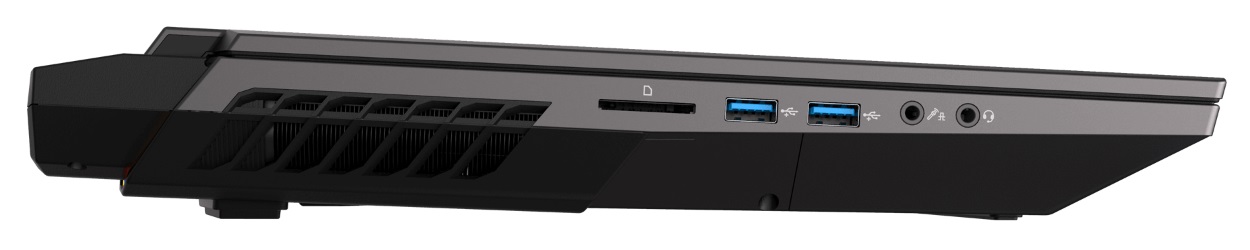
| SD Card Reader | |
| average JPG Copy Test (av. of 3 runs) | |
| Schenker XMG Ultra 17 Comet Lake (Toshiba Exceria Pro SDXC 64 GB UHS-II) | |
| Alienware m17 R3 P45E (Toshiba Exceria Pro M501 UHS-II) | |
| MSI GT76 Titan DT 10SGS (Toshiba Exceria Pro M501 UHS-II) | |
| Média da turma Gaming (20.9 - 210, n=54, últimos 2 anos) | |
| maximum AS SSD Seq Read Test (1GB) | |
| Alienware m17 R3 P45E (Toshiba Exceria Pro M501 UHS-II) | |
| Schenker XMG Ultra 17 Comet Lake (Toshiba Exceria Pro SDXC 64 GB UHS-II) | |
| MSI GT76 Titan DT 10SGS (Toshiba Exceria Pro M501 UHS-II) | |
| Média da turma Gaming (25.5 - 261, n=51, últimos 2 anos) | |


| |||||||||||||||||||||||||
iluminação: 92 %
iluminação com acumulador: 442 cd/m²
Contraste: 1228:1 (Preto: 0.36 cd/m²)
ΔE ColorChecker Calman: 4.38 | ∀{0.5-29.43 Ø4.73}
calibrated: 0.66
ΔE Greyscale Calman: 7.3 | ∀{0.09-98 Ø4.97}
98% sRGB (Argyll 1.6.3 3D)
98% AdobeRGB 1998 (Argyll 1.6.3 3D)
97.9% AdobeRGB 1998 (Argyll 3D)
99.1% sRGB (Argyll 3D)
83% Display P3 (Argyll 3D)
Gamma: 2.17
CCT: 6906 K
| Schenker XMG Ultra 17 Comet Lake AUO B173ZAN03.0 (AUO309B), IPS, 3840x2160, 17.3" | MSI GT76 Titan DT 10SGS AU Optronics B173ZAN03.3, IPS, 3840x2160, 17.3" | Alienware m17 R3 P45E AU Optronics B173HAN, IPS, 1920x1080, 17.3" | Asus Strix Scar 17 G732LXS LQ173M1JW03 (SHP14DC), IPS, 1920x1080, 17.3" | |
|---|---|---|---|---|
| Display | -1% | -15% | -14% | |
| Display P3 Coverage (%) | 83 | 82.5 -1% | 69.2 -17% | 71 -14% |
| sRGB Coverage (%) | 99.1 | 98 -1% | 97.9 -1% | 99 0% |
| AdobeRGB 1998 Coverage (%) | 97.9 | 96.6 -1% | 71.4 -27% | 71.6 -27% |
| Response Times | 50% | 51% | 75% | |
| Response Time Grey 50% / Grey 80% * (ms) | 50.4 ? | 23.2 ? 54% | 16.8 ? 67% | 5.8 ? 88% |
| Response Time Black / White * (ms) | 21.6 ? | 11.6 ? 46% | 14 ? 35% | 8.4 ? 61% |
| PWM Frequency (Hz) | ||||
| Screen | -29% | 4% | -10% | |
| Brightness middle (cd/m²) | 442 | 419.5 -5% | 338.3 -23% | 310 -30% |
| Brightness (cd/m²) | 423 | 413 -2% | 325 -23% | 311 -26% |
| Brightness Distribution (%) | 92 | 93 1% | 91 -1% | 82 -11% |
| Black Level * (cd/m²) | 0.36 | 0.4 -11% | 0.27 25% | 0.41 -14% |
| Contrast (:1) | 1228 | 1049 -15% | 1253 2% | 756 -38% |
| Colorchecker dE 2000 * | 4.38 | 3.4 22% | 1.88 57% | 2.41 45% |
| Colorchecker dE 2000 max. * | 10.85 | 7.4 32% | 3.23 70% | 8.59 21% |
| Colorchecker dE 2000 calibrated * | 0.66 | 3.28 -397% | 1.32 -100% | 1.13 -71% |
| Greyscale dE 2000 * | 7.3 | 2 73% | 2.4 67% | 4.3 41% |
| Gamma | 2.17 101% | 2.14 103% | 2.39 92% | 2.149 102% |
| CCT | 6906 94% | 6858 95% | 6572 99% | 7059 92% |
| Color Space (Percent of AdobeRGB 1998) (%) | 98 | 84.6 -14% | 64.7 -34% | 72 -27% |
| Color Space (Percent of sRGB) (%) | 98 | 97.9 0% | 97.8 0% | 94 -4% |
| Média Total (Programa/Configurações) | 7% /
-14% | 13% /
6% | 17% /
-0% |
* ... menor é melhor
Exibir tempos de resposta
| ↔ Tempo de resposta preto para branco | ||
|---|---|---|
| 21.6 ms ... ascensão ↗ e queda ↘ combinadas | ↗ 7.6 ms ascensão | 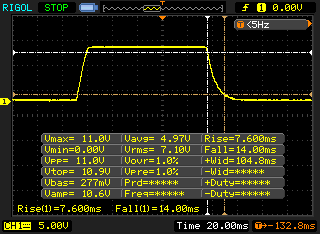 |
| ↘ 14 ms queda | ||
| A tela mostra boas taxas de resposta em nossos testes, mas pode ser muito lenta para jogadores competitivos. Em comparação, todos os dispositivos testados variam de 0.1 (mínimo) a 240 (máximo) ms. » 48 % de todos os dispositivos são melhores. Isso significa que o tempo de resposta medido é semelhante à média de todos os dispositivos testados (19.9 ms). | ||
| ↔ Tempo de resposta 50% cinza a 80% cinza | ||
| 50.4 ms ... ascensão ↗ e queda ↘ combinadas | ↗ 23.6 ms ascensão | 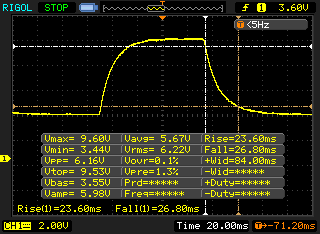 |
| ↘ 26.8 ms queda | ||
| A tela mostra taxas de resposta lentas em nossos testes e será insatisfatória para os jogadores. Em comparação, todos os dispositivos testados variam de 0.165 (mínimo) a 636 (máximo) ms. » 87 % de todos os dispositivos são melhores. Isso significa que o tempo de resposta medido é pior que a média de todos os dispositivos testados (31.1 ms). | ||
Cintilação da tela / PWM (modulação por largura de pulso)
| Tela tremeluzindo / PWM não detectado | 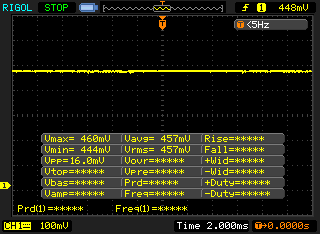 | ||
[pwm_comparison] Em comparação: 52 % de todos os dispositivos testados não usam PWM para escurecer a tela. Se PWM foi detectado, uma média de 7784 (mínimo: 5 - máximo: 343500) Hz foi medida. | |||
* ... menor é melhor
| PCMark 10 Score | 7461 pontos | |
Ajuda | ||
| DPC Latencies / LatencyMon - interrupt to process latency (max), Web, Youtube, Prime95 | |
| MSI GT76 Titan DT 10SGS | |
| Asus Strix Scar 17 G732LXS | |
| Alienware m17 R3 P45E | |
| Schenker XMG Ultra 17 Comet Lake | |
* ... menor é melhor
| Schenker XMG Ultra 17 Comet Lake Samsung SSD 970 EVO Plus 2TB | MSI GT76 Titan DT 10SGS 2x WDC PC SN730 SDBPNTY-1T00 (RAID 0) | Alienware m17 R3 P45E 2x Micron 2200S 512 GB (RAID 0) | Asus Strix Scar 17 G732LXS 2x Intel SSD 660p 1TB SSDPEKNW010T8 (RAID 0) | |
|---|---|---|---|---|
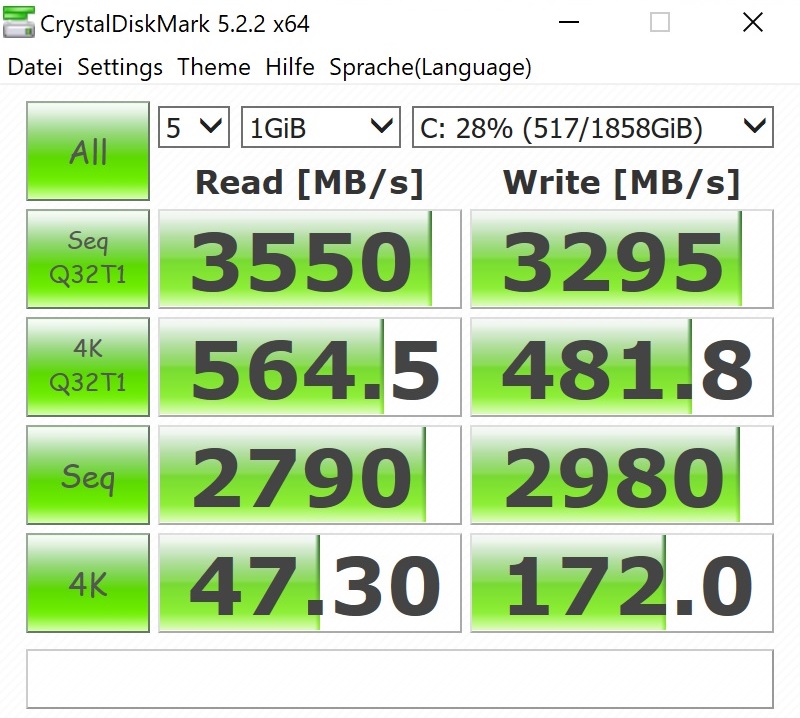
| CrystalDiskMark 5.2 / 6 | -9% | -19% | -18% | |
| Write 4K (MB/s) | 172 | 116.4 -32% | 68 -60% | 125.8 -27% |
| Read 4K (MB/s) | 47.3 | 43.85 -7% | 42.04 -11% | 52.9 12% |
| Write Seq (MB/s) | 2980 | 2927 -2% | 2221 -25% | 1795 -40% |
| Read Seq (MB/s) | 2790 | 1997 -28% | 2202 -21% | 2315 -17% |
| Write 4K Q32T1 (MB/s) | 481.8 | 467.6 -3% | 494.5 3% | 407.1 -16% |
| Read 4K Q32T1 (MB/s) | 565 | 538 -5% | 540 -4% | 411.9 -27% |
| Write Seq Q32T1 (MB/s) | 3295 | 3362 2% | 2623 -20% | 2844 -14% |
| Read Seq Q32T1 (MB/s) | 3550 | 3558 0% | 3159 -11% | 3130 -12% |
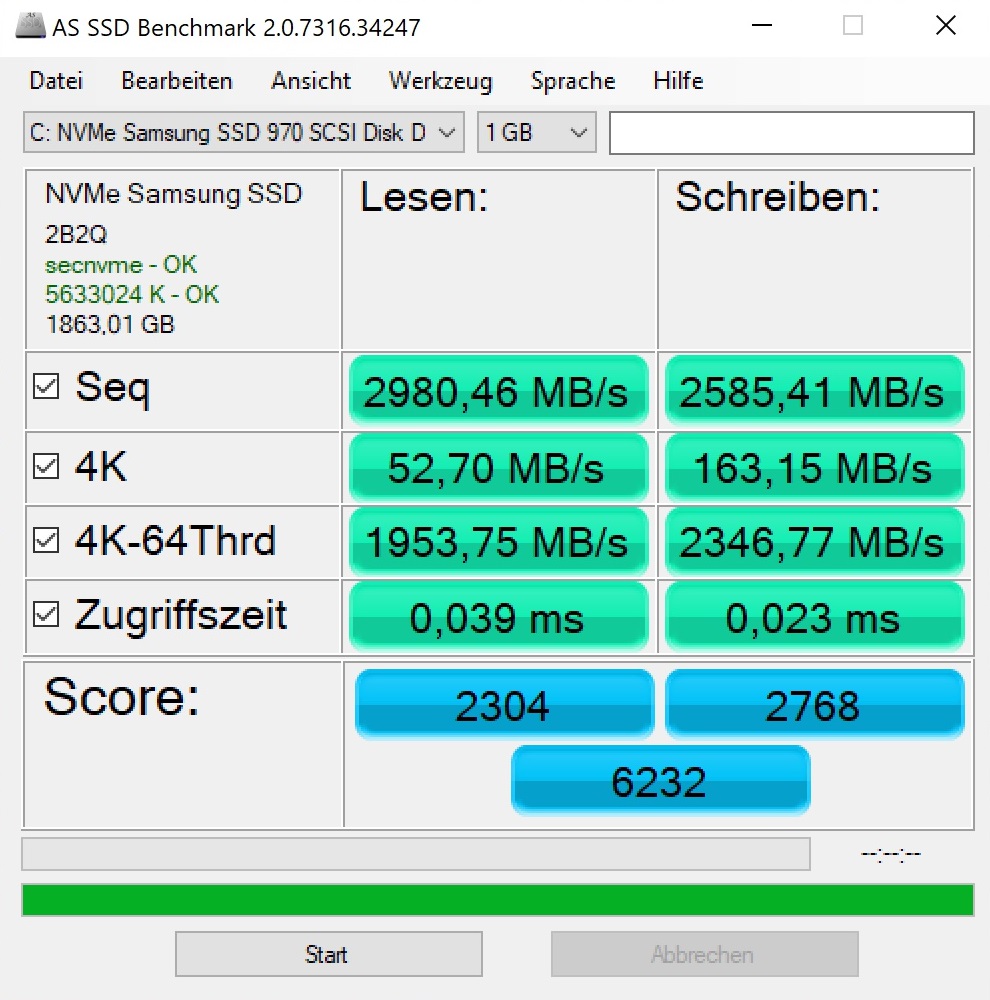
| AS SSD | -50% | -187% | -59% | |
| Seq Read (MB/s) | 2980 | 2406 -19% | 2060 -31% | 2450 -18% |
| Seq Write (MB/s) | 2585 | 2867 11% | 2297 -11% | 1436 -44% |
| 4K Read (MB/s) | 52.7 | 41.51 -21% | 35.39 -33% | 49.48 -6% |
| 4K Write (MB/s) | 163.1 | 108.8 -33% | 63.1 -61% | 119.4 -27% |
| 4K-64 Read (MB/s) | 1954 | 1525 -22% | 1337 -32% | 1032 -47% |
| 4K-64 Write (MB/s) | 2347 | 1424 -39% | 1307 -44% | 1229 -48% |
| Access Time Read * (ms) | 0.039 | 0.041 -5% | 0.057 -46% | 0.145 -272% |
| Access Time Write * (ms) | 0.023 | 0.102 -343% | 0.411 -1687% | 0.036 -57% |
| Score Read (Points) | 2304 | 1807 -22% | 1578 -32% | 1327 -42% |
| Score Write (Points) | 2768 | 1819 -34% | 1600 -42% | 1492 -46% |
| Score Total (Points) | 6232 | 4573 -27% | 3997 -36% | 3456 -45% |
| Média Total (Programa/Configurações) | -30% /
-33% | -103% /
-116% | -39% /
-42% |
* ... menor é melhor

Continuous load read: DiskSpd Read Loop, Queue Depth 8
| 3DMark 11 Performance | 31493 pontos | |
| 3DMark Fire Strike Score | 22606 pontos | |
| 3DMark Time Spy Score | 11211 pontos | |
Ajuda | ||
| The Witcher 3 | |
| 1920x1080 Ultra Graphics & Postprocessing (HBAO+) | |
| Média da turma Gaming (95 - 240, n=8, últimos 2 anos) | |
| MSI GT76 Titan DT 10SGS | |
| Schenker XMG Ultra 17 Comet Lake | |
| Média NVIDIA GeForce RTX 2080 Super Mobile (93.4 - 113.2, n=4) | |
| Alienware m17 R3 P45E | |
| Asus Strix Scar 17 G732LXS | |
| 3840x2160 High Graphics & Postprocessing (Nvidia HairWorks Off) | |
| Média da turma Gaming (114 - 169.8, n=3, últimos 2 anos) | |
| MSI GT76 Titan DT 10SGS | |
| Schenker XMG Ultra 17 Comet Lake | |
| Média NVIDIA GeForce RTX 2080 Super Mobile (66.4 - 80.5, n=3) | |
| Asus Strix Scar 17 G732LXS | |
| baixo | média | alto | ultra | QHD | 4K | |
|---|---|---|---|---|---|---|
| GTA V (2015) | 187 | 182 | 179 | 98.9 | ||
| The Witcher 3 (2015) | 209 | 109 | 75.6 | |||
| Dota 2 Reborn (2015) | 190 | 172 | 167 | 156 | 145 | |
| X-Plane 11.11 (2018) | 145 | 127 | 103 | 88.2 | ||
| Shadow of the Tomb Raider (2018) | 142 | 126 | 87.5 | 47.1 | ||
| Battlefield V (2018) | 168 | 152 | 126 | 76.2 | ||
| Borderlands 3 (2019) | 107 | 89.8 | 65.4 | 37.1 | ||
| Hunt Showdown (2020) | 133 | 92.4 | 85.6 | |||
| Doom Eternal (2020) | 222 | 219 | 176 | 96.5 | ||
| Gears Tactics (2020) | 154 | 125 | 82.1 | 43.2 | ||
| F1 2020 (2020) | 234 | 161 | 122 | 72.5 | ||
| Death Stranding (2020) | 149 | 147 | 108 | 60 | ||
| Horizon Zero Dawn (2020) | 127 | 104 | 80 | 45 | ||
| Flight Simulator 2020 (2020) | 64.6 | 47.1 | 37.8 | 23.8 | ||
| Serious Sam 4 (2020) | 113 | 95 | 84.2 | 54.4 | ||
| Mafia Definitive Edition (2020) | 122 | 83.4 | 45.2 | |||
| Star Wars Squadrons (2020) | 263 | 243 | 175 | 105 | ||
| FIFA 21 (2020) | 278 | 278 | 274 | 238 |
Barulho
| Ocioso |
| 27 / 32 / 57 dB |
| Carga |
| 56 / 62 dB |
 | ||
30 dB silencioso 40 dB(A) audível 50 dB(A) ruidosamente alto |
||
min: | ||
| Schenker XMG Ultra 17 Comet Lake i9-10900K, GeForce RTX 2080 Super Mobile | MSI GT76 Titan DT 10SGS i9-10900K, GeForce RTX 2080 Super Mobile | Alienware m17 R3 P45E i9-10980HK, GeForce RTX 2080 Super Mobile | Asus Strix Scar 17 G732LXS i9-10980HK, GeForce RTX 2080 Super Mobile | Média da turma Gaming | |
|---|---|---|---|---|---|
| Noise | 12% | 10% | 1% | 18% | |
| desligado / ambiente * (dB) | 25 | 26.4 -6% | 26.5 -6% | 25 -0% | 24.1 ? 4% |
| Idle Minimum * (dB) | 27 | 27.5 -2% | 27.8 -3% | 33 -22% | 25.8 ? 4% |
| Idle Average * (dB) | 32 | 27.5 14% | 27.8 13% | 38 -19% | 27.4 ? 14% |
| Idle Maximum * (dB) | 57 | 29.8 48% | 27.8 51% | 45 21% | 29.9 ? 48% |
| Load Average * (dB) | 56 | 30.9 45% | 52.1 7% | 54 4% | 43 ? 23% |
| Witcher 3 ultra * (dB) | 55 | 60.7 -10% | 51.8 6% | 50 9% | |
| Load Maximum * (dB) | 62 | 66.6 -7% | 59.1 5% | 55 11% | 54 ? 13% |
* ... menor é melhor
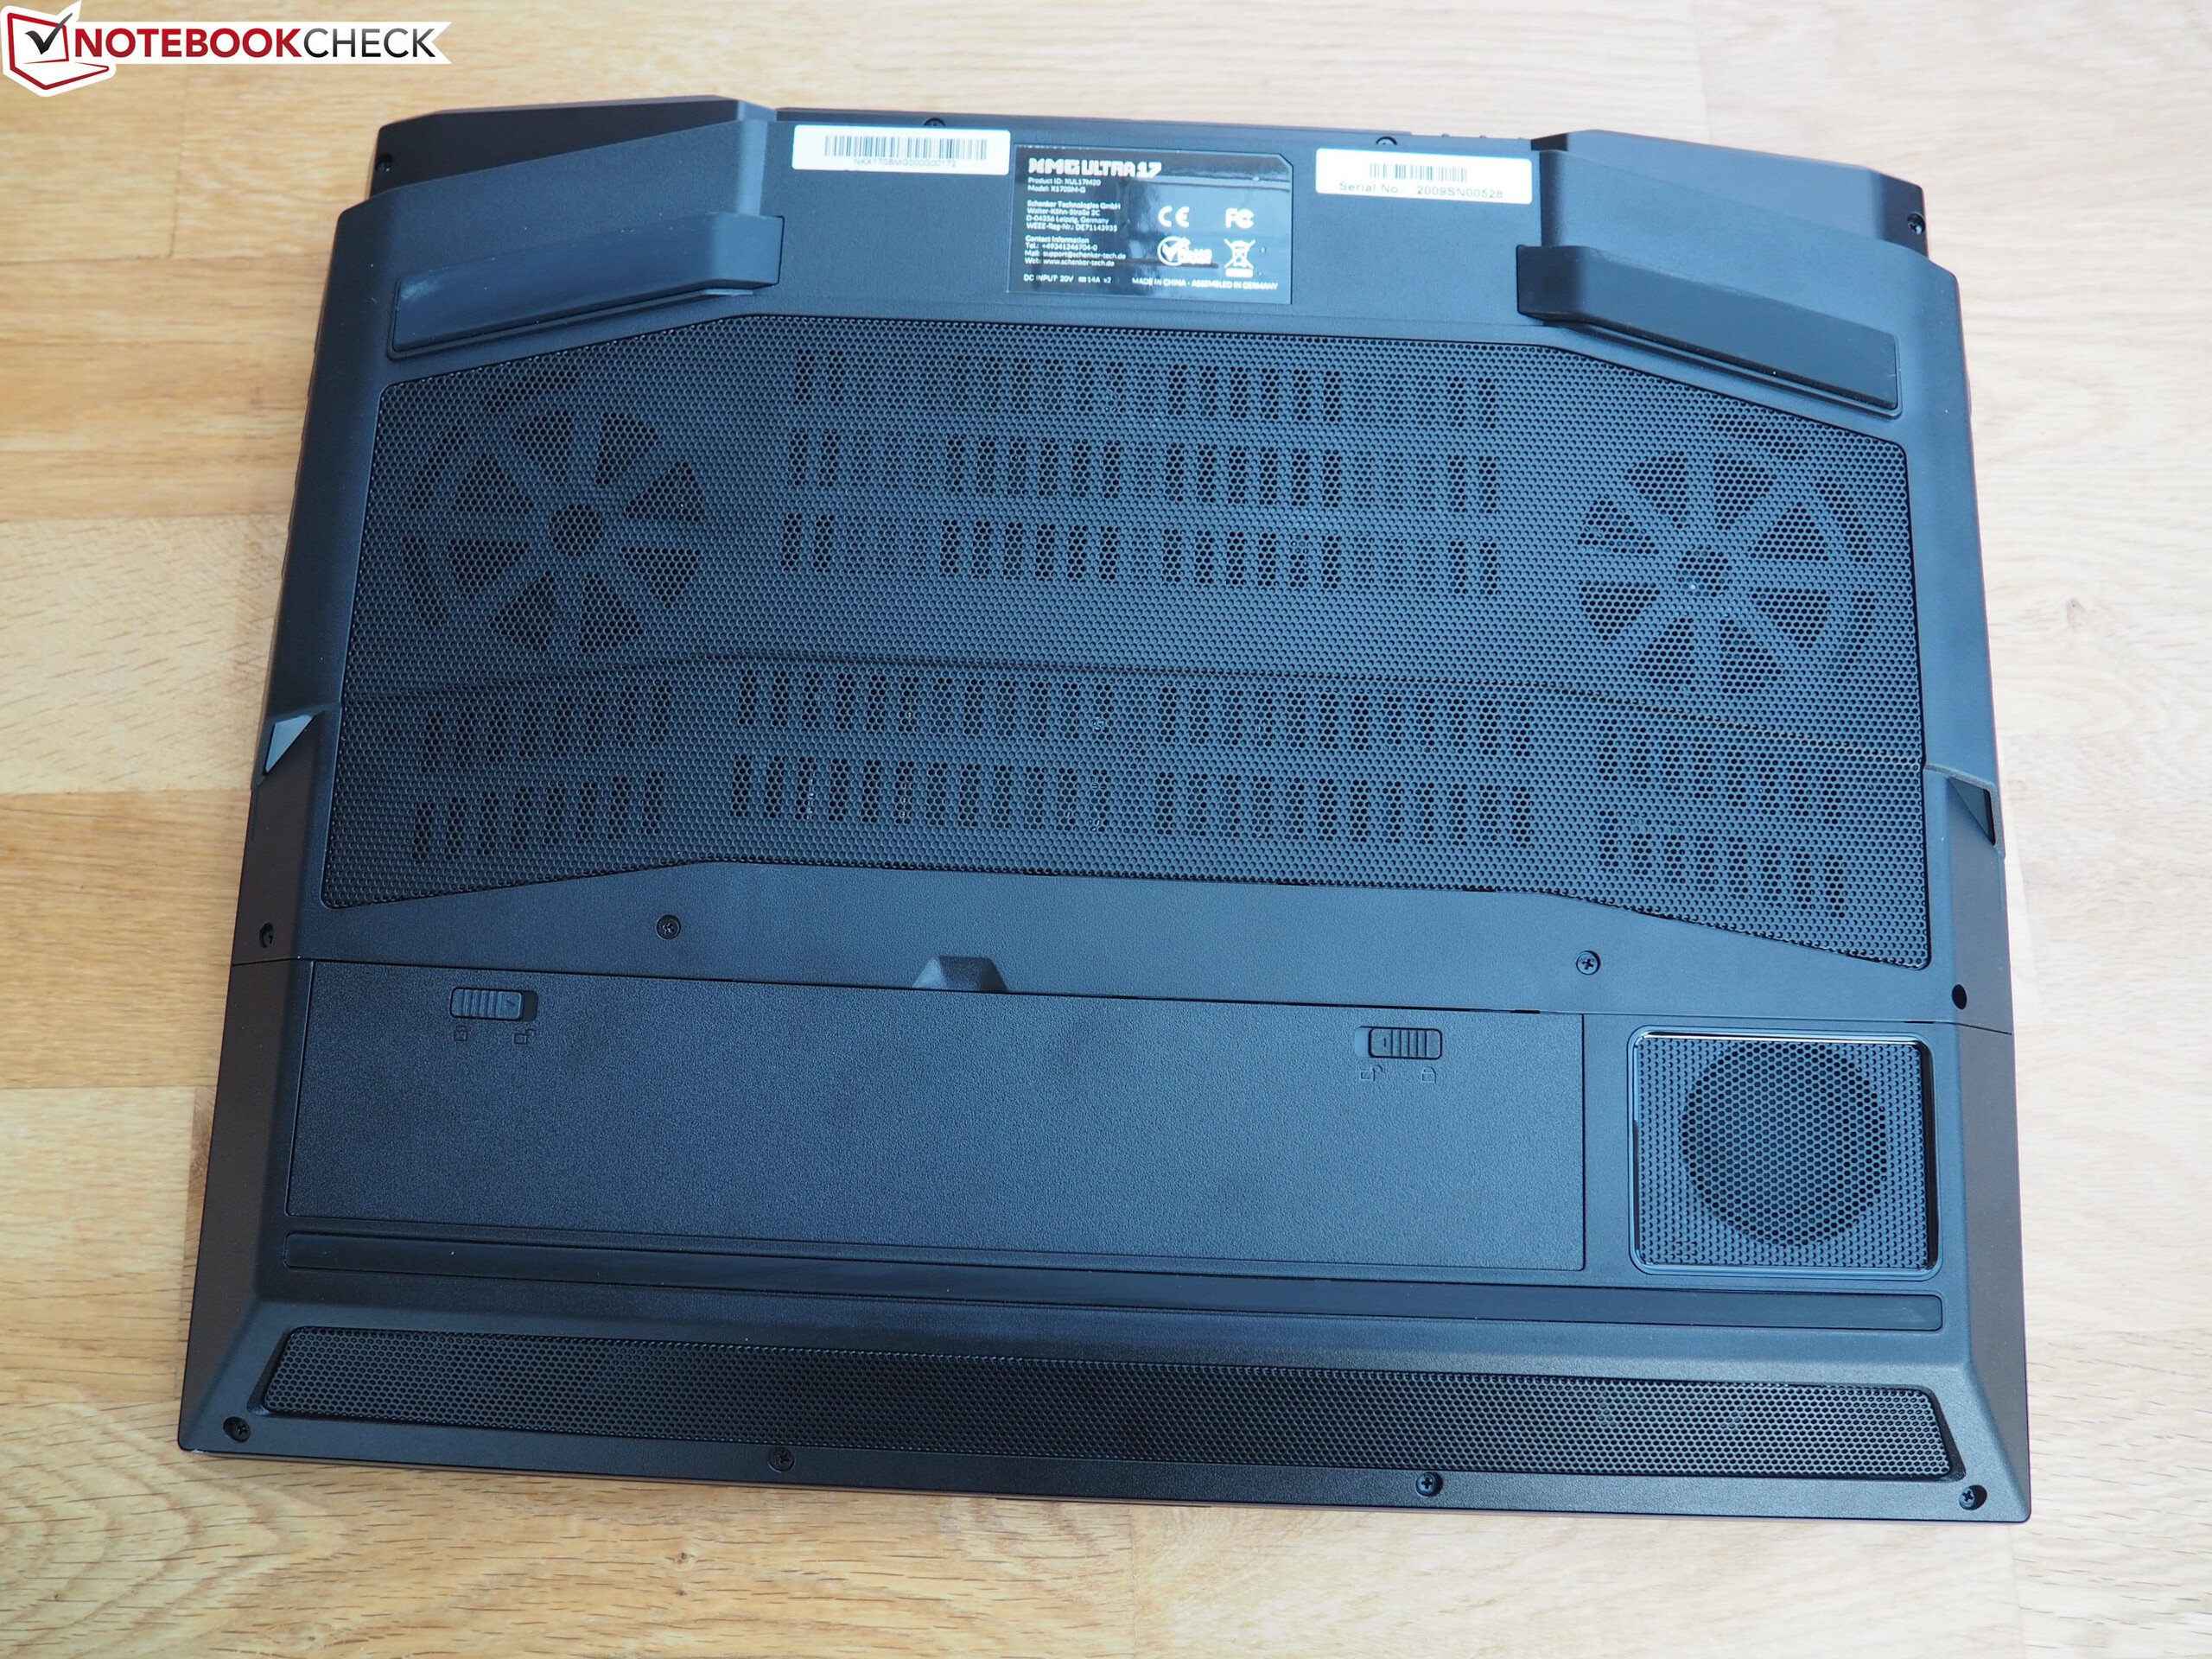
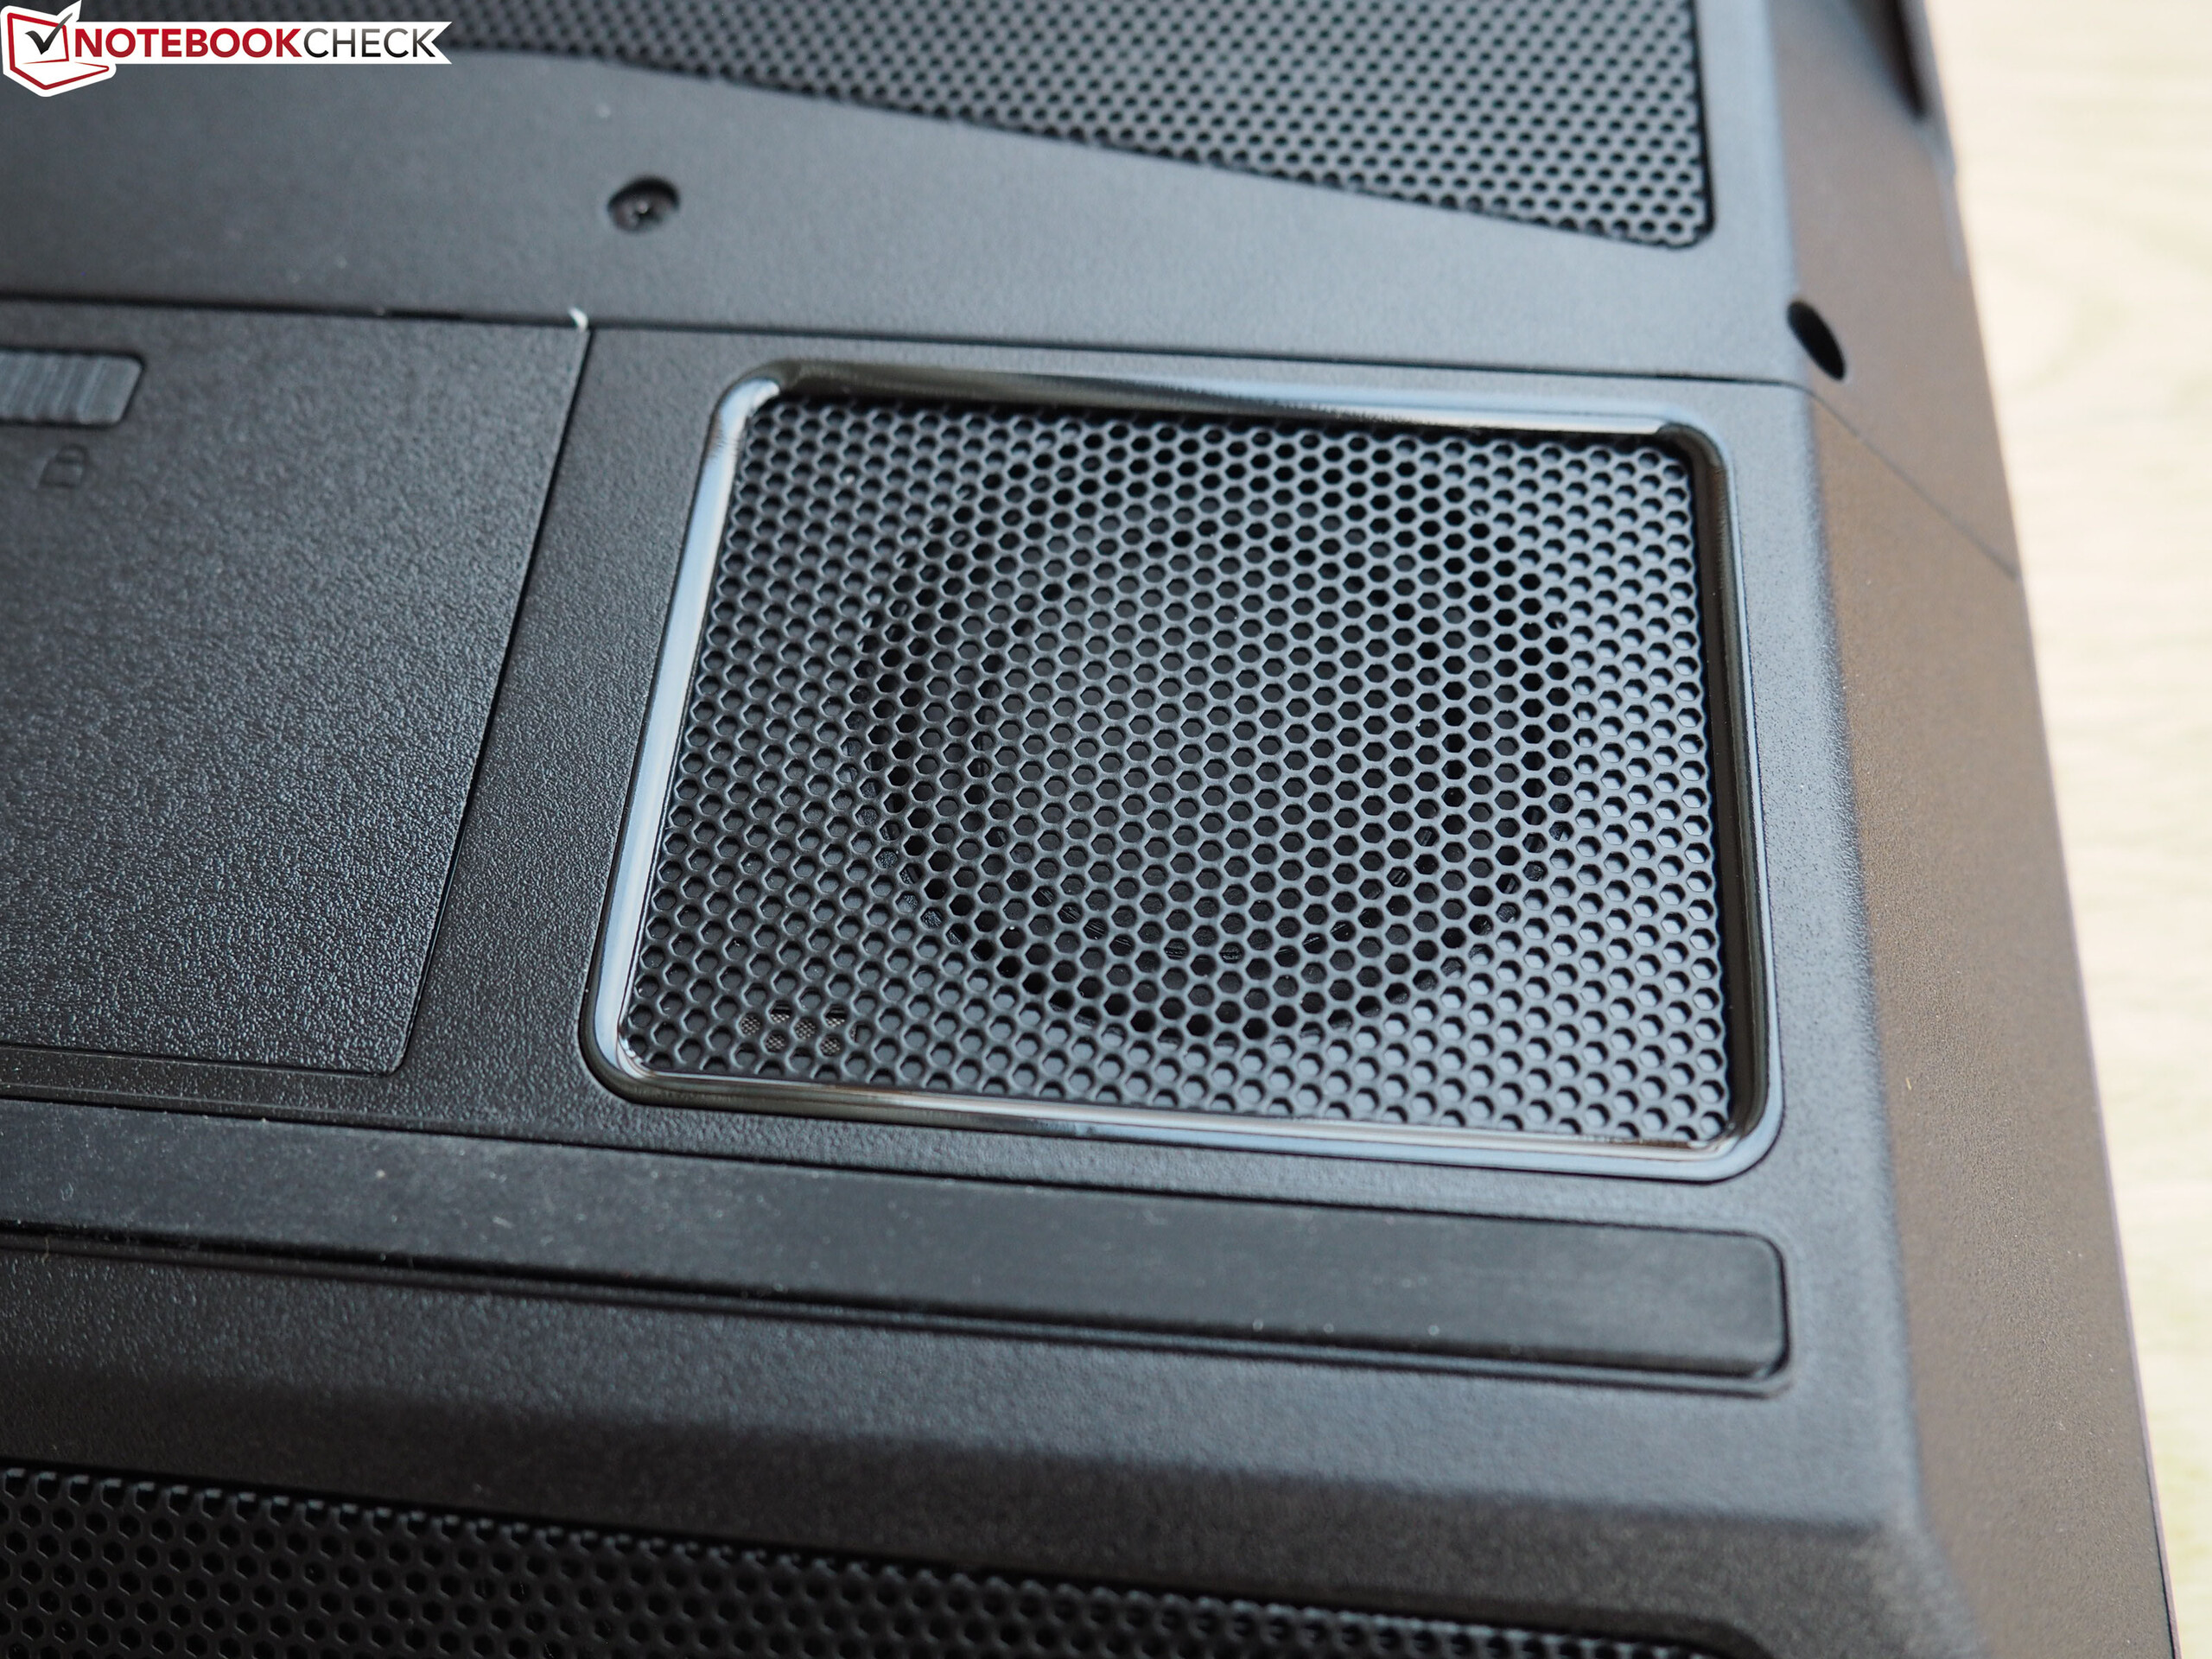
(+) A temperatura máxima no lado superior é 39 °C / 102 F, em comparação com a média de 40.4 °C / 105 F , variando de 21.2 a 68.8 °C para a classe Gaming.
(-) A parte inferior aquece até um máximo de 46 °C / 115 F, em comparação com a média de 43.2 °C / 110 F
(+) Em uso inativo, a temperatura média para o lado superior é 29.3 °C / 85 F, em comparação com a média do dispositivo de 33.9 °C / ### class_avg_f### F.
(±) Jogando The Witcher 3, a temperatura média para o lado superior é 33.2 °C / 92 F, em comparação com a média do dispositivo de 33.9 °C / ## #class_avg_f### F.
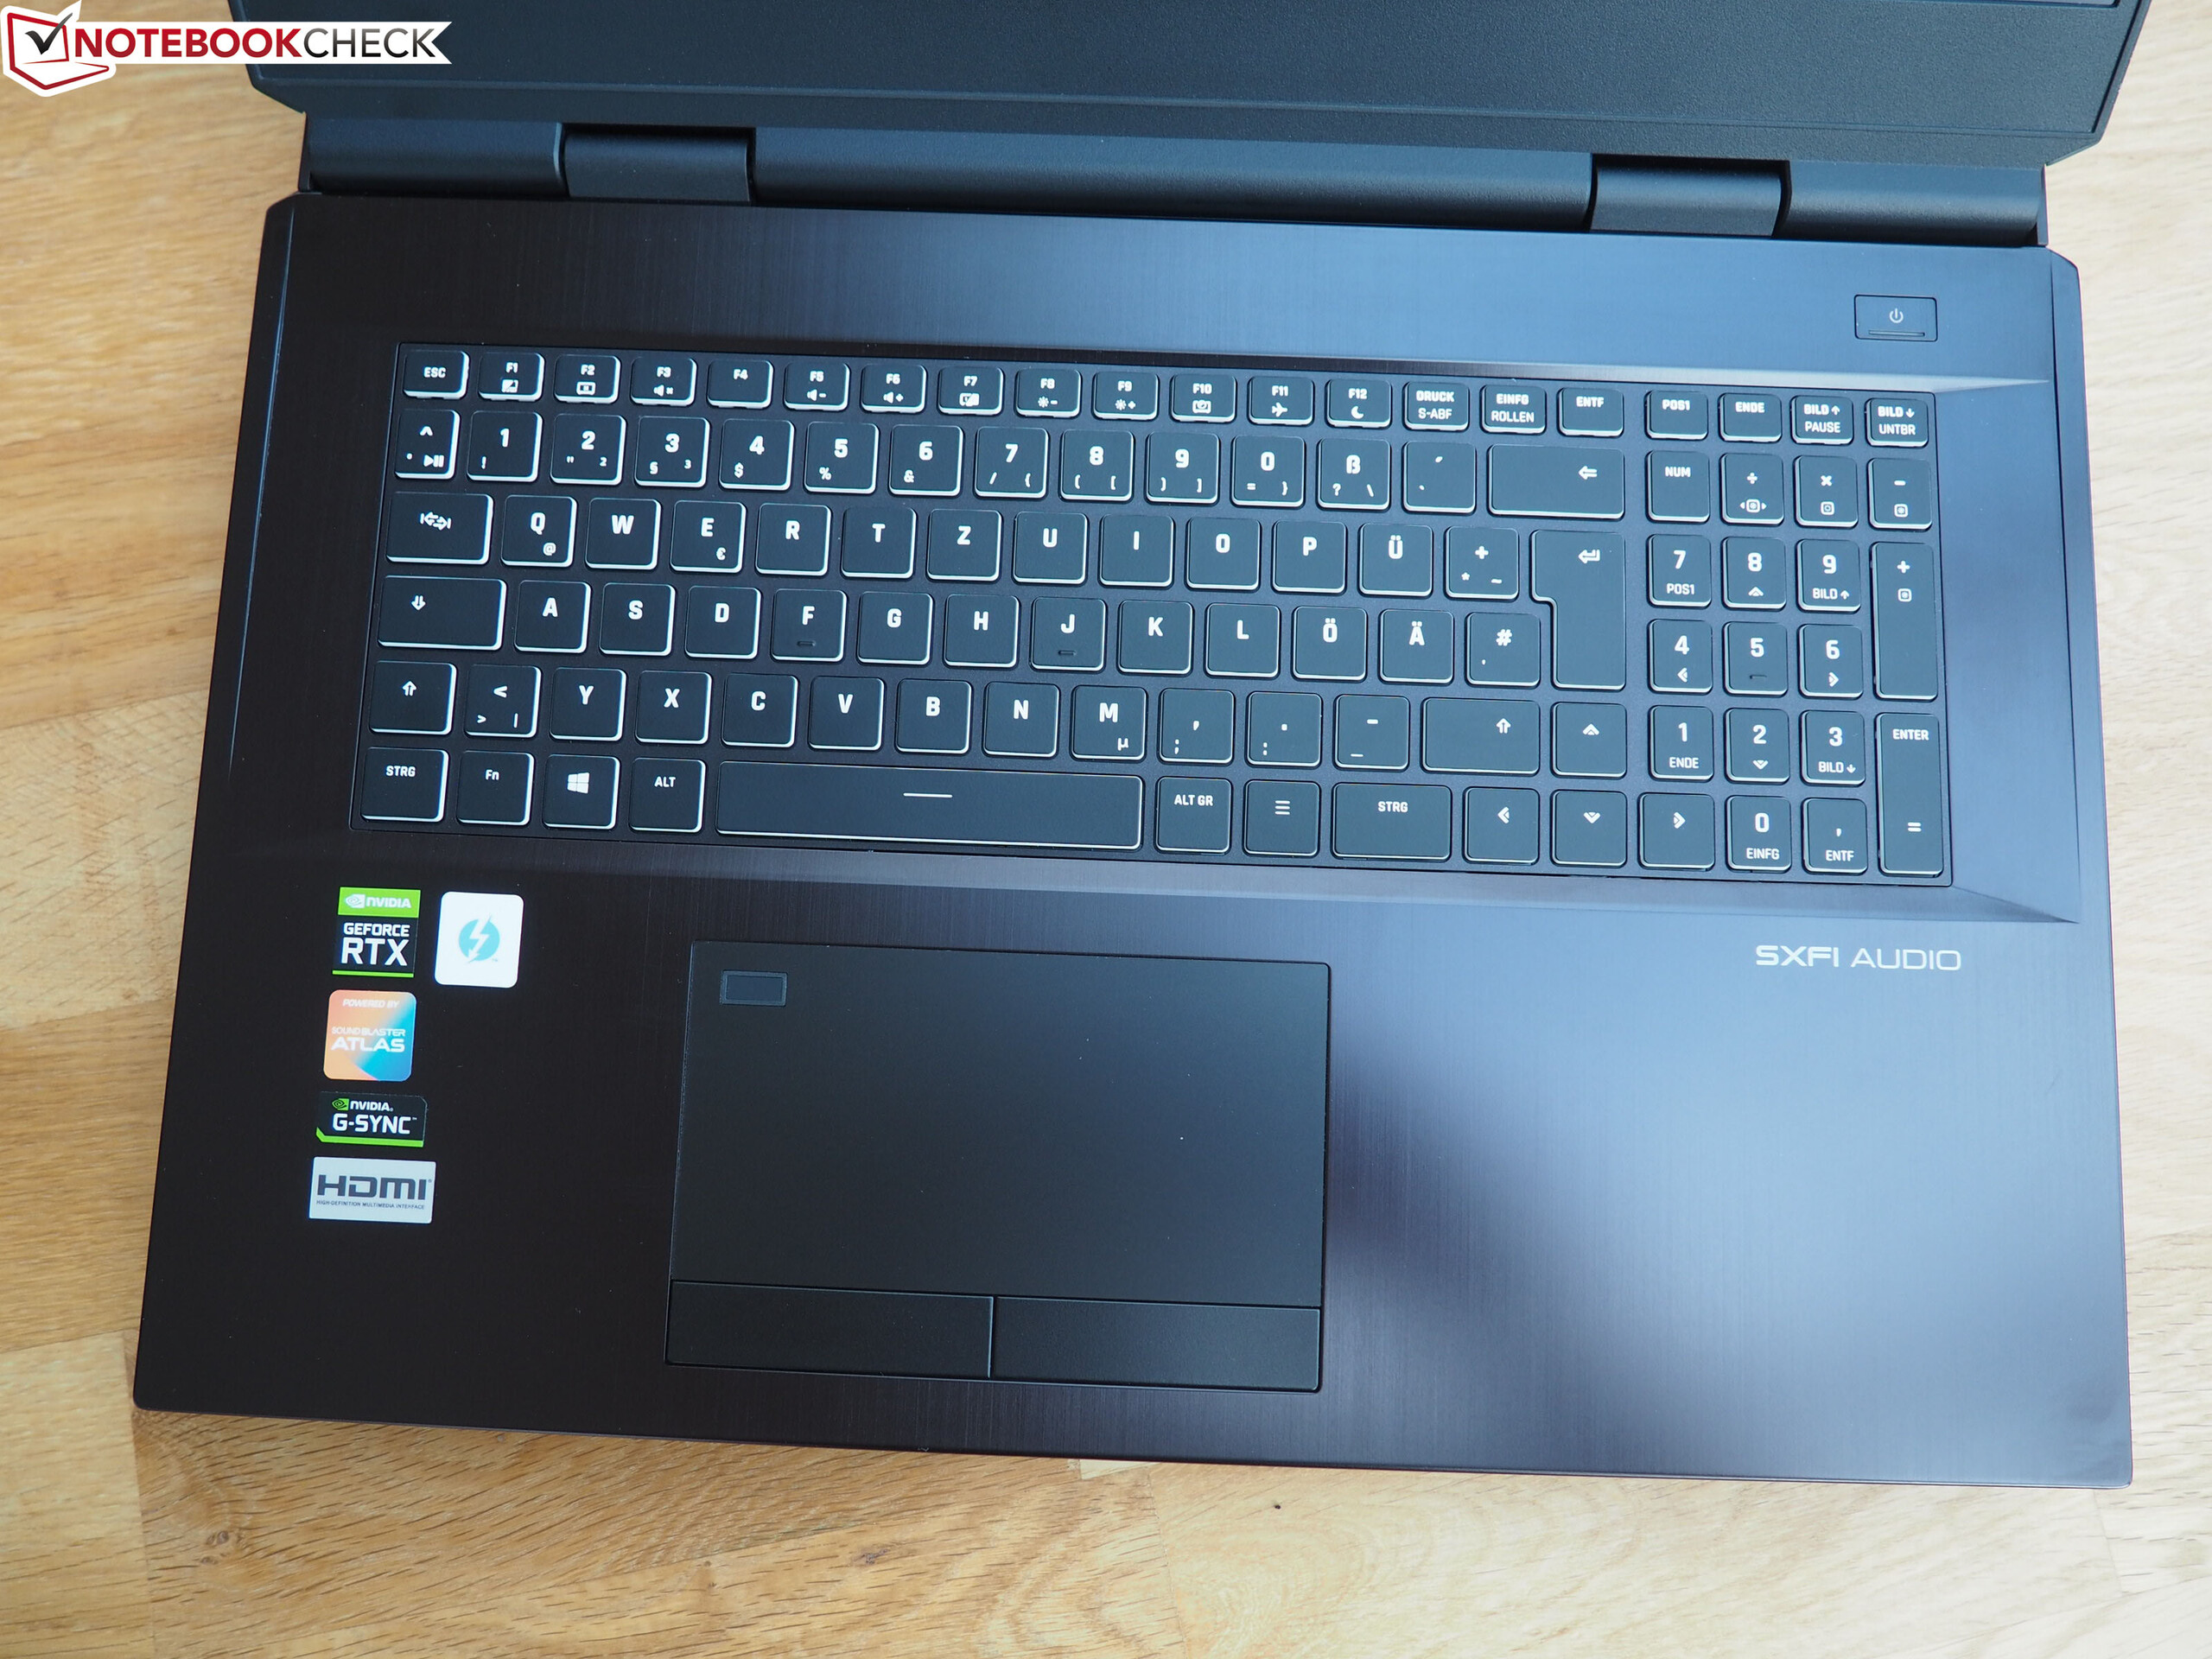
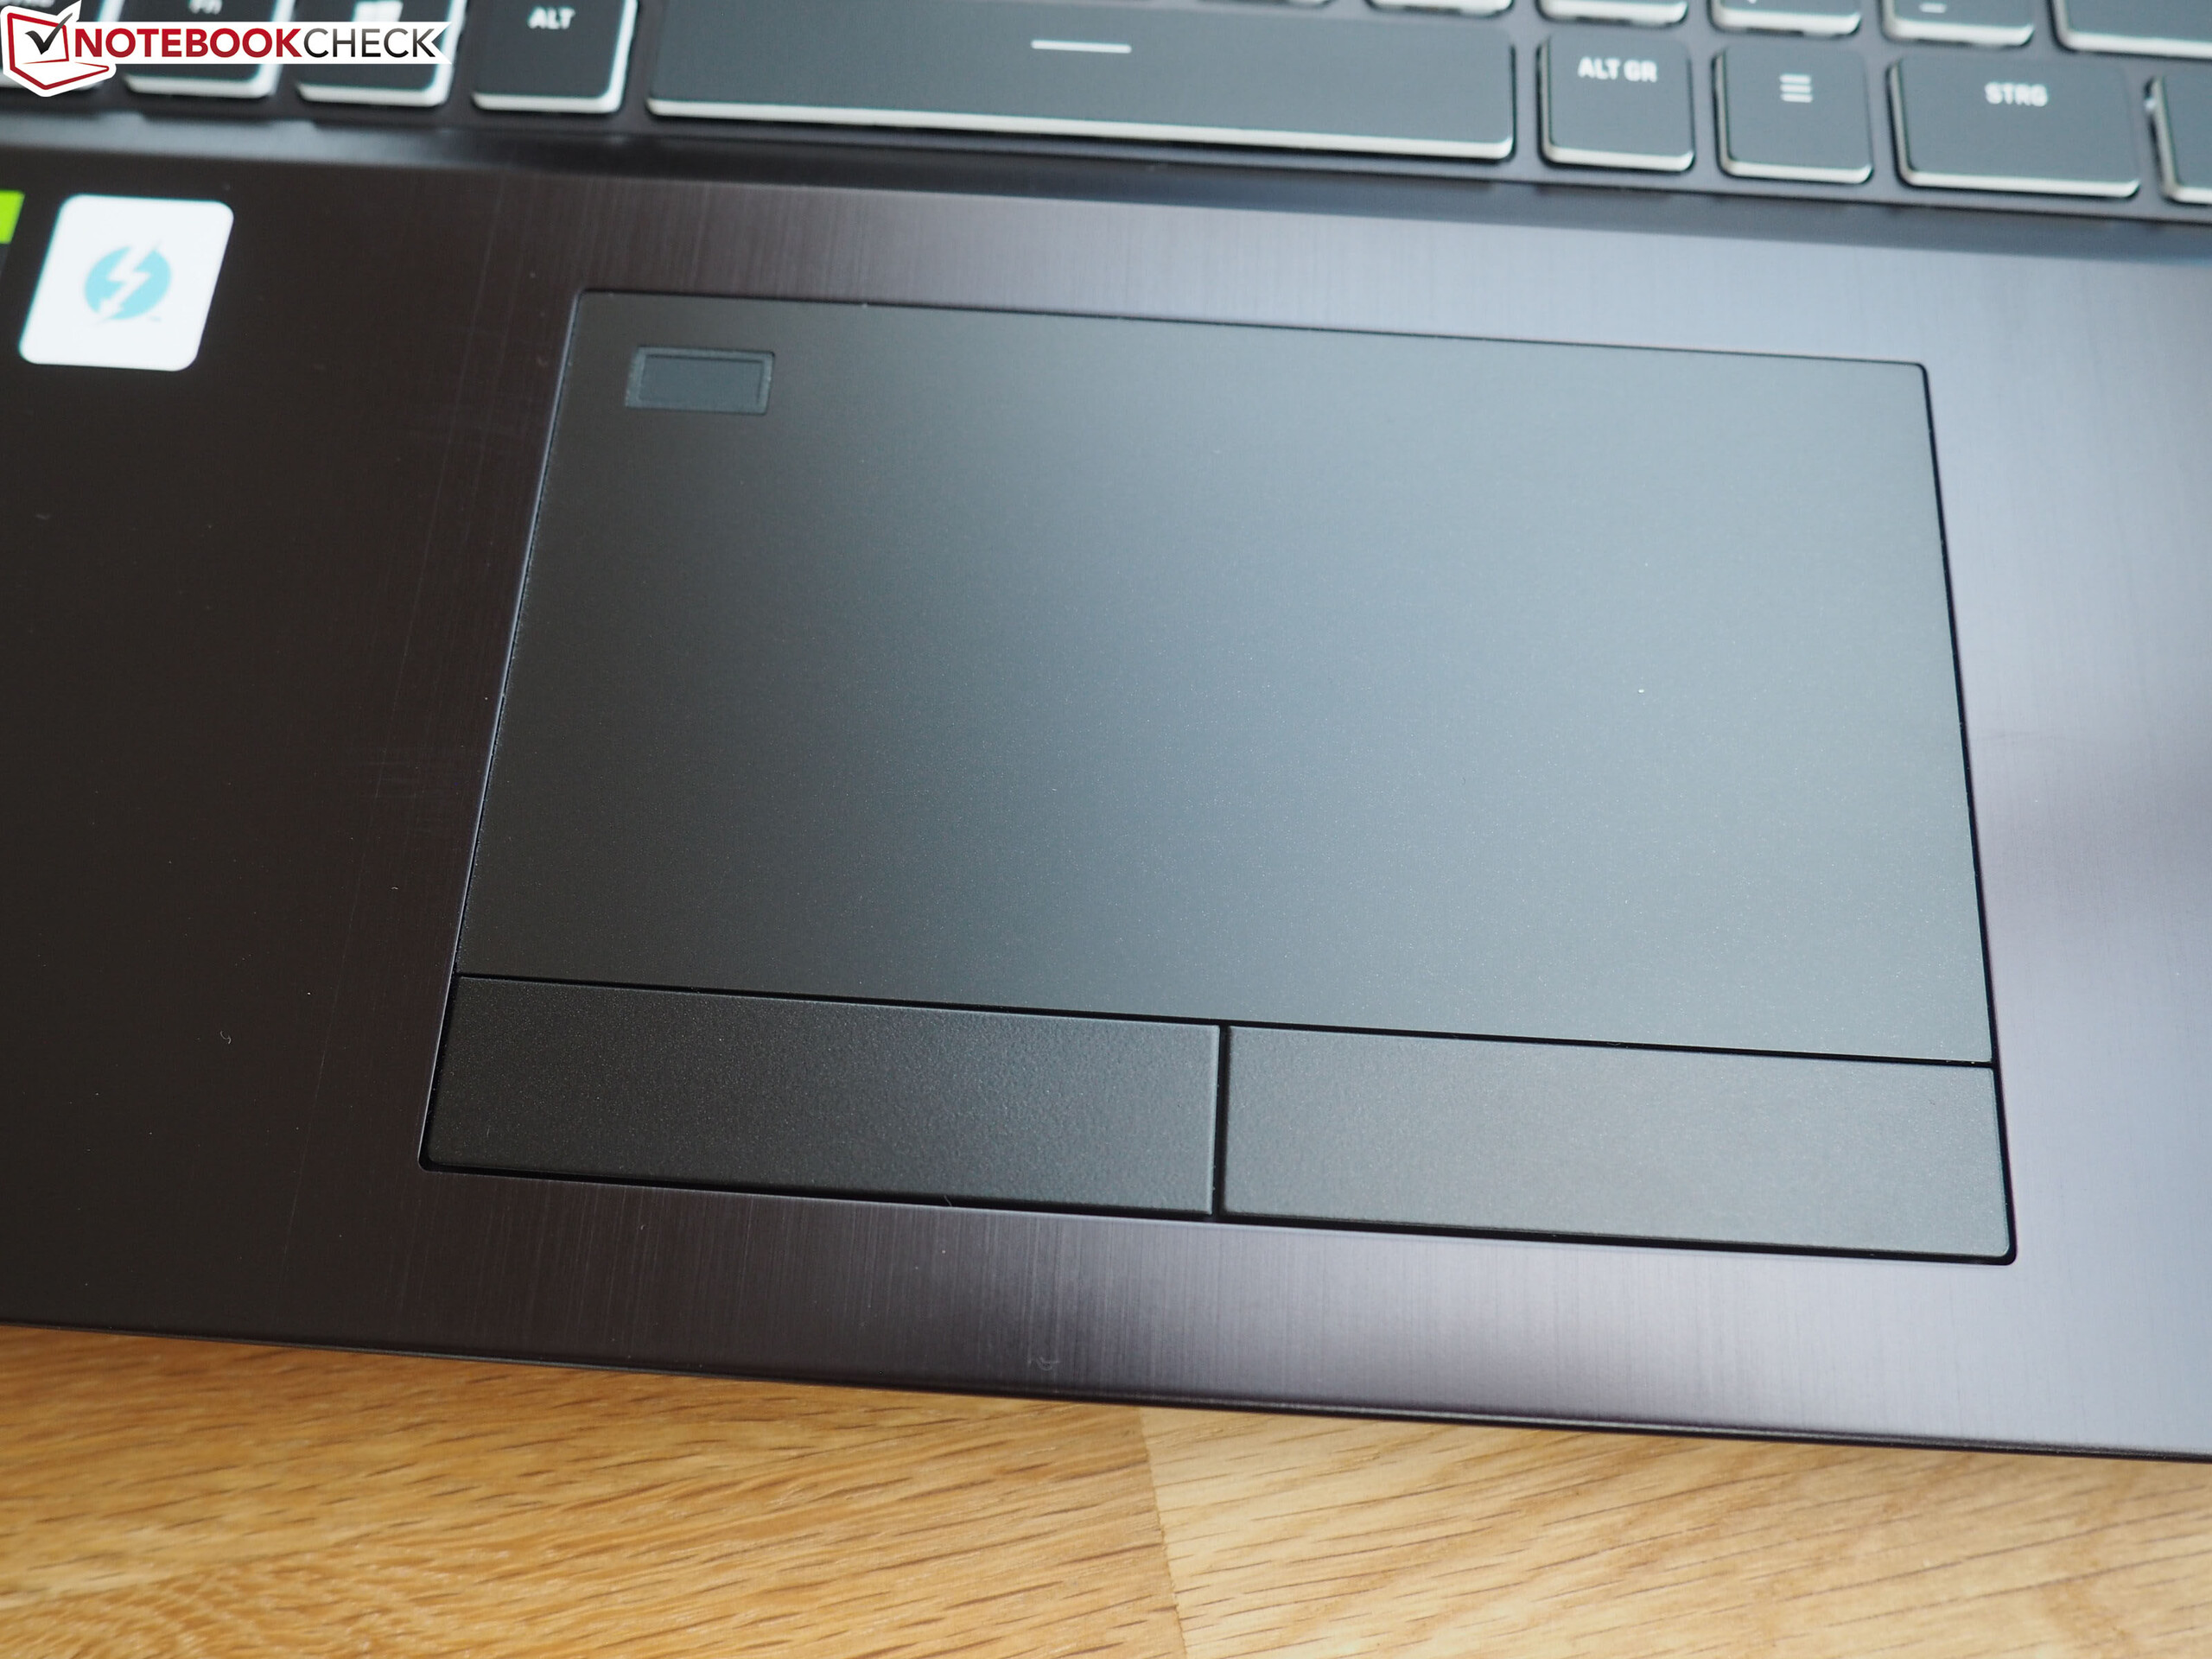
(+) Os apoios para as mãos e o touchpad são mais frios que a temperatura da pele, com um máximo de 31 °C / 87.8 F e, portanto, são frios ao toque.
(-) A temperatura média da área do apoio para as mãos de dispositivos semelhantes foi 28.8 °C / 83.8 F (-2.2 °C / -4 F).
| Schenker XMG Ultra 17 Comet Lake i9-10900K, GeForce RTX 2080 Super Mobile | MSI GT76 Titan DT 10SGS i9-10900K, GeForce RTX 2080 Super Mobile | Alienware m17 R3 P45E i9-10980HK, GeForce RTX 2080 Super Mobile | Asus Strix Scar 17 G732LXS i9-10980HK, GeForce RTX 2080 Super Mobile | Média da turma Gaming | |
|---|---|---|---|---|---|
| Heat | 8% | -26% | -10% | -4% | |
| Maximum Upper Side * (°C) | 39 | 36.4 7% | 54 -38% | 59 -51% | 45.2 ? -16% |
| Maximum Bottom * (°C) | 46 | 43 7% | 58.4 -27% | 52 -13% | 47.9 ? -4% |
| Idle Upper Side * (°C) | 32 | 28 12% | 40 -25% | 30 6% | 31.1 ? 3% |
| Idle Bottom * (°C) | 35 | 33.4 5% | 39.4 -13% | 29 17% | 34.2 ? 2% |
* ... menor é melhor
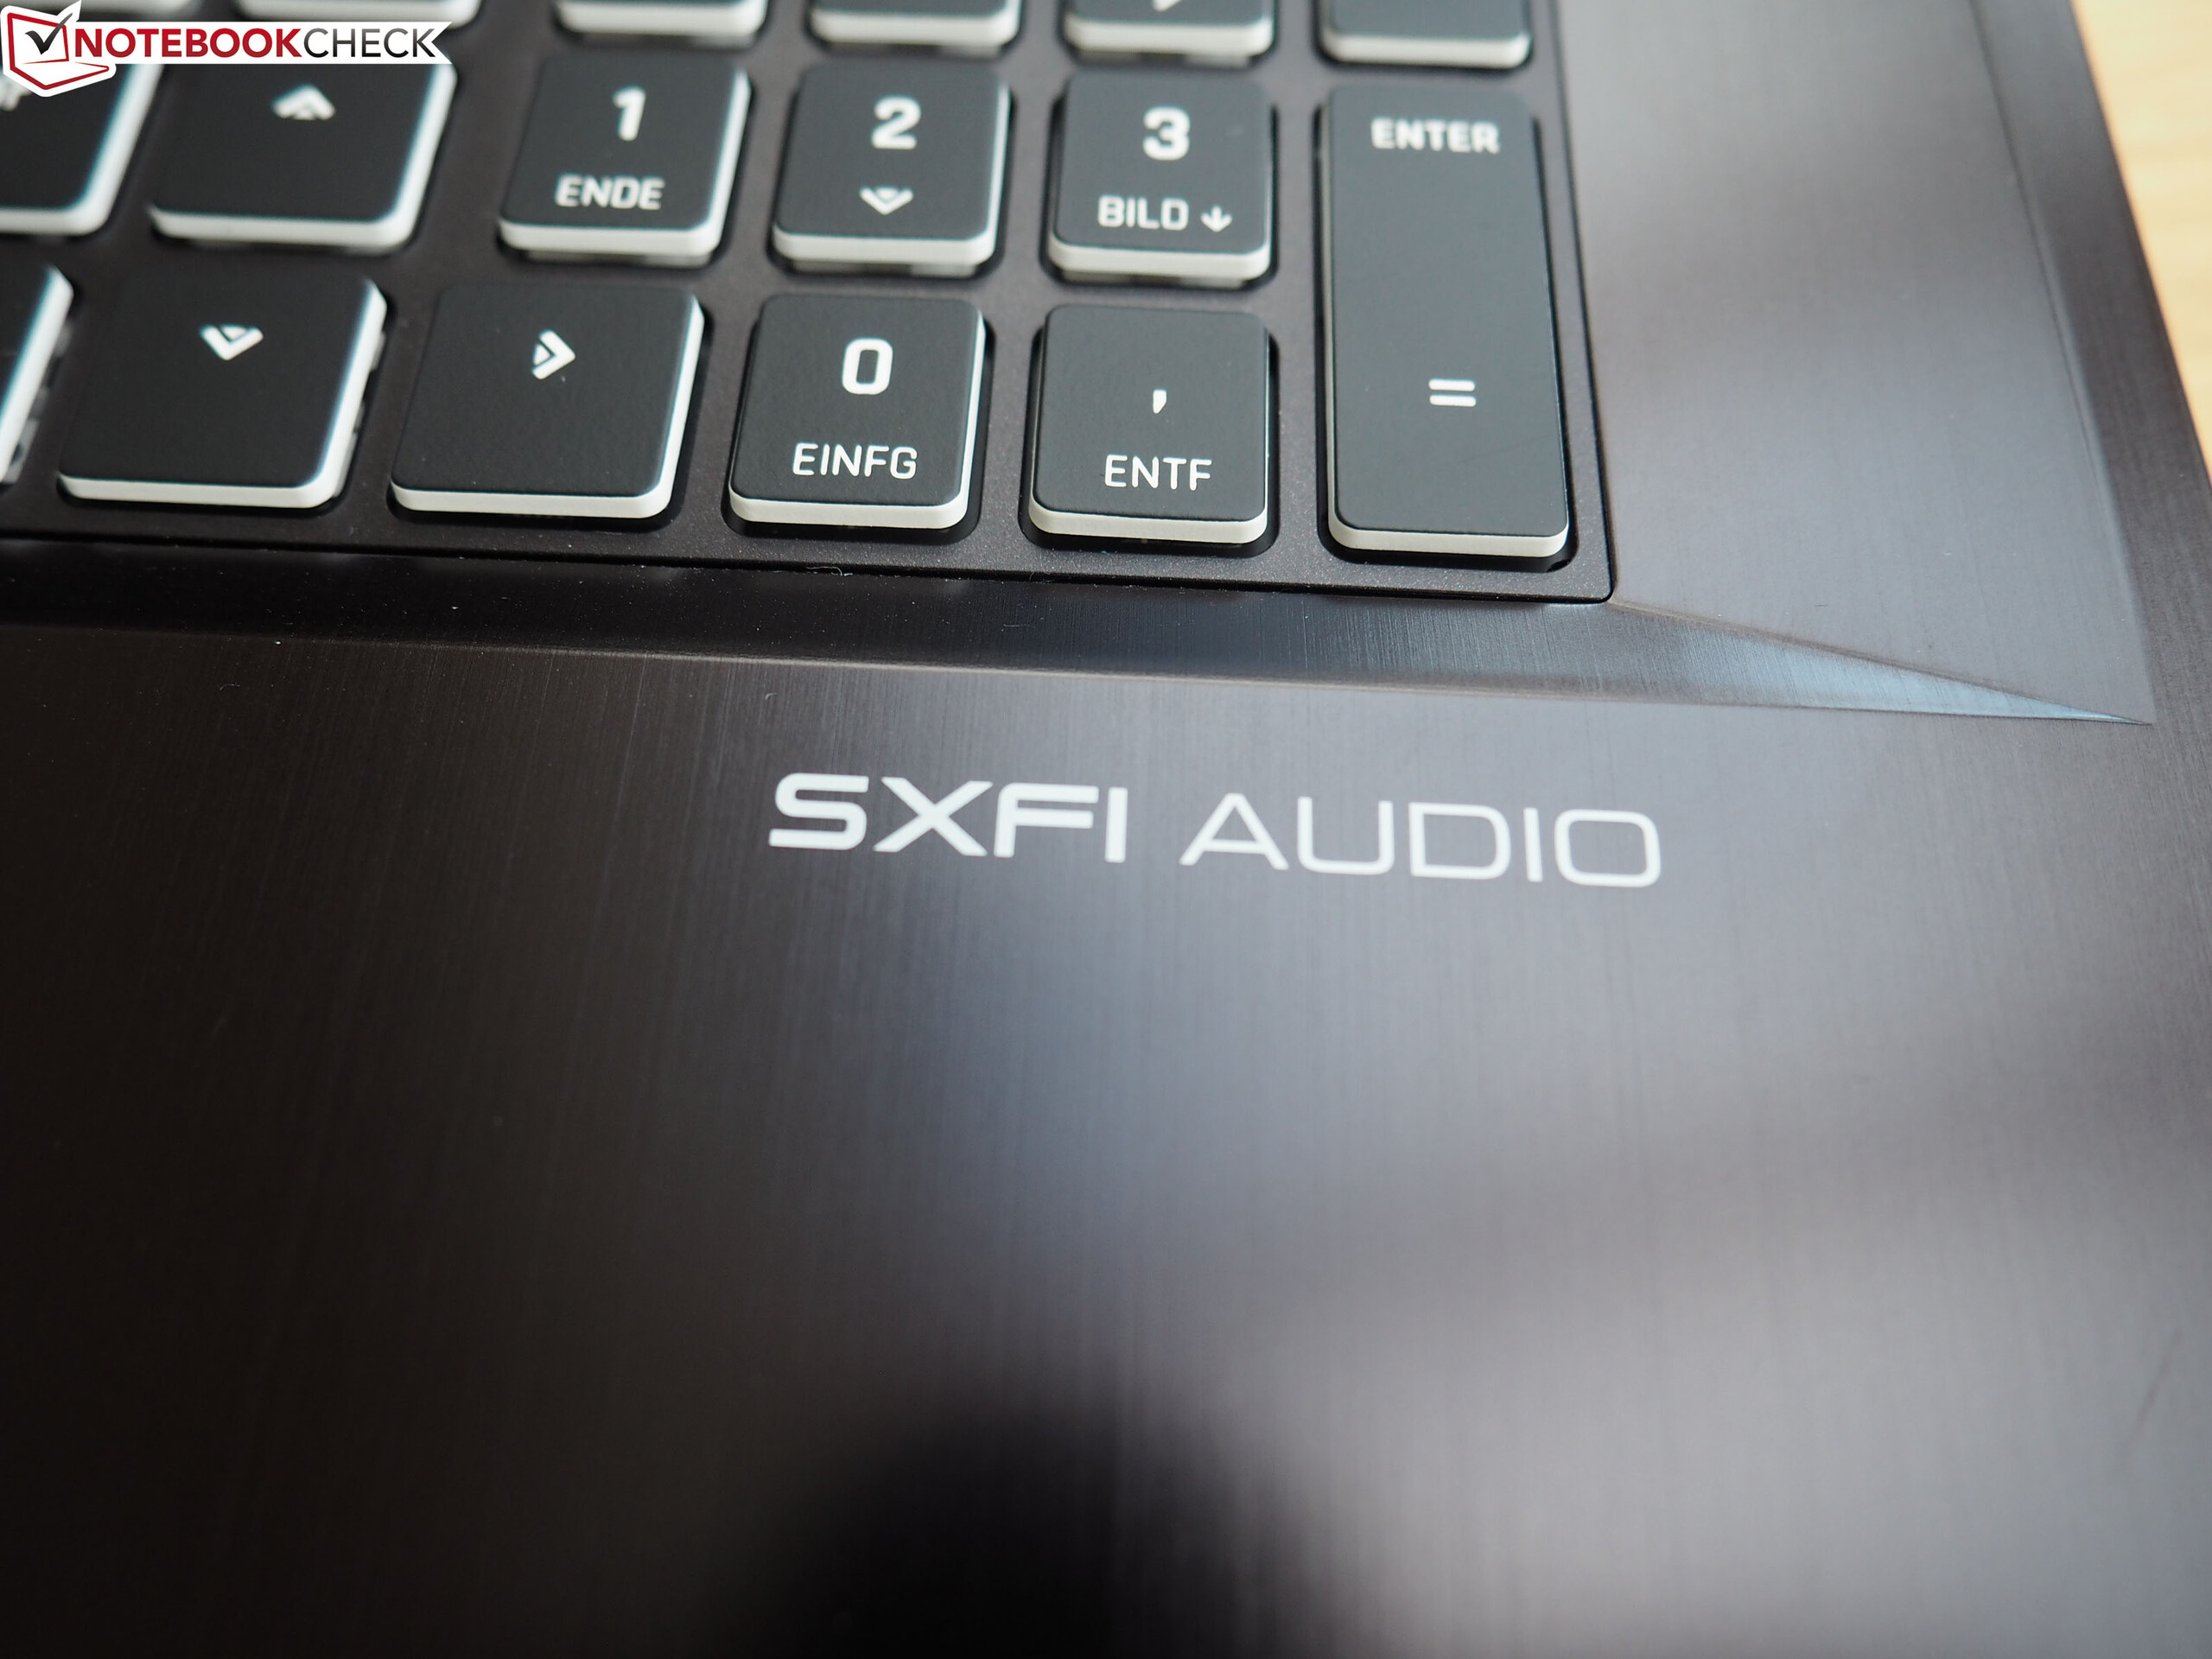
Schenker XMG Ultra 17 Comet Lake análise de áudio
(+) | os alto-falantes podem tocar relativamente alto (###valor### dB)
Graves 100 - 315Hz
(±) | graves reduzidos - em média 8.6% menor que a mediana
(±) | a linearidade dos graves é média (7% delta para a frequência anterior)
Médios 400 - 2.000 Hz
(+) | médios equilibrados - apenas 1.7% longe da mediana
(+) | médios são lineares (3% delta para frequência anterior)
Altos 2 - 16 kHz
(+) | agudos equilibrados - apenas 4.7% longe da mediana
(+) | os máximos são lineares (4.9% delta da frequência anterior)
Geral 100 - 16.000 Hz
(+) | o som geral é linear (9.8% diferença em relação à mediana)
Comparado com a mesma classe
» 5% de todos os dispositivos testados nesta classe foram melhores, 1% semelhantes, 94% piores
» O melhor teve um delta de 6%, a média foi 18%, o pior foi 132%
Comparado com todos os dispositivos testados
» 4% de todos os dispositivos testados foram melhores, 1% semelhantes, 95% piores
» O melhor teve um delta de 4%, a média foi 24%, o pior foi 134%
MSI GT76 Titan DT 10SGS análise de áudio
(+) | os alto-falantes podem tocar relativamente alto (###valor### dB)
Graves 100 - 315Hz
(±) | graves reduzidos - em média 8.6% menor que a mediana
(±) | a linearidade dos graves é média (11% delta para a frequência anterior)
Médios 400 - 2.000 Hz
(+) | médios equilibrados - apenas 3.1% longe da mediana
(+) | médios são lineares (6.9% delta para frequência anterior)
Altos 2 - 16 kHz
(+) | agudos equilibrados - apenas 3% longe da mediana
(+) | os máximos são lineares (5.5% delta da frequência anterior)
Geral 100 - 16.000 Hz
(+) | o som geral é linear (9.9% diferença em relação à mediana)
Comparado com a mesma classe
» 5% de todos os dispositivos testados nesta classe foram melhores, 2% semelhantes, 94% piores
» O melhor teve um delta de 6%, a média foi 18%, o pior foi 132%
Comparado com todos os dispositivos testados
» 4% de todos os dispositivos testados foram melhores, 1% semelhantes, 95% piores
» O melhor teve um delta de 4%, a média foi 24%, o pior foi 134%
| desligado | |
| Ocioso | |
| Carga |
|
Key:
min: | |
| Schenker XMG Ultra 17 Comet Lake i9-10900K, GeForce RTX 2080 Super Mobile | MSI GT76 Titan DT 10SGS i9-10900K, GeForce RTX 2080 Super Mobile | Alienware m17 R3 P45E i9-10980HK, GeForce RTX 2080 Super Mobile | Asus Strix Scar 17 G732LXS i9-10980HK, GeForce RTX 2080 Super Mobile | Média da turma Gaming | |
|---|---|---|---|---|---|
| Power Consumption | 6% | 4% | 26% | 46% | |
| Idle Minimum * (Watt) | 34 | 25.9 24% | 33.6 1% | 16 53% | 13.2 ? 61% |
| Idle Average * (Watt) | 40 | 38 5% | 43.9 -10% | 25 37% | 18.9 ? 53% |
| Idle Maximum * (Watt) | 47 | 53.2 -13% | 59 -26% | 35 26% | 24.3 ? 48% |
| Load Average * (Watt) | 130 | 123.8 5% | 134.9 -4% | 177 -36% | 108.3 ? 17% |
| Witcher 3 ultra * (Watt) | 318 | 312.5 2% | 242 24% | 227 29% | |
| Load Maximum * (Watt) | 512 | 459.8 10% | 320 37% | 280 45% | 254 ? 50% |
* ... menor é melhor
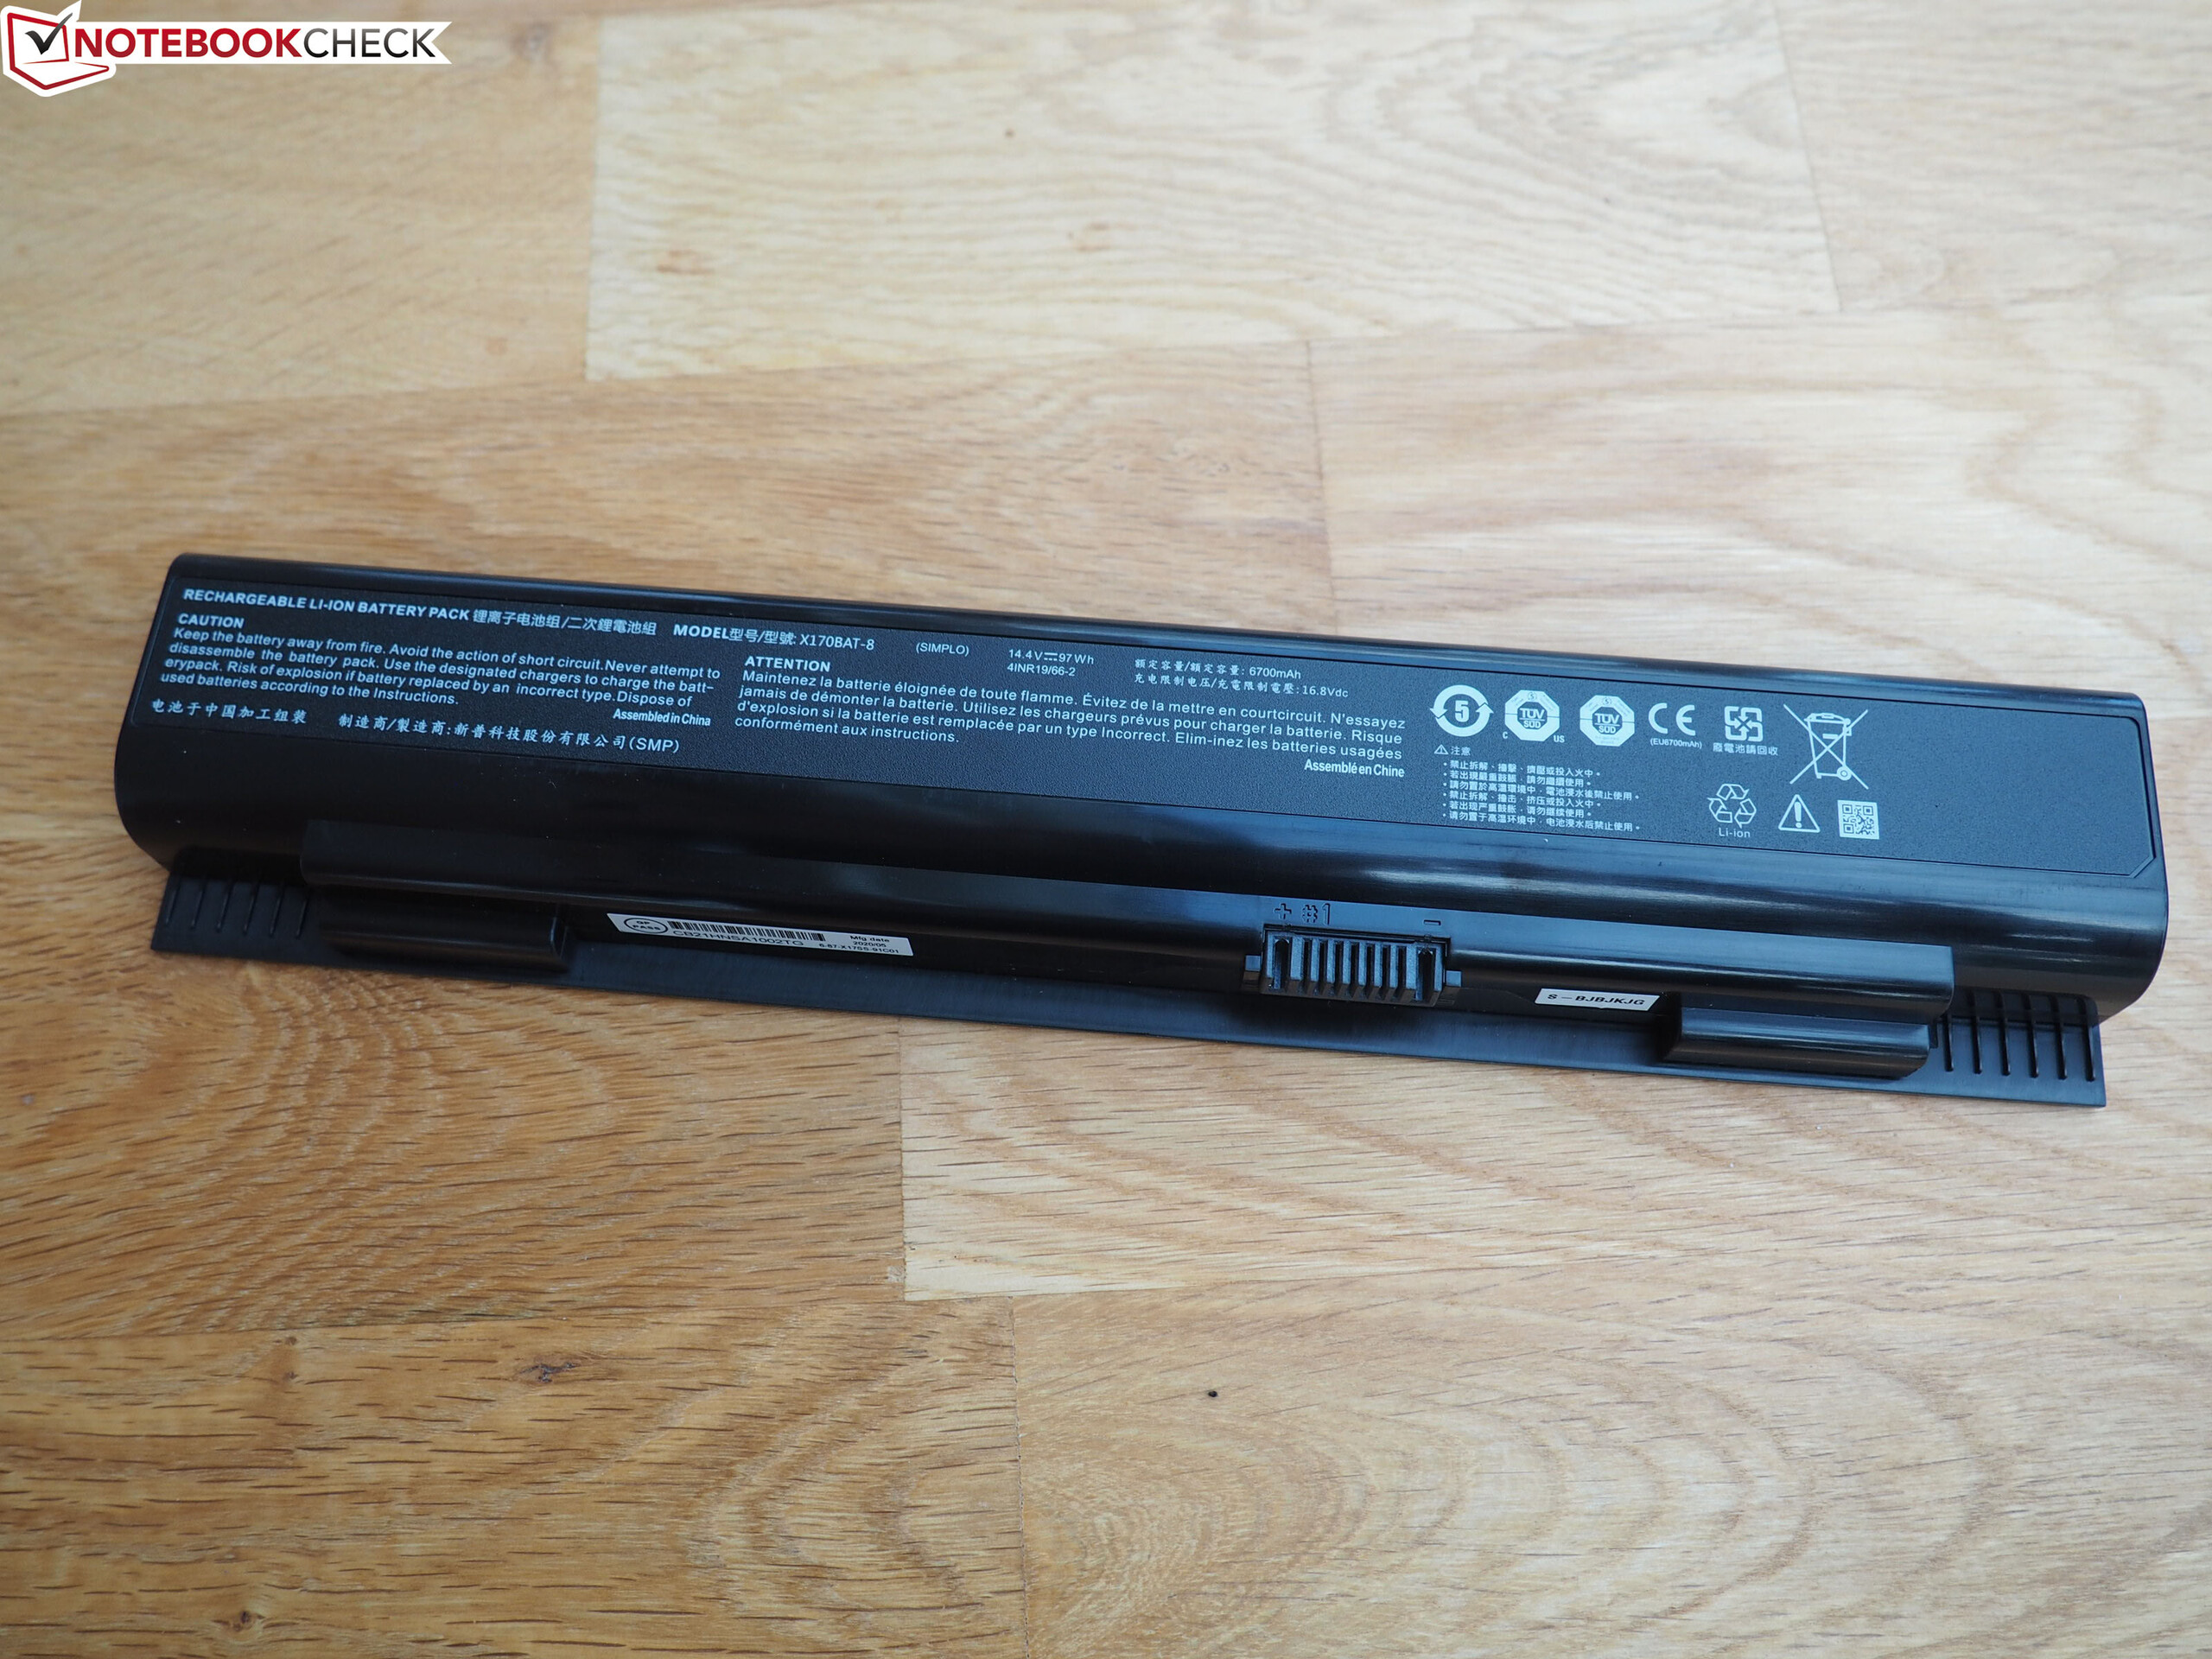
| Schenker XMG Ultra 17 Comet Lake i9-10900K, GeForce RTX 2080 Super Mobile, 97 Wh | MSI GT76 Titan DT 10SGS i9-10900K, GeForce RTX 2080 Super Mobile, 90 Wh | Alienware m17 R3 P45E i9-10980HK, GeForce RTX 2080 Super Mobile, 86 Wh | Asus Strix Scar 17 G732LXS i9-10980HK, GeForce RTX 2080 Super Mobile, 66 Wh | Média da turma Gaming | |
|---|---|---|---|---|---|
| Duração da bateria | -37% | -27% | 61% | 62% | |
| Reader / Idle (h) | 4.9 | 3.7 -24% | 10 104% | 8.71 ? 78% | |
| WiFi v1.3 (h) | 3.8 | 2.4 -37% | 3.2 -16% | 5.9 55% | 7.04 ? 85% |
| Load (h) | 1.2 | 0.7 -42% | 1.5 25% | 1.47 ? 23% |
Pro
Contra
O XMG Ultra 17 é um substituto de desktop em uma classe própria.
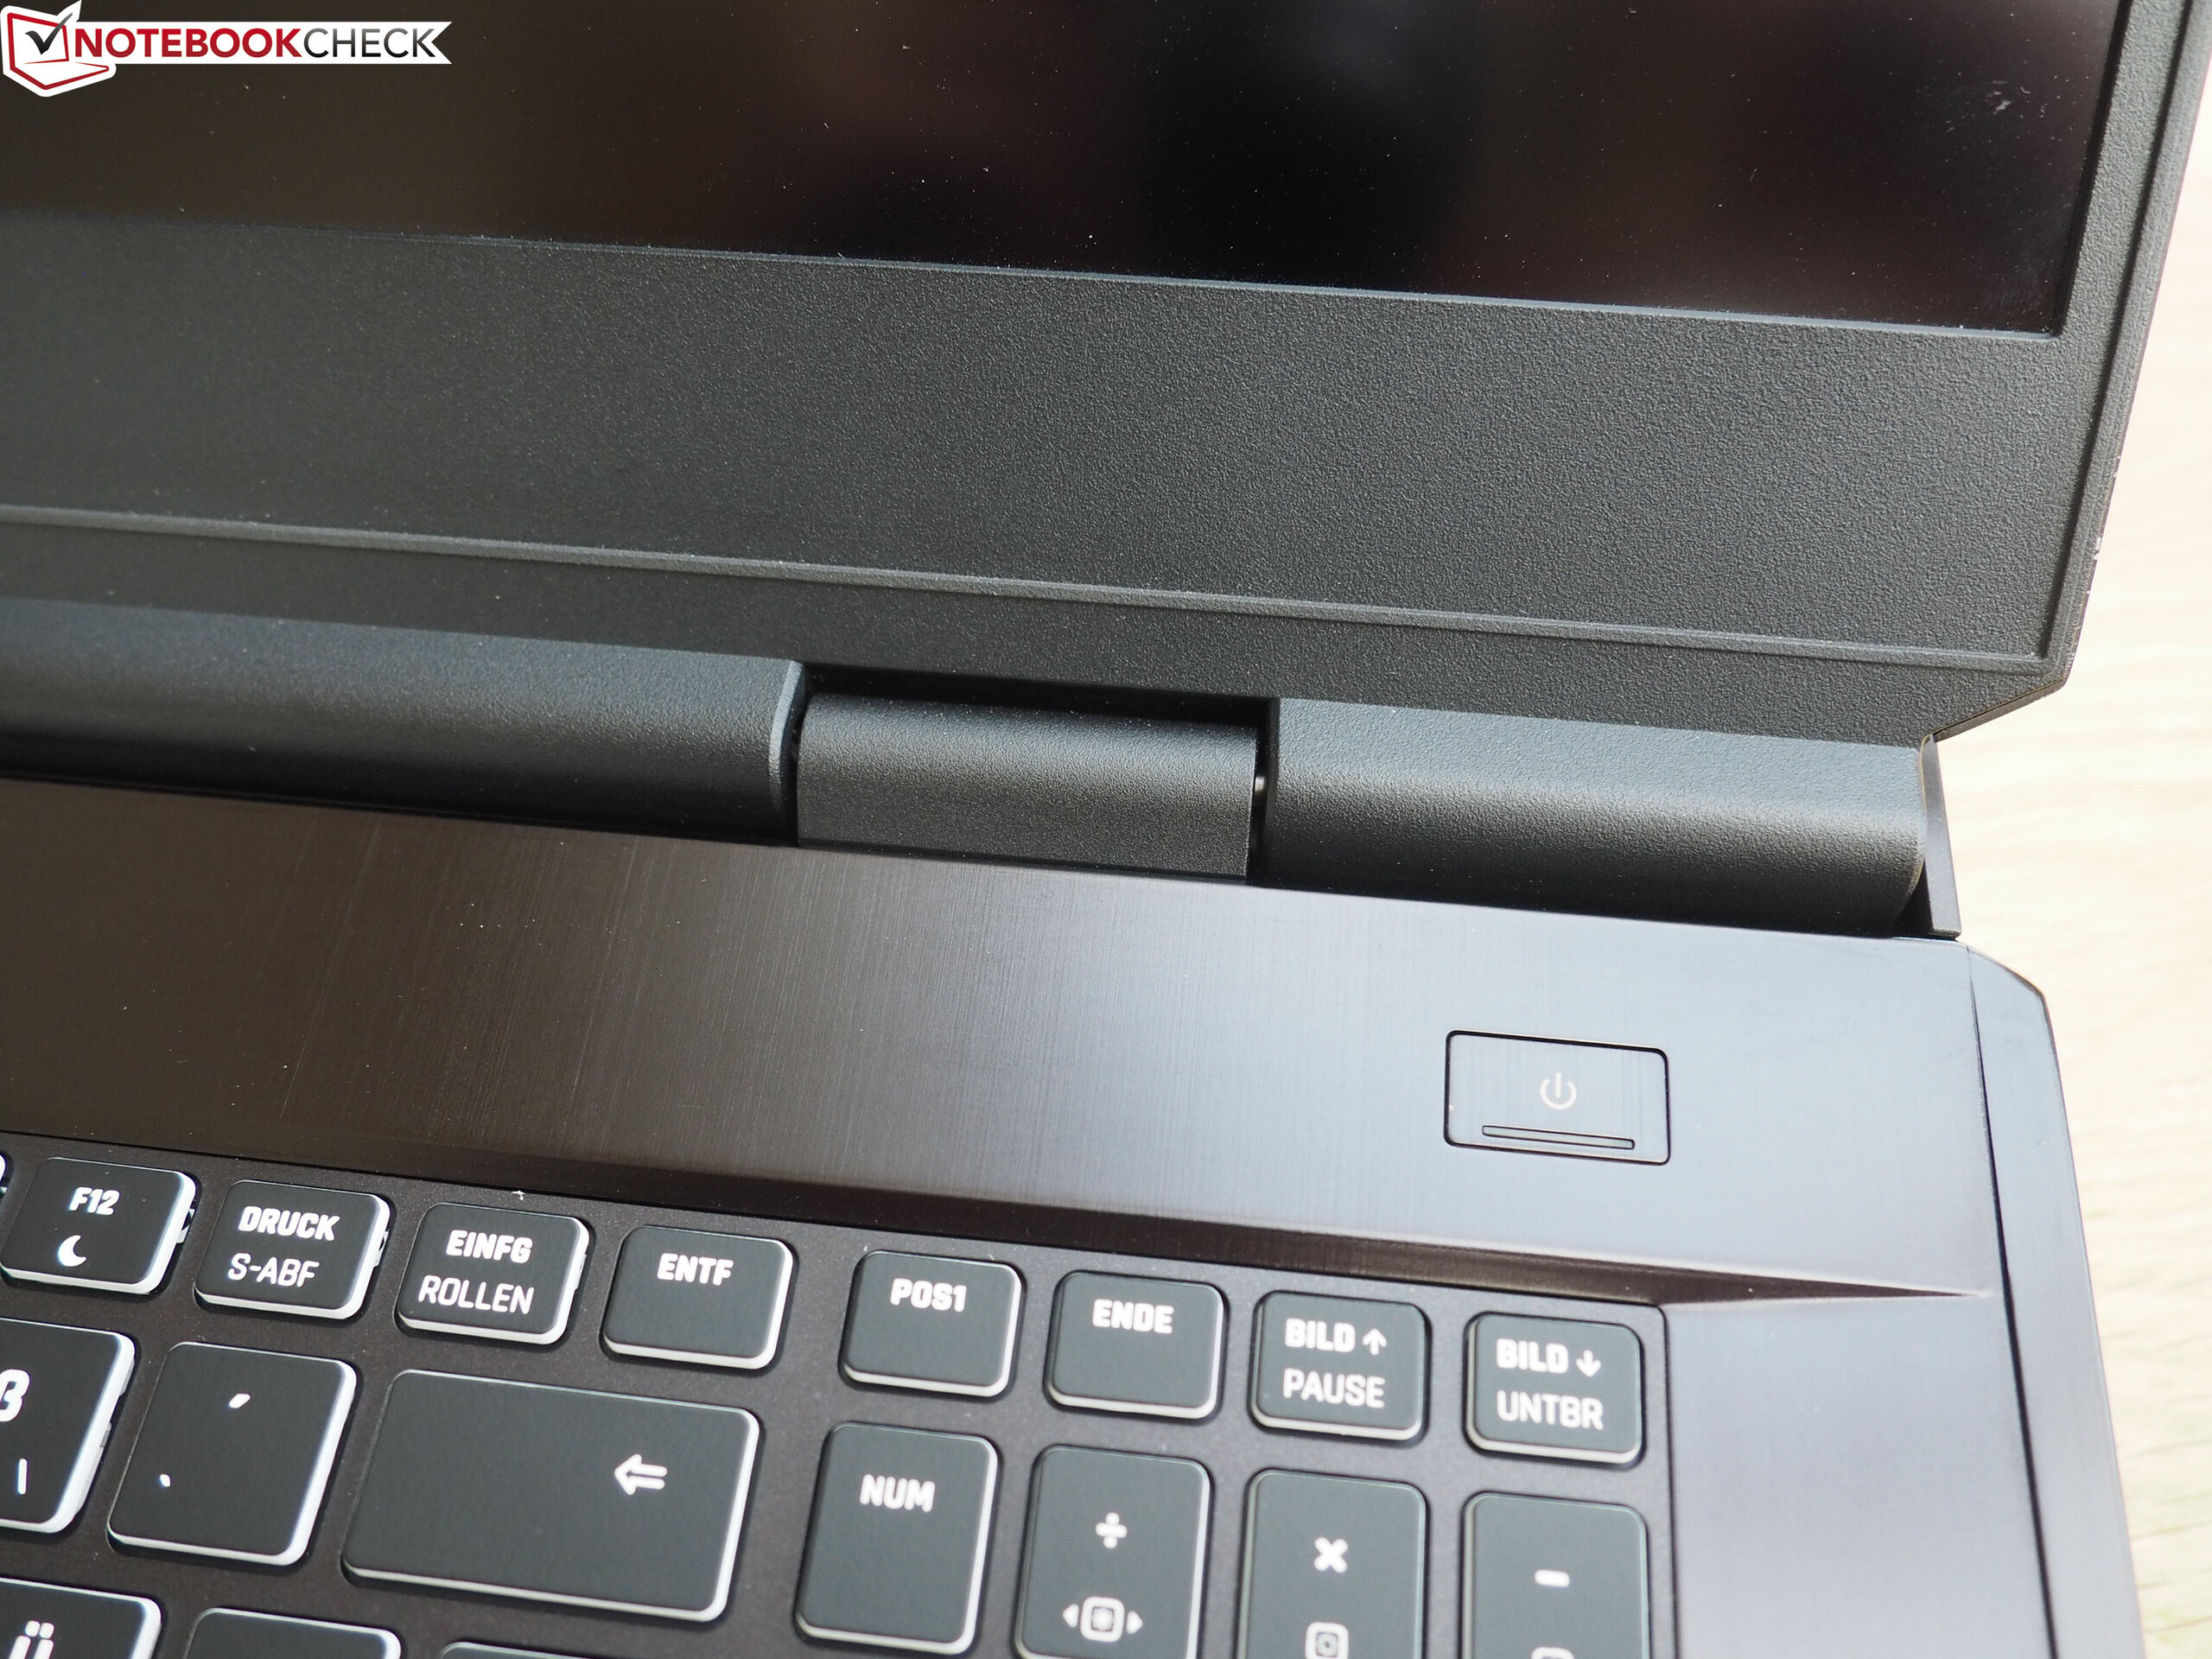
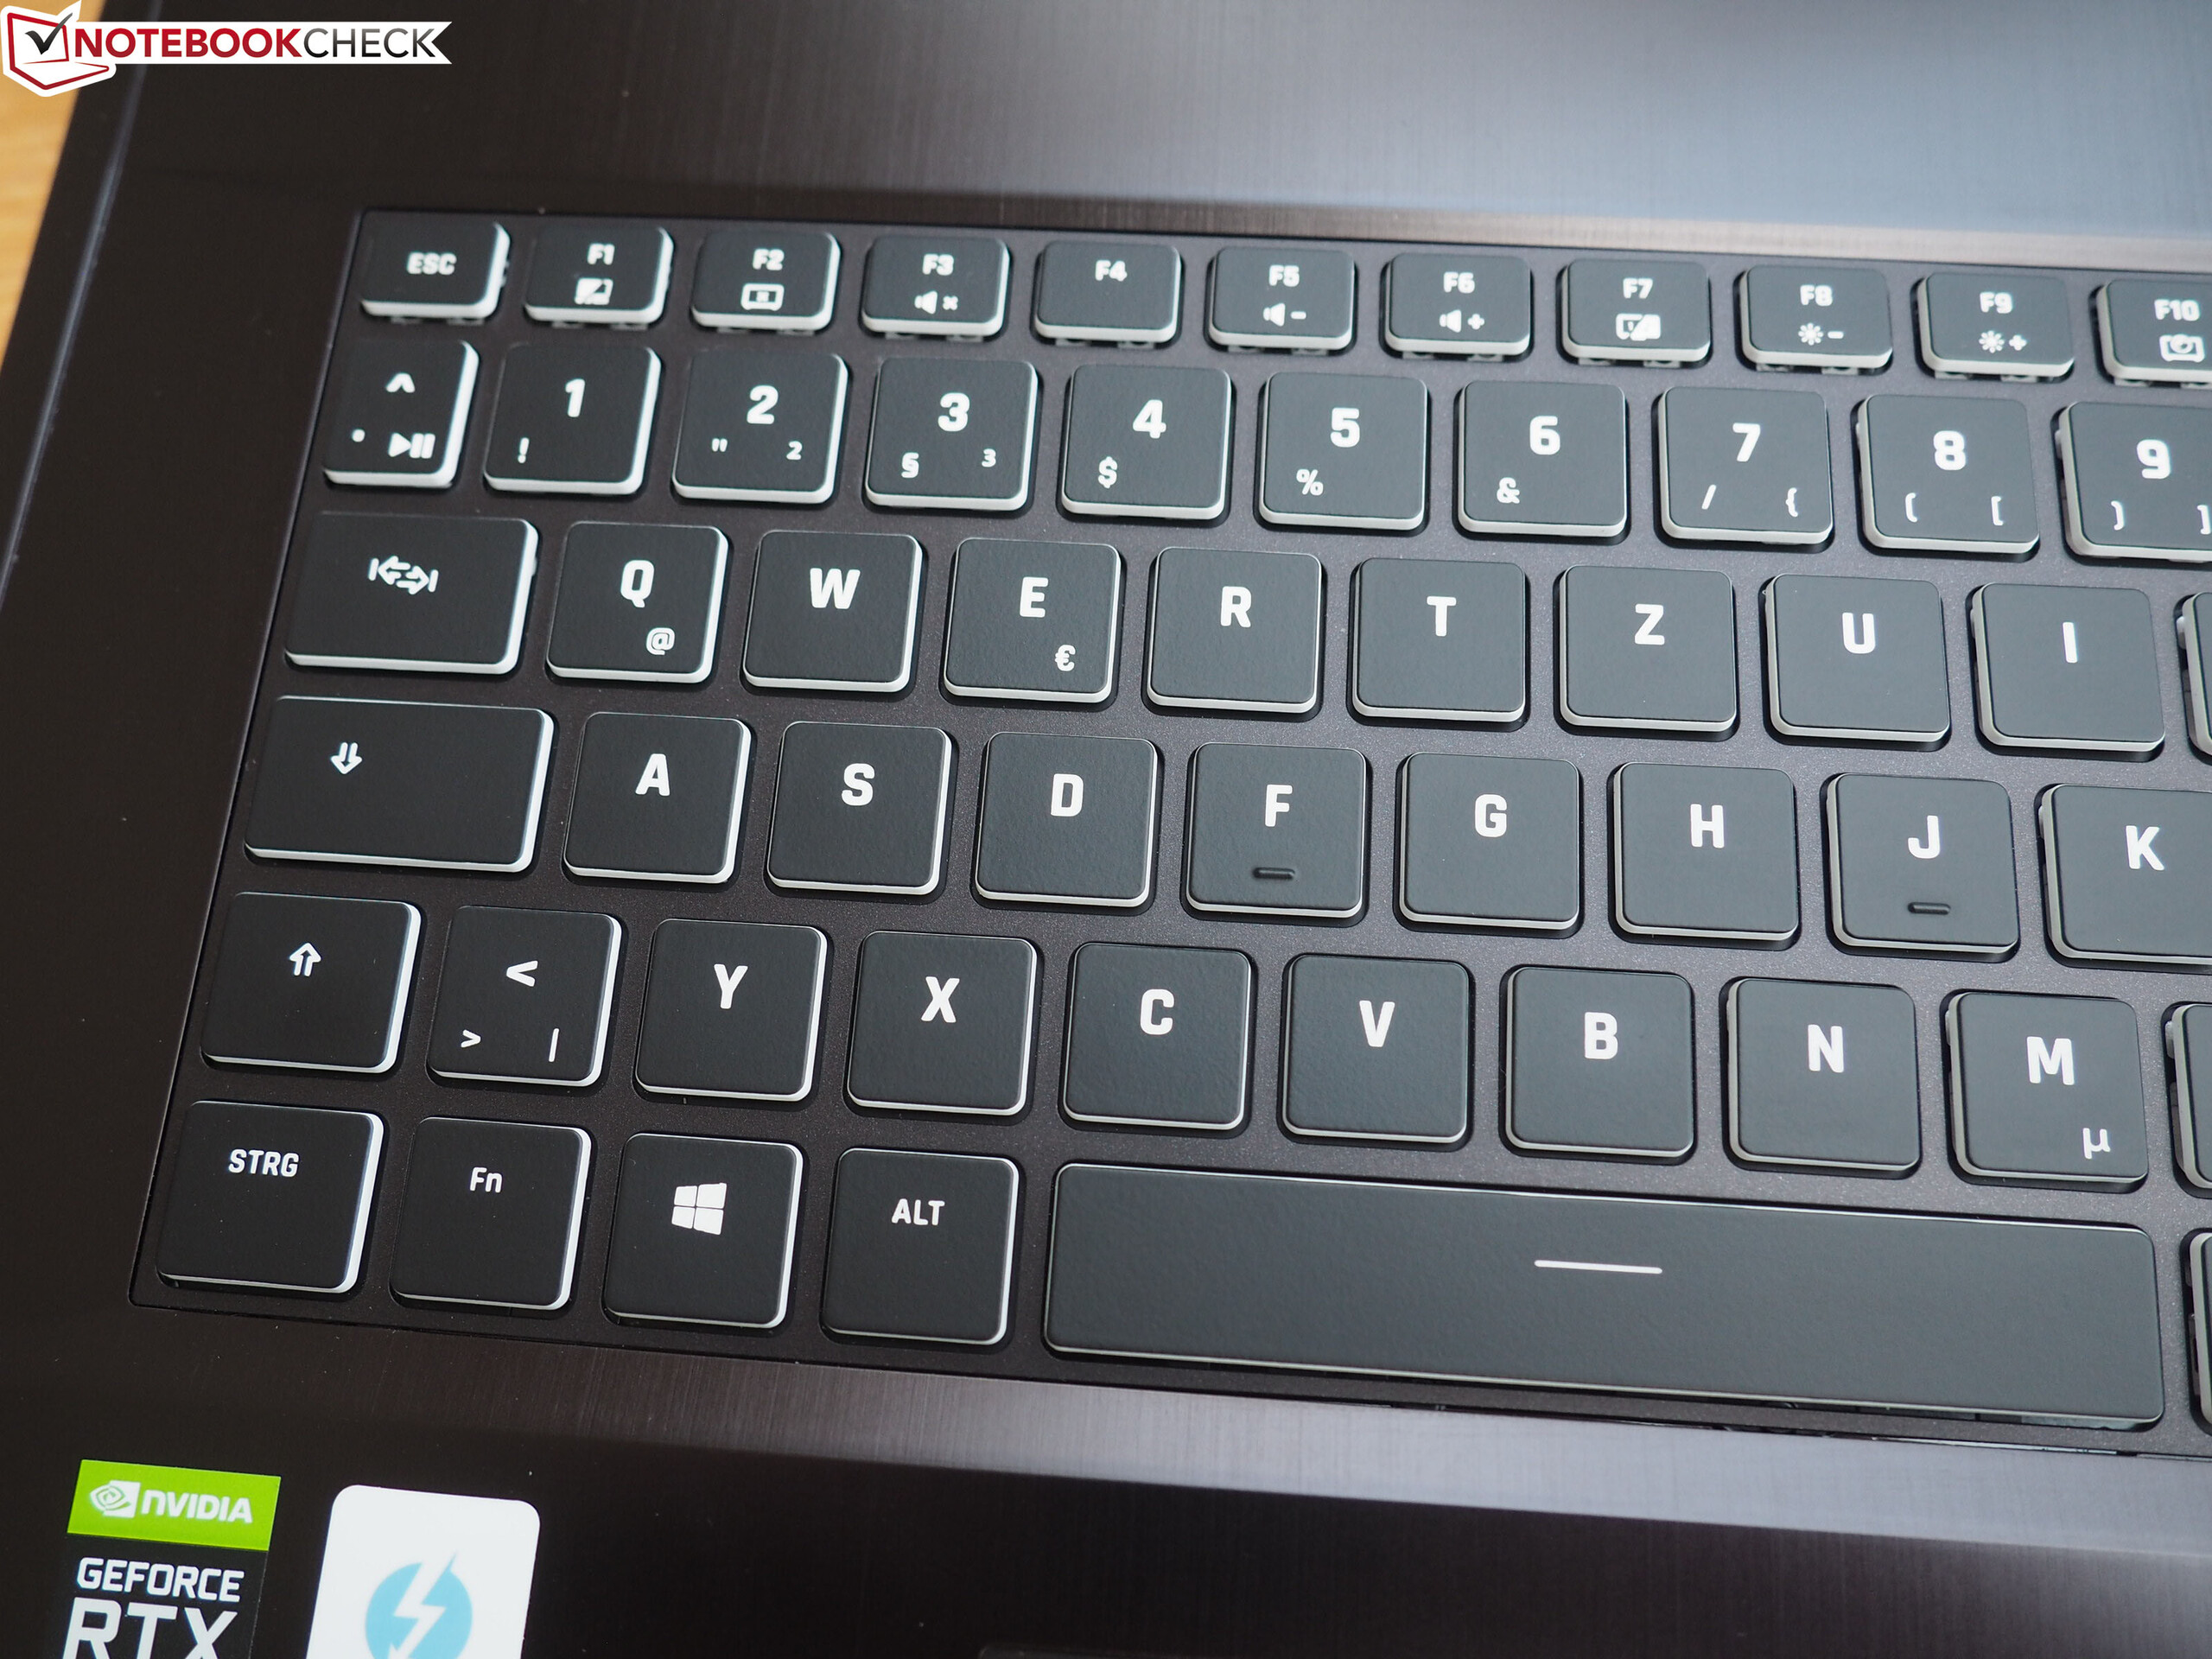
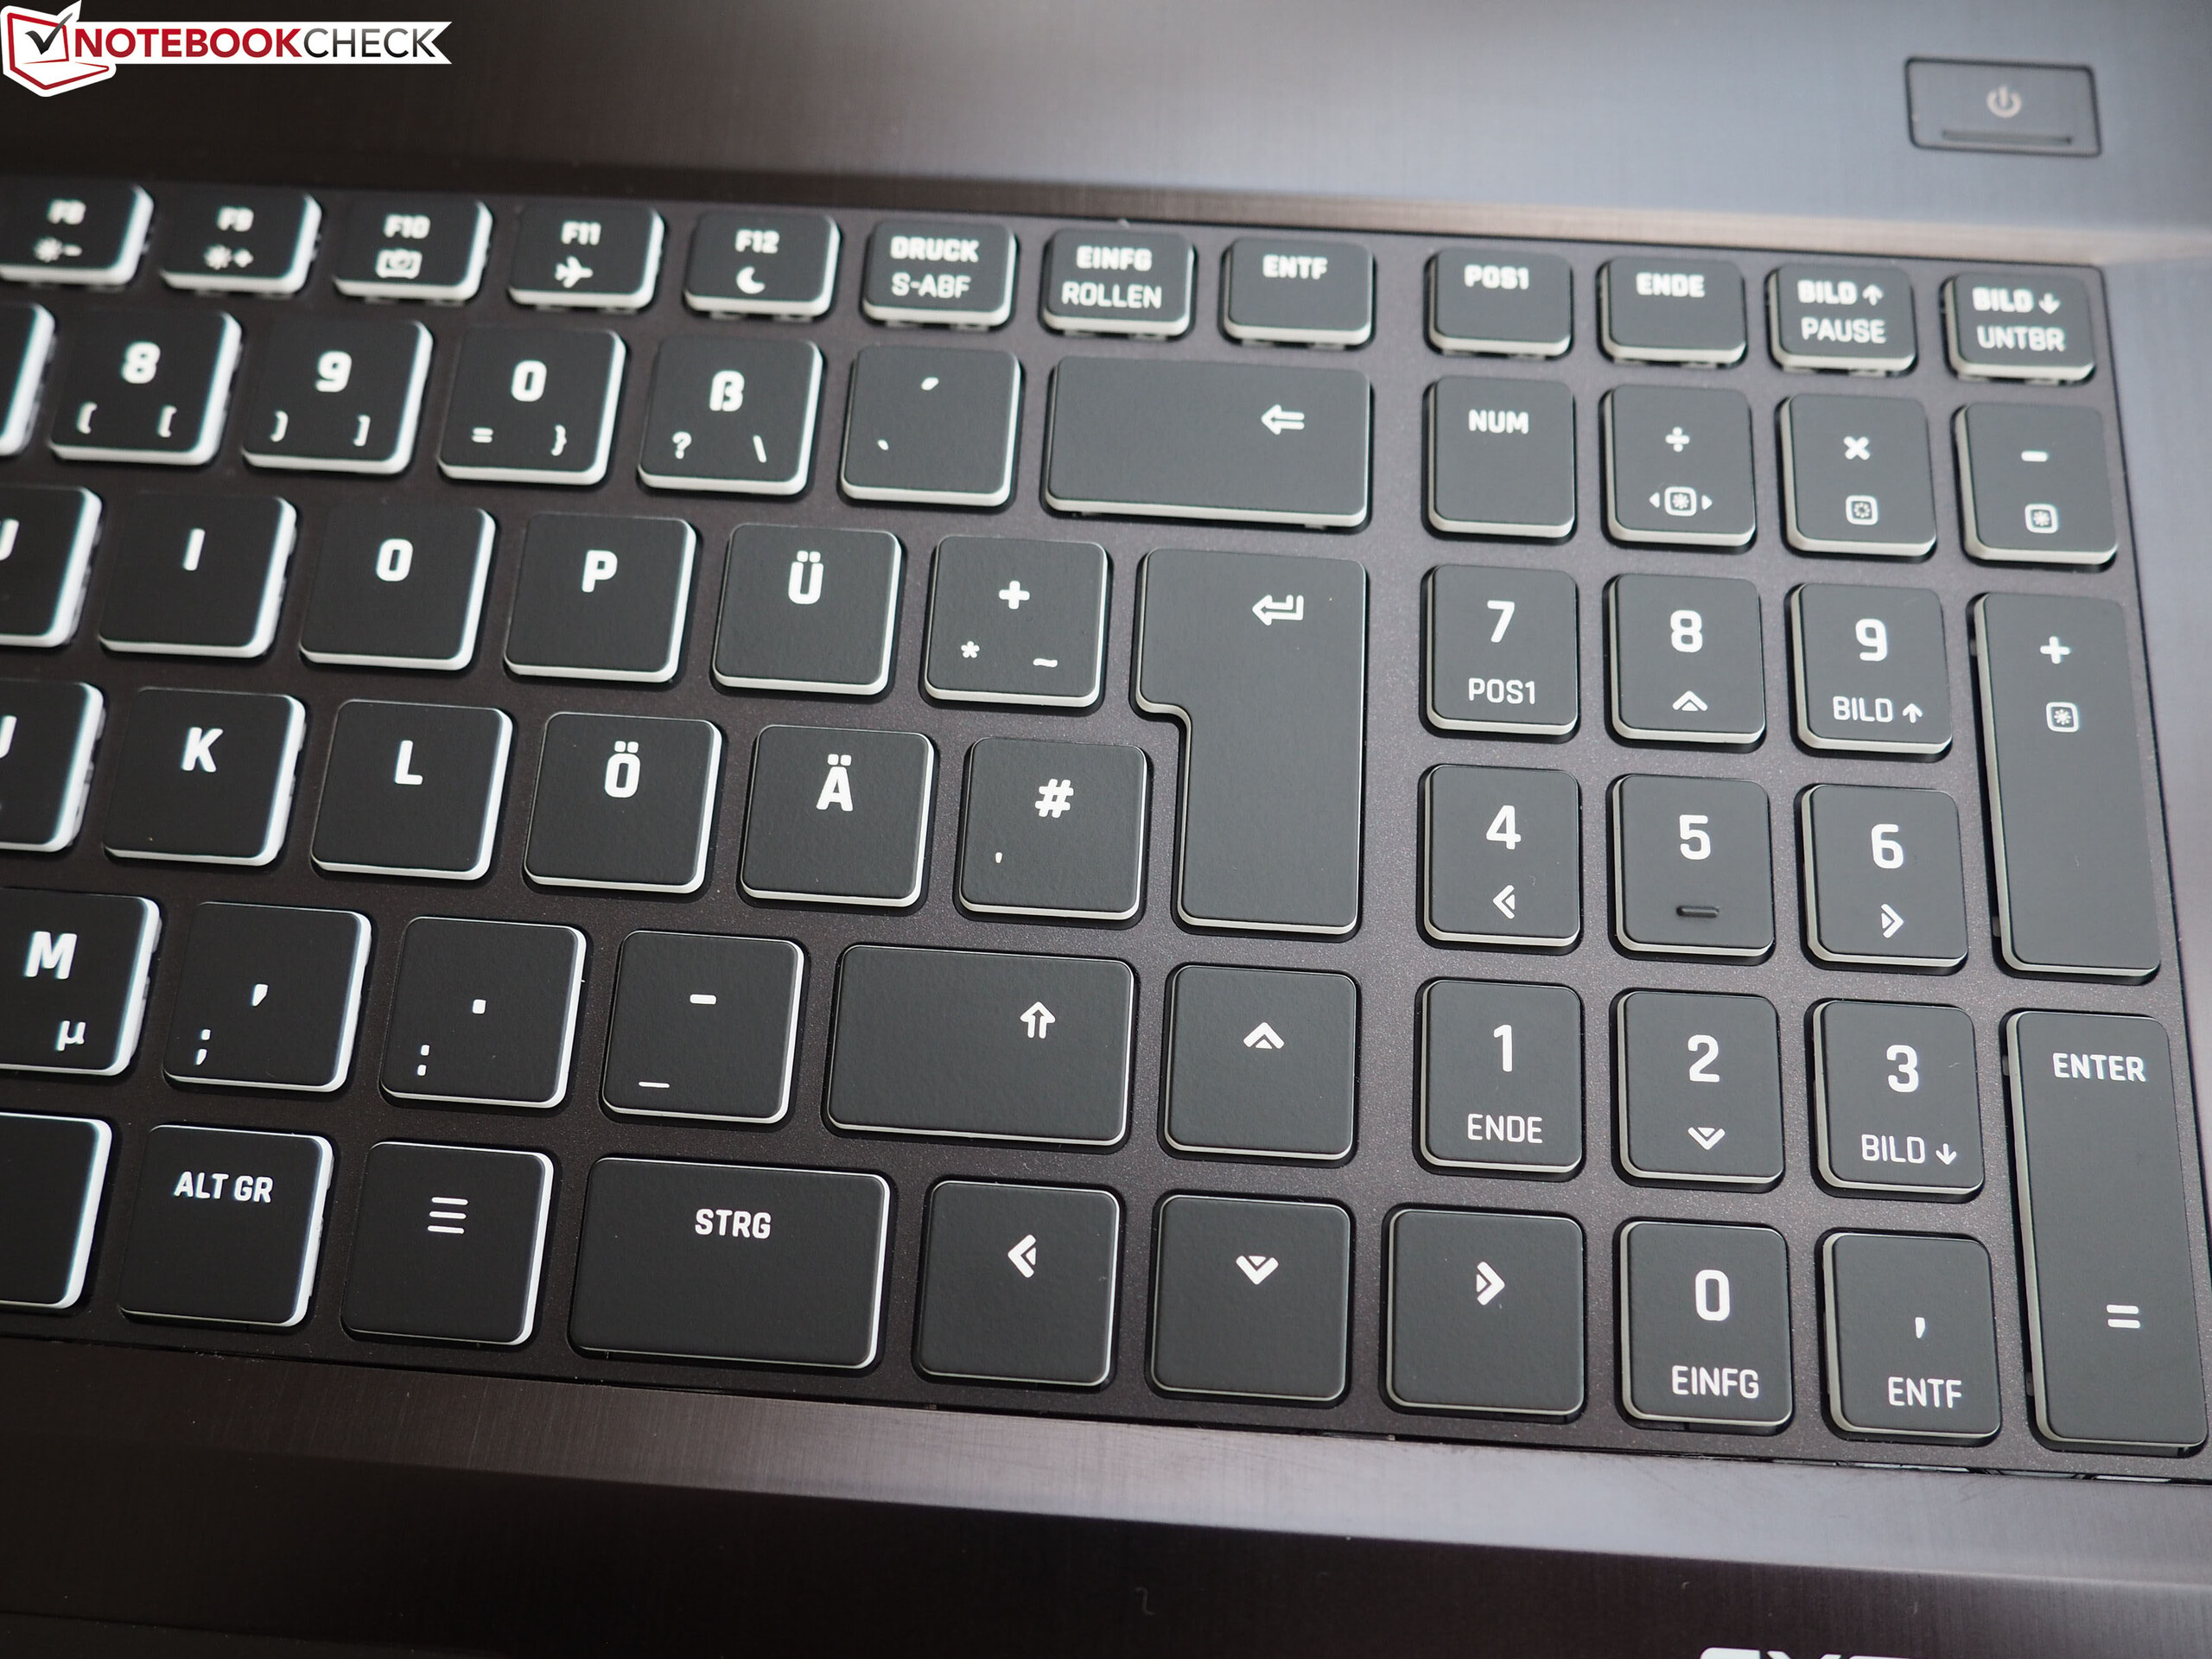
Potência de ponta em uma carcaça grande com muitas conexões: É assim que a Schenker deseja conquistar usuários famintos por poder, para os quais o dinheiro é uma consideração secundária. A tela UHD colorida (embora com tempos de resposta um pouco mais fracos) e os dispositivos de entrada também são agradáveis.
No entanto, você terá que dizer adeus à ideia de mobilidade. As grandes dimensões, o peso pesado e a duração relativamente curta da bateria prendem os usuários às suas mesas. No final, o XMG Ultra 17 foi projetado apenas para uso estacionário; isso levanta a questão de por que não se deve recorrer diretamente a um PC desktop real, que é mais barato e, acima de tudo, mais silencioso.
Schenker XMG Ultra 17 Comet Lake
- 10/13/2020 v7 (old)
Florian Glaser
Price comparison