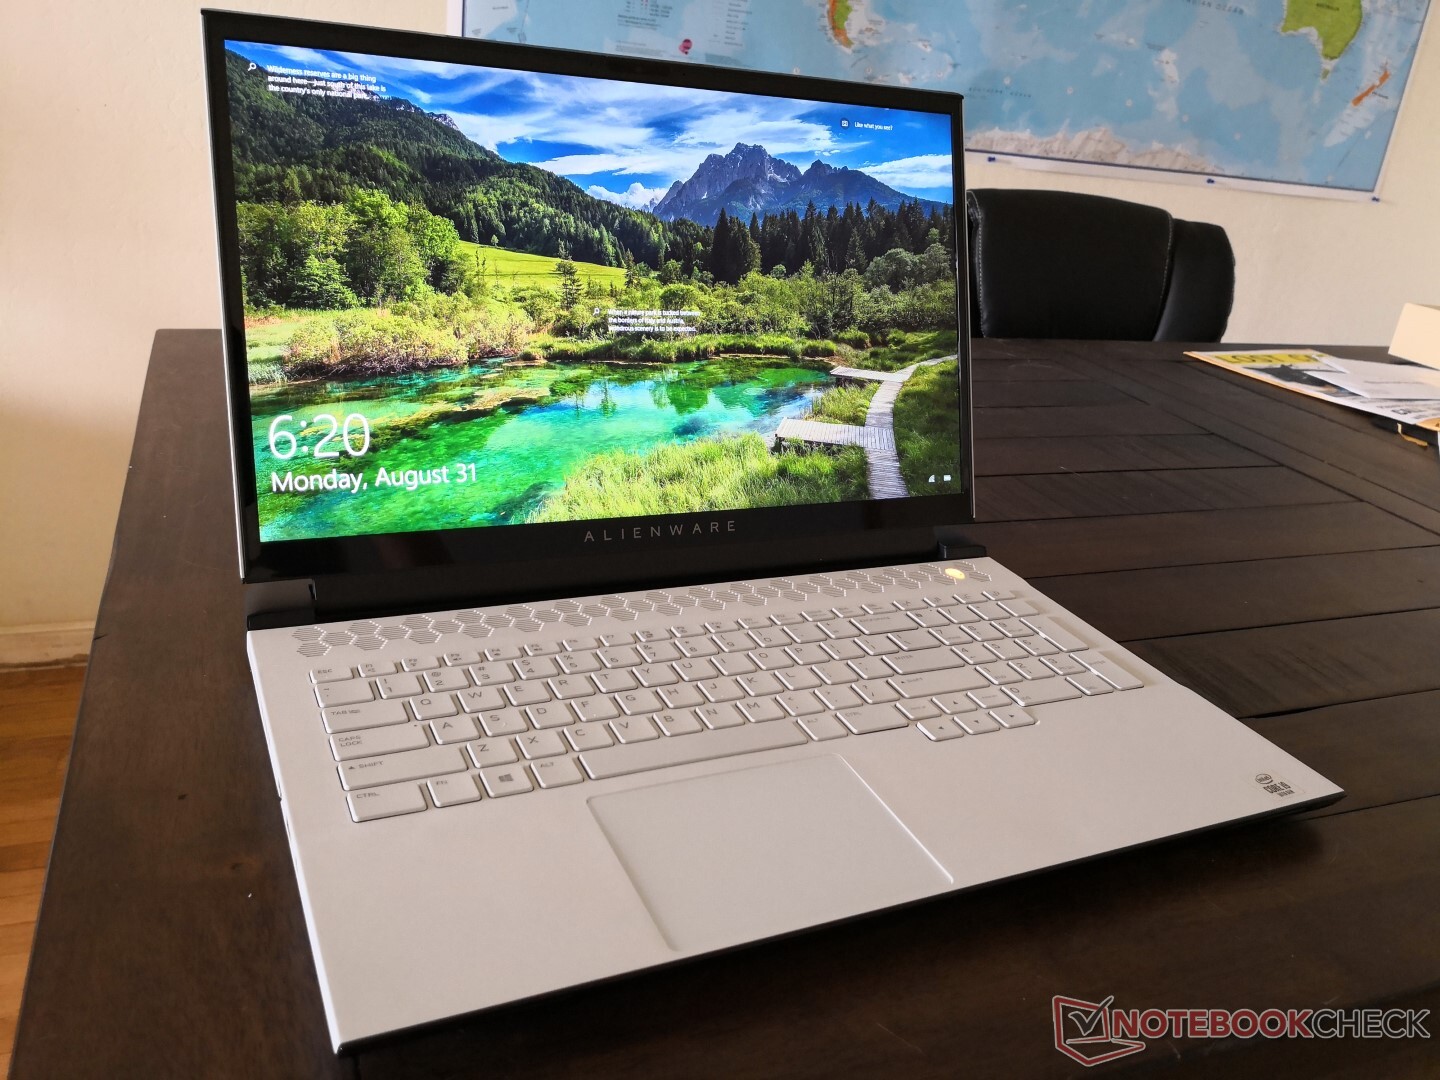
Adeus, Max-Q: Breve Análise do Super Portátil Dell Alienware m17 R3 GeForce RTX 2080
Avaliação | Data | Modelo | Peso | Altura | Size | Resolução | Preço |
|---|---|---|---|---|---|---|---|
| 85.3 % v7 (old) | 09/2020 | Alienware m17 R3 P45E i9-10980HK, GeForce RTX 2080 Super Mobile | 3 kg | 20.7 mm | 17.30" | 1920x1080 | |
| 84.3 % v7 (old) | Eluktronics RP-17 R7 4800H, GeForce RTX 2060 Mobile | 2.6 kg | 30 mm | 17.30" | 1920x1080 | ||
| 83.7 % v7 (old) | 08/2020 | MSI GS75 10SF-609US i7-10875H, GeForce RTX 2070 Max-Q | 2.3 kg | 18.9 mm | 17.30" | 1920x1080 | |
| 82.7 % v7 (old) | 07/2020 | Asus Strix Scar 17 G732LXS i9-10980HK, GeForce RTX 2080 Super Mobile | 2.9 kg | 26.5 mm | 17.30" | 1920x1080 | |
| 85.1 % v7 (old) | 07/2020 | MSI GE75 Raider 10SE-008US i7-10750H, GeForce RTX 2060 Mobile | 2.6 kg | 27.5 mm | 17.30" | 1920x1080 | |
| 87.4 % v7 (old) | 06/2020 | Razer Blade Pro 17 RTX 2070 Max-Q 300 Hz i7-10875H, GeForce RTX 2070 Max-Q | 2.7 kg | 19.9 mm | 17.30" | 1920x1080 |
| SD Card Reader | |
| average JPG Copy Test (av. of 3 runs) | |
| Alienware m17 R3 P45E (Toshiba Exceria Pro M501 UHS-II) | |
| Razer Blade Pro 17 RTX 2070 Max-Q 300 Hz (Toshiba Exceria Pro SDXC 64 GB UHS-II) | |
| MSI GS75 10SF-609US (Toshiba Exceria Pro M501 UHS-II) | |
| Eluktronics RP-17 (Toshiba Exceria Pro SDXC 64 GB UHS-II) | |
| MSI GE75 Raider 10SE-008US (Toshiba Exceria Pro SDXC 64 GB UHS-II) | |
| maximum AS SSD Seq Read Test (1GB) | |
| Alienware m17 R3 P45E (Toshiba Exceria Pro M501 UHS-II) | |
| MSI GS75 10SF-609US (Toshiba Exceria Pro M501 UHS-II) | |
| Razer Blade Pro 17 RTX 2070 Max-Q 300 Hz (Toshiba Exceria Pro SDXC 64 GB UHS-II) | |
| Eluktronics RP-17 (Toshiba Exceria Pro SDXC 64 GB UHS-II) | |
| MSI GE75 Raider 10SE-008US (Toshiba Exceria Pro SDXC 64 GB UHS-II) | |
| Networking | |
| iperf3 transmit AX12 | |
| MSI GE75 Raider 10SE-008US | |
| Razer Blade Pro 17 RTX 2070 Max-Q 300 Hz | |
| MSI GS75 10SF-609US | |
| Eluktronics RP-17 | |
| Alienware m17 R3 P45E | |
| Asus Strix Scar 17 G732LXS | |
| iperf3 receive AX12 | |
| Eluktronics RP-17 | |
| Alienware m17 R3 P45E | |
| MSI GE75 Raider 10SE-008US | |
| Asus Strix Scar 17 G732LXS | |
| Razer Blade Pro 17 RTX 2070 Max-Q 300 Hz | |
| MSI GS75 10SF-609US | |

")
")
| |||||||||||||||||||||||||
iluminação: 91 %
iluminação com acumulador: 338.3 cd/m²
Contraste: 1253:1 (Preto: 0.27 cd/m²)
ΔE ColorChecker Calman: 1.88 | ∀{0.5-29.43 Ø4.73}
calibrated: 1.32
ΔE Greyscale Calman: 2.4 | ∀{0.09-98 Ø4.97}
97.8% sRGB (Argyll 1.6.3 3D)
64.7% AdobeRGB 1998 (Argyll 1.6.3 3D)
71.4% AdobeRGB 1998 (Argyll 3D)
97.9% sRGB (Argyll 3D)
69.2% Display P3 (Argyll 3D)
Gamma: 2.39
CCT: 6572 K
| Alienware m17 R3 P45E AU Optronics B173HAN, IPS, 17.3", 1920x1080 | Eluktronics RP-17 BOE NV173FHM-N44, IPS, 17.3", 1920x1080 | MSI GS75 10SF-609US Sharp LQ173M1JW05, IPS, 17.3", 1920x1080 | Asus Strix Scar 17 G732LXS LQ173M1JW03 (SHP14DC), IPS, 17.3", 1920x1080 | MSI GE75 Raider 10SE-008US Chi Mei N173HCE-G33, IPS, 17.3", 1920x1080 | Razer Blade Pro 17 RTX 2070 Max-Q 300 Hz Sharp LQ173M1JW02, IPS, 17.3", 1920x1080 | |
|---|---|---|---|---|---|---|
| Display | -7% | 5% | 1% | -3% | 2% | |
| Display P3 Coverage (%) | 69.2 | 64.7 -7% | 75.6 9% | 71 3% | 65.6 -5% | 72.2 4% |
| sRGB Coverage (%) | 97.9 | 92 -6% | 99.8 2% | 99 1% | 98.1 0% | 98.5 1% |
| AdobeRGB 1998 Coverage (%) | 71.4 | 65.8 -8% | 75.1 5% | 71.6 0% | 67.8 -5% | 73 2% |
| Response Times | -10% | 62% | 53% | 49% | 49% | |
| Response Time Grey 50% / Grey 80% * (ms) | 16.8 ? | 22.4 ? -33% | 5 ? 70% | 5.8 ? 65% | 6.8 ? 60% | 5.6 ? 67% |
| Response Time Black / White * (ms) | 14 ? | 12 ? 14% | 6.6 ? 53% | 8.4 ? 40% | 8.8 ? 37% | 9.6 ? 31% |
| PWM Frequency (Hz) | 943 | 25000 ? | ||||
| Screen | -43% | -10% | -33% | -5% | -59% | |
| Brightness middle (cd/m²) | 338.3 | 311.5 -8% | 299.4 -11% | 310 -8% | 337.9 0% | 328 -3% |
| Brightness (cd/m²) | 325 | 301 -7% | 299 -8% | 311 -4% | 305 -6% | 329 1% |
| Brightness Distribution (%) | 91 | 91 0% | 84 -8% | 82 -10% | 81 -11% | 78 -14% |
| Black Level * (cd/m²) | 0.27 | 0.31 -15% | 0.31 -15% | 0.41 -52% | 0.29 -7% | 0.35 -30% |
| Contrast (:1) | 1253 | 1005 -20% | 966 -23% | 756 -40% | 1165 -7% | 937 -25% |
| Colorchecker dE 2000 * | 1.88 | 4.13 -120% | 1.82 3% | 2.41 -28% | 2.18 -16% | 4.74 -152% |
| Colorchecker dE 2000 max. * | 3.23 | 7.32 -127% | 3.91 -21% | 8.59 -166% | 3.9 -21% | 8.99 -178% |
| Colorchecker dE 2000 calibrated * | 1.32 | 2.93 -122% | 1.59 -20% | 1.13 14% | 0.69 48% | 2.12 -61% |
| Greyscale dE 2000 * | 2.4 | 3.3 -38% | 2.7 -13% | 4.3 -79% | 3.1 -29% | 6.8 -183% |
| Gamma | 2.39 92% | 2.17 101% | 2.18 101% | 2.149 102% | 2.07 106% | 2.2 100% |
| CCT | 6572 99% | 7157 91% | 6837 95% | 7059 92% | 6882 94% | 6446 101% |
| Color Space (Percent of AdobeRGB 1998) (%) | 64.7 | 59.5 -8% | 67.1 4% | 72 11% | 62 -4% | 64.8 0% |
| Color Space (Percent of sRGB) (%) | 97.8 | 91.6 -6% | 99.8 2% | 94 -4% | 98.2 0% | 98.6 1% |
| Média Total (Programa/Configurações) | -20% /
-32% | 19% /
2% | 7% /
-16% | 14% /
2% | -3% /
-34% |
* ... menor é melhor
Exibir tempos de resposta
| ↔ Tempo de resposta preto para branco | ||
|---|---|---|
| 14 ms ... ascensão ↗ e queda ↘ combinadas | ↗ 7.6 ms ascensão | 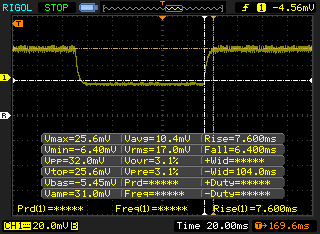 |
| ↘ 6.4 ms queda | ||
| A tela mostra boas taxas de resposta em nossos testes, mas pode ser muito lenta para jogadores competitivos. Em comparação, todos os dispositivos testados variam de 0.1 (mínimo) a 240 (máximo) ms. » 34 % de todos os dispositivos são melhores. Isso significa que o tempo de resposta medido é melhor que a média de todos os dispositivos testados (19.9 ms). | ||
| ↔ Tempo de resposta 50% cinza a 80% cinza | ||
| 16.8 ms ... ascensão ↗ e queda ↘ combinadas | ↗ 11.6 ms ascensão | 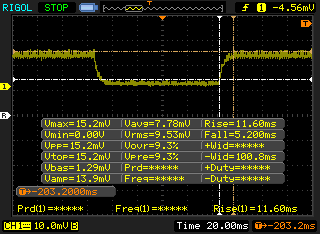 |
| ↘ 5.2 ms queda | ||
| A tela mostra boas taxas de resposta em nossos testes, mas pode ser muito lenta para jogadores competitivos. Em comparação, todos os dispositivos testados variam de 0.165 (mínimo) a 636 (máximo) ms. » 31 % de todos os dispositivos são melhores. Isso significa que o tempo de resposta medido é melhor que a média de todos os dispositivos testados (31.1 ms). | ||
Cintilação da tela / PWM (modulação por largura de pulso)
| Tela tremeluzindo / PWM não detectado |  | ||
[pwm_comparison] Em comparação: 52 % de todos os dispositivos testados não usam PWM para escurecer a tela. Se PWM foi detectado, uma média de 7798 (mínimo: 5 - máximo: 343500) Hz foi medida. | |||
Cinebench R15: CPU Multi 64Bit | CPU Single 64Bit
Blender: v2.79 BMW27 CPU
7-Zip 18.03: 7z b 4 -mmt1 | 7z b 4
Geekbench 5.5: Single-Core | Multi-Core
HWBOT x265 Benchmark v2.2: 4k Preset
LibreOffice : 20 Documents To PDF
R Benchmark 2.5: Overall mean
| Cinebench R20 / CPU (Multi Core) | |
| Intel Core i9-10900K | |
| MSI GT76 Titan DT 9SG | |
| Eluktronics RP-17 | |
| Alienware m17 R3 P45E | |
| Asus Zephyrus G14 GA401IV | |
| Alienware m17 R2 P41E | |
| Média Intel Core i9-10980HK (3526 - 4487, n=13) | |
| MSI GS75 10SF-609US | |
| MSI GE75 9SG | |
| MSI GE75 Raider 10SE-008US | |
| Medion Erazer X15805 | |
| Schenker XMG Pro 17 PB71RD-G | |
| Cinebench R20 / CPU (Single Core) | |
| Intel Core i9-10900K | |
| MSI GT76 Titan DT 9SG | |
| Medion Erazer X15805 | |
| Asus Zephyrus G14 GA401IV | |
| Média Intel Core i9-10980HK (465 - 507, n=13) | |
| Eluktronics RP-17 | |
| Alienware m17 R2 P41E | |
| MSI GS75 10SF-609US | |
| Alienware m17 R3 P45E | |
| MSI GE75 Raider 10SE-008US | |
| MSI GE75 9SG | |
| Schenker XMG Pro 17 PB71RD-G | |
| Cinebench R15 / CPU Multi 64Bit | |
| Intel Core i9-10900K | |
| MSI GT76 Titan DT 9SG | |
| Eluktronics RP-17 | |
| Asus Zephyrus G14 GA401IV | |
| Alienware m17 R3 P45E | |
| Alienware m17 R2 P41E | |
| Média Intel Core i9-10980HK (1606 - 1862, n=15) | |
| MSI GE75 9SG | |
| MSI GS75 10SF-609US | |
| MSI GE75 Raider 10SE-008US | |
| Medion Erazer X15805 | |
| Schenker XMG Pro 17 PB71RD-G | |
| Cinebench R15 / CPU Single 64Bit | |
| Intel Core i9-10900K | |
| MSI GT76 Titan DT 9SG | |
| Alienware m17 R3 P45E | |
| Média Intel Core i9-10980HK (198 - 219, n=15) | |
| Medion Erazer X15805 | |
| MSI GS75 10SF-609US | |
| Alienware m17 R2 P41E | |
| Asus Zephyrus G14 GA401IV | |
| MSI GE75 9SG | |
| MSI GE75 Raider 10SE-008US | |
| Eluktronics RP-17 | |
| Schenker XMG Pro 17 PB71RD-G | |
| Blender / v2.79 BMW27 CPU | |
| Schenker XMG Pro 17 PB71RD-G | |
| MSI GE75 Raider 10SE-008US | |
| Asus Zephyrus G14 GA401IV | |
| MSI GE75 9SG | |
| MSI GS75 10SF-609US | |
| Média Intel Core i9-10980HK (239 - 299, n=13) | |
| Eluktronics RP-17 | |
| Alienware m17 R3 P45E | |
| Intel Core i9-10900K | |
| 7-Zip 18.03 / 7z b 4 -mmt1 | |
| Intel Core i9-10900K | |
| Alienware m17 R3 P45E | |
| Média Intel Core i9-10980HK (5081 - 5542, n=13) | |
| MSI GS75 10SF-609US | |
| MSI GE75 Raider 10SE-008US | |
| MSI GE75 9SG | |
| Asus Zephyrus G14 GA401IV | |
| Eluktronics RP-17 | |
| Schenker XMG Pro 17 PB71RD-G | |
| 7-Zip 18.03 / 7z b 4 | |
| Intel Core i9-10900K | |
| Eluktronics RP-17 | |
| Asus Zephyrus G14 GA401IV | |
| MSI GS75 10SF-609US | |
| Média Intel Core i9-10980HK (43786 - 49275, n=13) | |
| Alienware m17 R3 P45E | |
| MSI GE75 9SG | |
| MSI GE75 Raider 10SE-008US | |
| Schenker XMG Pro 17 PB71RD-G | |
| Geekbench 5.5 / Single-Core | |
| Intel Core i9-10900K | |
| Alienware m17 R3 P45E | |
| Média Intel Core i9-10980HK (1283 - 1401, n=12) | |
| MSI GT76 Titan DT 9SG | |
| MSI GS75 10SF-609US | |
| MSI GE75 Raider 10SE-008US | |
| Asus Zephyrus G14 GA401IV | |
| Eluktronics RP-17 | |
| Schenker XMG Pro 17 PB71RD-G | |
| Geekbench 5.5 / Multi-Core | |
| Intel Core i9-10900K | |
| MSI GT76 Titan DT 9SG | |
| MSI GS75 10SF-609US | |
| Média Intel Core i9-10980HK (7634 - 8666, n=12) | |
| Alienware m17 R3 P45E | |
| Eluktronics RP-17 | |
| Asus Zephyrus G14 GA401IV | |
| MSI GE75 Raider 10SE-008US | |
| Schenker XMG Pro 17 PB71RD-G | |
| HWBOT x265 Benchmark v2.2 / 4k Preset | |
| Intel Core i9-10900K | |
| Alienware m17 R3 P45E | |
| Eluktronics RP-17 | |
| Média Intel Core i9-10980HK (12 - 14.6, n=13) | |
| MSI GS75 10SF-609US | |
| Asus Zephyrus G14 GA401IV | |
| MSI GE75 9SG | |
| MSI GE75 Raider 10SE-008US | |
| Schenker XMG Pro 17 PB71RD-G | |
| LibreOffice / 20 Documents To PDF | |
| Intel Core i9-10900K | |
| Eluktronics RP-17 | |
| MSI GE75 Raider 10SE-008US | |
| Média Intel Core i9-10980HK (44 - 89, n=13) | |
| MSI GS75 10SF-609US | |
| Alienware m17 R3 P45E | |
| R Benchmark 2.5 / Overall mean | |
| Schenker XMG Pro 17 PB71RD-G | |
| MSI GE75 Raider 10SE-008US | |
| MSI GS75 10SF-609US | |
| Eluktronics RP-17 | |
| Média Intel Core i9-10980HK (0.561 - 0.596, n=13) | |
| Alienware m17 R3 P45E | |
| Intel Core i9-10900K | |
* ... menor é melhor
| PCMark 8 | |
| Home Score Accelerated v2 | |
| Alienware m17 R3 P45E | |
| Média Intel Core i9-10980HK, NVIDIA GeForce RTX 2080 Super Mobile (n=1) | |
| Razer Blade Pro 17 RTX 2070 Max-Q 300 Hz | |
| Eluktronics RP-17 | |
| MSI GS75 10SF-609US | |
| MSI GE75 Raider 10SE-008US | |
| Work Score Accelerated v2 | |
| Alienware m17 R3 P45E | |
| Média Intel Core i9-10980HK, NVIDIA GeForce RTX 2080 Super Mobile (n=1) | |
| Razer Blade Pro 17 RTX 2070 Max-Q 300 Hz | |
| MSI GS75 10SF-609US | |
| MSI GE75 Raider 10SE-008US | |
| Eluktronics RP-17 | |
| PCMark 8 Home Score Accelerated v2 | 5881 pontos | |
| PCMark 8 Work Score Accelerated v2 | 6589 pontos | |
| PCMark 10 Score | 6594 pontos | |
Ajuda | ||
| DPC Latencies / LatencyMon - interrupt to process latency (max), Web, Youtube, Prime95 | |
| Asus Strix Scar 17 G732LXS | |
| MSI GE75 Raider 10SE-008US | |
| Eluktronics RP-17 | |
| Razer Blade Pro 17 RTX 2070 Max-Q 300 Hz | |
| Alienware m17 R3 P45E | |
| MSI GS75 10SF-609US | |
* ... menor é melhor
| Alienware m17 R3 P45E 2x Micron 2200S 512 GB (RAID 0) | Eluktronics RP-17 Phison PS5013 PRO-X-1TB-G2R NVMe SSD | MSI GS75 10SF-609US WDC PC SN730 SDBPNTY-512G | Asus Strix Scar 17 G732LXS 2x Intel SSD 660p 1TB SSDPEKNW010T8 (RAID 0) | MSI GE75 Raider 10SE-008US Samsung SSD PM981 MZVLB512HAJQ | Razer Blade Pro 17 RTX 2070 Max-Q 300 Hz Lite-On CA5-8D512 | |
|---|---|---|---|---|---|---|
| AS SSD | 23% | 17% | -2% | 21% | -10% | |
| Seq Read (MB/s) | 2060 | 1689 -18% | 2327 13% | 2450 19% | 2036 -1% | 2019 -2% |
| Seq Write (MB/s) | 2297 | 1695 -26% | 2479 8% | 1436 -37% | 1835 -20% | 1314 -43% |
| 4K Read (MB/s) | 35.39 | 50 41% | 45.46 28% | 49.48 40% | 60.6 71% | 46.61 32% |
| 4K Write (MB/s) | 63.1 | 182.9 190% | 157.4 149% | 119.4 89% | 127.2 102% | 90.2 43% |
| 4K-64 Read (MB/s) | 1337 | 1043 -22% | 1050 -21% | 1032 -23% | 1601 20% | 665 -50% |
| 4K-64 Write (MB/s) | 1307 | 1841 41% | 938 -28% | 1229 -6% | 1734 33% | 813 -38% |
| Access Time Read * (ms) | 0.057 | 0.04 30% | 0.076 -33% | 0.145 -154% | 0.049 14% | 0.058 -2% |
| Access Time Write * (ms) | 0.411 | 0.102 75% | 0.071 83% | 0.036 91% | 0.09 78% | 0.167 59% |
| Score Read (Points) | 1578 | 1262 -20% | 1328 -16% | 1327 -16% | 1865 18% | 913 -42% |
| Score Write (Points) | 1600 | 2194 37% | 1343 -16% | 1492 -7% | 2045 28% | 1034 -35% |
| Score Total (Points) | 3997 | 4112 3% | 3366 -16% | 3456 -14% | 4863 22% | 2392 -40% |
| Copy ISO MB/s (MB/s) | 1728 | 2124 23% | 3092 79% | 1900 10% | 1715 -1% | |
| Copy Program MB/s (MB/s) | 727 | 579 -20% | 733 1% | 205.5 -72% | 622 -14% | |
| Copy Game MB/s (MB/s) | 1585 | 1304 -18% | 1683 6% | 1419 -10% | 1506 -5% | |
| CrystalDiskMark 5.2 / 6 | 21% | 25% | 8% | 12% | 11% | |
| Write 4K (MB/s) | 68 | 226.1 233% | 177.9 162% | 125.8 85% | 139.2 105% | 119 75% |
| Read 4K (MB/s) | 42.04 | 54.7 30% | 47.42 13% | 52.9 26% | 53 26% | 51.9 23% |
| Write Seq (MB/s) | 2221 | 1868 -16% | 2707 22% | 1795 -19% | 1950 -12% | 2258 2% |
| Read Seq (MB/s) | 2202 | 1648 -25% | 2369 8% | 2315 5% | 2328 6% | 2283 4% |
| Write 4K Q32T1 (MB/s) | 494.5 | 429.9 -13% | 427.8 -13% | 407.1 -18% | 408.9 -17% | 491 -1% |
| Read 4K Q32T1 (MB/s) | 540 | 521 -4% | 543 1% | 411.9 -24% | 551 2% | 540 0% |
| Write Seq Q32T1 (MB/s) | 2623 | 2248 -14% | 2703 3% | 2844 8% | 1938 -26% | 2253 -14% |
| Read Seq Q32T1 (MB/s) | 3159 | 2484 -21% | 3387 7% | 3130 -1% | 3467 10% | 3172 0% |
| Média Total (Programa/Configurações) | 22% /
22% | 21% /
20% | 3% /
2% | 17% /
18% | 1% /
-2% |
* ... menor é melhor

Disk Throttling: DiskSpd Read Loop, Queue Depth 8
| 3DMark 11 | |
| 1280x720 Performance GPU | |
| MSI RTX 2080 Gaming X Trio | |
| Asus ROG Mothership GZ700GX | |
| Média NVIDIA GeForce RTX 2080 Super Mobile (34021 - 36838, n=4) | |
| Alienware m17 R3 P45E | |
| Asus Zephyrus S17 GX701LXS | |
| MSI RTX 2070 Gaming Z 8G | |
| Asus ROG Strix Scar 15 G532LWS | |
| Alienware m17 R2 P41E | |
| Razer Blade 15 RTX 2070 Super Max-Q | |
| Schenker XMG Ultra 17 Coffee Lake Refresh | |
| MSI RTX 2060 Gaming Z 6G | |
| MSI GS75 10SF-609US | |
| Eluktronics RP-17 | |
| Asus TUF A17 FA706IU-AS76 | |
| MSI Bravo 17 A4DDR | |
| Asus ROG Strix G15 G512LI | |
| MSI GT72S-6QEG16SR421BW | |
| 1280x720 Performance Combined | |
| Média NVIDIA GeForce RTX 2080 Super Mobile (16243 - 21954, n=4) | |
| MSI GS75 10SF-609US | |
| Schenker XMG Ultra 17 Coffee Lake Refresh | |
| Asus ROG Mothership GZ700GX | |
| Alienware m17 R3 P45E | |
| Asus ROG Strix Scar 15 G532LWS | |
| Razer Blade 15 RTX 2070 Super Max-Q | |
| Alienware m17 R2 P41E | |
| Asus Zephyrus S17 GX701LXS | |
| MSI RTX 2060 Gaming Z 6G | |
| MSI RTX 2070 Gaming Z 8G | |
| MSI RTX 2080 Gaming X Trio | |
| Asus TUF A17 FA706IU-AS76 | |
| MSI Bravo 17 A4DDR | |
| Asus ROG Strix G15 G512LI | |
| Eluktronics RP-17 | |
| MSI GT72S-6QEG16SR421BW | |
| 3DMark 11 Performance | 27300 pontos | |
| 3DMark Cloud Gate Standard Score | 54828 pontos | |
| 3DMark Fire Strike Score | 21102 pontos | |
| 3DMark Time Spy Score | 9921 pontos | |
Ajuda | ||
| Final Fantasy XV Benchmark - 1920x1080 High Quality | |
| Intel Core i9-10900K | |
| Alienware m17 R3 P45E | |
| Média NVIDIA GeForce RTX 2080 Super Mobile (95.7 - 107, n=3) | |
| MSI RTX 2080 Gaming X Trio | |
| Asus Strix Scar 17 G732LXS | |
| Razer Blade 15 RTX 2070 Super Max-Q | |
| MSI RTX 2070 Gaming Z 8G | |
| MSI GS75 Stealth 9SG | |
| MSI RTX 2060 Gaming Z 6G | |
| Asus Zephyrus S17 GX701LXS | |
| Eluktronics RP-17 | |
| Asus Zephyrus G14 GA401IV | |
| The Witcher 3 - 1920x1080 Ultra Graphics & Postprocessing (HBAO+) | |
| Intel Core i9-10900K | |
| MSI RTX 2080 Gaming X Trio | |
| Média NVIDIA GeForce RTX 2080 Super Mobile (93.4 - 113.2, n=4) | |
| MSI GT76 Titan DT 9SG | |
| Asus ROG Mothership GZ700GX | |
| Alienware m17 R3 P45E | |
| MSI GE75 9SG | |
| Asus Strix Scar 17 G732LXS | |
| MSI RTX 2070 Gaming Z 8G | |
| Asus ROG Strix Scar 15 G532LWS | |
| Asus Zephyrus S17 GX701LXS | |
| Razer Blade Pro 17 RTX 2070 Max-Q 300 Hz | |
| Alienware m17 R2 P41E | |
| MSI GS75 Stealth 9SG | |
| Razer Blade 15 RTX 2070 Super Max-Q | |
| MSI RTX 2060 Gaming Z 6G | |
| MSI GS75 10SF-609US | |
| MSI GE75 Raider 10SE-008US | |
| Medion Erazer X15805 | |
| Eluktronics RP-17 | |
| Schenker XMG Ultra 17 Coffee Lake Refresh | |
| Schenker XMG Pro 17 PB71RD-G | |
| Asus Zephyrus G14 GA401IV | |
| Asus TUF A17 FA706IU-AS76 | |
| MSI Bravo 17 A4DDR | |
| Asus ROG Strix G15 G512LI | |
| baixo | média | alto | ultra | |
|---|---|---|---|---|
| The Witcher 3 (2015) | 389.7 | 274.2 | 186.2 | 97.7 |
| Dota 2 Reborn (2015) | 150 | 140 | 134 | 127 |
| Final Fantasy XV Benchmark (2018) | 193 | 134 | 103 | |
| X-Plane 11.11 (2018) | 128 | 114 | 93.8 |
| Alienware m17 R3 P45E GeForce RTX 2080 Super Mobile, i9-10980HK, 2x Micron 2200S 512 GB (RAID 0) | Eluktronics RP-17 GeForce RTX 2060 Mobile, R7 4800H, Phison PS5013 PRO-X-1TB-G2R NVMe SSD | MSI GS75 10SF-609US GeForce RTX 2070 Max-Q, i7-10875H, WDC PC SN730 SDBPNTY-512G | Asus Strix Scar 17 G732LXS GeForce RTX 2080 Super Mobile, i9-10980HK, 2x Intel SSD 660p 1TB SSDPEKNW010T8 (RAID 0) | MSI GE75 Raider 10SE-008US GeForce RTX 2060 Mobile, i7-10750H, Samsung SSD PM981 MZVLB512HAJQ | Razer Blade Pro 17 RTX 2070 Max-Q 300 Hz GeForce RTX 2070 Max-Q, i7-10875H, Lite-On CA5-8D512 | |
|---|---|---|---|---|---|---|
| Noise | 7% | -6% | -15% | -0% | 1% | |
| desligado / ambiente * (dB) | 26.5 | 26.2 1% | 26.2 1% | 25 6% | 28.4 -7% | 28.2 -6% |
| Idle Minimum * (dB) | 27.8 | 26.2 6% | 31.2 -12% | 33 -19% | 30.2 -9% | 28.2 -1% |
| Idle Average * (dB) | 27.8 | 26.2 6% | 31.4 -13% | 38 -37% | 30.2 -9% | 28.2 -1% |
| Idle Maximum * (dB) | 27.8 | 30 -8% | 34 -22% | 45 -62% | 32 -15% | 30.5 -10% |
| Load Average * (dB) | 52.1 | 38.5 26% | 49.5 5% | 54 -4% | 33.2 36% | 42.2 19% |
| Witcher 3 ultra * (dB) | 51.8 | 47.2 9% | 50.6 2% | 50 3% | 55 -6% | 53 -2% |
| Load Maximum * (dB) | 59.1 | 54.6 8% | 60.7 -3% | 55 7% | 55 7% | 55.5 6% |
* ... menor é melhor
Barulho
| Ocioso |
| 27.8 / 27.8 / 27.8 dB |
| Carga |
| 52.1 / 59.1 dB |
 | ||
30 dB silencioso 40 dB(A) audível 50 dB(A) ruidosamente alto |
||
min: | ||
(-) A temperatura máxima no lado superior é 54 °C / 129 F, em comparação com a média de 40.4 °C / 105 F , variando de 21.2 a 68.8 °C para a classe Gaming.
(-) A parte inferior aquece até um máximo de 58.4 °C / 137 F, em comparação com a média de 43.2 °C / 110 F
(±) Em uso inativo, a temperatura média para o lado superior é 33.2 °C / 92 F, em comparação com a média do dispositivo de 33.9 °C / ### class_avg_f### F.
(-) Jogando The Witcher 3, a temperatura média para o lado superior é 39.1 °C / 102 F, em comparação com a média do dispositivo de 33.9 °C / ## #class_avg_f### F.
(+) Os apoios para as mãos e o touchpad são mais frios que a temperatura da pele, com um máximo de 31.2 °C / 88.2 F e, portanto, são frios ao toque.
(-) A temperatura média da área do apoio para as mãos de dispositivos semelhantes foi 28.8 °C / 83.8 F (-2.4 °C / -4.4 F).
Alienware m17 R3 P45E análise de áudio
(+) | os alto-falantes podem tocar relativamente alto (###valor### dB)
Graves 100 - 315Hz
(-) | quase nenhum baixo - em média 17.9% menor que a mediana
(±) | a linearidade dos graves é média (9.6% delta para a frequência anterior)
Médios 400 - 2.000 Hz
(±) | médios mais altos - em média 5.6% maior que a mediana
(+) | médios são lineares (4.5% delta para frequência anterior)
Altos 2 - 16 kHz
(±) | máximos mais altos - em média 5% maior que a mediana
(+) | os máximos são lineares (4.7% delta da frequência anterior)
Geral 100 - 16.000 Hz
(±) | a linearidade do som geral é média (16.2% diferença em relação à mediana)
Comparado com a mesma classe
» 40% de todos os dispositivos testados nesta classe foram melhores, 7% semelhantes, 54% piores
» O melhor teve um delta de 6%, a média foi 18%, o pior foi 132%
Comparado com todos os dispositivos testados
» 26% de todos os dispositivos testados foram melhores, 6% semelhantes, 68% piores
» O melhor teve um delta de 4%, a média foi 24%, o pior foi 134%
Apple MacBook 12 (Early 2016) 1.1 GHz análise de áudio
(+) | os alto-falantes podem tocar relativamente alto (###valor### dB)
Graves 100 - 315Hz
(±) | graves reduzidos - em média 11.3% menor que a mediana
(±) | a linearidade dos graves é média (14.2% delta para a frequência anterior)
Médios 400 - 2.000 Hz
(+) | médios equilibrados - apenas 2.4% longe da mediana
(+) | médios são lineares (5.5% delta para frequência anterior)
Altos 2 - 16 kHz
(+) | agudos equilibrados - apenas 2% longe da mediana
(+) | os máximos são lineares (4.5% delta da frequência anterior)
Geral 100 - 16.000 Hz
(+) | o som geral é linear (10.2% diferença em relação à mediana)
Comparado com a mesma classe
» 7% de todos os dispositivos testados nesta classe foram melhores, 2% semelhantes, 91% piores
» O melhor teve um delta de 5%, a média foi 18%, o pior foi 53%
Comparado com todos os dispositivos testados
» 5% de todos os dispositivos testados foram melhores, 1% semelhantes, 94% piores
» O melhor teve um delta de 4%, a média foi 24%, o pior foi 134%
| desligado | |
| Ocioso | |
| Carga |
|
Key:
min: | |
| Alienware m17 R3 P45E i9-10980HK, GeForce RTX 2080 Super Mobile, 2x Micron 2200S 512 GB (RAID 0), IPS, 1920x1080, 17.3" | Eluktronics RP-17 R7 4800H, GeForce RTX 2060 Mobile, Phison PS5013 PRO-X-1TB-G2R NVMe SSD, IPS, 1920x1080, 17.3" | MSI GS75 10SF-609US i7-10875H, GeForce RTX 2070 Max-Q, WDC PC SN730 SDBPNTY-512G, IPS, 1920x1080, 17.3" | Asus Strix Scar 17 G732LXS i9-10980HK, GeForce RTX 2080 Super Mobile, 2x Intel SSD 660p 1TB SSDPEKNW010T8 (RAID 0), IPS, 1920x1080, 17.3" | MSI GE75 Raider 10SE-008US i7-10750H, GeForce RTX 2060 Mobile, Samsung SSD PM981 MZVLB512HAJQ, IPS, 1920x1080, 17.3" | Razer Blade Pro 17 RTX 2070 Max-Q 300 Hz i7-10875H, GeForce RTX 2070 Max-Q, Lite-On CA5-8D512, IPS, 1920x1080, 17.3" | |
|---|---|---|---|---|---|---|
| Power Consumption | 36% | 35% | 21% | 41% | 35% | |
| Idle Minimum * (Watt) | 33.6 | 20.2 40% | 19.2 43% | 16 52% | 14.7 56% | 19.6 42% |
| Idle Average * (Watt) | 43.9 | 24.5 44% | 22.4 49% | 25 43% | 20.4 54% | 21.7 51% |
| Idle Maximum * (Watt) | 59 | 28.7 51% | 34.7 41% | 35 41% | 26.9 54% | 36.1 39% |
| Load Average * (Watt) | 134.9 | 110.4 18% | 106.7 21% | 177 -31% | 93.2 31% | 115.6 14% |
| Witcher 3 ultra * (Watt) | 242 | 166.3 31% | 160.5 34% | 227 6% | 185.4 23% | 157 35% |
| Load Maximum * (Watt) | 320 | 217.4 32% | 248.7 22% | 280 12% | 237.8 26% | 219.9 31% |
* ... menor é melhor
| Alienware m17 R3 P45E i9-10980HK, GeForce RTX 2080 Super Mobile, 86 Wh | Eluktronics RP-17 R7 4800H, GeForce RTX 2060 Mobile, 62 Wh | MSI GS75 10SF-609US i7-10875H, GeForce RTX 2070 Max-Q, 80.25 Wh | Asus Strix Scar 17 G732LXS i9-10980HK, GeForce RTX 2080 Super Mobile, 66 Wh | MSI GE75 Raider 10SE-008US i7-10750H, GeForce RTX 2060 Mobile, 65 Wh | Razer Blade Pro 17 RTX 2070 Max-Q 300 Hz i7-10875H, GeForce RTX 2070 Max-Q, 70 Wh | |
|---|---|---|---|---|---|---|
| Duração da bateria | 48% | 224% | 123% | 16% | 53% | |
| Reader / Idle (h) | 3.7 | 8.6 132% | 10 170% | |||
| WiFi v1.3 (h) | 3.2 | 4.4 38% | 4.9 53% | 5.9 84% | 3.7 16% | 4.9 53% |
| Load (h) | 0.7 | 1.1 57% | 4.1 486% | 1.5 114% |
Pro
Contra
À diferença do MSI GS75 ou Razer Blade Pro que dependem de GPUs Max-Q, o Alienware m17 R3 consegue se adequar a uma GeForce RTX 2080 Super móvel de potência total para desempenho notavelmente mais rápido em jogos. Os entusiastas que procuram jogos em 1080p a mais de 60 FPS ou 4K60 irão apreciar a potência extra que o Alienware é capaz de fornecer em relação à maioria dos outros portáteis de jogos ultrafinos. As velocidades de Turbo Boost são consistentes ao longo do tempo, o que é impressionante para um chassi tão fino que oferece uma CPU Core i9 desbloqueada e uma GPU GeForce Super.
As principais desvantagens incluem o peso pesado e os ventiladores barulhentos, mesmo para um portátil para jogos de 17,3 polegadas. O m17 R3 não é mais silencioso, mais frio, mais duradouro ou mais leve do que o m17 R2, apesar de seu chassi idêntico. É definitivamente mais rápido, mas todas as desvantagens existentes são ampliadas como resultado. Para alguns jogadores radicais, no entanto, isso pode valer muitos a pena.
O Alienware m17 R3 é o portátil para jogos de 17,3 polegadas mais rápido que você pode obter nesta grossura, já que a maioria dos outros na categoria vêm com opções Max-Q mais lentas apenas. É uma abordagem de "desempenho a todo custo" que funciona desde que você esteja ciente do peso pesado e dos ventiladores barulhentos.
Alienware m17 R3 P45E
- 09/04/2020 v7 (old)
Allen Ngo
Price comparison
