Breve Análise do Schenker Key 15 (Clevo PC50DN2): Muito desempenho em uma carcaça fina e compacta:
Avaliação | Data | Modelo | Peso | Altura | Size | Resolução | Preço |
|---|---|---|---|---|---|---|---|
| 84.5 % v7 (old) | 09/2020 | Schenker Key 15 Comet Lake i7-10875H, GeForce RTX 2080 Super Max-Q | 2 kg | 19.8 mm | 15.60" | 1920x1080 | |
| 84 % v7 (old) | 05/2020 | MSI GS66 10SGS i7-10750H, GeForce RTX 2080 Super Max-Q | 2.2 kg | 20 mm | 15.60" | 1920x1080 | |
| 86.5 % v7 (old) | 08/2020 | Aorus 15G XB i7-10875H, GeForce RTX 2070 Super Max-Q | 2.3 kg | 25 mm | 15.60" | 1920x1080 | |
| 85.9 % v7 (old) | 08/2020 | Razer Blade 15 RTX 2080 Super Max-Q i7-10875H, GeForce RTX 2080 Super Max-Q | 2.2 kg | 17.8 mm | 15.60" | 1920x1080 | |
| 85.8 % v7 (old) | 05/2020 | Gigabyte Aero 15 OLED XB-8DE51B0SP i7-10875H, GeForce RTX 2070 Super Max-Q | 2.2 kg | 20 mm | 15.60" | 3840x2160 | |
v (old) | 04/2020 | Acer Predator Triton 500 PT515-52-70N3 i7-10750H, GeForce RTX 2080 Super Max-Q | 2.1 kg | 18 mm | 15.60" | 1920x1080 |


")
")


| |||||||||||||||||||||||||
iluminação: 80 %
iluminação com acumulador: 300 cd/m²
Contraste: 1034:1 (Preto: 0.29 cd/m²)
ΔE ColorChecker Calman: 5.39 | ∀{0.5-29.43 Ø4.71}
calibrated: 1.73
ΔE Greyscale Calman: 9.8 | ∀{0.09-98 Ø4.96}
92% sRGB (Argyll 1.6.3 3D)
69% AdobeRGB 1998 (Argyll 1.6.3 3D)
68.7% AdobeRGB 1998 (Argyll 3D)
96.2% sRGB (Argyll 3D)
67.2% Display P3 (Argyll 3D)
Gamma: 2.019
CCT: 8174 K
| Schenker Key 15 Comet Lake Panda LM156LF-1F02, IPS, 1920x1080, 15.6" | MSI GS66 10SGS AU Optronics B156HAN12.0, IPS, 1920x1080, 15.6" | Aorus 15G XB Sharp LQ156M1JW03, IGZO, 1920x1080, 15.6" | Razer Blade 15 RTX 2080 Super Max-Q AU Optronics B156HAN12.0, IPS, 1920x1080, 15.6" | Gigabyte Aero 15 OLED XB-8DE51B0SP Samsung SDCA029, OLED, 3840x2160, 15.6" | Acer Predator Triton 500 PT515-52-70N3 AUO B156HAN12.0 (AUO7A8C), IPS, 1920x1080, 15.6" | |
|---|---|---|---|---|---|---|
| Display | 3% | 0% | 4% | 32% | 4% | |
| Display P3 Coverage (%) | 67.2 | 69.9 4% | 67.2 0% | 70.2 4% | 99.9 49% | 70.3 5% |
| sRGB Coverage (%) | 96.2 | 99.1 3% | 97.8 2% | 99 3% | 100 4% | 99.5 3% |
| AdobeRGB 1998 Coverage (%) | 68.7 | 71.1 3% | 68 -1% | 71.4 4% | 98.2 43% | 72.2 5% |
| Response Times | -11% | -41% | 21% | 79% | -29% | |
| Response Time Grey 50% / Grey 80% * (ms) | 10 ? | 11.2 ? -12% | 16 ? -60% | 6 ? 40% | 2.2 ? 78% | 14.4 ? -44% |
| Response Time Black / White * (ms) | 9.2 ? | 10 ? -9% | 11.2 ? -22% | 9 ? 2% | 1.8 ? 80% | 10.4 ? -13% |
| PWM Frequency (Hz) | 23580 ? | 60 ? | ||||
| Screen | 31% | 23% | 27% | 33% | 21% | |
| Brightness middle (cd/m²) | 300 | 339.4 13% | 264 -12% | 347 16% | 385 28% | 320 7% |
| Brightness (cd/m²) | 281 | 331 18% | 248 -12% | 328 17% | 390 39% | 318 13% |
| Brightness Distribution (%) | 80 | 92 15% | 89 11% | 89 11% | 93 16% | 88 10% |
| Black Level * (cd/m²) | 0.29 | 0.24 17% | 0.3 -3% | 0.285 2% | 0.24 17% | |
| Contrast (:1) | 1034 | 1414 37% | 880 -15% | 1218 18% | 1333 29% | |
| Colorchecker dE 2000 * | 5.39 | 1.58 71% | 1.21 78% | 2.35 56% | 2.46 54% | 4.03 25% |
| Colorchecker dE 2000 max. * | 14.35 | 3.8 74% | 3.07 79% | 4.15 71% | 4.01 72% | 8.43 41% |
| Colorchecker dE 2000 calibrated * | 1.73 | 1.47 15% | 0.92 47% | 1.16 33% | 2.6 -50% | 0.98 43% |
| Greyscale dE 2000 * | 9.8 | 2.3 77% | 1.6 84% | 3.04 69% | 1.39 86% | 5.94 39% |
| Gamma | 2.019 109% | 2.24 98% | 2.192 100% | 2.35 94% | 2.31 95% | 2.42 91% |
| CCT | 8174 80% | 6952 93% | 6340 103% | 6658 98% | 6395 102% | 6751 96% |
| Color Space (Percent of AdobeRGB 1998) (%) | 69 | 64.8 -6% | 68 -1% | 65 -6% | 98 42% | 66 -4% |
| Color Space (Percent of sRGB) (%) | 92 | 99.4 8% | 90 -2% | 99 8% | 100 9% | 99 8% |
| Média Total (Programa/Configurações) | 8% /
21% | -6% /
11% | 17% /
22% | 48% /
39% | -1% /
12% |
* ... menor é melhor
Exibir tempos de resposta
| ↔ Tempo de resposta preto para branco | ||
|---|---|---|
| 9.2 ms ... ascensão ↗ e queda ↘ combinadas | ↗ 4.4 ms ascensão | 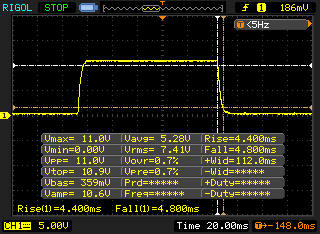 |
| ↘ 4.8 ms queda | ||
| A tela mostra taxas de resposta rápidas em nossos testes e deve ser adequada para jogos. Em comparação, todos os dispositivos testados variam de 0.1 (mínimo) a 240 (máximo) ms. » 26 % de todos os dispositivos são melhores. Isso significa que o tempo de resposta medido é melhor que a média de todos os dispositivos testados (19.8 ms). | ||
| ↔ Tempo de resposta 50% cinza a 80% cinza | ||
| 10 ms ... ascensão ↗ e queda ↘ combinadas | ↗ 5.2 ms ascensão | 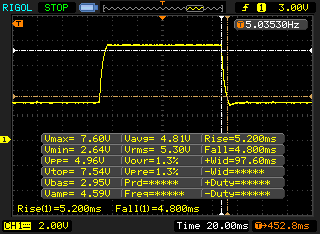 |
| ↘ 4.8 ms queda | ||
| A tela mostra boas taxas de resposta em nossos testes, mas pode ser muito lenta para jogadores competitivos. Em comparação, todos os dispositivos testados variam de 0.165 (mínimo) a 636 (máximo) ms. » 23 % de todos os dispositivos são melhores. Isso significa que o tempo de resposta medido é melhor que a média de todos os dispositivos testados (31 ms). | ||
Cintilação da tela / PWM (modulação por largura de pulso)
| Tela tremeluzindo / PWM não detectado | 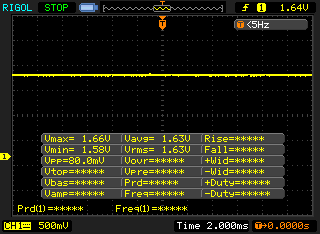 | ||
[pwm_comparison] Em comparação: 52 % de todos os dispositivos testados não usam PWM para escurecer a tela. Se PWM foi detectado, uma média de 7754 (mínimo: 5 - máximo: 343500) Hz foi medida. | |||

| Cinebench R15 | |
| CPU Single 64Bit | |
| Média da turma Gaming (188.8 - 350, n=106, últimos 2 anos) | |
| Gigabyte Aero 15 OLED XB-8DE51B0SP | |
| Schenker Key 15 Comet Lake (Leistungsmodus) | |
| Schenker Key 15 Comet Lake | |
| Média Intel Core i7-10875H (190 - 220, n=37) | |
| Aorus 15G XB | |
| Razer Blade 15 RTX 2080 Super Max-Q | |
| Acer Predator Triton 500 PT515-52-70N3 | |
| MSI GS66 10SGS | |
| CPU Multi 64Bit | |
| Média da turma Gaming (1578 - 6330, n=105, últimos 2 anos) | |
| Aorus 15G XB | |
| Gigabyte Aero 15 OLED XB-8DE51B0SP | |
| Schenker Key 15 Comet Lake (Leistungsmodus) | |
| Média Intel Core i7-10875H (1003 - 1833, n=38) | |
| Schenker Key 15 Comet Lake | |
| Acer Predator Triton 500 PT515-52-70N3 | |
| MSI GS66 10SGS | |
| Razer Blade 15 RTX 2080 Super Max-Q | |
| Blender - v2.79 BMW27 CPU | |
| Razer Blade 15 RTX 2080 Super Max-Q | |
| MSI GS66 10SGS | |
| Acer Predator Triton 500 PT515-52-70N3 | |
| Schenker Key 15 Comet Lake | |
| Média Intel Core i7-10875H (259 - 535, n=30) | |
| Schenker Key 15 Comet Lake (Leistungsmodus) | |
| Gigabyte Aero 15 OLED XB-8DE51B0SP | |
| Aorus 15G XB | |
| Média da turma Gaming (79 - 330, n=104, últimos 2 anos) | |
| Cinebench R20 | |
| CPU (Single Core) | |
| Média da turma Gaming (442 - 913, n=106, últimos 2 anos) | |
| Gigabyte Aero 15 OLED XB-8DE51B0SP | |
| Schenker Key 15 Comet Lake (Leistungsmodus) | |
| Schenker Key 15 Comet Lake | |
| Média Intel Core i7-10875H (430 - 524, n=32) | |
| Aorus 15G XB | |
| Razer Blade 15 RTX 2080 Super Max-Q | |
| Acer Predator Triton 500 PT515-52-70N3 | |
| MSI GS66 10SGS | |
| CPU (Multi Core) | |
| Média da turma Gaming (4029 - 16433, n=106, últimos 2 anos) | |
| Schenker Key 15 Comet Lake (Leistungsmodus) | |
| Gigabyte Aero 15 OLED XB-8DE51B0SP | |
| Aorus 15G XB | |
| Média Intel Core i7-10875H (1986 - 4176, n=32) | |
| Schenker Key 15 Comet Lake | |
| Acer Predator Triton 500 PT515-52-70N3 | |
| MSI GS66 10SGS | |
| Razer Blade 15 RTX 2080 Super Max-Q | |
| Geekbench 5.5 | |
| Single-Core | |
| Média da turma Gaming (986 - 2474, n=105, últimos 2 anos) | |
| Schenker Key 15 Comet Lake (Leistungsmodus) | |
| Gigabyte Aero 15 OLED XB-8DE51B0SP | |
| Schenker Key 15 Comet Lake | |
| Média Intel Core i7-10875H (1233 - 1371, n=29) | |
| Razer Blade 15 RTX 2080 Super Max-Q | |
| Aorus 15G XB | |
| Acer Predator Triton 500 PT515-52-70N3 | |
| MSI GS66 10SGS | |
| Multi-Core | |
| Média da turma Gaming (6460 - 28263, n=105, últimos 2 anos) | |
| Schenker Key 15 Comet Lake (Leistungsmodus) | |
| Aorus 15G XB | |
| Gigabyte Aero 15 OLED XB-8DE51B0SP | |
| Média Intel Core i7-10875H (5715 - 8620, n=29) | |
| Schenker Key 15 Comet Lake | |
| Razer Blade 15 RTX 2080 Super Max-Q | |
| MSI GS66 10SGS | |
| Acer Predator Triton 500 PT515-52-70N3 | |
| HWBOT x265 Benchmark v2.2 - 4k Preset | |
| Média da turma Gaming (11.5 - 44.4, n=105, últimos 2 anos) | |
| Gigabyte Aero 15 OLED XB-8DE51B0SP | |
| Aorus 15G XB | |
| Schenker Key 15 Comet Lake (Leistungsmodus) | |
| Média Intel Core i7-10875H (7.27 - 14.1, n=27) | |
| Schenker Key 15 Comet Lake | |
| Razer Blade 15 RTX 2080 Super Max-Q | |
| Acer Predator Triton 500 PT515-52-70N3 | |
| MSI GS66 10SGS | |
| LibreOffice - 20 Documents To PDF | |
| MSI GS66 10SGS | |
| Aorus 15G XB | |
| Gigabyte Aero 15 OLED XB-8DE51B0SP | |
| Acer Predator Triton 500 PT515-52-70N3 | |
| Schenker Key 15 Comet Lake | |
| Média Intel Core i7-10875H (30.2 - 84.3, n=30) | |
| Média da turma Gaming (33.2 - 88.8, n=105, últimos 2 anos) | |
| Razer Blade 15 RTX 2080 Super Max-Q | |
| Schenker Key 15 Comet Lake (Leistungsmodus) | |
| R Benchmark 2.5 - Overall mean | |
| MSI GS66 10SGS | |
| Acer Predator Triton 500 PT515-52-70N3 | |
| Aorus 15G XB | |
| Média Intel Core i7-10875H (0.546 - 0.662, n=29) | |
| Razer Blade 15 RTX 2080 Super Max-Q | |
| Schenker Key 15 Comet Lake | |
| Schenker Key 15 Comet Lake (Leistungsmodus) | |
| Gigabyte Aero 15 OLED XB-8DE51B0SP | |
| Média da turma Gaming (0.3439 - 0.759, n=106, últimos 2 anos) | |
* ... menor é melhor
| PCMark 8 Home Score Accelerated v2 | 4375 pontos | |
| PCMark 8 Creative Score Accelerated v2 | 5721 pontos | |
| PCMark 8 Work Score Accelerated v2 | 5682 pontos | |
| PCMark 10 Score | 5909 pontos | |
Ajuda | ||
| DPC Latencies / LatencyMon - interrupt to process latency (max), Web, Youtube, Prime95 | |
| Acer Predator Triton 500 PT515-52-70N3 | |
| Aorus 15G XB | |
| Gigabyte Aero 15 OLED XB-8DE51B0SP | |
| MSI GS66 10SGS | |
| Razer Blade 15 RTX 2080 Super Max-Q | |
| Schenker Key 15 Comet Lake | |
* ... menor é melhor

| Schenker Key 15 Comet Lake Samsung SSD 970 EVO Plus 1TB | MSI GS66 10SGS Samsung SSD PM981 MZVLB512HAJQ | Aorus 15G XB Samsung SSD PM981a MZVLB512HBJQ | Razer Blade 15 RTX 2080 Super Max-Q Samsung PM981a MZVLB1T0HBLR | Gigabyte Aero 15 OLED XB-8DE51B0SP Intel Optane Memory H10 with Solid State Storage 32GB + 512GB HBRPEKNX0202A(L/H) | Acer Predator Triton 500 PT515-52-70N3 Samsung SSD PM981a MZVLB512HBJQ | |
|---|---|---|---|---|---|---|
| CrystalDiskMark 5.2 / 6 | -25% | -19% | -16% | -15% | -15% | |
| Write 4K (MB/s) | 193 | 132.5 -31% | 121.6 -37% | 135.7 -30% | 127.4 -34% | 131.7 -32% |
| Read 4K (MB/s) | 54.3 | 45.03 -17% | 44.37 -18% | 46.98 -13% | 147.5 172% | 47.34 -13% |
| Write Seq (MB/s) | 2988 | 1987 -34% | 2617 -12% | 2180 -27% | 485.9 -84% | 2884 -3% |
| Read Seq (MB/s) | 2633 | 1434 -46% | 1297 -51% | 1949 -26% | 1352 -49% | 2303 -13% |
| Write 4K Q32T1 (MB/s) | 540 | 467.5 -13% | 499 -8% | 510 -6% | 476.5 -12% | 423.9 -22% |
| Read 4K Q32T1 (MB/s) | 620 | 536 -14% | 557 -10% | 569 -8% | 531 -14% | 487.7 -21% |
| Write Seq Q32T1 (MB/s) | 3284 | 2003 -39% | 2978 -9% | 2984 -9% | 1061 -68% | 2822 -14% |
| Read Seq Q32T1 (MB/s) | 3564 | 3306 -7% | 3360 -6% | 3238 -9% | 2552 -28% | 3478 -2% |
| AS SSD | -43% | -27% | -26% | -48% | -17% | |
| Seq Read (MB/s) | 2928 | 1086 -63% | 1795 -39% | 1950 -33% | 1200 -59% | 2767 -5% |
| Seq Write (MB/s) | 2733 | 1901 -30% | 2724 0% | 2322 -15% | 836 -69% | 2613 -4% |
| 4K Read (MB/s) | 51.6 | 51 -1% | 49.67 -4% | 45.48 -12% | 65.8 28% | 47.55 -8% |
| 4K Write (MB/s) | 129.8 | 117.3 -10% | 109.3 -16% | 95.4 -27% | 103.8 -20% | 98.9 -24% |
| 4K-64 Read (MB/s) | 1838 | 1503 -18% | 1284 -30% | 1484 -19% | 789 -57% | 1205 -34% |
| 4K-64 Write (MB/s) | 2291 | 1721 -25% | 1962 -14% | 1887 -18% | 929 -59% | 2007 -12% |
| Access Time Read * (ms) | 0.062 | 0.059 5% | 0.063 -2% | 0.051 18% | 0.103 -66% | 0.065 -5% |
| Access Time Write * (ms) | 0.029 | 0.1 -245% | 0.034 -17% | 0.038 -31% | 0.045 -55% | 0.038 -31% |
| Score Read (Points) | 2183 | 1662 -24% | 1513 -31% | 1725 -21% | 975 -55% | 1529 -30% |
| Score Write (Points) | 2694 | 2029 -25% | 2344 -13% | 2215 -18% | 1117 -59% | 2367 -12% |
| Score Total (Points) | 5984 | 4588 -23% | 4685 -22% | 4843 -19% | 2594 -57% | 4677 -22% |
| Copy ISO MB/s (MB/s) | 2183 | 2155 -1% | 1533 -30% | 1903 -13% | ||
| Copy Program MB/s (MB/s) | 2694 | 715 -73% | 528 -80% | 505 -81% | ||
| Copy Game MB/s (MB/s) | 5984 | 1506 -75% | 1042 -83% | 1113 -81% | ||
| Média Total (Programa/Configurações) | -34% /
-37% | -23% /
-24% | -21% /
-23% | -32% /
-34% | -16% /
-16% |
* ... menor é melhor
Continuous load read: DiskSpd Read Loop, Queue Depth 8
| 3DMark 11 Performance | 24712 pontos | |
| 3DMark Cloud Gate Standard Score | 44991 pontos | |
| 3DMark Fire Strike Score | 18479 pontos | |
| 3DMark Time Spy Score | 8330 pontos | |
Ajuda | ||
| 3DMark 11 - 1280x720 Performance GPU | |
| Média da turma Gaming (21841 - 80022, n=104, últimos 2 anos) | |
| Schenker Key 15 Comet Lake (Leistungsmodus) | |
| Acer Predator Triton 500 PT515-52-70N3 | |
| Média NVIDIA GeForce RTX 2080 Super Max-Q (26292 - 32995, n=10) | |
| Gigabyte Aero 15 OLED XB-8DE51B0SP | |
| Schenker Key 15 Comet Lake | |
| Razer Blade 15 RTX 2080 Super Max-Q | |
| Aorus 15G XB | |
| MSI GS66 10SGS | |
| The Witcher 3 - 1920x1080 Ultra Graphics & Postprocessing (HBAO+) | |
| Média da turma Gaming (104.7 - 240, n=7, últimos 2 anos) | |
| Schenker Key 15 Comet Lake (Leistungsmodus) | |
| Schenker Key 15 Comet Lake | |
| Razer Blade 15 RTX 2080 Super Max-Q | |
| Média NVIDIA GeForce RTX 2080 Super Max-Q (74.3 - 96, n=11) | |
| Acer Predator Triton 500 PT515-52-70N3 | |
| Gigabyte Aero 15 OLED XB-8DE51B0SP | |
| Aorus 15G XB | |
| MSI GS66 10SGS | |
| BioShock Infinite - 1920x1080 Ultra Preset, DX11 (DDOF) | |
| Média NVIDIA GeForce RTX 2080 Super Max-Q (170.2 - 181.1, n=4) | |
| Razer Blade 15 RTX 2080 Super Max-Q | |
| Schenker Key 15 Comet Lake | |
| Aorus 15G XB | |
| F1 2020 - 1920x1080 Ultra High Preset AA:T AF:16x | |
| Schenker Key 15 Comet Lake (Leistungsmodus) | |
| Média NVIDIA GeForce RTX 2080 Super Max-Q (102 - 126, n=5) | |
| Razer Blade 15 RTX 2080 Super Max-Q | |
| Aorus 15G XB | |
| Schenker Key 15 Comet Lake | |
| Horizon Zero Dawn - 1920x1080 Ultimate Quality | |
| Schenker Key 15 Comet Lake (Leistungsmodus) | |
| Média NVIDIA GeForce RTX 2080 Super Max-Q (74 - 76, n=2) | |
| Schenker Key 15 Comet Lake | |
| Doom Eternal - 1920x1080 Ultra Preset | |
| Schenker Key 15 Comet Lake (Leistungsmodus) | |
| Média NVIDIA GeForce RTX 2080 Super Max-Q (140 - 177.7, n=8) | |
| Schenker Key 15 Comet Lake | |
| Acer Predator Triton 500 PT515-52-70N3 | |
| Razer Blade 15 RTX 2080 Super Max-Q | |
| MSI GS66 10SGS | |
| Aorus 15G XB | |
| Star Wars Jedi Fallen Order - 1920x1080 Epic Preset | |
| Schenker Key 15 Comet Lake | |
| Média NVIDIA GeForce RTX 2080 Super Max-Q (88.7 - 97.5, n=4) | |
| Aorus 15G XB | |
| Acer Predator Triton 500 PT515-52-70N3 | |
| Razer Blade 15 RTX 2080 Super Max-Q | |
| Gears Tactics - 1920x1080 Ultra Preset | |
| Schenker Key 15 Comet Lake (Leistungsmodus) | |
| Média NVIDIA GeForce RTX 2080 Super Max-Q (78.4 - 92.7, n=5) | |
| Schenker Key 15 Comet Lake | |
| Razer Blade 15 RTX 2080 Super Max-Q | |
| Aorus 15G XB | |
| Shadow of the Tomb Raider - 1920x1080 Highest Preset AA:T | |
| Média da turma Gaming (96 - 116, n=2, últimos 2 anos) | |
| Schenker Key 15 Comet Lake (Leistungsmodus) | |
| Gigabyte Aero 15 OLED XB-8DE51B0SP | |
| Schenker Key 15 Comet Lake | |
| Acer Predator Triton 500 PT515-52-70N3 | |
| MSI GS66 10SGS | |
| Aorus 15G XB | |
| Média NVIDIA GeForce RTX 2080 Super Max-Q (89 - 106, n=10) | |
| Razer Blade 15 RTX 2080 Super Max-Q | |
| baixo | média | alto | ultra | |
|---|---|---|---|---|
| BioShock Infinite (2013) | 426.3 | 364.5 | 323.7 | 170.2 |
| The Witcher 3 (2015) | 348.2 | 251.3 | 159.8 | 90.2 |
| Shadow of the Tomb Raider (2018) | 139 | 116 | 110 | 99 |
| Total War: Three Kingdoms (2019) | 273.1 | 142.4 | 95.4 | 69 |
| Star Wars Jedi Fallen Order (2019) | 113.7 | 103.7 | 97.5 | |
| Red Dead Redemption 2 (2019) | 138.4 | 101.5 | 69 | 45 |
| Doom Eternal (2020) | 249 | 176.6 | 156.7 | 155.1 |
| Gears Tactics (2020) | 267.4 | 184.5 | 126.2 | 84.3 |
| F1 2020 (2020) | 268 | 184 | 161 | 102 |
| Death Stranding (2020) | 166.1 | 123.5 | 114.5 | 112.8 |
| Horizon Zero Dawn (2020) | 148 | 109 | 90 | 74 |
Barulho
| Ocioso |
| 26 / 27 / 44 dB |
| Carga |
| 53 / 53 dB |
 | ||
30 dB silencioso 40 dB(A) audível 50 dB(A) ruidosamente alto |
||
min: | ||
| Schenker Key 15 Comet Lake i7-10875H, GeForce RTX 2080 Super Max-Q | MSI GS66 10SGS i7-10750H, GeForce RTX 2080 Super Max-Q | Aorus 15G XB i7-10875H, GeForce RTX 2070 Super Max-Q | Razer Blade 15 RTX 2080 Super Max-Q i7-10875H, GeForce RTX 2080 Super Max-Q | Gigabyte Aero 15 OLED XB-8DE51B0SP i7-10875H, GeForce RTX 2070 Super Max-Q | Acer Predator Triton 500 PT515-52-70N3 i7-10750H, GeForce RTX 2080 Super Max-Q | |
|---|---|---|---|---|---|---|
| Noise | 1% | -4% | 2% | -9% | -3% | |
| desligado / ambiente * (dB) | 25 | 28.5 -14% | 25 -0% | 30.1 -20% | 30 -20% | 30 -20% |
| Idle Minimum * (dB) | 26 | 30 -15% | 32 -23% | 30.1 -16% | 34 -31% | 30 -15% |
| Idle Average * (dB) | 27 | 30 -11% | 34 -26% | 30.1 -11% | 36 -33% | 33 -22% |
| Idle Maximum * (dB) | 44 | 30.9 30% | 38 14% | 30.1 32% | 41 7% | 36 18% |
| Load Average * (dB) | 53 | 39.5 25% | 48 9% | 46.8 12% | 48 9% | 50 6% |
| Witcher 3 ultra * (dB) | 51 | 48 6% | 50 2% | 48.4 5% | 48 6% | 48 6% |
| Load Maximum * (dB) | 53 | 59.4 -12% | 54 -2% | 46 13% | 54 -2% | 50 6% |
* ... menor é melhor
(-) A temperatura máxima no lado superior é 52 °C / 126 F, em comparação com a média de 40.4 °C / 105 F , variando de 21.2 a 68.8 °C para a classe Gaming.
(-) A parte inferior aquece até um máximo de 62 °C / 144 F, em comparação com a média de 43.2 °C / 110 F
(+) Em uso inativo, a temperatura média para o lado superior é 30.1 °C / 86 F, em comparação com a média do dispositivo de 33.9 °C / ### class_avg_f### F.
(-) Jogando The Witcher 3, a temperatura média para o lado superior é 44.4 °C / 112 F, em comparação com a média do dispositivo de 33.9 °C / ## #class_avg_f### F.
(±) Os apoios para as mãos e o touchpad podem ficar muito quentes ao toque, com um máximo de 37 °C / 98.6 F.
(-) A temperatura média da área do apoio para as mãos de dispositivos semelhantes foi 28.8 °C / 83.8 F (-8.2 °C / -14.8 F).
| Schenker Key 15 Comet Lake i7-10875H, GeForce RTX 2080 Super Max-Q | MSI GS66 10SGS i7-10750H, GeForce RTX 2080 Super Max-Q | Aorus 15G XB i7-10875H, GeForce RTX 2070 Super Max-Q | Razer Blade 15 RTX 2080 Super Max-Q i7-10875H, GeForce RTX 2080 Super Max-Q | Gigabyte Aero 15 OLED XB-8DE51B0SP i7-10875H, GeForce RTX 2070 Super Max-Q | Acer Predator Triton 500 PT515-52-70N3 i7-10750H, GeForce RTX 2080 Super Max-Q | |
|---|---|---|---|---|---|---|
| Heat | 9% | 10% | 7% | 8% | 12% | |
| Maximum Upper Side * (°C) | 52 | 47.8 8% | 44 15% | 52 -0% | 49 6% | 44 15% |
| Maximum Bottom * (°C) | 62 | 54.4 12% | 63 -2% | 53 15% | 61 2% | 50 19% |
| Idle Upper Side * (°C) | 31 | 27.4 12% | 27 13% | 29.3 5% | 27 13% | 29 6% |
| Idle Bottom * (°C) | 33 | 32 3% | 29 12% | 30.2 8% | 29 12% | 31 6% |
* ... menor é melhor
Schenker Key 15 Comet Lake análise de áudio
(+) | os alto-falantes podem tocar relativamente alto (###valor### dB)
Graves 100 - 315Hz
(-) | quase nenhum baixo - em média 15.7% menor que a mediana
(+) | o baixo é linear (2.9% delta para a frequência anterior)
Médios 400 - 2.000 Hz
(+) | médios equilibrados - apenas 3.2% longe da mediana
(+) | médios são lineares (6% delta para frequência anterior)
Altos 2 - 16 kHz
(+) | agudos equilibrados - apenas 2.3% longe da mediana
(+) | os máximos são lineares (5.7% delta da frequência anterior)
Geral 100 - 16.000 Hz
(+) | o som geral é linear (11.8% diferença em relação à mediana)
Comparado com a mesma classe
» 11% de todos os dispositivos testados nesta classe foram melhores, 4% semelhantes, 85% piores
» O melhor teve um delta de 6%, a média foi 18%, o pior foi 132%
Comparado com todos os dispositivos testados
» 9% de todos os dispositivos testados foram melhores, 3% semelhantes, 89% piores
» O melhor teve um delta de 4%, a média foi 23%, o pior foi 134%
| desligado | |
| Ocioso | |
| Carga |
|
Key:
min: | |
| Schenker Key 15 Comet Lake i7-10875H, GeForce RTX 2080 Super Max-Q | MSI GS66 10SGS i7-10750H, GeForce RTX 2080 Super Max-Q | Aorus 15G XB i7-10875H, GeForce RTX 2070 Super Max-Q | Razer Blade 15 RTX 2080 Super Max-Q i7-10875H, GeForce RTX 2080 Super Max-Q | Gigabyte Aero 15 OLED XB-8DE51B0SP i7-10875H, GeForce RTX 2070 Super Max-Q | Acer Predator Triton 500 PT515-52-70N3 i7-10750H, GeForce RTX 2080 Super Max-Q | |
|---|---|---|---|---|---|---|
| Power Consumption | -22% | -33% | 1% | -46% | -8% | |
| Idle Minimum * (Watt) | 10 | 14.9 -49% | 16 -60% | 10.6 -6% | 18 -80% | 11 -10% |
| Idle Average * (Watt) | 14 | 17.5 -25% | 20 -43% | 13.1 6% | 21 -50% | 15 -7% |
| Idle Maximum * (Watt) | 18 | 29.5 -64% | 30 -67% | 15.8 12% | 38 -111% | 25 -39% |
| Load Average * (Watt) | 106 | 94.8 11% | 102 4% | 131 -24% | 113 -7% | 95 10% |
| Witcher 3 ultra * (Watt) | 142 | 146.1 -3% | 156 -10% | 146 -3% | 149 -5% | 140 1% |
| Load Maximum * (Watt) | 210 | 210.9 -0% | 256 -22% | 169 20% | 256 -22% | 211 -0% |
* ... menor é melhor
| Schenker Key 15 Comet Lake i7-10875H, GeForce RTX 2080 Super Max-Q, 73 Wh | MSI GS66 10SGS i7-10750H, GeForce RTX 2080 Super Max-Q, 99.99 Wh | Aorus 15G XB i7-10875H, GeForce RTX 2070 Super Max-Q, 94 Wh | Razer Blade 15 RTX 2080 Super Max-Q i7-10875H, GeForce RTX 2080 Super Max-Q, 80 Wh | Gigabyte Aero 15 OLED XB-8DE51B0SP i7-10875H, GeForce RTX 2070 Super Max-Q, 94.2 Wh | Acer Predator Triton 500 PT515-52-70N3 i7-10750H, GeForce RTX 2080 Super Max-Q, 84 Wh | |
|---|---|---|---|---|---|---|
| Duração da bateria | 38% | 53% | 31% | 55% | 17% | |
| Reader / Idle (h) | 7 | 10.2 46% | 9.7 39% | 8.7 24% | 8.6 23% | 8.3 19% |
| H.264 (h) | 5.7 | 7.7 35% | 7.3 28% | |||
| WiFi v1.3 (h) | 4.8 | 6.9 44% | 7 46% | 6.1 27% | 6.1 27% | 6.3 31% |
| Load (h) | 1.3 | 1.6 23% | 2.5 92% | 1.9 46% | 2.8 115% | 1.3 0% |
Pro
Contra
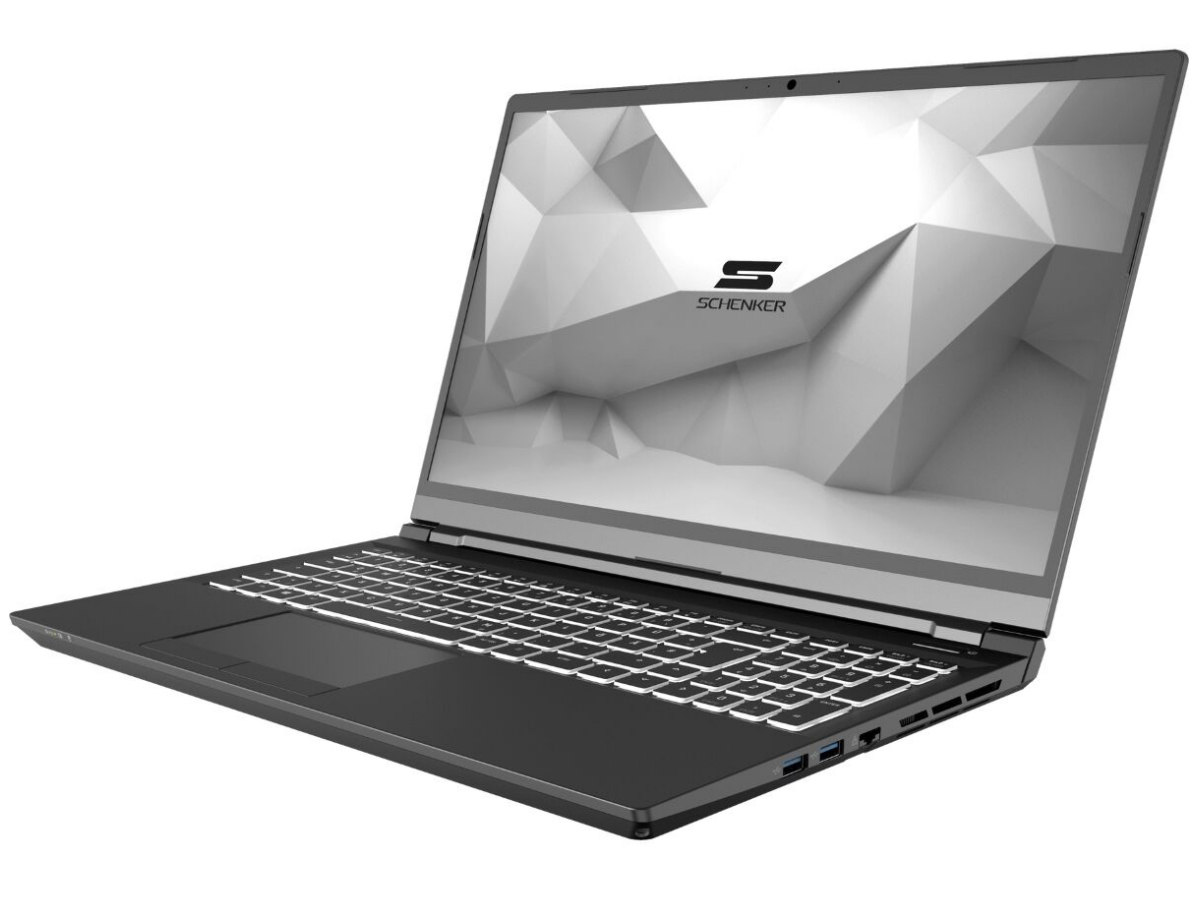
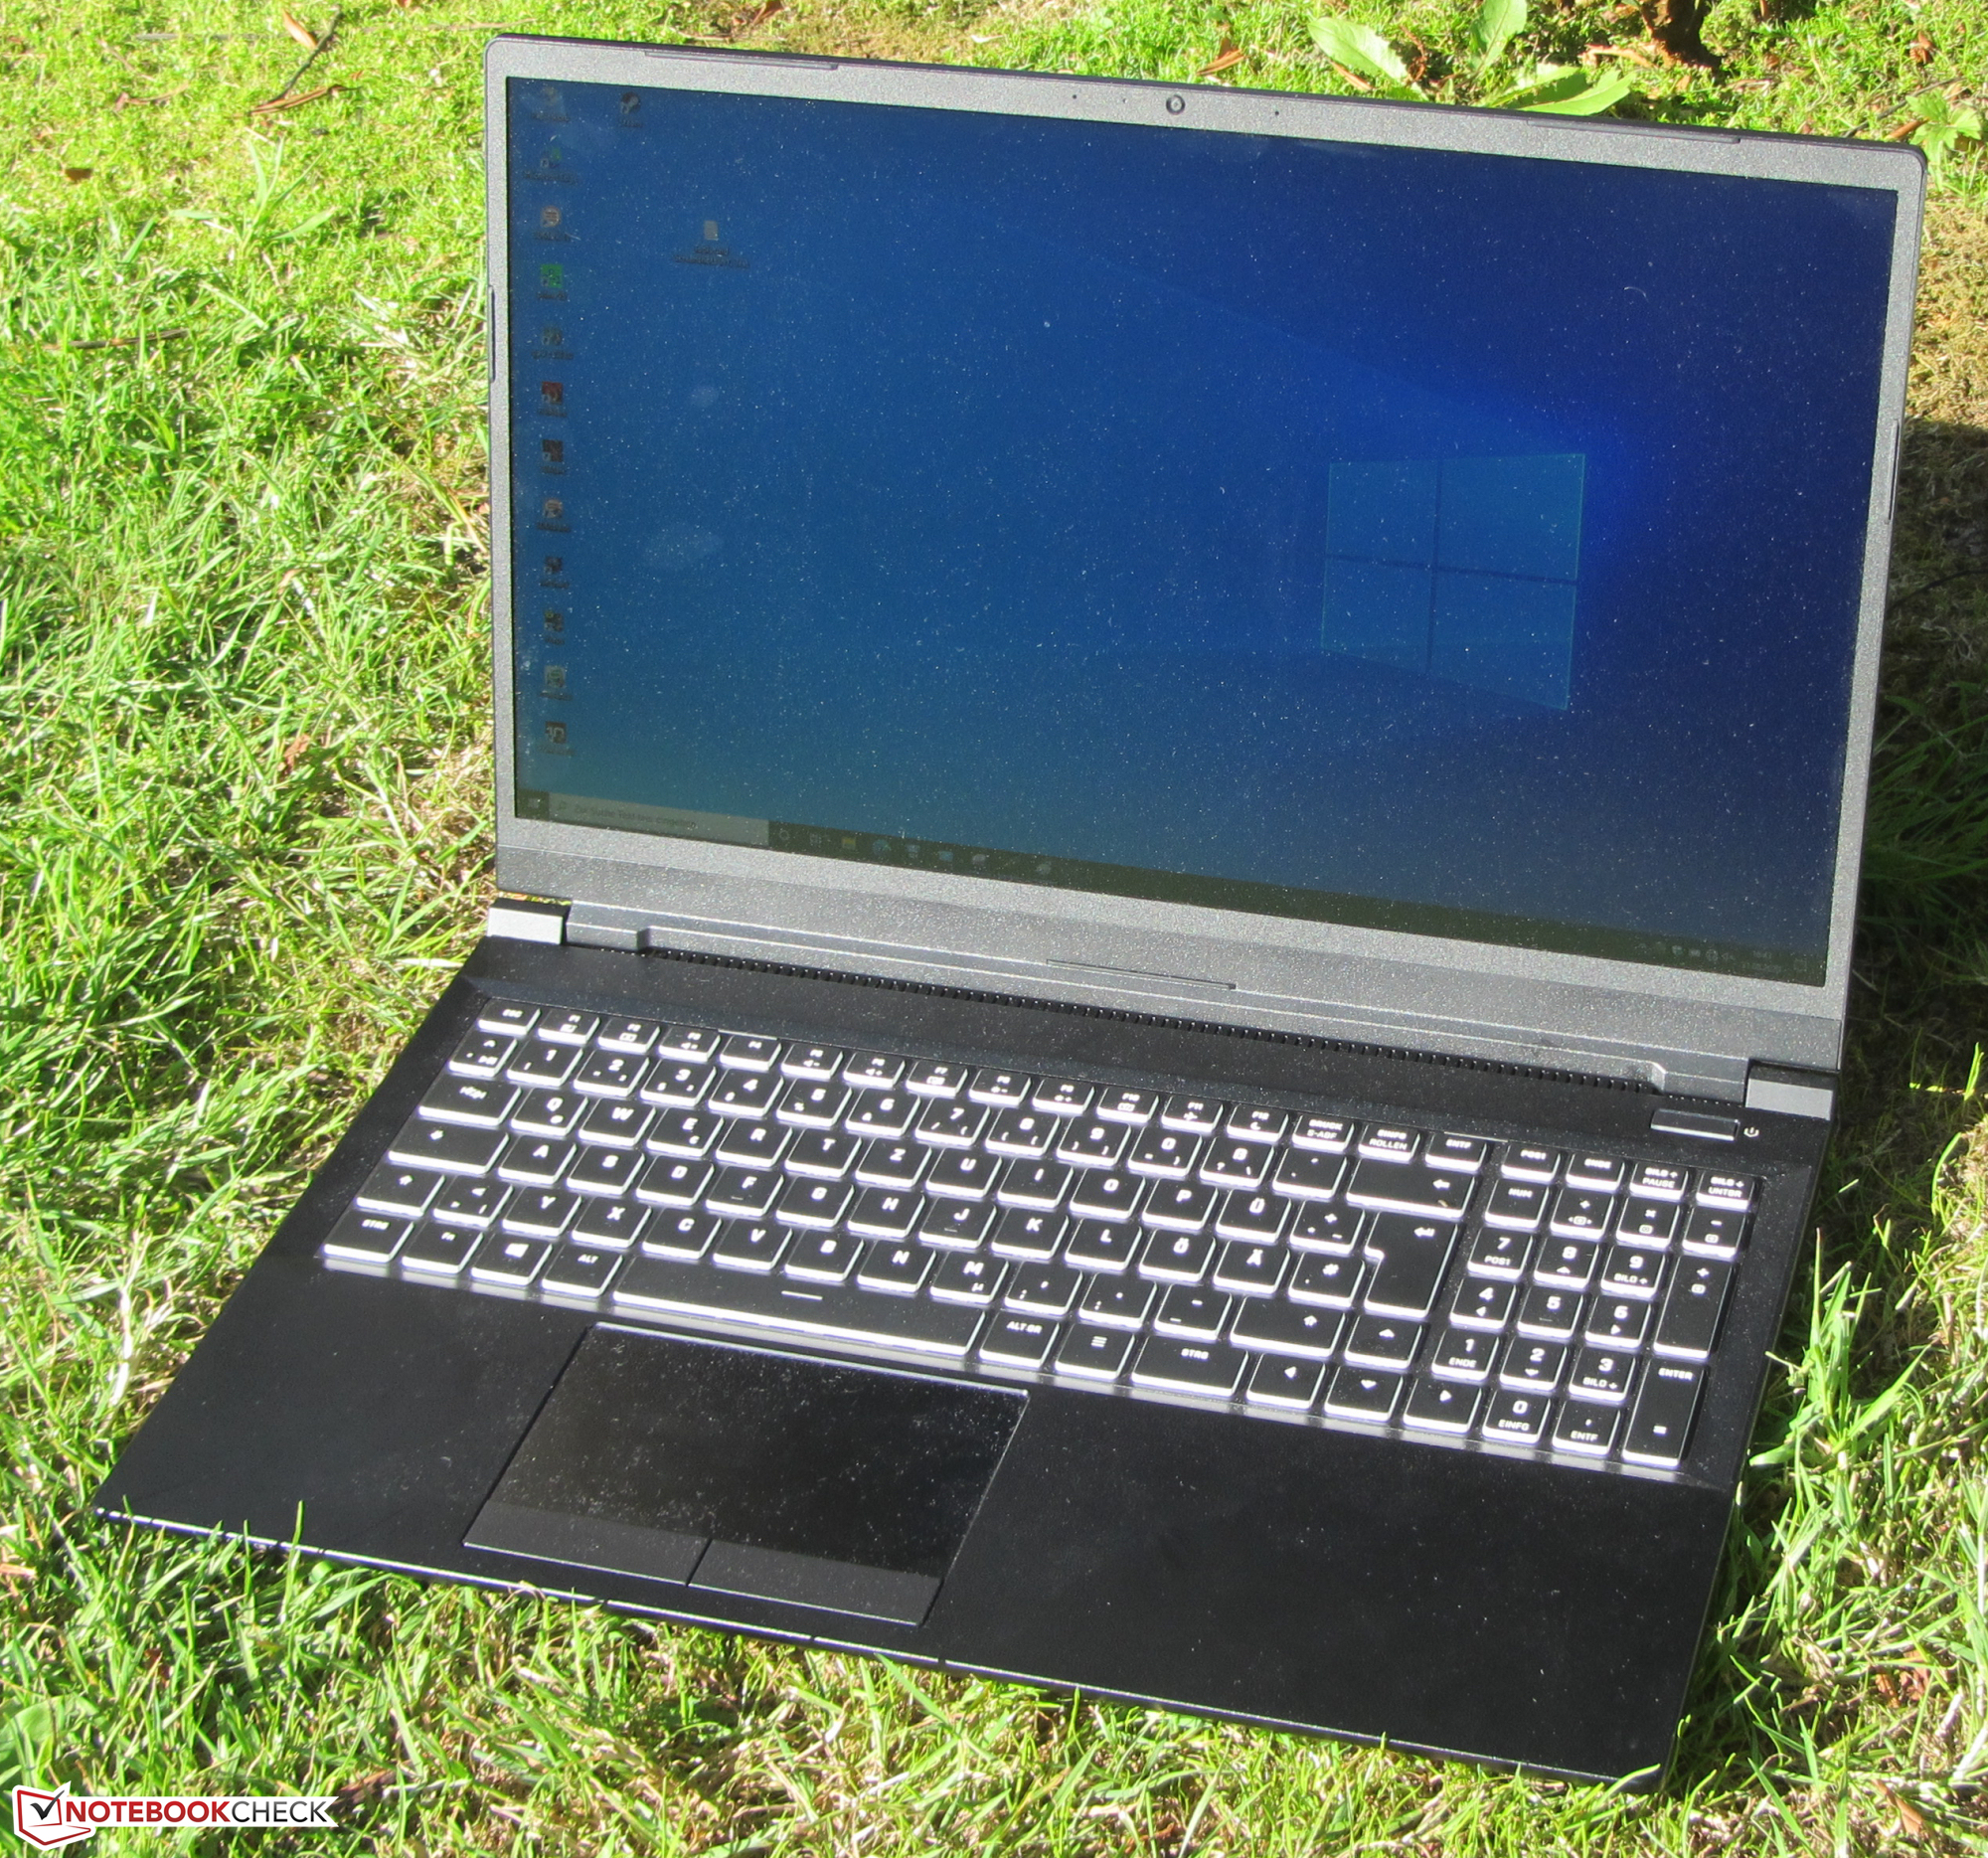
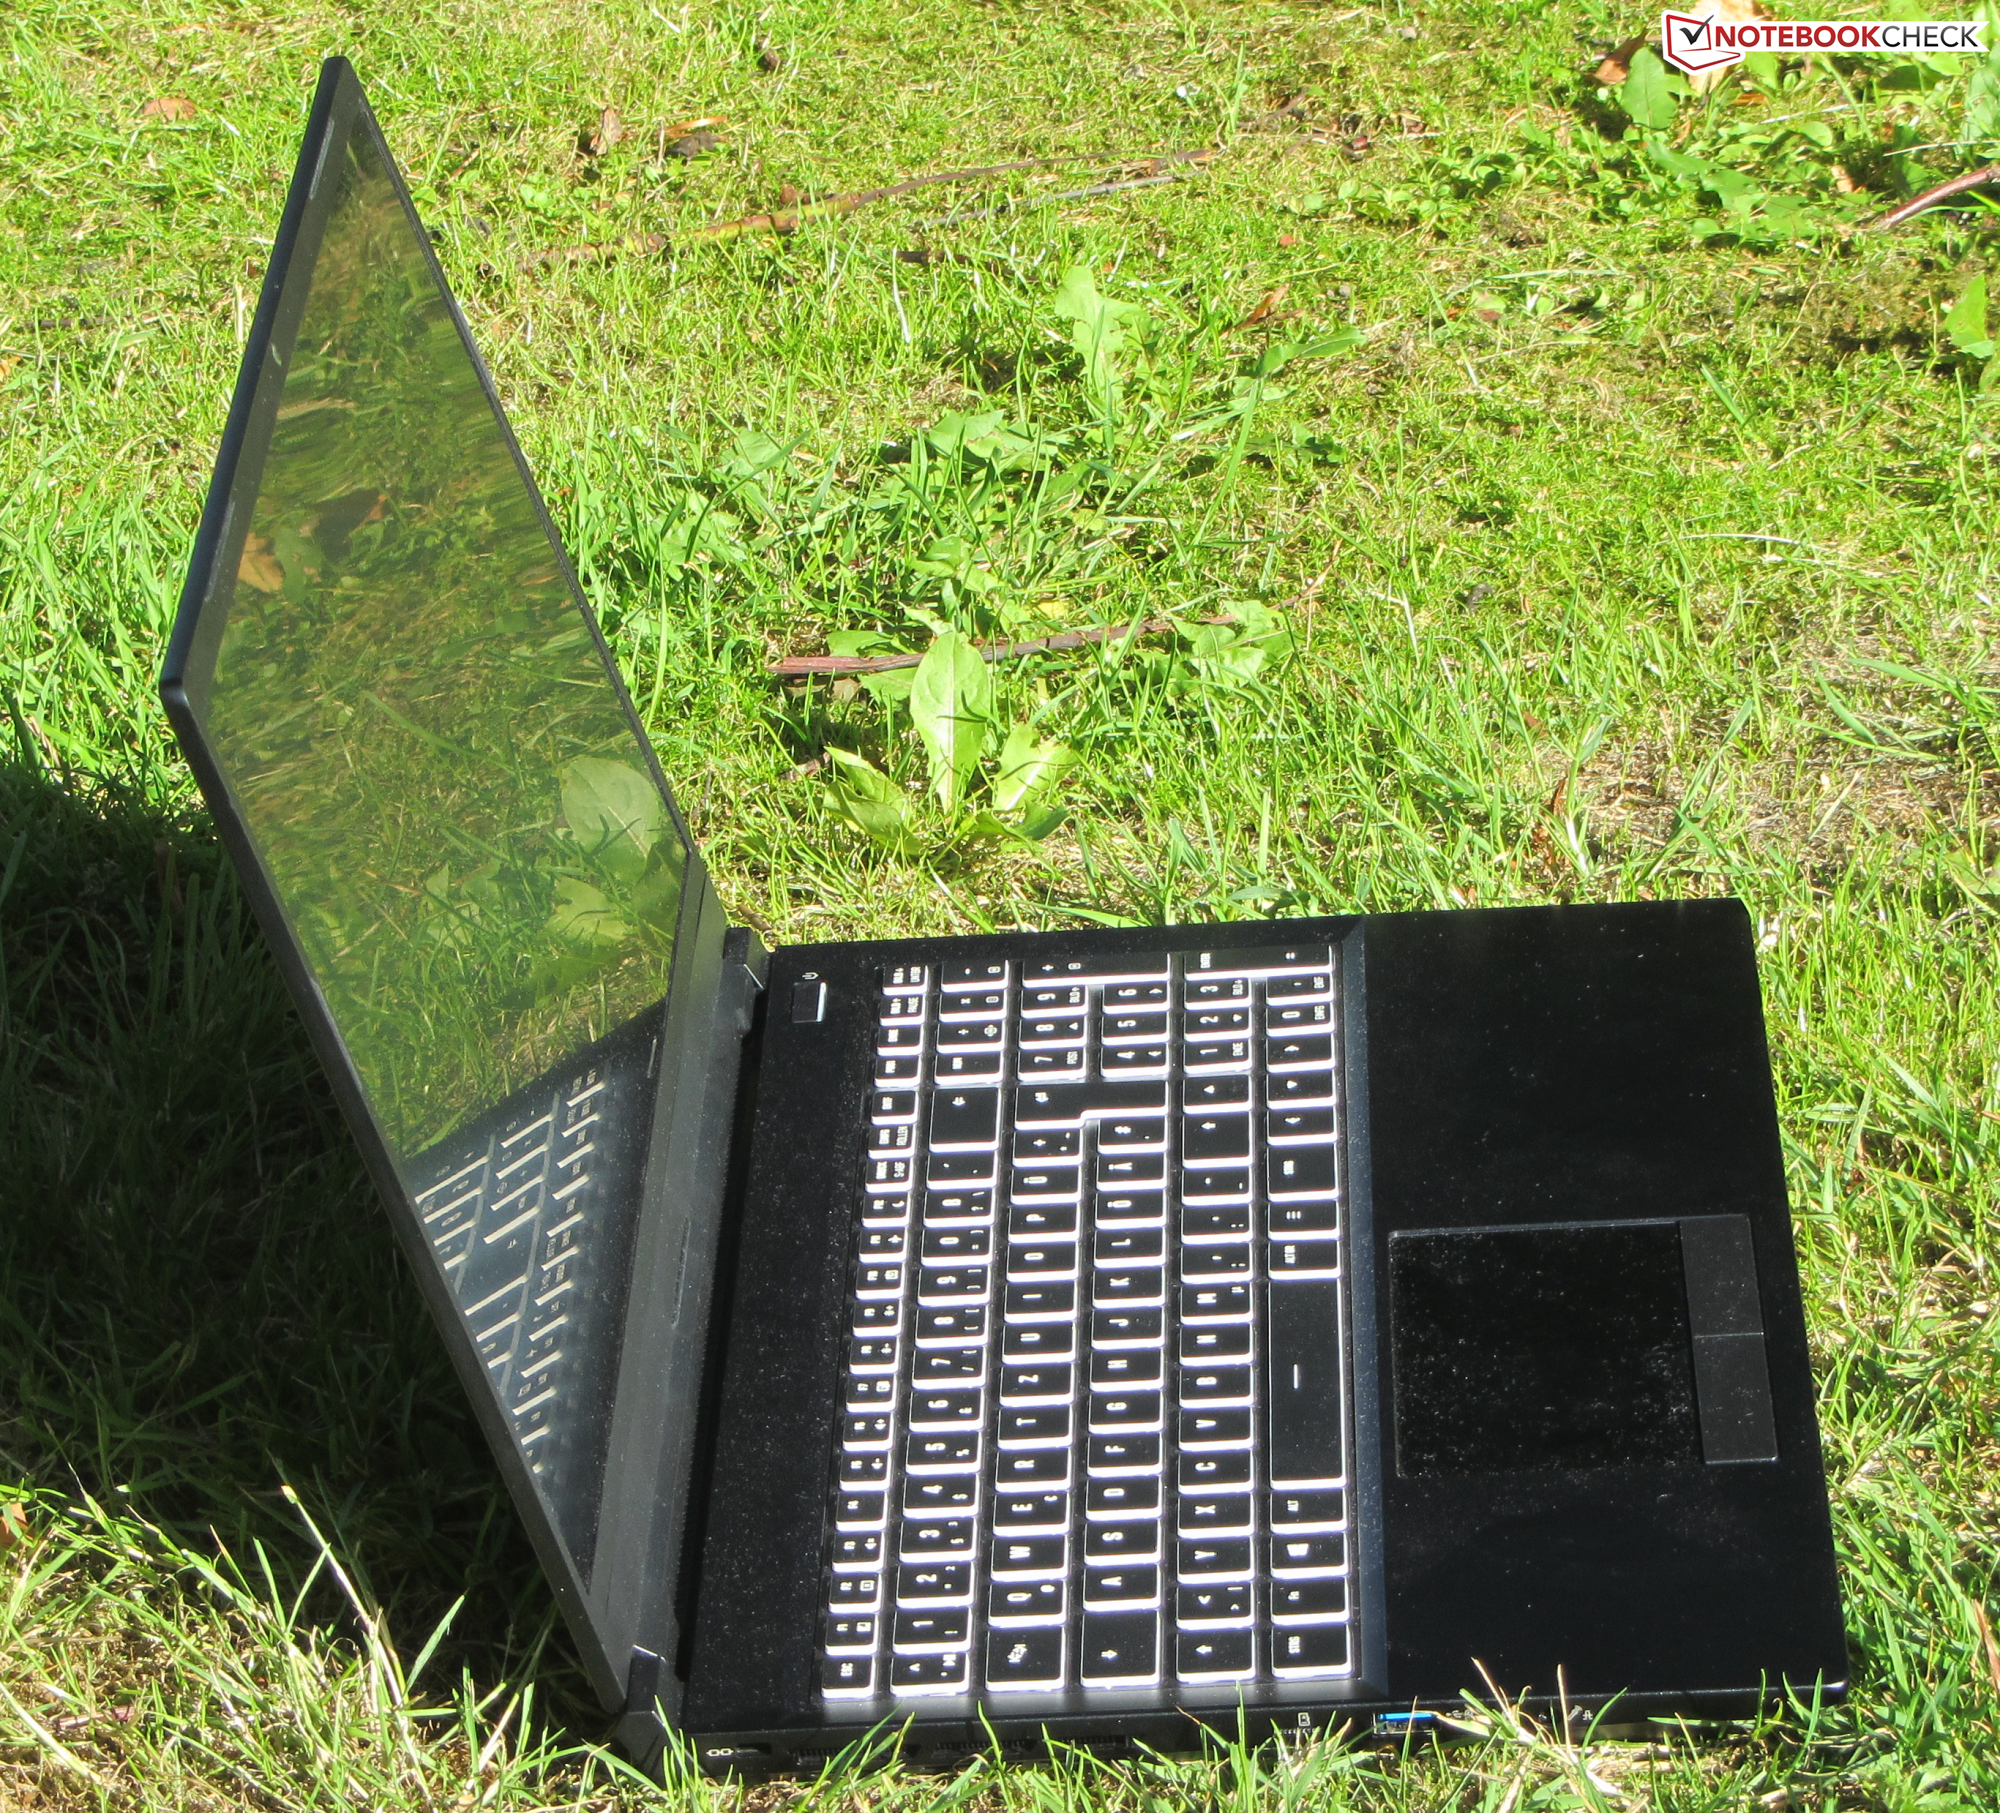
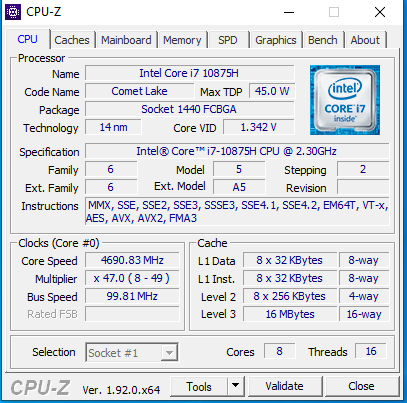
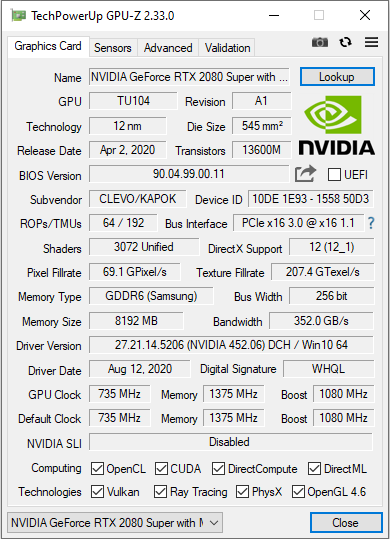
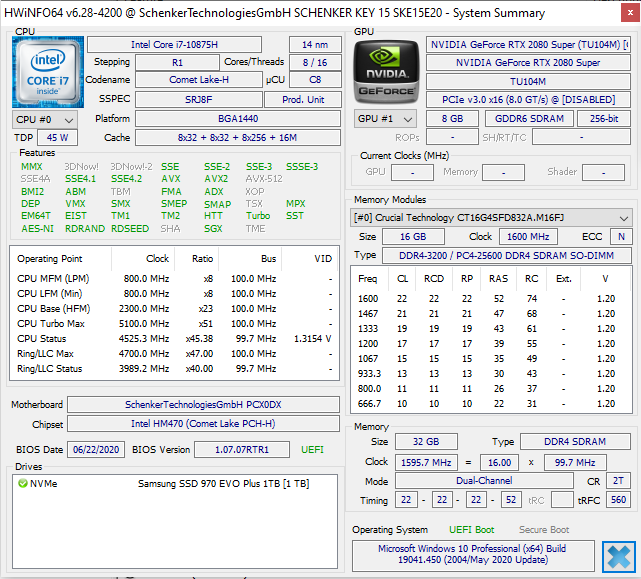
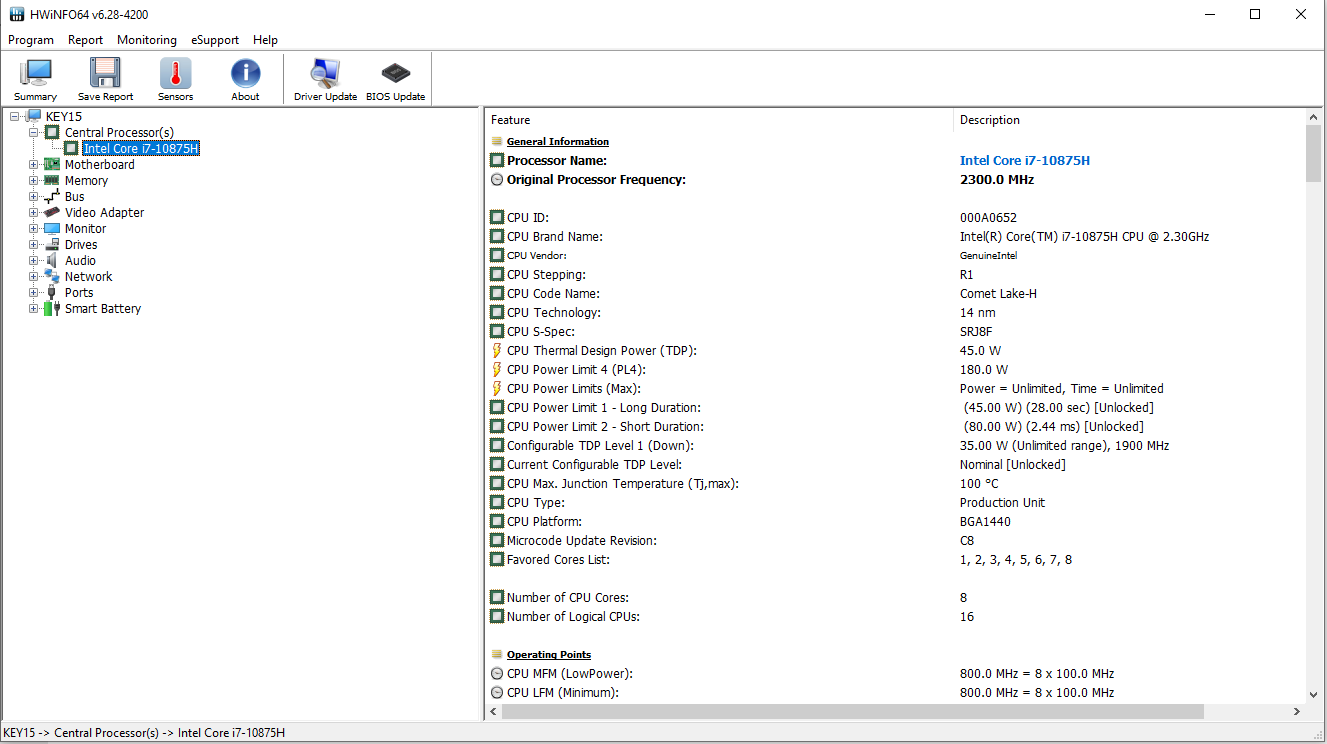
O Schenker Key 15 se enquadra na categoria de portáteis para jogos, finos e compactos. Mas não se deixe enganar por sua aparência. Com o processador Core i7-8550U octa-core e o GeForce RTX 2080 Super Max-Q núcleo gráfico, o dispositivo é equipado com componentes modernos e poderosos que rodam todos os jogos de computador mais recentes sem problemas na tela Full HD mate. As configurações de qualidade máxima sempre podem ser selecionadas aqui.
Com o Key 15, a Schenker oferece um portátil leve, poderoso, mas barulhento, que pode ser personalizado de acordo com as suas necessidades.
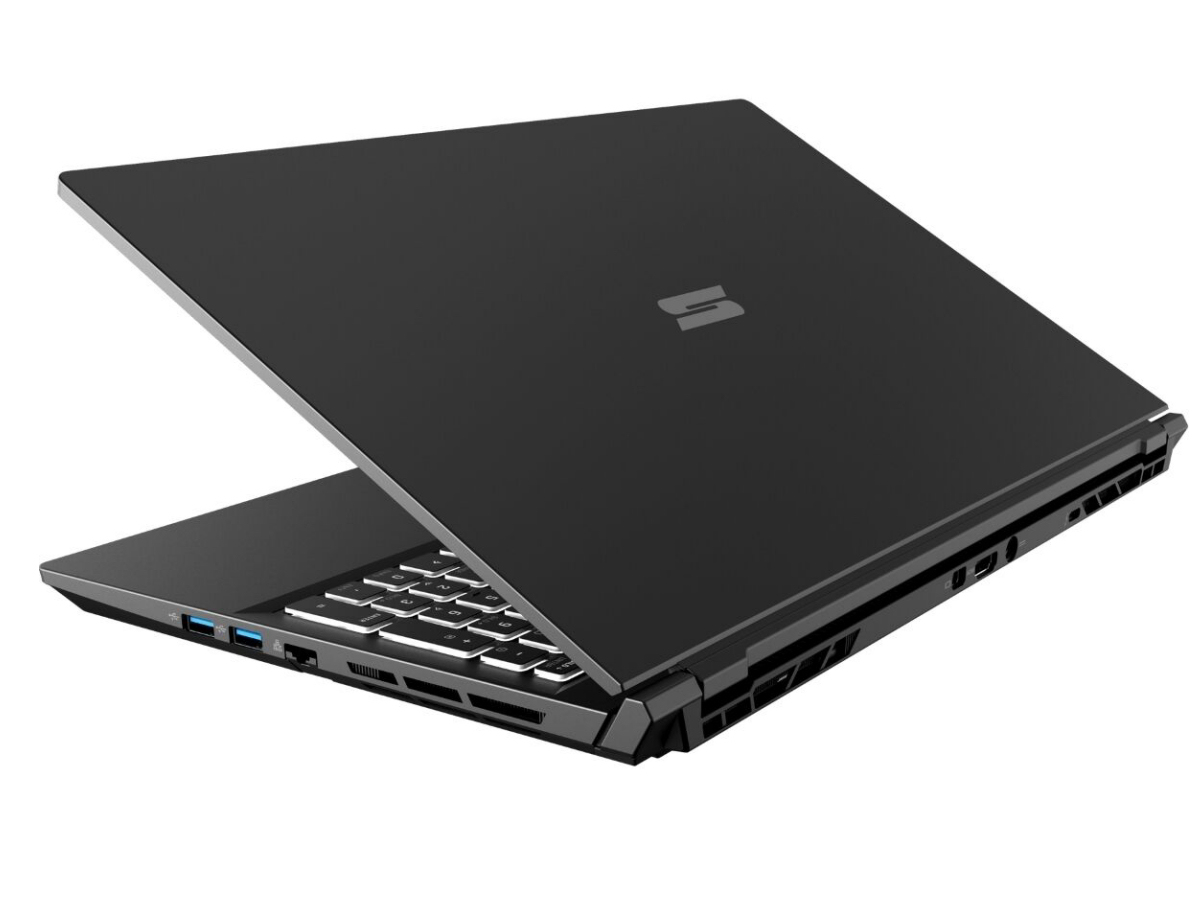
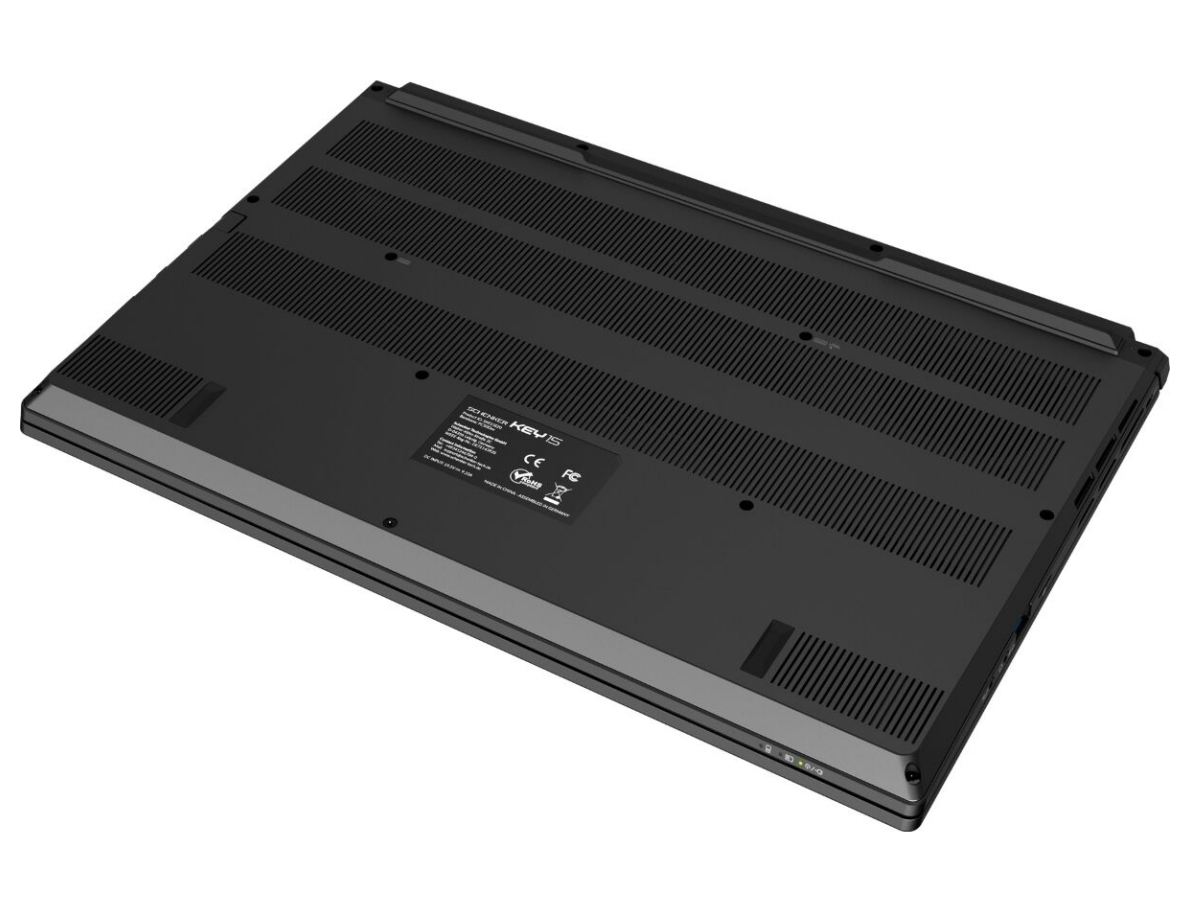
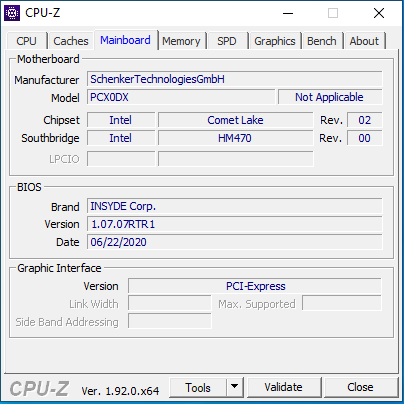
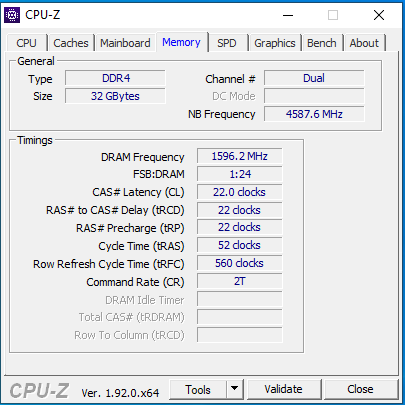
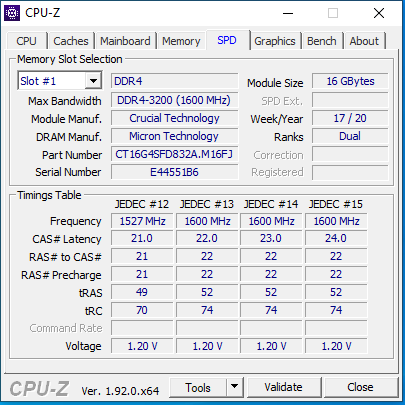
O hardware está equipado com 16 GB de RAM (modo de canal duplo) e seria possível uma atualização para até 64 GB. O portátil oferece espaço para dois SSDs M.2 2280 (1x NVMe, 1x NVMe/SATA; RAID 0/1). Se o espaço de armazenamento do SSD de 1 TB acabar, poderia ser facilmente expandido. Os procedimentos de manutenção e atualização requerem a remoção da tampa inferior da carcaça - tarefa nada complexa.
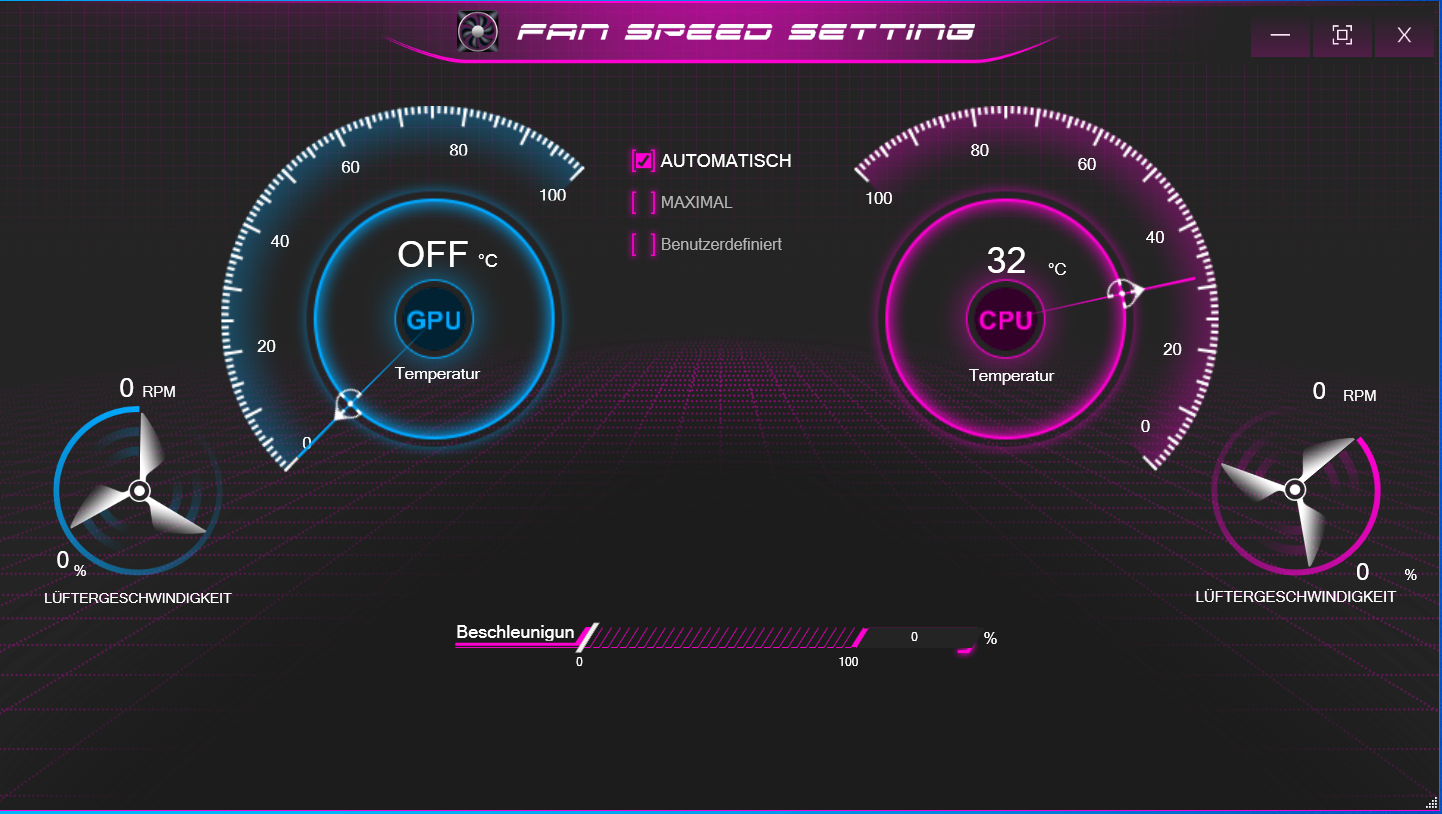
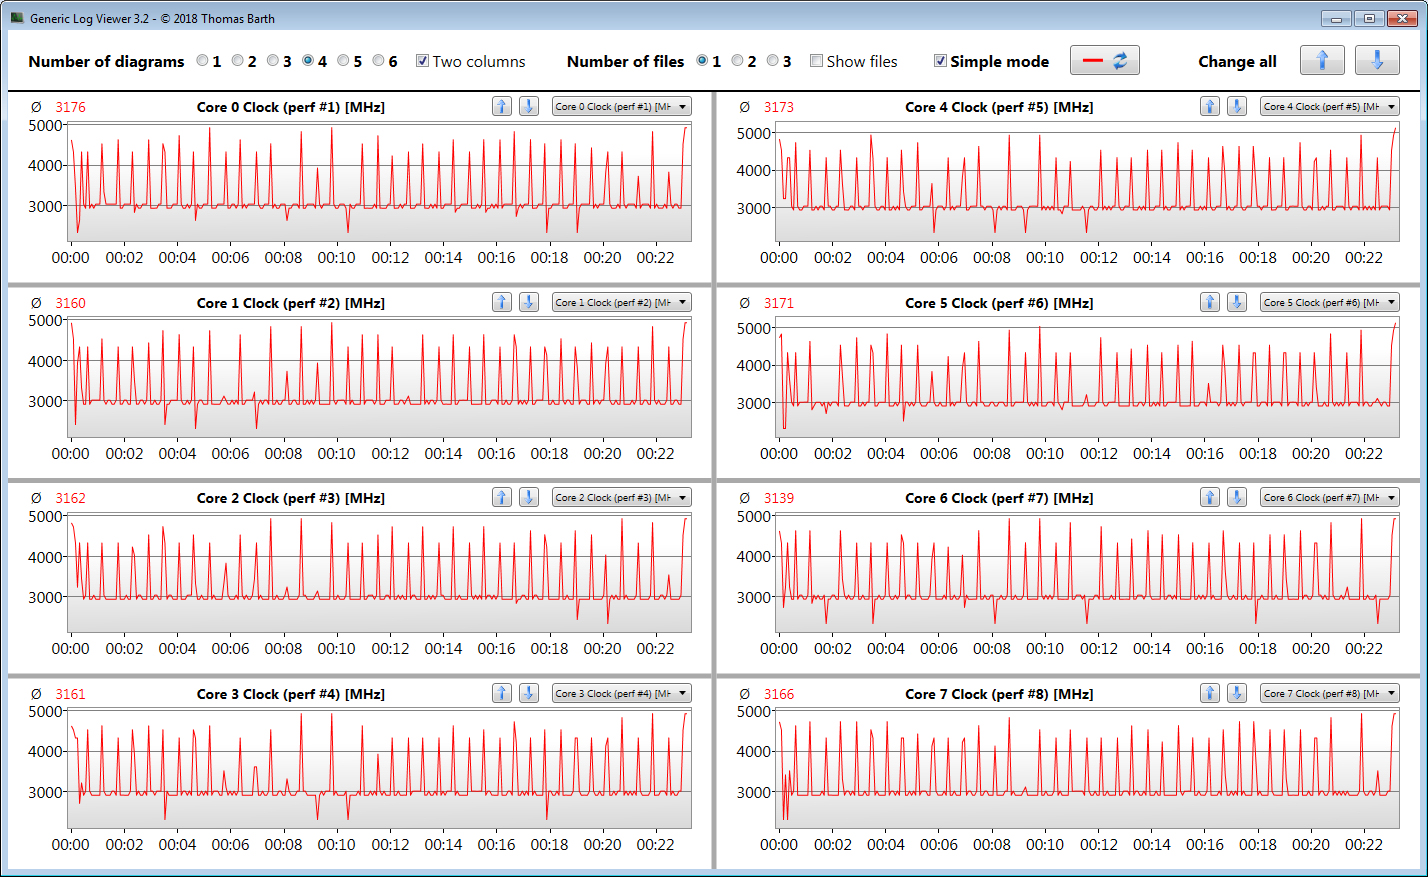
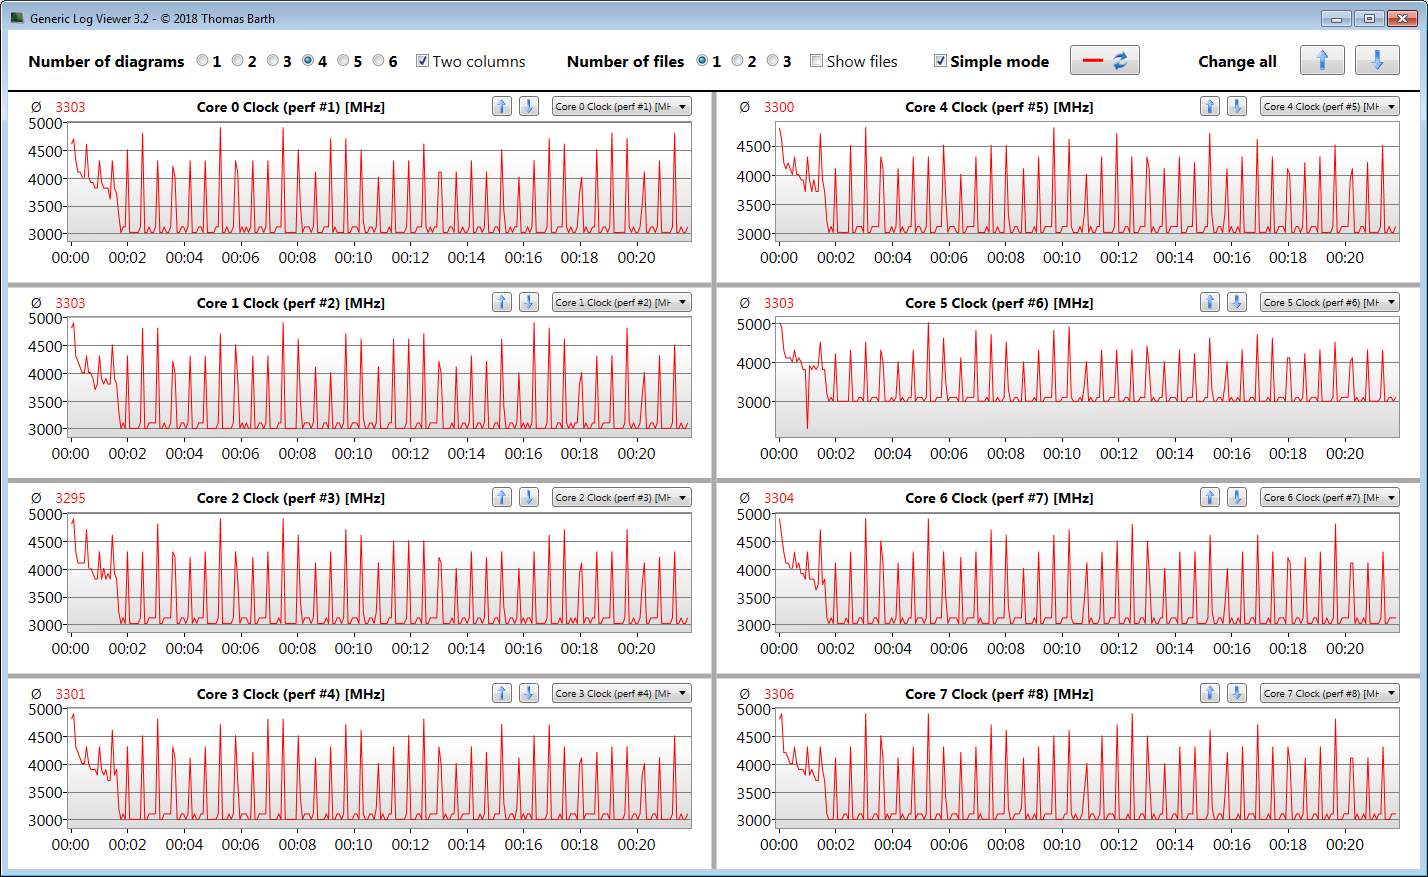
O Schenker oferece muito desempenho em uma carcaça compacta. As consequências: O portátil aquece consideravelmente sob uso intenso, e os ventiladores produzem muito ruído - também esporadicamente em uso ocioso, infelizmente. Se estiver disposto a reduzir o desempenho, o Modo Silencioso pode ser usado para fornecer um pouco menos de ruído.
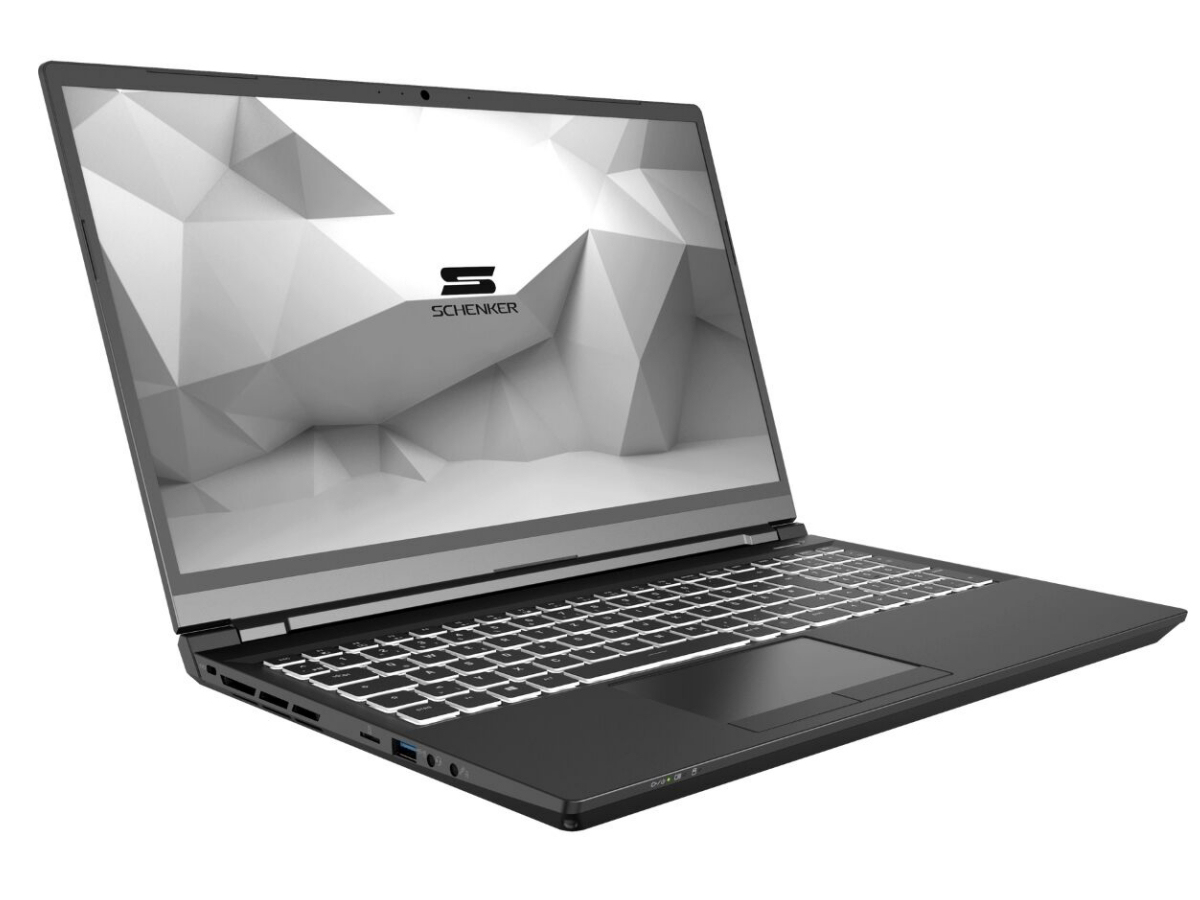
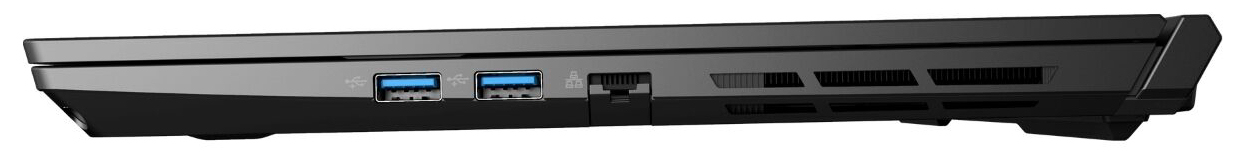
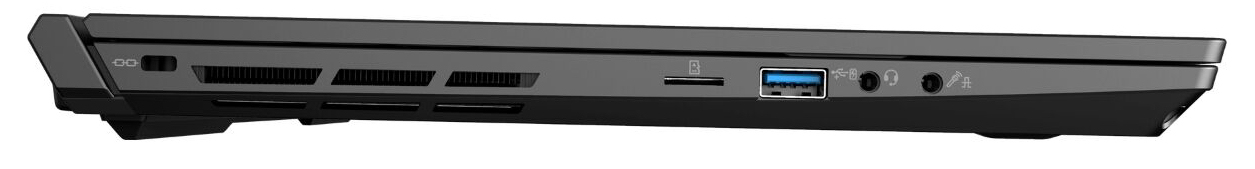
O portátil é equipado com uma porta Thunderbolt 3 que permite a conexão de uma solução docking ou uma GPU externa. Suporta DisplayPort via USB-Cl, mas não Power Delivery. O último não é surpreendente: Uma fonte de alimentação abrangente do portátil nesta conexão não seria possível, já que um máximo de 100 watts de potência podem ser transferidos. No entanto, concorrentes similares como o Blade 15 Advanced oferecem a possibilidade de carregar a bateria através da porta Thunderbolt 3. Esta função não é suportada pela tecla.
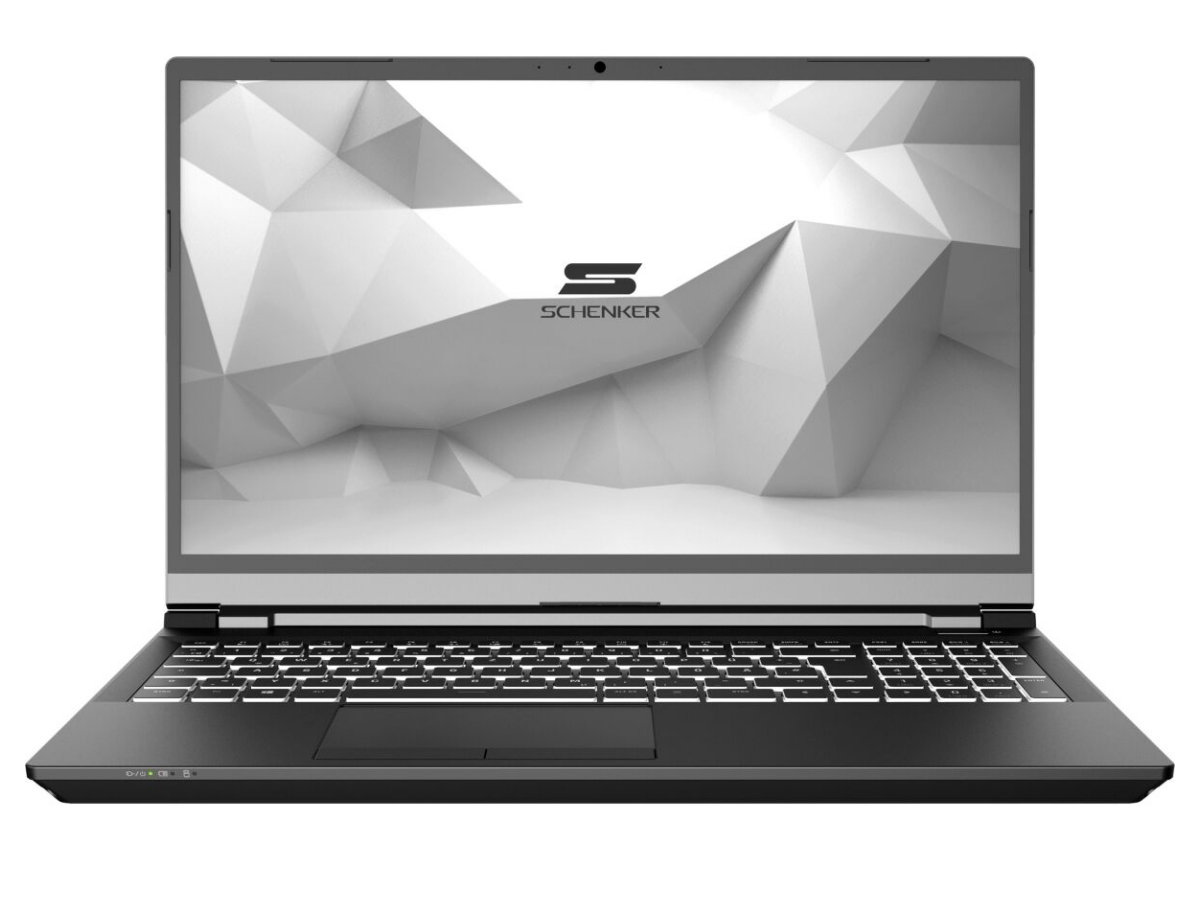
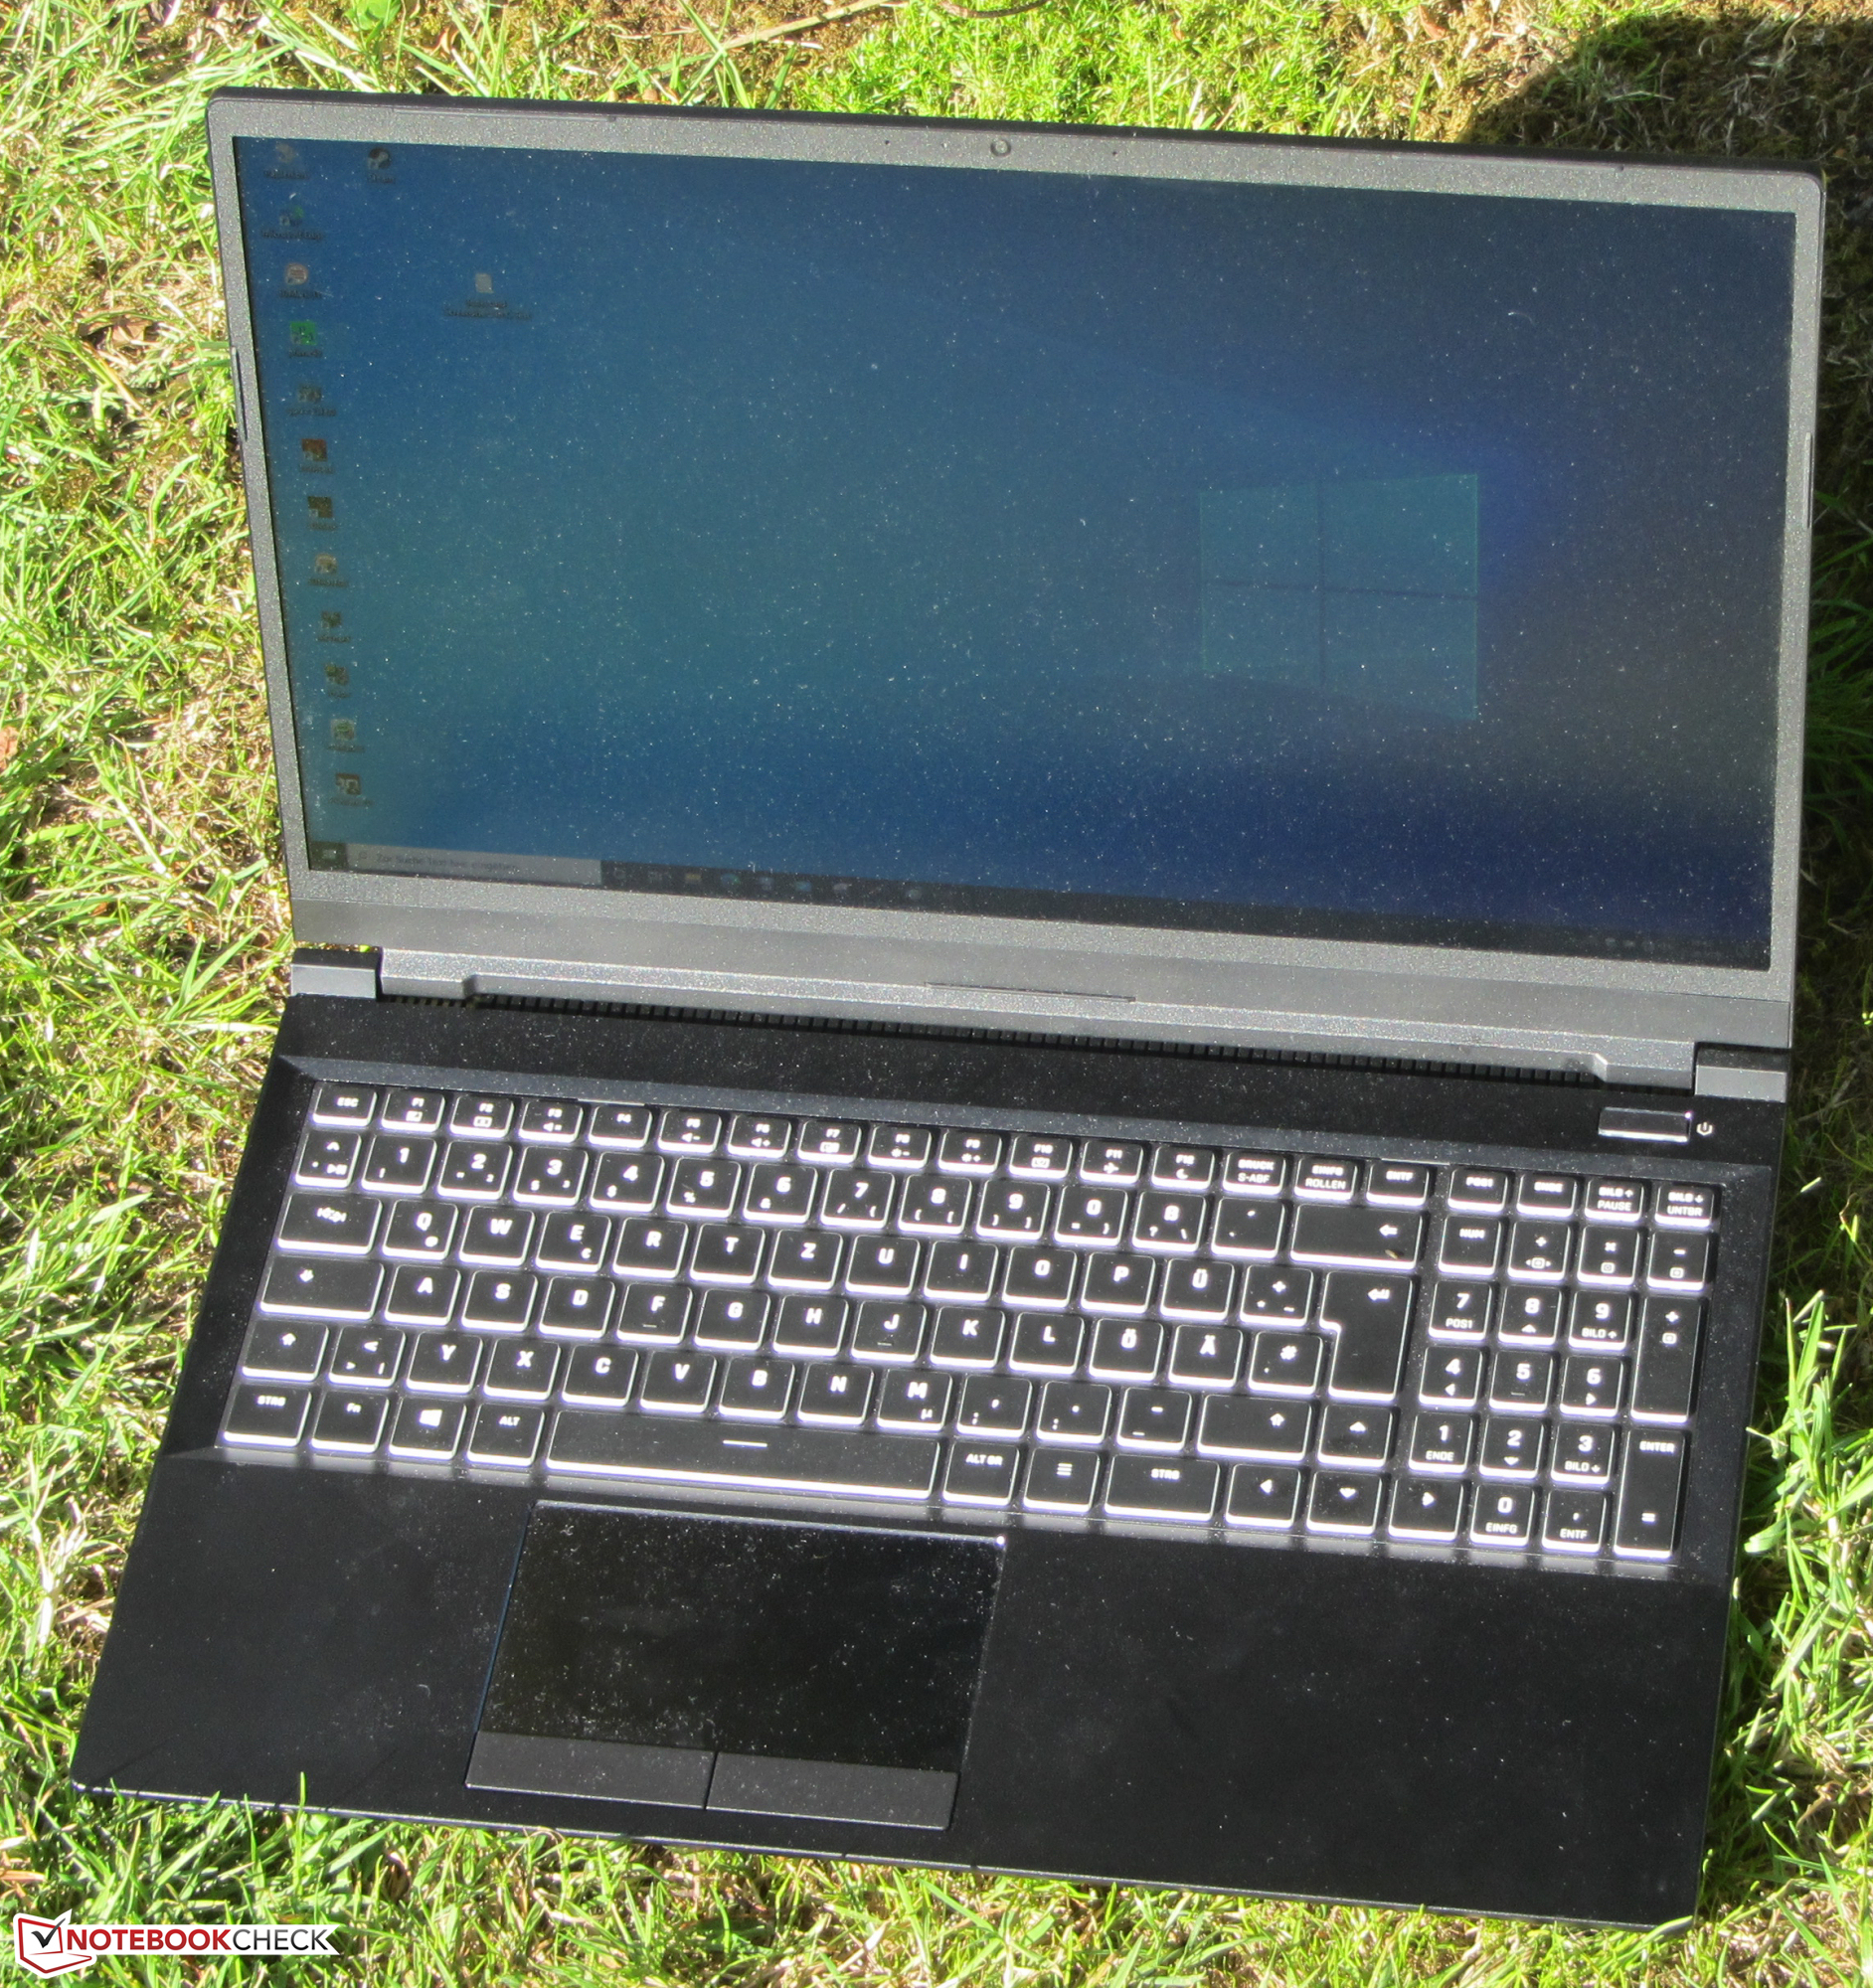
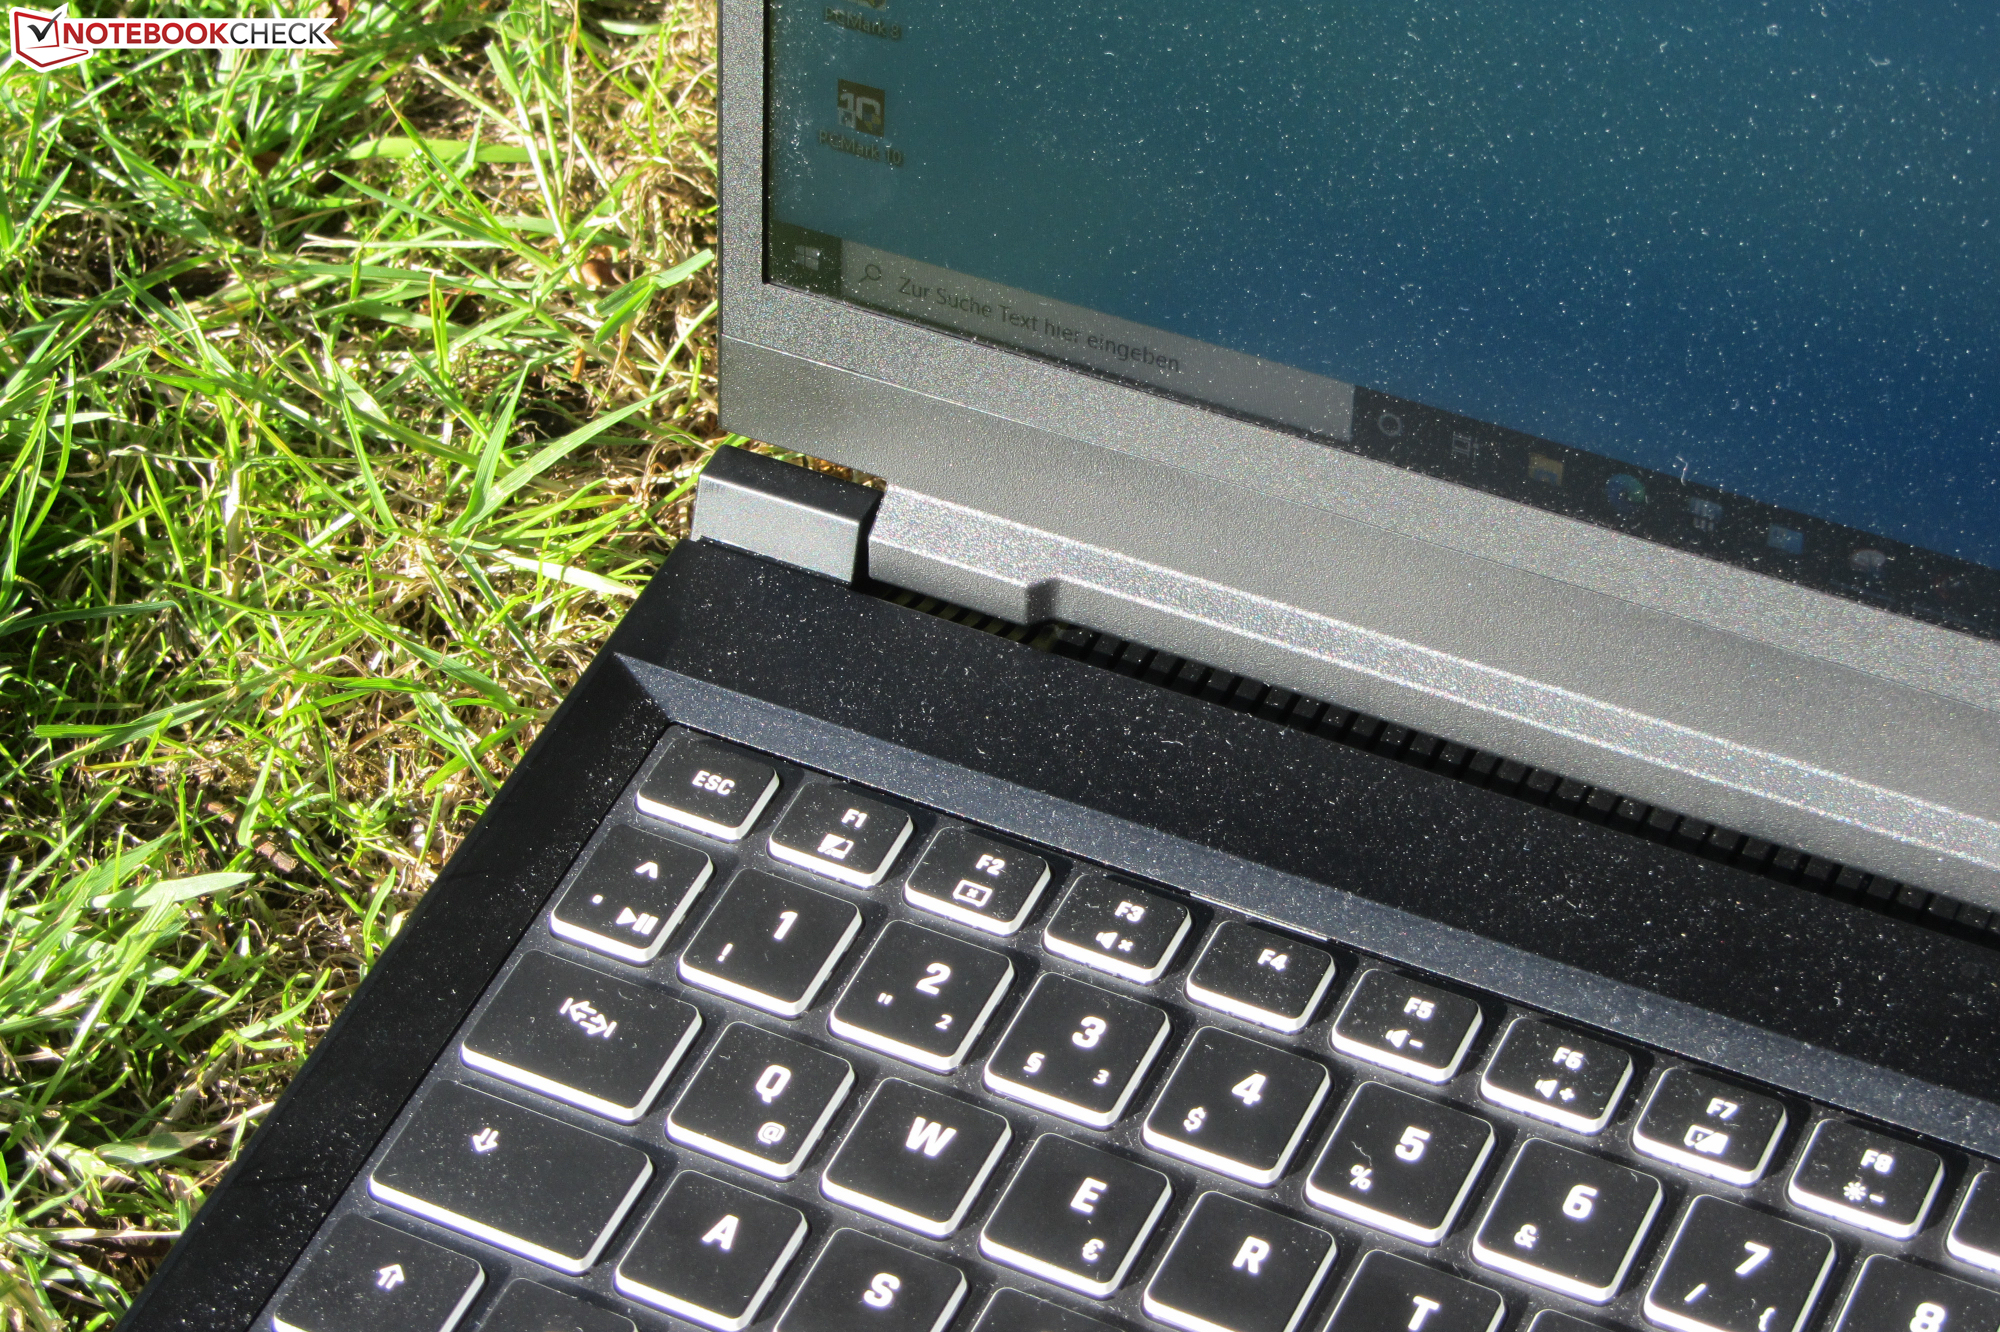
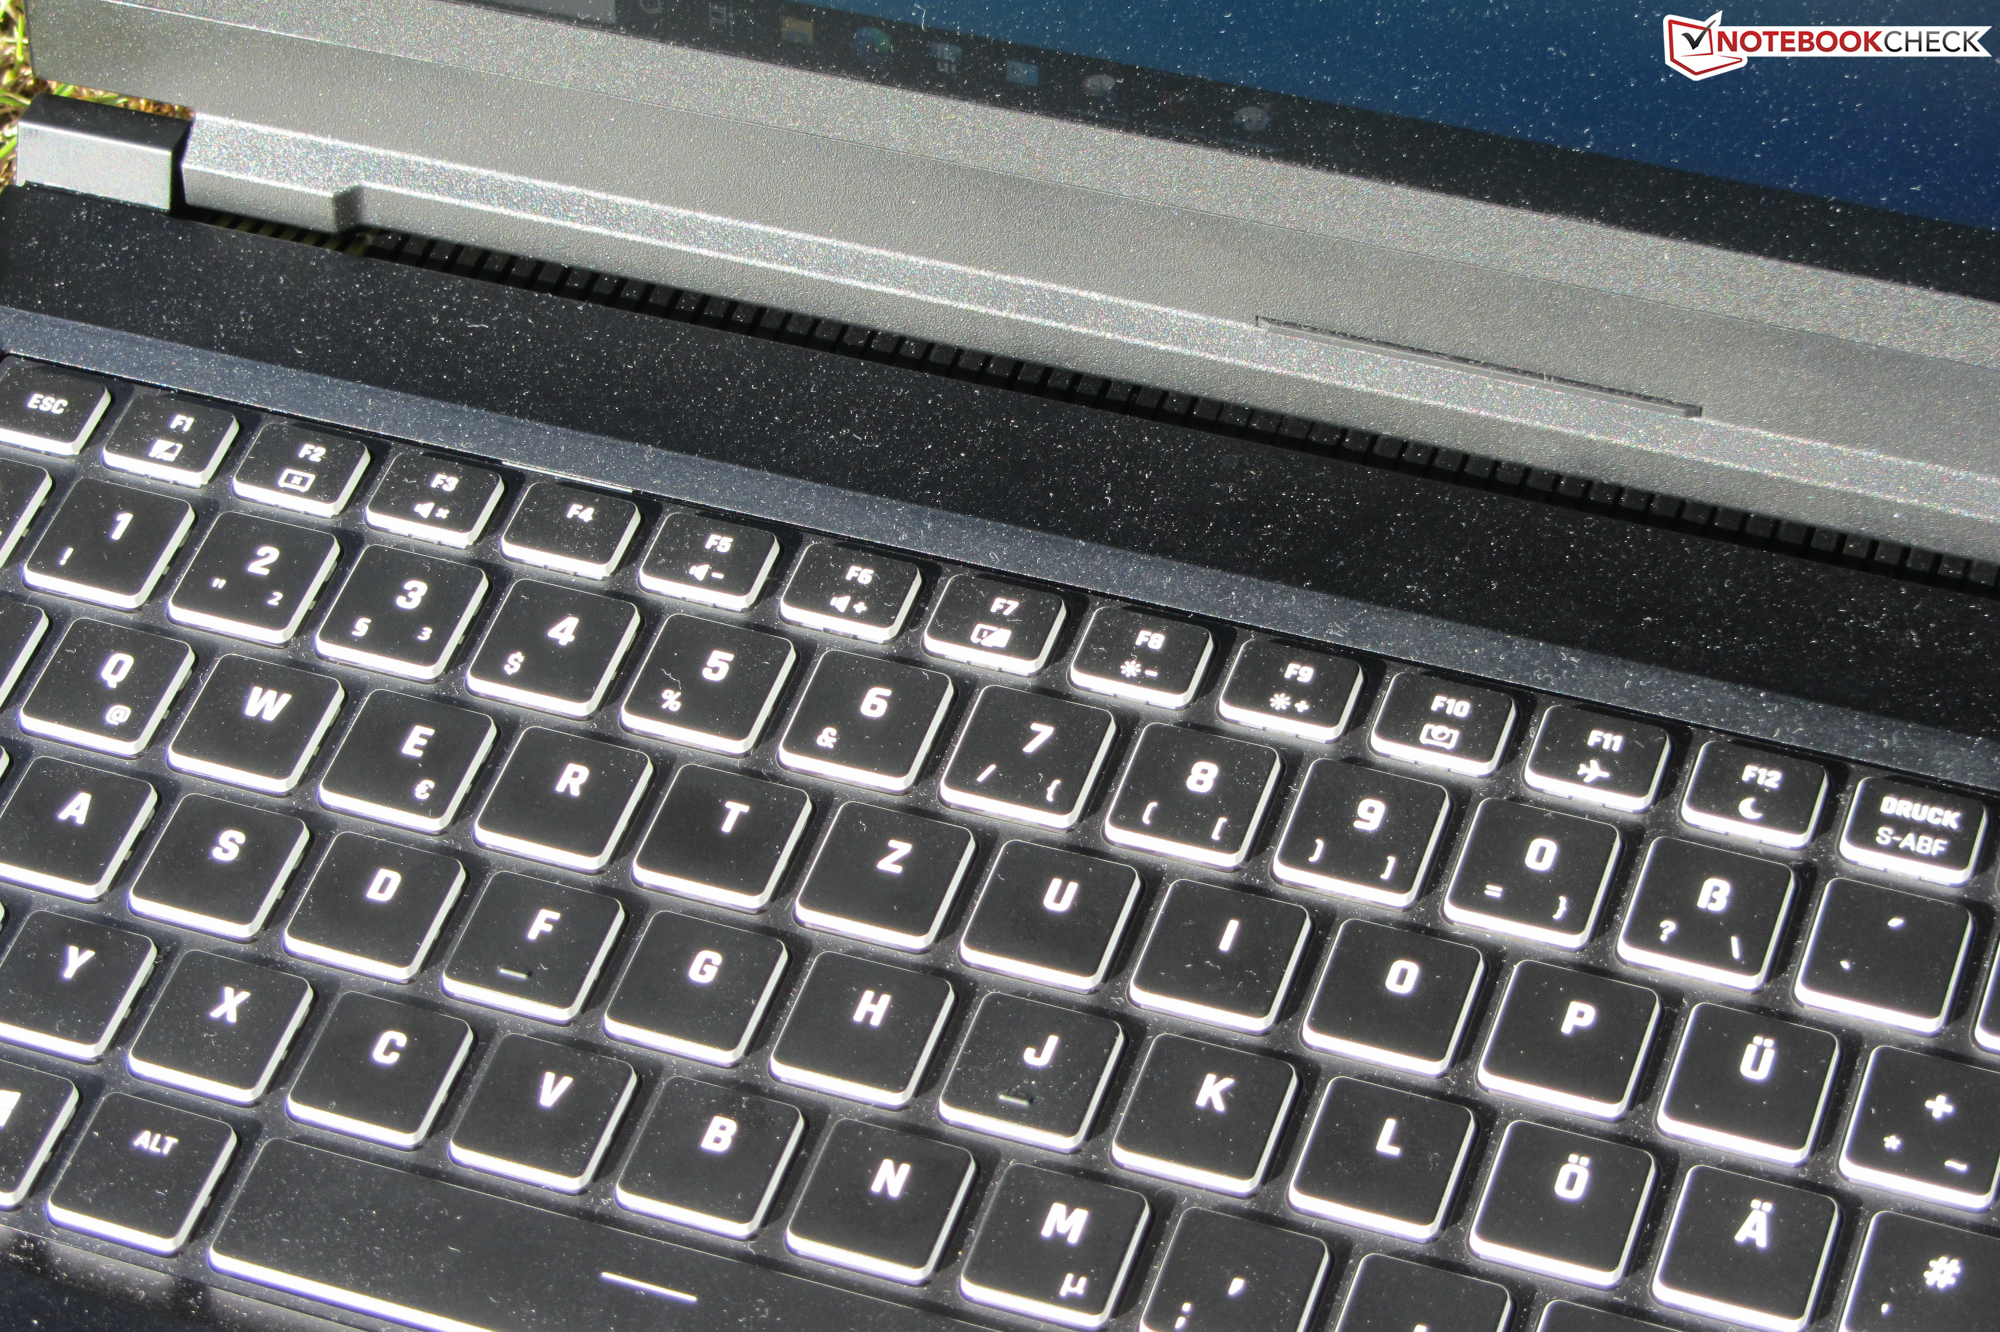
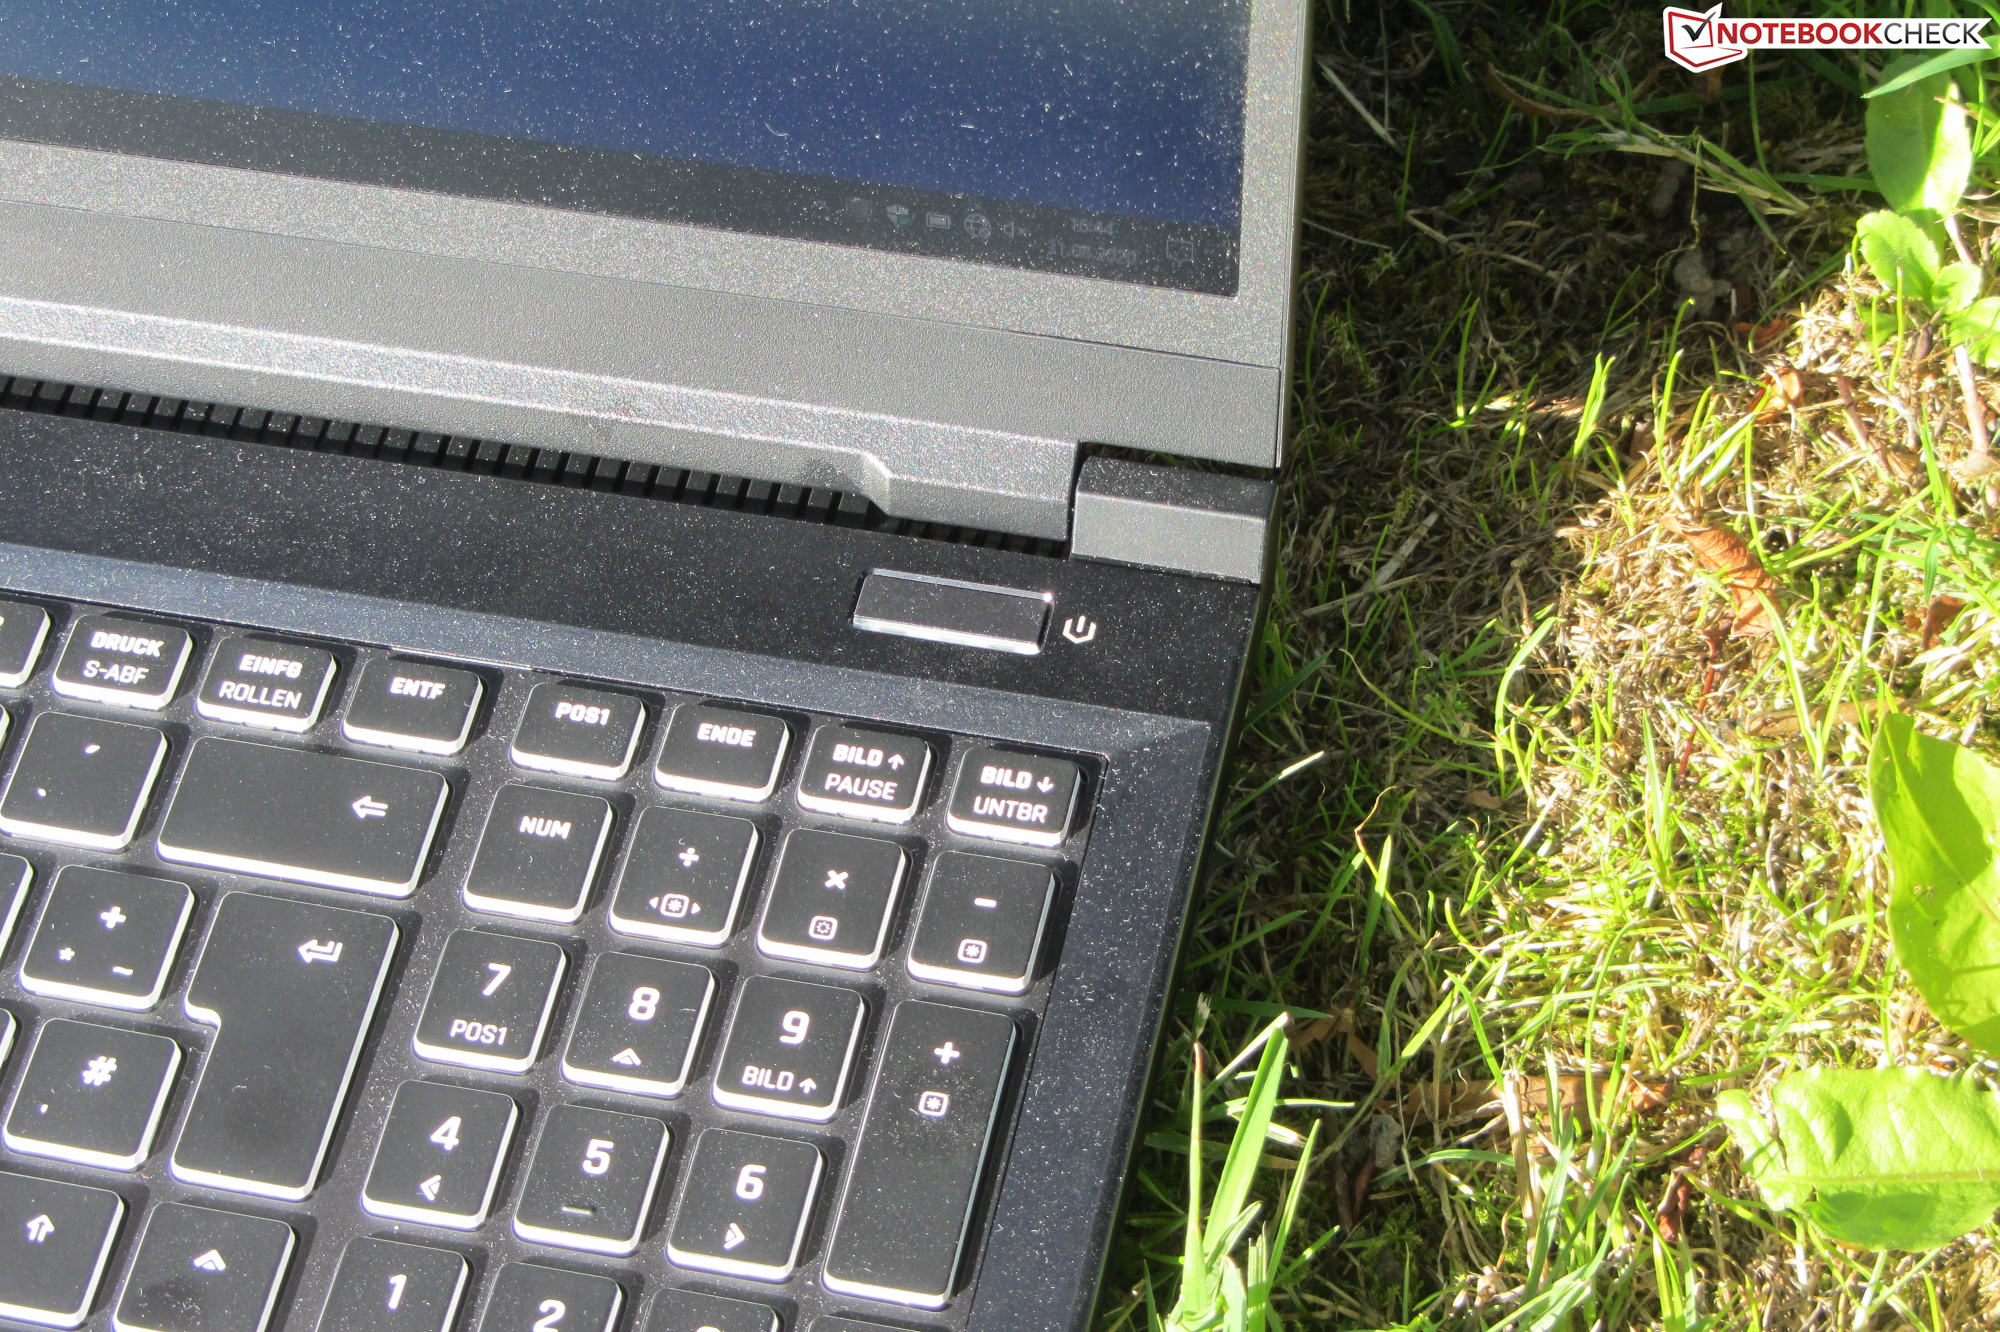
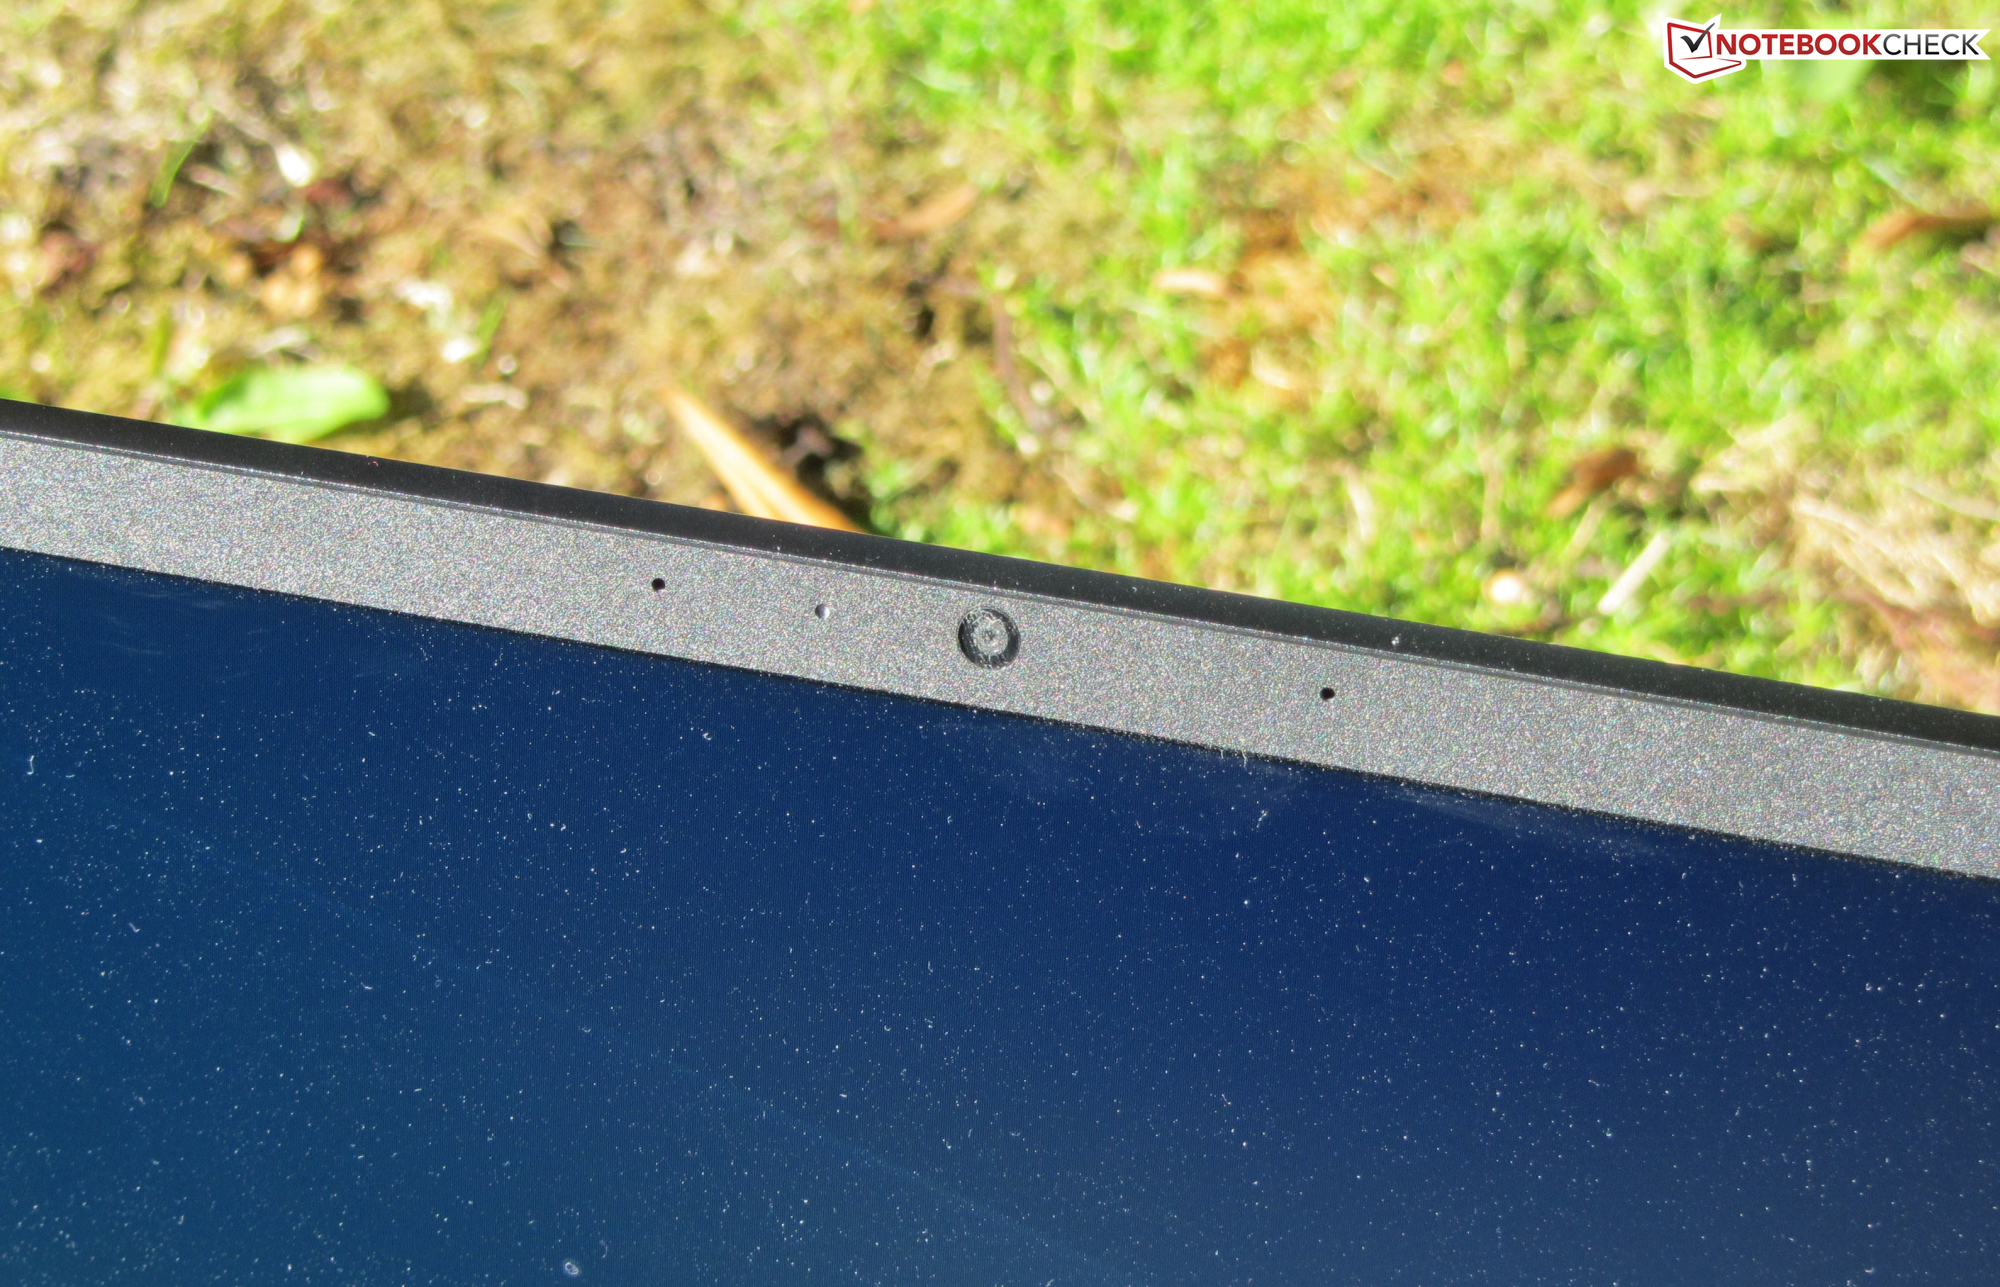
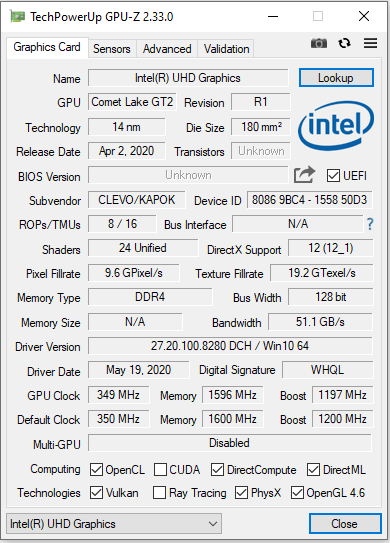
A tela Full HD (IPS, 144 Hz) oferece ângulos de visão estáveis, uma superfície mate, bom contraste, tempos de resposta rápidos, reprodução de cores decente e cobertura de espaço de cores aceitável. No entanto, o brilho máximo é um pouco baixo demais. O teclado embutido (iluminação RGB) provou ser adequado para o uso diário. Além disso, a duração da bateria também é decente.
Schenker Key 15 Comet Lake
- 09/07/2020 v7 (old)
Sascha Mölck
Price comparison
