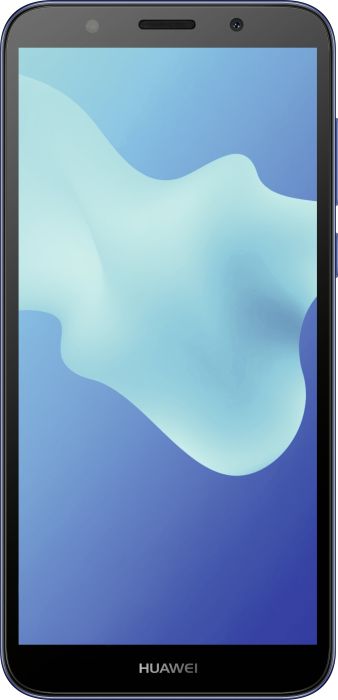
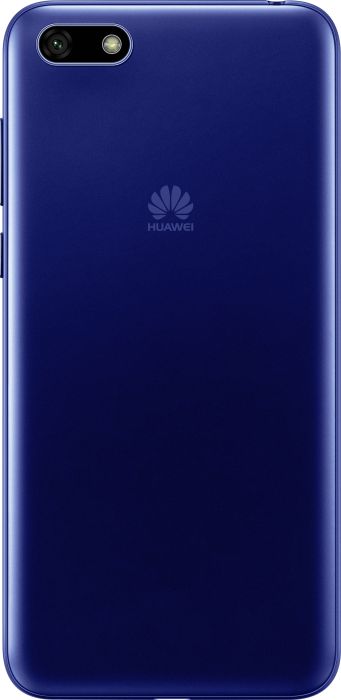
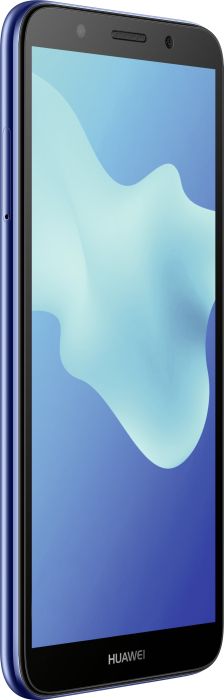
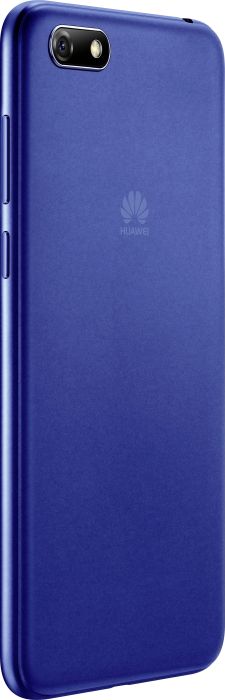
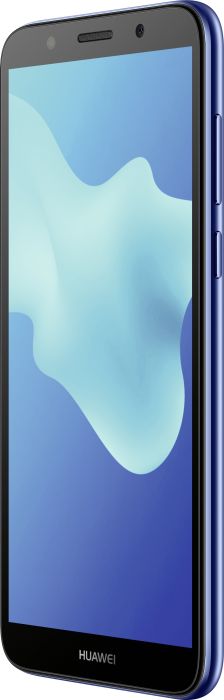
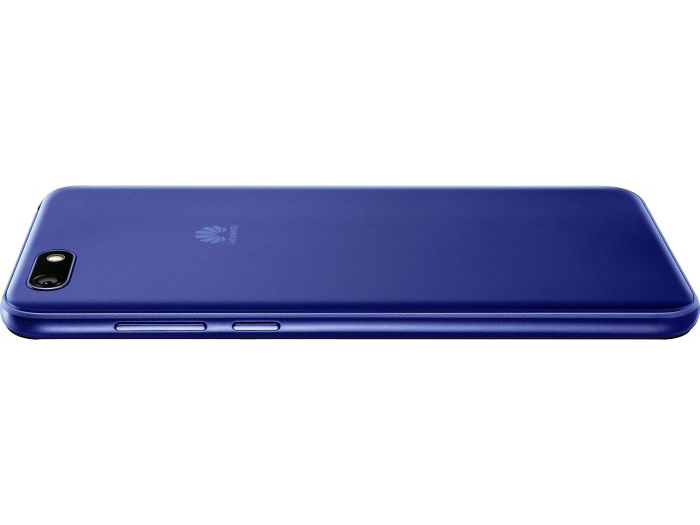
Breve Análise do Smartphone Huawei Y5 2018
| Networking | |
| iperf3 transmit AX12 | |
| Xiaomi Mi A1 | |
| Sony Xperia L1 | |
| Umidigi A1 Pro | |
| Huawei Y5 2018 | |
| Lenovo Moto E4 Plus | |
| iperf3 receive AX12 | |
| Xiaomi Mi A1 | |
| Sony Xperia L1 | |
| Umidigi A1 Pro | |
| Huawei Y5 2018 | |
| Lenovo Moto E4 Plus | |


| |||||||||||||||||||||||||
iluminação: 91 %
iluminação com acumulador: 475 cd/m²
Contraste: 625:1 (Preto: 0.76 cd/m²)
ΔE ColorChecker Calman: 9.12 | ∀{0.5-29.43 Ø4.73}
ΔE Greyscale Calman: 12 | ∀{0.09-98 Ø4.97}
96.4% sRGB (Calman 2D)
Gamma: 2.342
CCT: 9861 K
| Huawei Y5 2018 IPS, 1440x720, 5.5" | Lenovo Moto E4 Plus IPS, 1280x720, 5.5" | Sony Xperia L1 IPS, 1280x720, 5.5" | Umidigi A1 Pro IPS, 1440x720, 5.5" | Xiaomi Mi A1 IPS, 1920x1080, 5.5" | |
|---|---|---|---|---|---|
| Screen | 35% | 30% | 65% | 43% | |
| Brightness middle (cd/m²) | 475 | 425 -11% | 479 1% | 594 25% | 503 6% |
| Brightness (cd/m²) | 470 | 425 -10% | 478 2% | 570 21% | 478 2% |
| Brightness Distribution (%) | 91 | 93 2% | 94 3% | 86 -5% | 88 -3% |
| Black Level * (cd/m²) | 0.76 | 0.37 51% | 0.58 24% | 0.22 71% | 0.37 51% |
| Contrast (:1) | 625 | 1149 84% | 826 32% | 2700 332% | 1359 117% |
| Colorchecker dE 2000 * | 9.12 | 4.7 48% | 4.5 51% | 6.63 27% | 3.92 57% |
| Colorchecker dE 2000 max. * | 18.86 | 8.3 56% | 7.5 60% | 13.99 26% | 7.86 58% |
| Greyscale dE 2000 * | 12 | 4.6 62% | 4.1 66% | 9.2 23% | 4.9 59% |
| Gamma | 2.342 94% | 2.17 101% | 2.03 108% | 2.24 98% | 2.223 99% |
| CCT | 9861 66% | 7445 87% | 7139 91% | 8663 75% | 7884 82% |
* ... menor é melhor
Cintilação da tela / PWM (modulação por largura de pulso)
| Tela tremeluzindo/PWM detectado | 166.7 Hz | ≤ 25 % configuração de brilho | 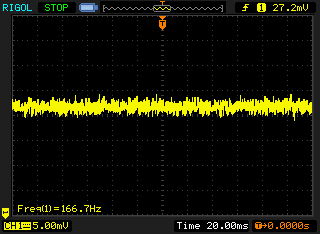 |
A luz de fundo da tela pisca em 166.7 Hz (pior caso, por exemplo, utilizando PWM) Cintilação detectada em uma configuração de brilho de 25 % e abaixo. Não deve haver cintilação ou PWM acima desta configuração de brilho. A frequência de 166.7 Hz é relativamente baixa, portanto, usuários sensíveis provavelmente notarão cintilação e sentirão fadiga ocular na configuração de brilho indicada e abaixo. [pwm_comparison] Em comparação: 52 % de todos os dispositivos testados não usam PWM para escurecer a tela. Se PWM foi detectado, uma média de 7810 (mínimo: 5 - máximo: 343500) Hz foi medida. | |||
Exibir tempos de resposta
| ↔ Tempo de resposta preto para branco | ||
|---|---|---|
| 18 ms ... ascensão ↗ e queda ↘ combinadas | ↗ 7 ms ascensão | 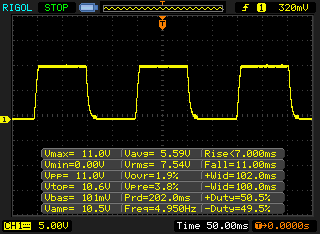 |
| ↘ 11 ms queda | ||
| A tela mostra boas taxas de resposta em nossos testes, mas pode ser muito lenta para jogadores competitivos. Em comparação, todos os dispositivos testados variam de 0.1 (mínimo) a 240 (máximo) ms. » 40 % de todos os dispositivos são melhores. Isso significa que o tempo de resposta medido é semelhante à média de todos os dispositivos testados (19.9 ms). | ||
| ↔ Tempo de resposta 50% cinza a 80% cinza | ||
| 41 ms ... ascensão ↗ e queda ↘ combinadas | ↗ 22 ms ascensão | 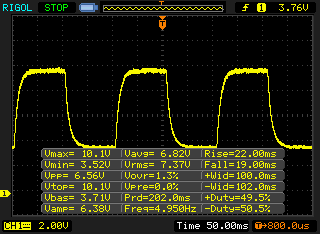 |
| ↘ 19 ms queda | ||
| A tela mostra taxas de resposta lentas em nossos testes e será insatisfatória para os jogadores. Em comparação, todos os dispositivos testados variam de 0.165 (mínimo) a 636 (máximo) ms. » 65 % de todos os dispositivos são melhores. Isso significa que o tempo de resposta medido é pior que a média de todos os dispositivos testados (31.1 ms). | ||
| AnTuTu v6 - Total Score (classificar por valor) | |
| Huawei Y5 2018 | |
| Lenovo Moto E4 Plus | |
| Sony Xperia L1 | |
| Umidigi A1 Pro | |
| Xiaomi Mi A1 | |
| Média Mediatek MT6739 (25012 - 38060, n=13) | |
| AnTuTu v7 - Total Score (classificar por valor) | |
| Huawei Y5 2018 | |
| Umidigi A1 Pro | |
| Xiaomi Mi A1 | |
| Média Mediatek MT6739 (26874 - 46951, n=13) | |
| PCMark for Android | |
| Work performance score (classificar por valor) | |
| Huawei Y5 2018 | |
| Lenovo Moto E4 Plus | |
| Sony Xperia L1 | |
| Umidigi A1 Pro | |
| Xiaomi Mi A1 | |
| Média Mediatek MT6739 (3742 - 5136, n=11) | |
| Work 2.0 performance score (classificar por valor) | |
| Huawei Y5 2018 | |
| Lenovo Moto E4 Plus | |
| Sony Xperia L1 | |
| Umidigi A1 Pro | |
| Xiaomi Mi A1 | |
| Média Mediatek MT6739 (2467 - 5377, n=16) | |
| GFXBench 3.0 | |
| on screen Manhattan Onscreen OGL (classificar por valor) | |
| Huawei Y5 2018 | |
| Lenovo Moto E4 Plus | |
| Sony Xperia L1 | |
| Umidigi A1 Pro | |
| Xiaomi Mi A1 | |
| Média Mediatek MT6739 (4.4 - 10, n=16) | |
| Média da turma Smartphone (18 - 166, n=133, últimos 2 anos) | |
| 1920x1080 1080p Manhattan Offscreen (classificar por valor) | |
| Huawei Y5 2018 | |
| Lenovo Moto E4 Plus | |
| Sony Xperia L1 | |
| Umidigi A1 Pro | |
| Xiaomi Mi A1 | |
| Média Mediatek MT6739 (2.2 - 2.8, n=14) | |
| Média da turma Smartphone (14 - 606, n=132, últimos 2 anos) | |
| GFXBench 3.1 | |
| on screen Manhattan ES 3.1 Onscreen (classificar por valor) | |
| Huawei Y5 2018 | |
| Lenovo Moto E4 Plus | |
| Sony Xperia L1 | |
| Umidigi A1 Pro | |
| Xiaomi Mi A1 | |
| Média Mediatek MT6739 (2.6 - 6.7, n=16) | |
| Média da turma Smartphone (11 - 166, n=133, últimos 2 anos) | |
| 1920x1080 Manhattan ES 3.1 Offscreen (classificar por valor) | |
| Huawei Y5 2018 | |
| Lenovo Moto E4 Plus | |
| Sony Xperia L1 | |
| Umidigi A1 Pro | |
| Xiaomi Mi A1 | |
| Média Mediatek MT6739 (1.3 - 1.7, n=16) | |
| Média da turma Smartphone (8.6 - 413, n=132, últimos 2 anos) | |
| GFXBench | |
| on screen Car Chase Onscreen (classificar por valor) | |
| Huawei Y5 2018 | |
| Umidigi A1 Pro | |
| Xiaomi Mi A1 | |
| Média Mediatek MT6739 (1.1 - 2.6, n=15) | |
| Média da turma Smartphone (6.7 - 154, n=137, últimos 2 anos) | |
| 1920x1080 Car Chase Offscreen (classificar por valor) | |
| Huawei Y5 2018 | |
| Umidigi A1 Pro | |
| Xiaomi Mi A1 | |
| Média Mediatek MT6739 (0.6 - 0.91, n=14) | |
| Média da turma Smartphone (5.3 - 241, n=137, últimos 2 anos) | |
| JetStream 1.1 - 1.1 Total | |
| Xiaomi Mi A1 | |
| Umidigi A1 Pro (Chrome 66) | |
| Huawei Y5 2018 (Chrome 67) | |
| Sony Xperia L1 (Chrome 59) | |
| Média Mediatek MT6739 (13.4 - 18.5, n=14) | |
| Lenovo Moto E4 Plus (Chrome 60) | |
| Octane V2 - Total Score | |
| Média da turma Smartphone (2800 - 126661, n=161, últimos 2 anos) | |
| Xiaomi Mi A1 | |
| Umidigi A1 Pro (Chrome 66) | |
| Huawei Y5 2018 (Chrome 67) | |
| Média Mediatek MT6739 (2093 - 3386, n=15) | |
| Sony Xperia L1 (Chrome 59) | |
| Lenovo Moto E4 Plus (Chrome 60) | |
| Mozilla Kraken 1.1 - Total | |
| Lenovo Moto E4 Plus (Chrome 60) | |
| Huawei Y5 2018 (Chrome 67) | |
| Média Mediatek MT6739 (13599 - 18154, n=16) | |
| Umidigi A1 Pro (Chrome 66) | |
| Sony Xperia L1 (Chrome 59) | |
| Xiaomi Mi A1 | |
| Média da turma Smartphone (257 - 28190, n=139, últimos 2 anos) | |
* ... menor é melhor
| Huawei Y5 2018 | Lenovo Moto E4 Plus | Sony Xperia L1 | Umidigi A1 Pro | Xiaomi Mi A1 | Média 16 GB eMMC Flash | Média da turma Smartphone | |
|---|---|---|---|---|---|---|---|
| AndroBench 3-5 | 4% | -45% | -7% | 65% | -31% | 2101% | |
| Sequential Read 256KB (MB/s) | 245.3 | 194.4 -21% | 181.9 -26% | 269.2 10% | 277.4 13% | 164.5 ? -33% | 2253 ? 818% |
| Sequential Write 256KB (MB/s) | 47.8 | 42 -12% | 40.2 -16% | 44.4 -7% | 202.4 323% | 43 ? -10% | 1928 ? 3933% |
| Random Read 4KB (MB/s) | 39 | 19.15 -51% | 13.6 -65% | 29.6 -24% | 78.1 100% | 21.7 ? -44% | 309 ? 692% |
| Random Write 4KB (MB/s) | 11.8 | 29.4 149% | 5.9 -50% | 10.2 -14% | 7.19 -39% | 8.08 ? -32% | 361 ? 2959% |
| Sequential Read 256KB SDCard (MB/s) | 81.7 ? | 66.3 -19% | 37.81 ? -54% | 81 ? -1% | 83.6 2% | 59.1 ? -28% | |
| Sequential Write 256KB SDCard (MB/s) | 62.3 ? | 46.6 -25% | 26.25 ? -58% | 58.8 ? -6% | 57.9 -7% | 39.8 ? -36% |
(+) A temperatura máxima no lado superior é 37.1 °C / 99 F, em comparação com a média de 35.3 °C / 96 F , variando de 21.9 a 247 °C para a classe Smartphone.
(+) A parte inferior aquece até um máximo de 37.7 °C / 100 F, em comparação com a média de 34 °C / 93 F
(+) Em uso inativo, a temperatura média para o lado superior é 31 °C / 88 F, em comparação com a média do dispositivo de 32.9 °C / ### class_avg_f### F.
Huawei Y5 2018 análise de áudio
(-) | alto-falantes não muito altos (###valor### dB)
Graves 100 - 315Hz
(-) | quase nenhum baixo - em média 21.8% menor que a mediana
(+) | o baixo é linear (6.2% delta para a frequência anterior)
Médios 400 - 2.000 Hz
(±) | médios mais altos - em média 6% maior que a mediana
(±) | a linearidade dos médios é média (11.9% delta para frequência anterior)
Altos 2 - 16 kHz
(+) | agudos equilibrados - apenas 3.4% longe da mediana
(+) | os máximos são lineares (5.9% delta da frequência anterior)
Geral 100 - 16.000 Hz
(±) | a linearidade do som geral é média (27.8% diferença em relação à mediana)
Comparado com a mesma classe
» 73% de todos os dispositivos testados nesta classe foram melhores, 5% semelhantes, 23% piores
» O melhor teve um delta de 11%, a média foi 34%, o pior foi 134%
Comparado com todos os dispositivos testados
» 84% de todos os dispositivos testados foram melhores, 3% semelhantes, 13% piores
» O melhor teve um delta de 4%, a média foi 24%, o pior foi 134%
Xiaomi Mi A1 análise de áudio
(+) | os alto-falantes podem tocar relativamente alto (###valor### dB)
Graves 100 - 315Hz
(-) | quase nenhum baixo - em média 29.7% menor que a mediana
(±) | a linearidade dos graves é média (11.2% delta para a frequência anterior)
Médios 400 - 2.000 Hz
(+) | médios equilibrados - apenas 3.2% longe da mediana
(+) | médios são lineares (5.2% delta para frequência anterior)
Altos 2 - 16 kHz
(+) | agudos equilibrados - apenas 3.2% longe da mediana
(+) | os máximos são lineares (3.1% delta da frequência anterior)
Geral 100 - 16.000 Hz
(±) | a linearidade do som geral é média (19.2% diferença em relação à mediana)
Comparado com a mesma classe
» 26% de todos os dispositivos testados nesta classe foram melhores, 9% semelhantes, 66% piores
» O melhor teve um delta de 11%, a média foi 34%, o pior foi 134%
Comparado com todos os dispositivos testados
» 46% de todos os dispositivos testados foram melhores, 7% semelhantes, 47% piores
» O melhor teve um delta de 4%, a média foi 24%, o pior foi 134%
| desligado | |
| Ocioso | |
| Carga |
|
Key:
min: | |
| Huawei Y5 2018 3020 mAh | Lenovo Moto E4 Plus 5000 mAh | Sony Xperia L1 2620 mAh | Umidigi A1 Pro 3150 mAh | Xiaomi Mi A1 3080 mAh | Média Mediatek MT6739 | Média da turma Smartphone | |
|---|---|---|---|---|---|---|---|
| Power Consumption | 26% | 3% | -15% | -38% | -7% | -2% | |
| Idle Minimum * (Watt) | 1.3 | 0.89 32% | 0.89 32% | 1.8 -38% | 2.2 -69% | 1.522 ? -17% | 0.872 ? 33% |
| Idle Average * (Watt) | 1.7 | 1.87 -10% | 2.05 -21% | 2.3 -35% | 2.8 -65% | 2.17 ? -28% | 1.463 ? 14% |
| Idle Maximum * (Watt) | 2.5 | 1.98 21% | 2.18 13% | 3.2 -28% | 3.4 -36% | 2.86 ? -14% | 1.65 ? 34% |
| Load Average * (Watt) | 5.5 | 3.04 45% | 6.02 -9% | 4.7 15% | 6.2 -13% | 4.73 ? 14% | 6.84 ? -24% |
| Load Maximum * (Watt) | 6.8 | 4.01 41% | 6.94 -2% | 6 12% | 7.2 -6% | 5.99 ? 12% | 11.3 ? -66% |
* ... menor é melhor
| Huawei Y5 2018 3020 mAh | Lenovo Moto E4 Plus 5000 mAh | Sony Xperia L1 2620 mAh | Umidigi A1 Pro 3150 mAh | Xiaomi Mi A1 3080 mAh | |
|---|---|---|---|---|---|
| Duração da bateria | 15% | -17% | -11% | -7% | |
| WiFi v1.3 (h) | 11.4 | 13.1 15% | 9.5 -17% | 10.1 -11% | 10.6 -7% |
| Reader / Idle (h) | 23.3 | ||||
| H.264 (h) | 10.9 | ||||
| Load (h) | 3.7 |
Pro
Contra
Huawei Y5 2018
- 07/17/2018 v6 (old)
Florian Wimmer