Breve Análise do Smartphone Nokia 7.1


| Networking | |
| iperf3 transmit AX12 | |
| Sony Xperia XA2 Plus | |
| Samsung Galaxy A7 2018 | |
| Asus Zenfone 5 ZE620KL | |
| Nokia 7.1 | |
| Sharp D10 | |
| iperf3 receive AX12 | |
| Asus Zenfone 5 ZE620KL | |
| Sharp D10 | |
| Nokia 7.1 | |
| Sony Xperia XA2 Plus | |
| Samsung Galaxy A7 2018 | |


| |||||||||||||||||||||||||
iluminação: 91 %
iluminação com acumulador: 577 cd/m²
Contraste: 1603:1 (Preto: 0.36 cd/m²)
ΔE ColorChecker Calman: 7.4 | ∀{0.5-29.43 Ø4.71}
ΔE Greyscale Calman: 10.2 | ∀{0.09-98 Ø4.96}
100% sRGB (Calman 2D)
Gamma: 2.29
CCT: 9657 K
| Nokia 7.1 IPS, 2280x1080, 5.8" | Asus Zenfone 5 ZE620KL IPS, 2246x1080, 6.2" | Sony Xperia XA2 Plus IPS, 2160x1080, 6" | Samsung Galaxy A7 2018 Super AMOLED, 2220x1080, 6" | Sharp D10 IPS, 2160x1080, 5.9" | |
|---|---|---|---|---|---|
| Screen | 10% | 30% | 41% | 11% | |
| Brightness middle (cd/m²) | 577 | 595 3% | 597 3% | 570 -1% | 745 29% |
| Brightness (cd/m²) | 550 | 561 2% | 592 8% | 565 3% | 723 31% |
| Brightness Distribution (%) | 91 | 87 -4% | 92 1% | 93 2% | 89 -2% |
| Black Level * (cd/m²) | 0.36 | 0.54 -50% | 0.32 11% | 0.6 -67% | |
| Contrast (:1) | 1603 | 1102 -31% | 1866 16% | 1242 -23% | |
| Colorchecker dE 2000 * | 7.4 | 4.2 43% | 2.4 68% | 1.5 80% | 4.52 39% |
| Colorchecker dE 2000 max. * | 15 | 6 60% | 5.3 65% | 3.6 76% | 9.14 39% |
| Greyscale dE 2000 * | 10.2 | 4.7 54% | 3.4 67% | 1.2 88% | 5.8 43% |
| Gamma | 2.29 96% | 2.12 104% | 2.2 100% | 2.07 106% | 2.262 97% |
| CCT | 9657 67% | 7577 86% | 7172 91% | 6504 100% | 7660 85% |
* ... menor é melhor
Cintilação da tela / PWM (modulação por largura de pulso)
| Tela tremeluzindo/PWM detectado | 2315 Hz | ≤ 21 % configuração de brilho | 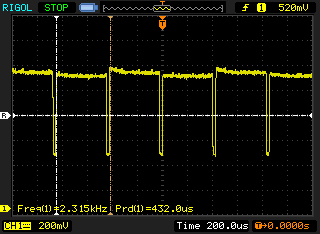 |
A luz de fundo da tela pisca em 2315 Hz (pior caso, por exemplo, utilizando PWM) Cintilação detectada em uma configuração de brilho de 21 % e abaixo. Não deve haver cintilação ou PWM acima desta configuração de brilho. A frequência de 2315 Hz é bastante alta, então a maioria dos usuários sensíveis ao PWM não deve notar nenhuma oscilação. [pwm_comparison] Em comparação: 52 % de todos os dispositivos testados não usam PWM para escurecer a tela. Se PWM foi detectado, uma média de 7754 (mínimo: 5 - máximo: 343500) Hz foi medida. | |||
Exibir tempos de resposta
| ↔ Tempo de resposta preto para branco | ||
|---|---|---|
| 18.4 ms ... ascensão ↗ e queda ↘ combinadas | ↗ 6 ms ascensão | 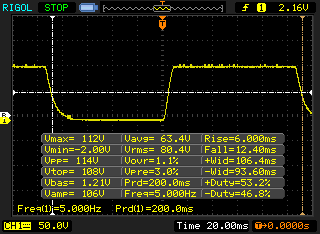 |
| ↘ 12.4 ms queda | ||
| A tela mostra boas taxas de resposta em nossos testes, mas pode ser muito lenta para jogadores competitivos. Em comparação, todos os dispositivos testados variam de 0.1 (mínimo) a 240 (máximo) ms. » 41 % de todos os dispositivos são melhores. Isso significa que o tempo de resposta medido é semelhante à média de todos os dispositivos testados (19.8 ms). | ||
| ↔ Tempo de resposta 50% cinza a 80% cinza | ||
| 43.6 ms ... ascensão ↗ e queda ↘ combinadas | ↗ 20.4 ms ascensão | 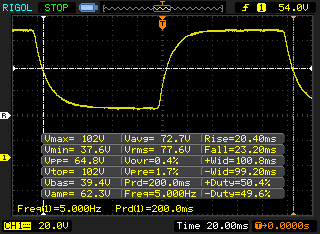 |
| ↘ 23.2 ms queda | ||
| A tela mostra taxas de resposta lentas em nossos testes e será insatisfatória para os jogadores. Em comparação, todos os dispositivos testados variam de 0.165 (mínimo) a 636 (máximo) ms. » 73 % de todos os dispositivos são melhores. Isso significa que o tempo de resposta medido é pior que a média de todos os dispositivos testados (31 ms). | ||
| PCMark for Android | |
| Work performance score (classificar por valor) | |
| Nokia 7.1 | |
| Asus Zenfone 5 ZE620KL | |
| Sony Xperia XA2 Plus | |
| Samsung Galaxy A7 2018 | |
| Sharp D10 | |
| Média Qualcomm Snapdragon 636 (6040 - 7618, n=11) | |
| Work 2.0 performance score (classificar por valor) | |
| Nokia 7.1 | |
| Asus Zenfone 5 ZE620KL | |
| Sony Xperia XA2 Plus | |
| Samsung Galaxy A7 2018 | |
| Média Qualcomm Snapdragon 636 (5611 - 6277, n=11) | |
| GFXBench 3.0 | |
| on screen Manhattan Onscreen OGL (classificar por valor) | |
| Nokia 7.1 | |
| Asus Zenfone 5 ZE620KL | |
| Sony Xperia XA2 Plus | |
| Sharp D10 | |
| Média Qualcomm Snapdragon 636 (13 - 18, n=12) | |
| Média da turma Smartphone (18 - 166, n=113, últimos 2 anos) | |
| 1920x1080 1080p Manhattan Offscreen (classificar por valor) | |
| Nokia 7.1 | |
| Asus Zenfone 5 ZE620KL | |
| Sony Xperia XA2 Plus | |
| Sharp D10 | |
| Média Qualcomm Snapdragon 636 (16 - 16, n=12) | |
| Média da turma Smartphone (14 - 606, n=112, últimos 2 anos) | |
| GFXBench 3.1 | |
| on screen Manhattan ES 3.1 Onscreen (classificar por valor) | |
| Nokia 7.1 | |
| Asus Zenfone 5 ZE620KL | |
| Sony Xperia XA2 Plus | |
| Sharp D10 | |
| Média Qualcomm Snapdragon 636 (5.7 - 12, n=12) | |
| Média da turma Smartphone (11 - 166, n=113, últimos 2 anos) | |
| 1920x1080 Manhattan ES 3.1 Offscreen (classificar por valor) | |
| Nokia 7.1 | |
| Asus Zenfone 5 ZE620KL | |
| Sony Xperia XA2 Plus | |
| Sharp D10 | |
| Média Qualcomm Snapdragon 636 (6.3 - 10, n=12) | |
| Média da turma Smartphone (8.6 - 413, n=112, últimos 2 anos) | |
| AnTuTu v7 - Total Score (classificar por valor) | |
| Nokia 7.1 | |
| Asus Zenfone 5 ZE620KL | |
| Sony Xperia XA2 Plus | |
| Samsung Galaxy A7 2018 | |
| Sharp D10 | |
| Média Qualcomm Snapdragon 636 (115565 - 138661, n=11) | |
| AnTuTu v6 - Total Score (classificar por valor) | |
| Nokia 7.1 | |
| Asus Zenfone 5 ZE620KL | |
| Sony Xperia XA2 Plus | |
| Samsung Galaxy A7 2018 | |
| Sharp D10 | |
| Média Qualcomm Snapdragon 636 (92015 - 125213, n=10) | |
| JetStream 1.1 - 1.1 Total | |
| Asus Zenfone 5 ZE620KL (Chrome 67) | |
| Samsung Galaxy A7 2018 (Chrome 70) | |
| Média Qualcomm Snapdragon 636 (44.2 - 51.5, n=11) | |
| Nokia 7.1 (Chrome 70) | |
| Sharp D10 (Chrome 70) | |
| Sony Xperia XA2 Plus (Chrome 67) | |
| Octane V2 - Total Score | |
| Média da turma Smartphone (2800 - 126661, n=142, últimos 2 anos) | |
| Asus Zenfone 5 ZE620KL (Chrome 67) | |
| Samsung Galaxy A7 2018 (Chrome 70) | |
| Média Qualcomm Snapdragon 636 (8163 - 9746, n=12) | |
| Nokia 7.1 (Chrome 70) | |
| Sony Xperia XA2 Plus (Chrome 67) | |
| Sharp D10 (Chrome 70) | |
| Mozilla Kraken 1.1 - Total | |
| Sony Xperia XA2 Plus (Chrome 67) | |
| Sharp D10 (Chrome 70) | |
| Média Qualcomm Snapdragon 636 (4105 - 5066, n=12) | |
| Nokia 7.1 (Chrome 70) | |
| Samsung Galaxy A7 2018 (Chrome 70) | |
| Asus Zenfone 5 ZE620KL (Chrome 67) | |
| Média da turma Smartphone (257 - 28190, n=121, últimos 2 anos) | |
| WebXPRT 3 - Overall | |
| Média da turma Smartphone (104 - 380, n=12, últimos 2 anos) | |
| Samsung Galaxy A7 2018 (Chrome 70) | |
| Média Qualcomm Snapdragon 636 (46 - 61, n=9) | |
| Nokia 7.1 (Chrome 70) | |
| Sony Xperia XA2 Plus (Chrome 67) | |
| WebXPRT 2015 - Overall | |
| Samsung Galaxy A7 2018 (Chrome 70) | |
| Média Qualcomm Snapdragon 636 (147 - 184, n=8) | |
| Nokia 7.1 (Chrome 70) | |
| Sony Xperia XA2 Plus (Chrome 67) | |
* ... menor é melhor
| Nokia 7.1 | Asus Zenfone 5 ZE620KL | Sony Xperia XA2 Plus | Samsung Galaxy A7 2018 | Sharp D10 | Média 32 GB eMMC Flash | Média da turma Smartphone | |
|---|---|---|---|---|---|---|---|
| AndroBench 3-5 | 124% | 17% | 20% | 22% | 5% | 1423% | |
| Sequential Read 256KB (MB/s) | 250.9 | 286.6 14% | 281.1 12% | 295.8 18% | 280.7 12% | 242 ? -4% | 2225 ? 787% |
| Sequential Write 256KB (MB/s) | 126 | 201.8 60% | 146.2 16% | 104.9 -17% | 211.5 68% | 100.5 ? -20% | 1903 ? 1410% |
| Random Read 4KB (MB/s) | 44.9 | 71.2 59% | 77.4 72% | 84 87% | 47.2 5% | 43.1 ? -4% | 311 ? 593% |
| Random Write 4KB (MB/s) | 11.93 | 83.5 600% | 10.5 -12% | 15.45 30% | 16.79 41% | 22.3 ? 87% | 358 ? 2901% |
| Sequential Read 256KB SDCard (MB/s) | 83.5 ? | 85.8 ? 3% | 86 ? 3% | 78.2 ? -6% | 83.2 ? 0% | 71.8 ? -14% | |
| Sequential Write 256KB SDCard (MB/s) | 61.2 ? | 65.2 ? 7% | 67 ? 9% | 64.4 ? 5% | 63.6 ? 4% | 52.9 ? -14% |
Asphalt 9: Legends
(+) A temperatura máxima no lado superior é 38.2 °C / 101 F, em comparação com a média de 35.3 °C / 96 F , variando de 21.9 a 247 °C para a classe Smartphone.
(+) A parte inferior aquece até um máximo de 35.5 °C / 96 F, em comparação com a média de 34 °C / 93 F
(+) Em uso inativo, a temperatura média para o lado superior é 31.4 °C / 89 F, em comparação com a média do dispositivo de 33 °C / ### class_avg_f### F.
Nokia 7.1 análise de áudio
(+) | os alto-falantes podem tocar relativamente alto (###valor### dB)
Graves 100 - 315Hz
(-) | quase nenhum baixo - em média 28.1% menor que a mediana
(±) | a linearidade dos graves é média (10.5% delta para a frequência anterior)
Médios 400 - 2.000 Hz
(+) | médios equilibrados - apenas 3.3% longe da mediana
(+) | médios são lineares (5.4% delta para frequência anterior)
Altos 2 - 16 kHz
(±) | máximos mais altos - em média 6.4% maior que a mediana
(+) | os máximos são lineares (5.6% delta da frequência anterior)
Geral 100 - 16.000 Hz
(±) | a linearidade do som geral é média (19.3% diferença em relação à mediana)
Comparado com a mesma classe
» 27% de todos os dispositivos testados nesta classe foram melhores, 9% semelhantes, 64% piores
» O melhor teve um delta de 11%, a média foi 34%, o pior foi 134%
Comparado com todos os dispositivos testados
» 47% de todos os dispositivos testados foram melhores, 8% semelhantes, 46% piores
» O melhor teve um delta de 4%, a média foi 23%, o pior foi 134%
Samsung Galaxy A7 2018 análise de áudio
(+) | os alto-falantes podem tocar relativamente alto (###valor### dB)
Graves 100 - 315Hz
(-) | quase nenhum baixo - em média 27.5% menor que a mediana
(±) | a linearidade dos graves é média (10.4% delta para a frequência anterior)
Médios 400 - 2.000 Hz
(+) | médios equilibrados - apenas 3.6% longe da mediana
(+) | médios são lineares (4.8% delta para frequência anterior)
Altos 2 - 16 kHz
(±) | máximos mais altos - em média 8.2% maior que a mediana
(+) | os máximos são lineares (3.3% delta da frequência anterior)
Geral 100 - 16.000 Hz
(±) | a linearidade do som geral é média (22.3% diferença em relação à mediana)
Comparado com a mesma classe
» 47% de todos os dispositivos testados nesta classe foram melhores, 7% semelhantes, 45% piores
» O melhor teve um delta de 11%, a média foi 34%, o pior foi 134%
Comparado com todos os dispositivos testados
» 65% de todos os dispositivos testados foram melhores, 6% semelhantes, 29% piores
» O melhor teve um delta de 4%, a média foi 23%, o pior foi 134%
| desligado | |
| Ocioso | |
| Carga |
|
Key:
min: | |
| Nokia 7.1 3060 mAh | Asus Zenfone 5 ZE620KL 3300 mAh | Sony Xperia XA2 Plus 3580 mAh | Samsung Galaxy A7 2018 3300 mAh | Sharp D10 2900 mAh | Média Qualcomm Snapdragon 636 | Média da turma Smartphone | |
|---|---|---|---|---|---|---|---|
| Power Consumption | -107% | 25% | 5% | 26% | -12% | -22% | |
| Idle Minimum * (Watt) | 1.01 | 1.75 -73% | 0.35 65% | 0.71 30% | 0.7 31% | 0.944 ? 7% | 0.887 ? 12% |
| Idle Average * (Watt) | 2.2 | 4.48 -104% | 1.81 18% | 1.36 38% | 1 55% | 2.22 ? -1% | 1.485 ? 32% |
| Idle Maximum * (Watt) | 2.25 | 4.5 -100% | 1.83 19% | 1.47 35% | 1.4 38% | 2.54 ? -13% | 1.672 ? 26% |
| Load Average * (Watt) | 3.76 | 7.92 -111% | 3.31 12% | 5.13 -36% | 3.7 2% | 4.51 ? -20% | 6.76 ? -80% |
| Load Maximum * (Watt) | 5.56 | 13.62 -145% | 4.97 11% | 7.89 -42% | 5.2 6% | 7.37 ? -33% | 11.2 ? -101% |
* ... menor é melhor
| Nokia 7.1 3060 mAh | Asus Zenfone 5 ZE620KL 3300 mAh | Sony Xperia XA2 Plus 3580 mAh | Samsung Galaxy A7 2018 3300 mAh | Sharp D10 2900 mAh | |
|---|---|---|---|---|---|
| Duração da bateria | 43% | 208% | 66% | 84% | |
| Reader / Idle (h) | 16.4 | 78 376% | 24.5 49% | ||
| H.264 (h) | 8.5 | 14.9 75% | 13.9 64% | ||
| WiFi v1.3 (h) | 5.8 | 8.3 43% | 14 141% | 10.1 74% | 10.7 84% |
| Load (h) | 2.6 | 8.8 238% | 4.6 77% |
Pro
Contra

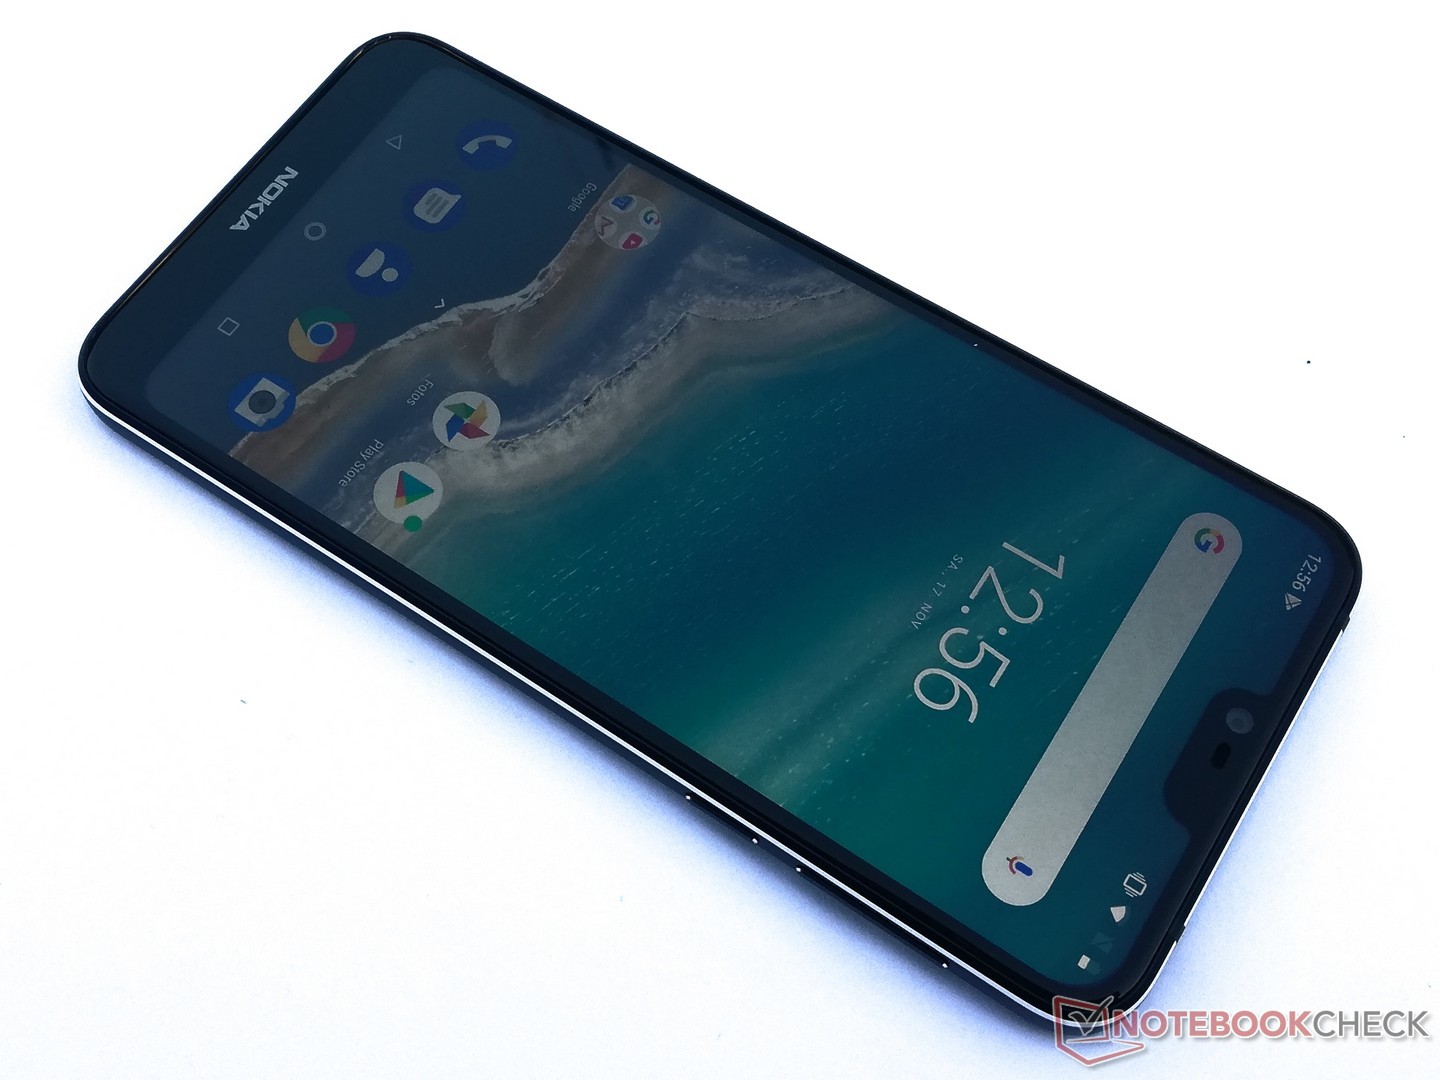
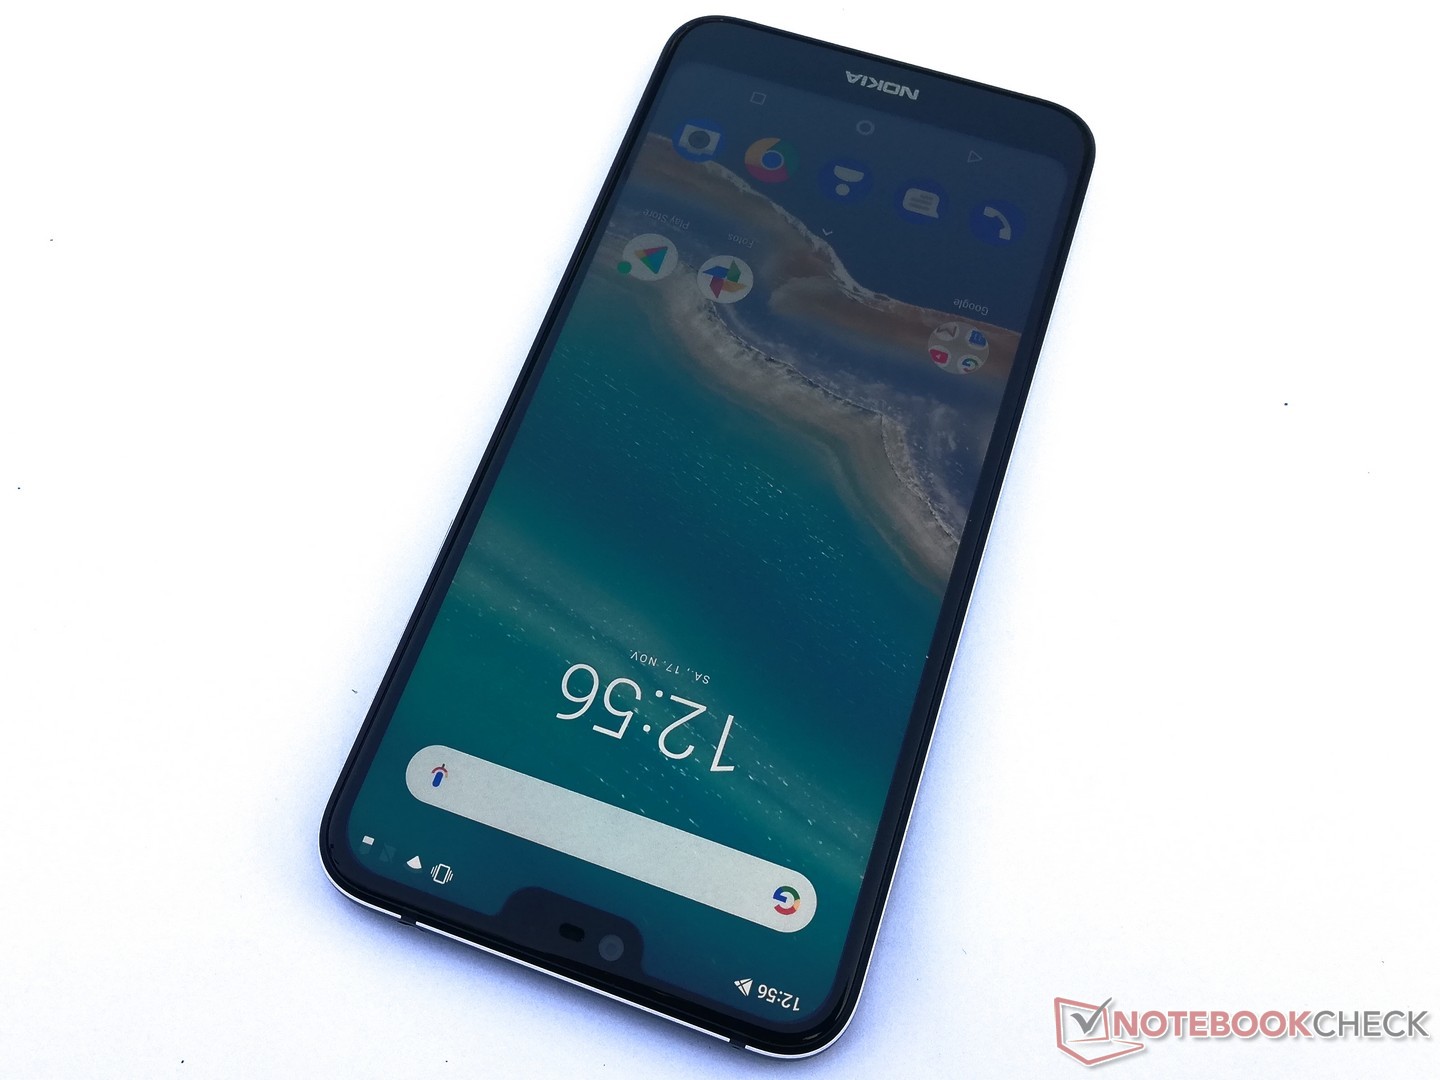
Depois de colocar o Nokia 7.1 à prova, nos sentimos confiantes em dizer que é um smartphone de gama média sólido que se destaca principalmente pelo seu design. A conectividade não é seu ponto forte, e muitos concorrentes podem oferecer uma conectividade melhor por menos dinheiro. No entanto, compensa rodando o sabor puro e limpo de Oreo do Android One. Assim, o usuário permanece responsável pelos aplicativos instalados e as atualizações de segurança são fornecidas por três anos graças à Google.
O Nokia 7.1 é um dispositivo de boa aparência que oferece um desempenho sólido. No entanto, nem a duração da bateria, nem a conectividade estão em pé de igualdade com seus concorrentes.
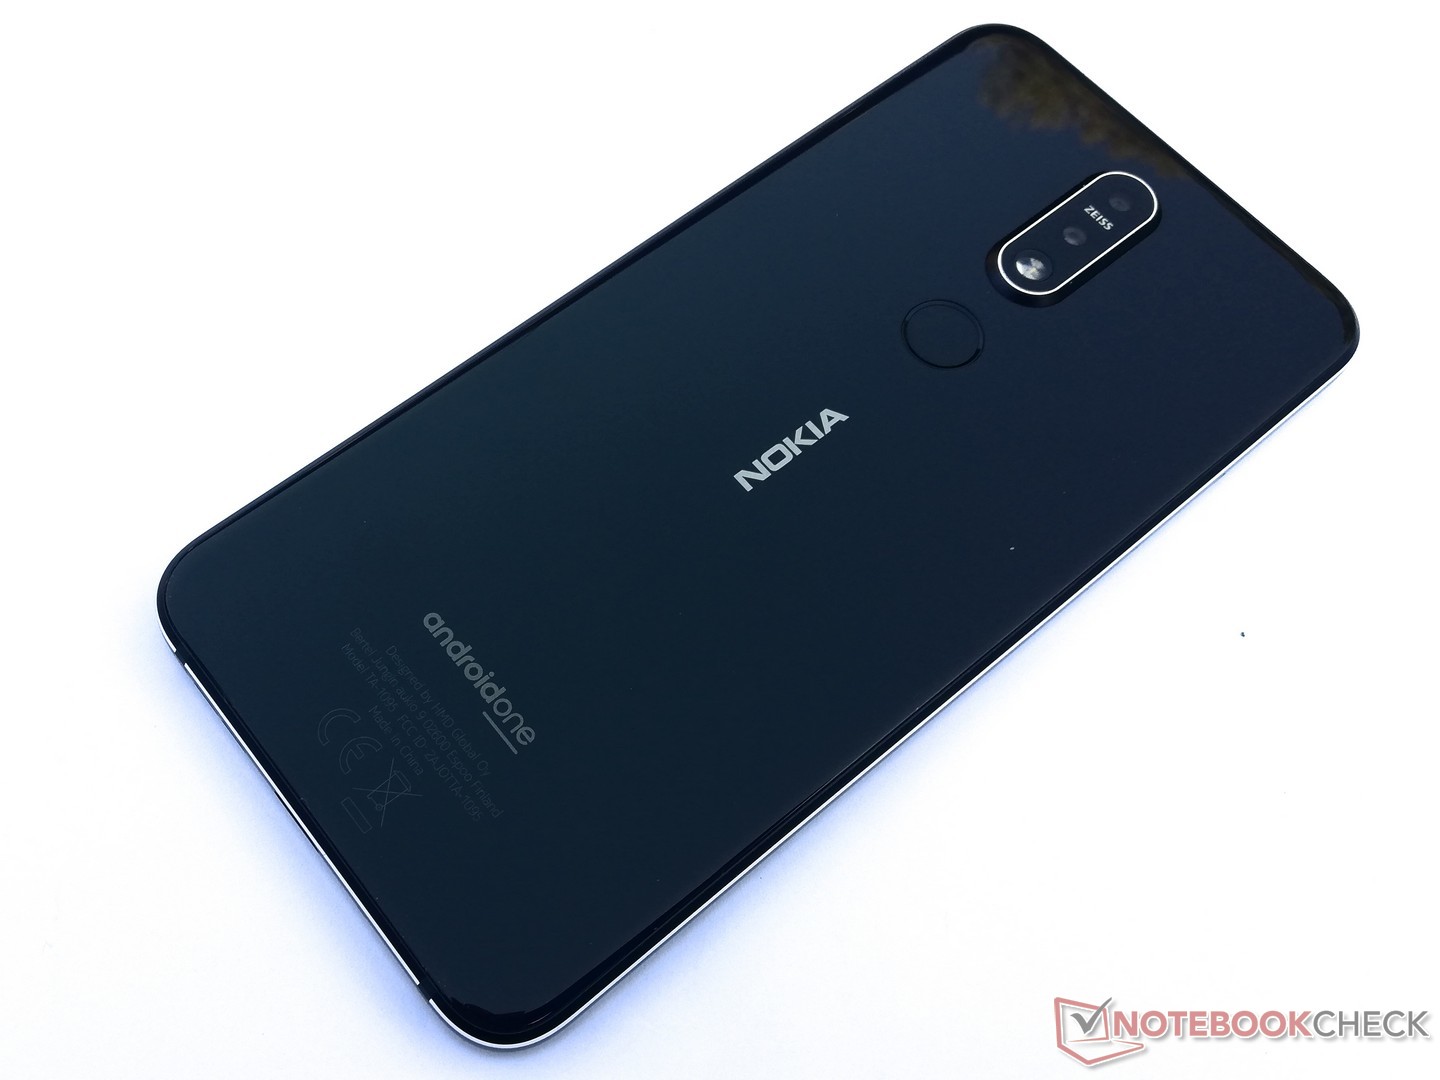
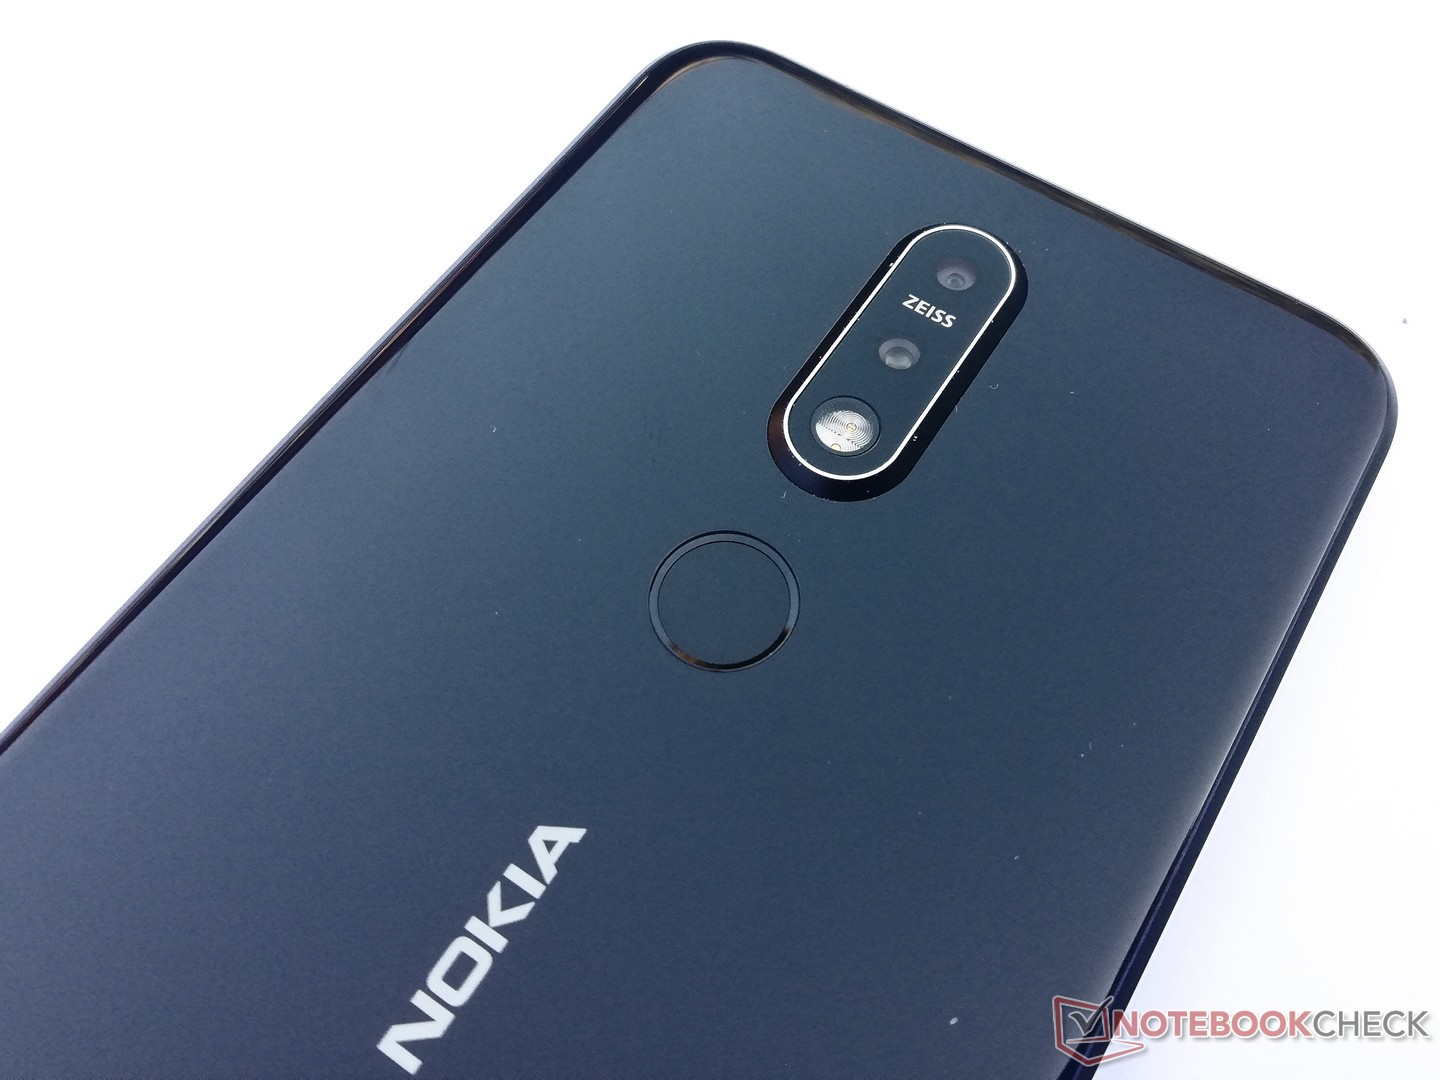
O desempenho do sistema é suficiente para a maioria das tarefas diárias, e é até capaz de executar aplicativos mais exigentes. Com apenas 32 GB, o armazenamento interno é um pouco limitado e os cartões microSD não podem ser usados como armazenamento interno, mas somente como arquivos de mídia. Além disso, a duração da bateria é muito fraca. A câmera principal demonstrou ser razoavelmente decente, e um SKU melhor equipado com 4 GB de RAM e 64 GB de armazenamento está disponível se desejado.
Nokia 7.1
- 11/26/2018 v6 (old)
Mike Wobker
Price comparison
