Breve Análise do Smartphone Nokia 7 Plus


| |||||||||||||||||||||||||
iluminação: 92 %
iluminação com acumulador: 458 cd/m²
Contraste: 2082:1 (Preto: 0.22 cd/m²)
ΔE ColorChecker Calman: 4 | ∀{0.5-29.43 Ø4.71}
ΔE Greyscale Calman: 4.7 | ∀{0.09-98 Ø4.96}
99.9% sRGB (Calman 2D)
Gamma: 2.19
CCT: 7425 K
| Nokia 7 Plus IPS, 2160x1080, 6" | Asus ZenFone 4 Selfie Pro ZD552KL AMOLED, 1920x1080, 5.5" | Sony Xperia XA2 Ultra IPS, 1920x1080, 6" | Wiko WIM AMOLED, 1920x1080, 5.5" | Samsung Galaxy A8 2018 Super AMOLED, 2220x1080, 5.6" | OnePlus 5T AMOLED, 2160x1080, 6" | Samsung Galaxy S8 Super AMOLED, 2960x1440, 5.8" | Huawei P20 Pro OLED, 2240x1080, 6.1" | |
|---|---|---|---|---|---|---|---|---|
| Screen | -25% | -4% | -28% | 7% | 22% | 24% | 43% | |
| Brightness middle (cd/m²) | 458 | 456 0% | 659 44% | 344 -25% | 541 18% | 425 -7% | 566 24% | 569 24% |
| Brightness (cd/m²) | 463 | 455 -2% | 680 47% | 353 -24% | 538 16% | 423 -9% | 564 22% | 578 25% |
| Brightness Distribution (%) | 92 | 85 -8% | 88 -4% | 90 -2% | 96 4% | 92 0% | 94 2% | 95 3% |
| Black Level * (cd/m²) | 0.22 | 0.56 -155% | ||||||
| Contrast (:1) | 2082 | 1177 -43% | ||||||
| Colorchecker dE 2000 * | 4 | 5.6 -40% | 2.8 30% | 5.7 -43% | 5.8 -45% | 2.1 47% | 2.7 32% | 1.3 67% |
| Colorchecker dE 2000 max. * | 7.4 | 11.1 -50% | 6.5 12% | 12.2 -65% | 3.4 54% | 5.4 27% | 2.1 72% | |
| Greyscale dE 2000 * | 4.7 | 6.9 -47% | 3 36% | 5.1 -9% | 2.7 43% | 2.5 47% | 3.1 34% | 1.6 66% |
| Gamma | 2.19 100% | 2.3 96% | 2.18 101% | 2.73 81% | 2.07 106% | 2.32 95% | 2.15 102% | 2.31 95% |
| CCT | 7425 88% | 7883 82% | 6938 94% | 7407 88% | 6570 99% | 6455 101% | 6335 103% | 6401 102% |
| Color Space (Percent of AdobeRGB 1998) (%) | 81.57 | |||||||
| Color Space (Percent of sRGB) (%) | 99.87 |
* ... menor é melhor
Cintilação da tela / PWM (modulação por largura de pulso)
| Tela tremeluzindo / PWM não detectado | 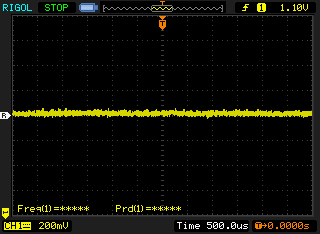 | ||
[pwm_comparison] Em comparação: 52 % de todos os dispositivos testados não usam PWM para escurecer a tela. Se PWM foi detectado, uma média de 7754 (mínimo: 5 - máximo: 343500) Hz foi medida. | |||
Exibir tempos de resposta
| ↔ Tempo de resposta preto para branco | ||
|---|---|---|
| 29.6 ms ... ascensão ↗ e queda ↘ combinadas | ↗ 14 ms ascensão | 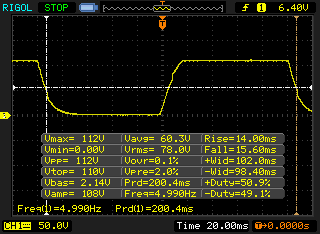 |
| ↘ 15.6 ms queda | ||
| A tela mostra taxas de resposta relativamente lentas em nossos testes e pode ser muito lenta para os jogadores. Em comparação, todos os dispositivos testados variam de 0.1 (mínimo) a 240 (máximo) ms. » 79 % de todos os dispositivos são melhores. Isso significa que o tempo de resposta medido é pior que a média de todos os dispositivos testados (19.8 ms). | ||
| ↔ Tempo de resposta 50% cinza a 80% cinza | ||
| 43.2 ms ... ascensão ↗ e queda ↘ combinadas | ↗ 20.4 ms ascensão | 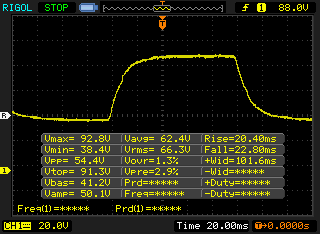 |
| ↘ 22.8 ms queda | ||
| A tela mostra taxas de resposta lentas em nossos testes e será insatisfatória para os jogadores. Em comparação, todos os dispositivos testados variam de 0.165 (mínimo) a 636 (máximo) ms. » 72 % de todos os dispositivos são melhores. Isso significa que o tempo de resposta medido é pior que a média de todos os dispositivos testados (31 ms). | ||
| JetStream 1.1 - 1.1 Total | |
| OnePlus 5T (Chrome 63) | |
| Samsung Galaxy S8 (Samsung Browser 5.2) | |
| Huawei P20 Pro (Chrome 65) | |
| Nokia 7 Plus (Chrome 60) | |
| Média Qualcomm Snapdragon 660 (45.3 - 55.5, n=12) | |
| Samsung Galaxy A8 2018 (Chrome 64.0.3282.137) | |
| Sony Xperia XA2 Ultra (Chrome 65) | |
| Asus ZenFone 4 Selfie Pro ZD552KL (Chrome 64) | |
| Wiko WIM (Chrome Version 59) | |
| Octane V2 - Total Score | |
| Média da turma Smartphone (2800 - 126661, n=141, últimos 2 anos) | |
| Samsung Galaxy S8 (Samsung Browser 5.2) | |
| OnePlus 5T (Chrome 63) | |
| Huawei P20 Pro (Chrome 65) | |
| Nokia 7 Plus (Chrome 60) | |
| Média Qualcomm Snapdragon 660 (8463 - 10945, n=14) | |
| Samsung Galaxy A8 2018 (Chrome 64.0.3282.137) | |
| Sony Xperia XA2 Ultra (Chrome 65) | |
| Asus ZenFone 4 Selfie Pro ZD552KL (Chrome 64) | |
| Wiko WIM (Chrome Version 59) | |
| Mozilla Kraken 1.1 - Total | |
| Sony Xperia XA2 Ultra (Chrome 65) | |
| Asus ZenFone 4 Selfie Pro ZD552KL (Chrome 64) | |
| Wiko WIM (Chrome Version 59) | |
| Samsung Galaxy A8 2018 (Chrome 64.0.3282.137) | |
| Média Qualcomm Snapdragon 660 (3796 - 4769, n=13) | |
| Nokia 7 Plus (Chrome 60) | |
| Huawei P20 Pro (Chrome 65) | |
| OnePlus 5T (Chrome 63) | |
| Samsung Galaxy S8 (Samsung Browser 5.2) | |
| Média da turma Smartphone (257 - 28190, n=120, últimos 2 anos) | |
| WebXPRT 2015 - Overall | |
| Samsung Galaxy S8 (Samsung Browser 5.2) | |
| Huawei P20 Pro (Chrome 65) | |
| OnePlus 5T (Chrome 63) | |
| Média Qualcomm Snapdragon 660 (159 - 182, n=8) | |
| Nokia 7 Plus (Chrome 60) | |
| Samsung Galaxy A8 2018 (Chrome 64.0.3282.137) | |
| Sony Xperia XA2 Ultra (Chrome 65) | |
| WebXPRT 3 - Overall | |
| Média da turma Smartphone (104 - 380, n=12, últimos 2 anos) | |
| Huawei P20 Pro (Chrome 65) | |
| Nokia 7 Plus (Chrome 60) | |
| Média Qualcomm Snapdragon 660 (47 - 63, n=9) | |
* ... menor é melhor
| Nokia 7 Plus | Asus ZenFone 4 Selfie Pro ZD552KL | Sony Xperia XA2 Ultra | Wiko WIM | Samsung Galaxy A8 2018 | OnePlus 5T | Samsung Galaxy S8 | Huawei P20 Pro | Média 64 GB eMMC Flash | Média da turma Smartphone | |
|---|---|---|---|---|---|---|---|---|---|---|
| AndroBench 3-5 | -16% | -7% | -17% | -4% | 74% | 41% | 267% | 9% | 922% | |
| Sequential Read 256KB (MB/s) | 283.1 | 269.3 -5% | 273.7 -3% | 272.1 -4% | 299.9 6% | 699 147% | 793 180% | 832 194% | 278 ? -2% | 2228 ? 687% |
| Sequential Write 256KB (MB/s) | 211.6 | 139.5 -34% | 138.8 -34% | 136.7 -35% | 104.2 -51% | 203.4 -4% | 193.2 -9% | 196.7 -7% | 178.6 ? -16% | 1909 ? 802% |
| Random Read 4KB (MB/s) | 54.7 | 36.8 -33% | 76 39% | 38.1 -30% | 82.6 51% | 138.1 152% | 127.2 133% | 144.3 164% | 60.9 ? 11% | 312 ? 470% |
| Random Write 4KB (MB/s) | 19.62 | 12 -39% | 10.1 -49% | 13.34 -32% | 14.69 -25% | 20 2% | 15.25 -22% | 160.5 718% | 34.2 ? 74% | 359 ? 1730% |
| Sequential Read 256KB SDCard (MB/s) | 82.2 | 83.9 ? 2% | 85.9 ? 5% | 83.8 2% | 77.9 ? -5% | 63.9 ? -22% | 77.4 ? -6% | |||
| Sequential Write 256KB SDCard (MB/s) | 62.3 | 72.1 ? 16% | 63.3 ? 2% | 61.4 -1% | 62.3 ? 0% | 53.5 ? -14% | 58.3 ? -6% |
| Asphalt 8: Airborne | |||
| Configurações | Valor | ||
| high | 29 fps | ||
| Dead Trigger 2 | |||
| Configurações | Valor | ||
| high | 30 fps | ||
| World of Tanks Blitz | |||
| Configurações | Valor | ||
| high, 0xAA, 0xAF | 30 fps | ||
(+) A temperatura máxima no lado superior é 39.6 °C / 103 F, em comparação com a média de 35.3 °C / 96 F , variando de 21.9 a 247 °C para a classe Smartphone.
(+) A parte inferior aquece até um máximo de 38.7 °C / 102 F, em comparação com a média de 34 °C / 93 F
(+) Em uso inativo, a temperatura média para o lado superior é 26 °C / 79 F, em comparação com a média do dispositivo de 33 °C / ### class_avg_f### F.
Nokia 7 Plus análise de áudio
(+) | os alto-falantes podem tocar relativamente alto (###valor### dB)
Graves 100 - 315Hz
(-) | quase nenhum baixo - em média 25.3% menor que a mediana
(±) | a linearidade dos graves é média (7.1% delta para a frequência anterior)
Médios 400 - 2.000 Hz
(±) | médios mais altos - em média 6.1% maior que a mediana
(±) | a linearidade dos médios é média (7.7% delta para frequência anterior)
Altos 2 - 16 kHz
(+) | agudos equilibrados - apenas 4.8% longe da mediana
(+) | os máximos são lineares (3.7% delta da frequência anterior)
Geral 100 - 16.000 Hz
(±) | a linearidade do som geral é média (22.1% diferença em relação à mediana)
Comparado com a mesma classe
» 47% de todos os dispositivos testados nesta classe foram melhores, 7% semelhantes, 46% piores
» O melhor teve um delta de 11%, a média foi 34%, o pior foi 134%
Comparado com todos os dispositivos testados
» 64% de todos os dispositivos testados foram melhores, 6% semelhantes, 30% piores
» O melhor teve um delta de 4%, a média foi 23%, o pior foi 134%
Samsung Galaxy A8 2018 análise de áudio
(+) | os alto-falantes podem tocar relativamente alto (###valor### dB)
Graves 100 - 315Hz
(-) | quase nenhum baixo - em média 28.7% menor que a mediana
(±) | a linearidade dos graves é média (9.6% delta para a frequência anterior)
Médios 400 - 2.000 Hz
(+) | médios equilibrados - apenas 2.8% longe da mediana
(+) | médios são lineares (5.3% delta para frequência anterior)
Altos 2 - 16 kHz
(+) | agudos equilibrados - apenas 4.6% longe da mediana
(+) | os máximos são lineares (5.9% delta da frequência anterior)
Geral 100 - 16.000 Hz
(±) | a linearidade do som geral é média (20.2% diferença em relação à mediana)
Comparado com a mesma classe
» 34% de todos os dispositivos testados nesta classe foram melhores, 9% semelhantes, 57% piores
» O melhor teve um delta de 11%, a média foi 34%, o pior foi 134%
Comparado com todos os dispositivos testados
» 53% de todos os dispositivos testados foram melhores, 8% semelhantes, 39% piores
» O melhor teve um delta de 4%, a média foi 23%, o pior foi 134%
| desligado | |
| Ocioso | |
| Carga |
|
Key:
min: | |
| Nokia 7 Plus 3800 mAh | Asus ZenFone 4 Selfie Pro ZD552KL 3000 mAh | Sony Xperia XA2 Ultra 3580 mAh | Wiko WIM 3200 mAh | Samsung Galaxy A8 2018 3000 mAh | OnePlus 5T 3300 mAh | Samsung Galaxy S8 3000 mAh | Huawei P20 Pro 4000 mAh | Média Qualcomm Snapdragon 660 | Média da turma Smartphone | |
|---|---|---|---|---|---|---|---|---|---|---|
| Power Consumption | 36% | -6% | 21% | 25% | 16% | 21% | 23% | -37% | -18% | |
| Idle Minimum * (Watt) | 0.65 | 0.58 11% | 0.77 -18% | 0.93 -43% | 0.67 -3% | 0.58 11% | 0.78 -20% | 0.84 -29% | 1.052 ? -62% | 0.888 ? -37% |
| Idle Average * (Watt) | 1.76 | 1.31 26% | 2.12 -20% | 1.28 27% | 1.02 42% | 1.44 18% | 1.1 37% | 1.54 12% | 2.62 ? -49% | 1.486 ? 16% |
| Idle Maximum * (Watt) | 1.78 | 1.33 25% | 2.17 -22% | 1.37 23% | 1.1 38% | 1.53 14% | 1.16 35% | 1.57 12% | 2.88 ? -62% | 1.673 ? 6% |
| Load Average * (Watt) | 4.47 | 1.88 58% | 4.3 4% | 2.39 47% | 3.86 14% | 3.17 29% | 4.15 7% | 2.47 45% | 5.1 ? -14% | 6.73 ? -51% |
| Load Maximum * (Watt) | 9.13 | 3.8 58% | 6.73 26% | 4.25 53% | 5.97 35% | 8.54 6% | 5.12 44% | 2.49 73% | 9.08 ? 1% | 11.2 ? -23% |
* ... menor é melhor
| Nokia 7 Plus 3800 mAh | Asus ZenFone 4 Selfie Pro ZD552KL 3000 mAh | Sony Xperia XA2 Ultra 3580 mAh | Wiko WIM 3200 mAh | Samsung Galaxy A8 2018 3000 mAh | OnePlus 5T 3300 mAh | Samsung Galaxy S8 3000 mAh | Huawei P20 Pro 4000 mAh | |
|---|---|---|---|---|---|---|---|---|
| Duração da bateria | -3% | 28% | -27% | 20% | 22% | 21% | 37% | |
| Reader / Idle (h) | 28.4 | 29.8 5% | 25.8 -9% | 29.2 3% | 27.8 -2% | 28.8 1% | ||
| H.264 (h) | 11.8 | 14.6 24% | 15.1 28% | 13.3 13% | 12.9 9% | 13.1 11% | ||
| WiFi v1.3 (h) | 11.2 | 10.9 -3% | 14.2 27% | 8.2 -27% | 10.8 -4% | 12 7% | 12 7% | 12.4 11% |
| Load (h) | 2.6 | 4 54% | 4.3 65% | 4.3 65% | 4.4 69% | 5.8 123% |
Pro
Contra
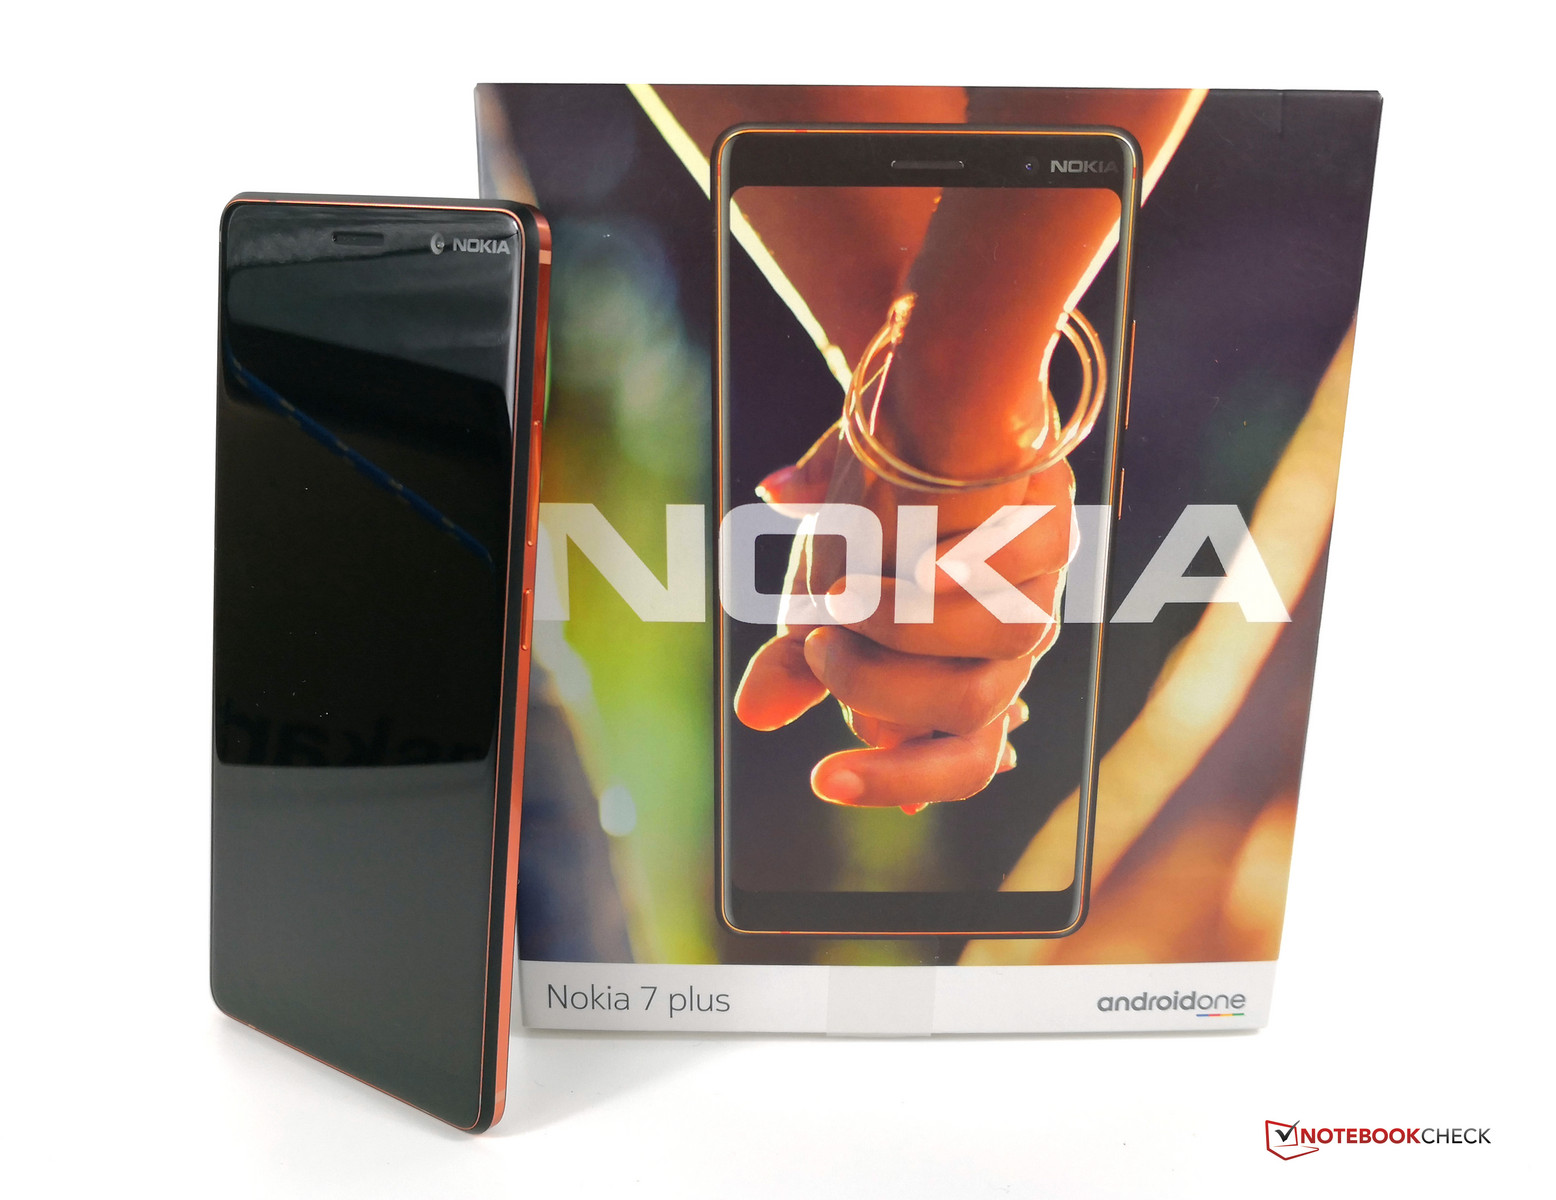
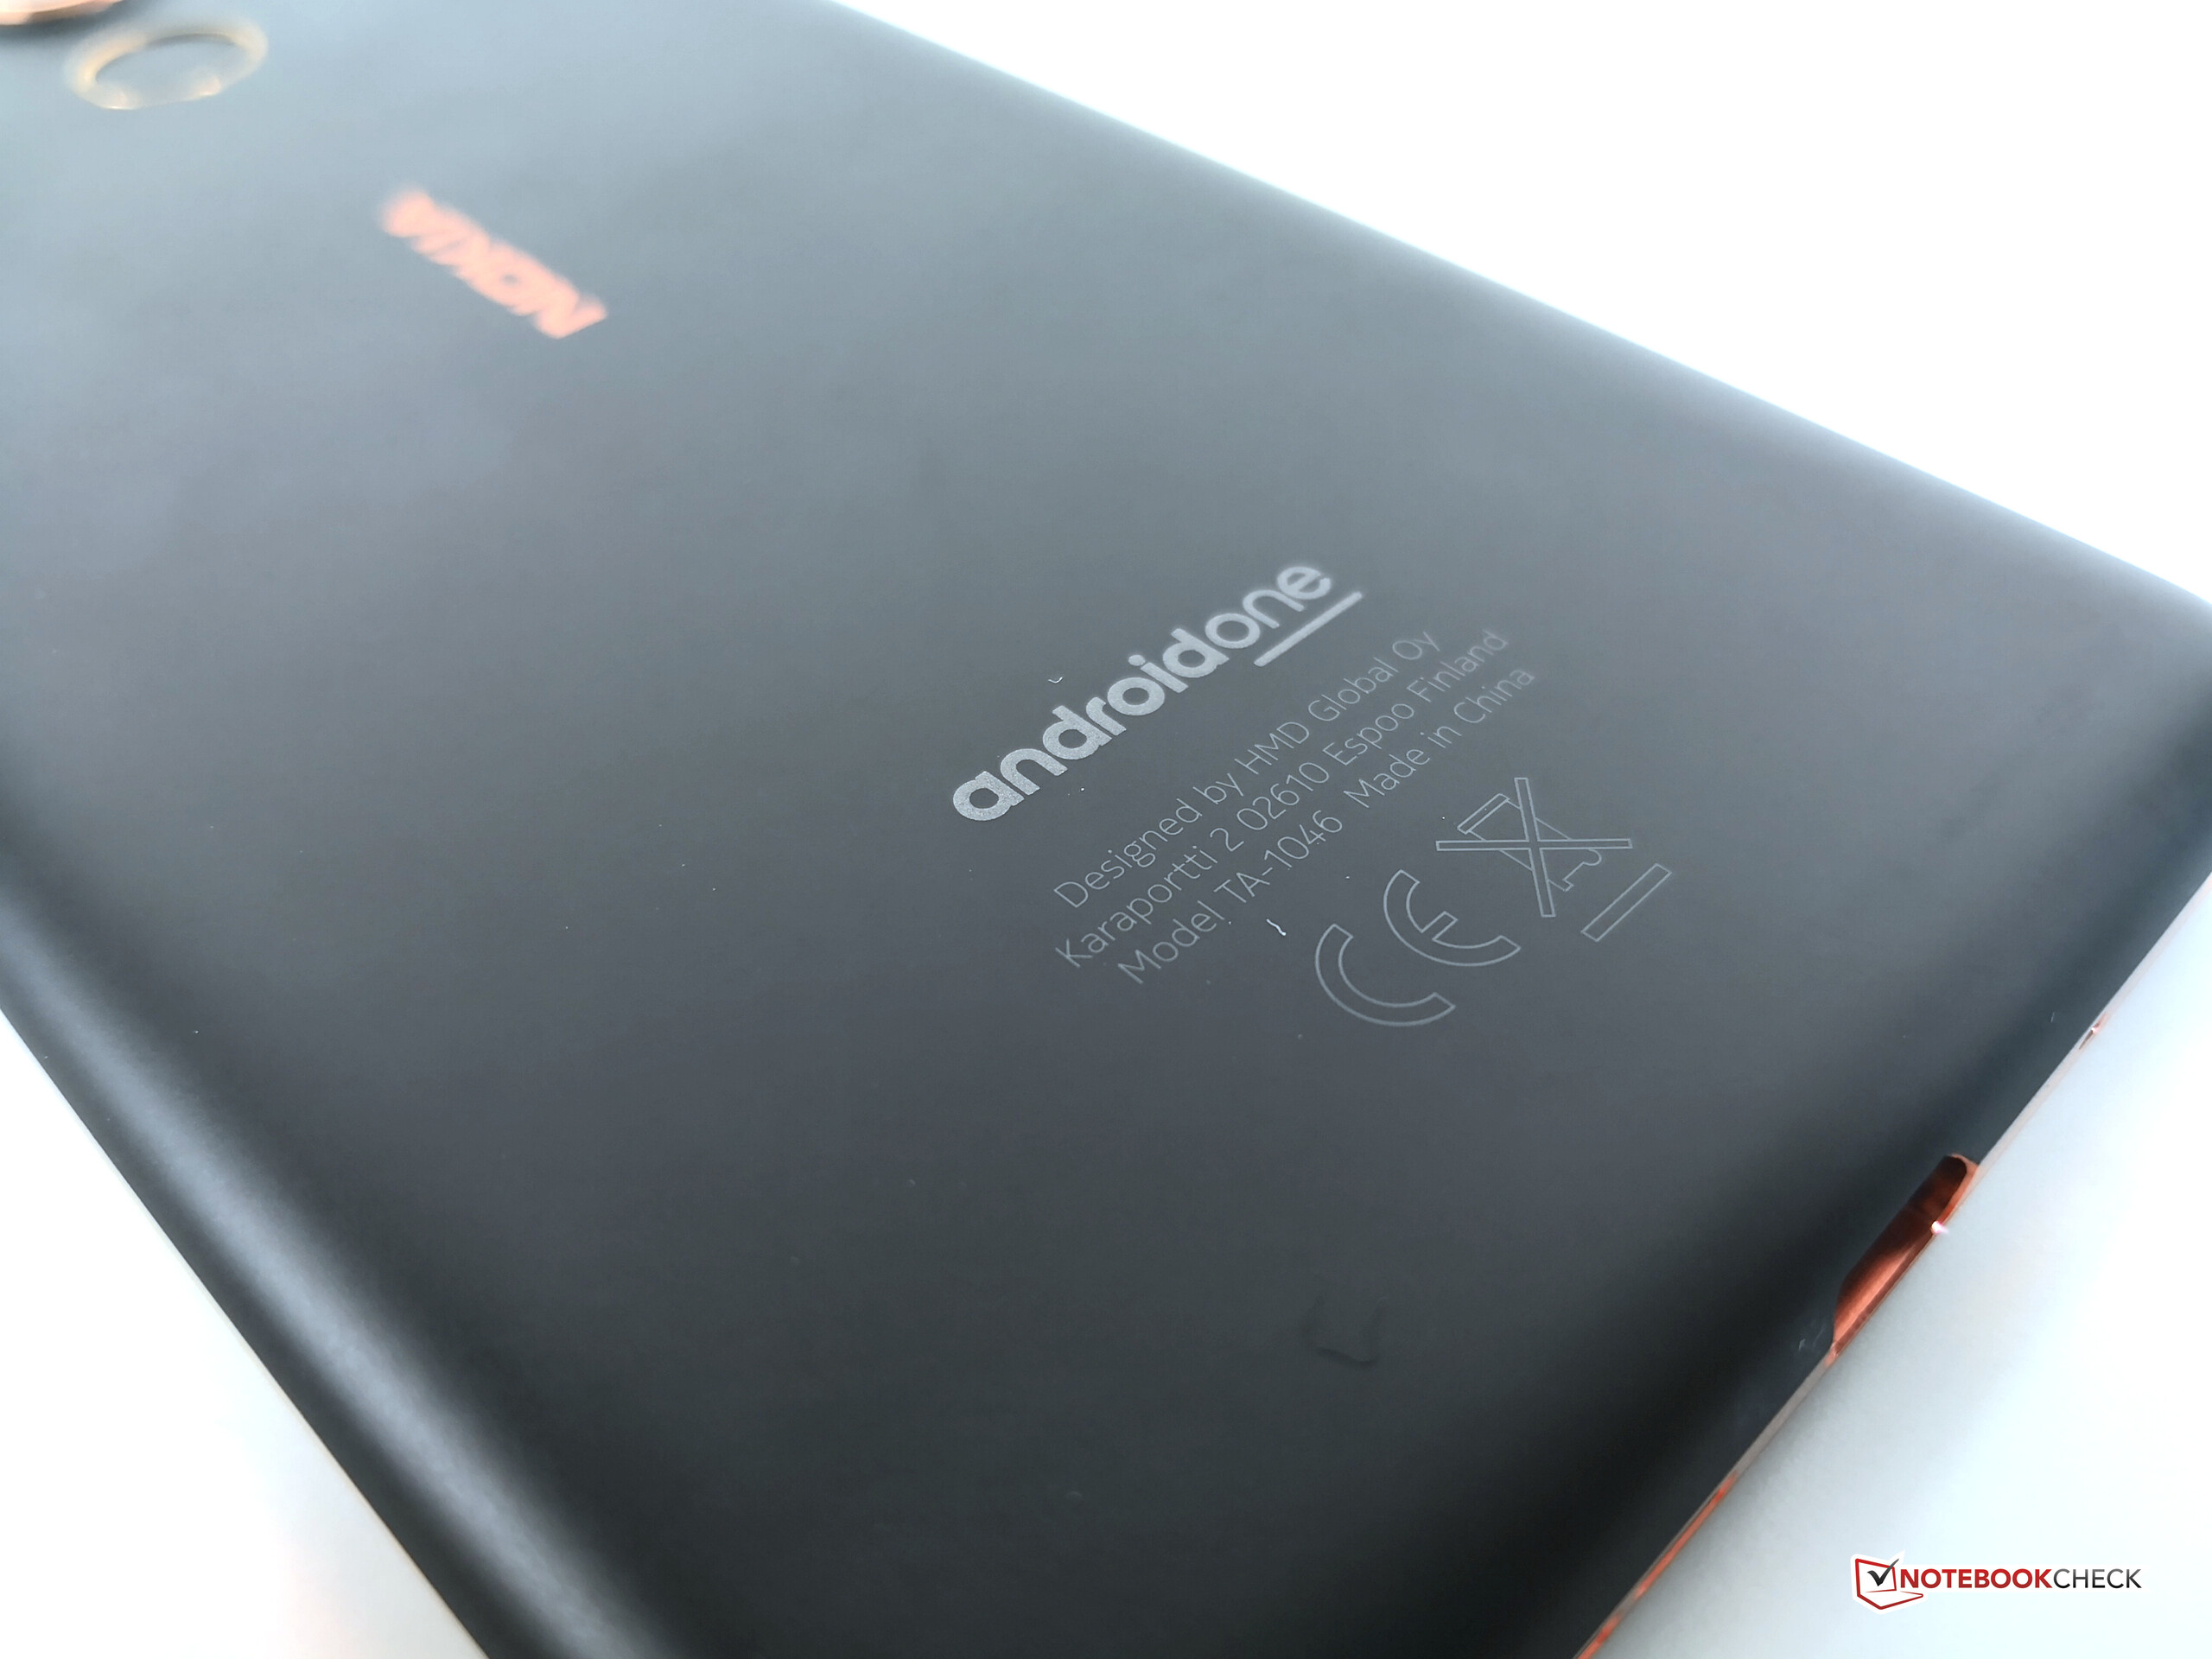
Com o Nokia 7 Plus, a fabricante finlandesa HMD Global oferece um pacote muito interessante, na faixa de preços de 360-400 Euros (~$424-471). Especialmente, porque o smartphone vem através do Programa Android One e, portanto, é garantido que receberá atualizações de segurança e de software ainda durante um longo tempo.
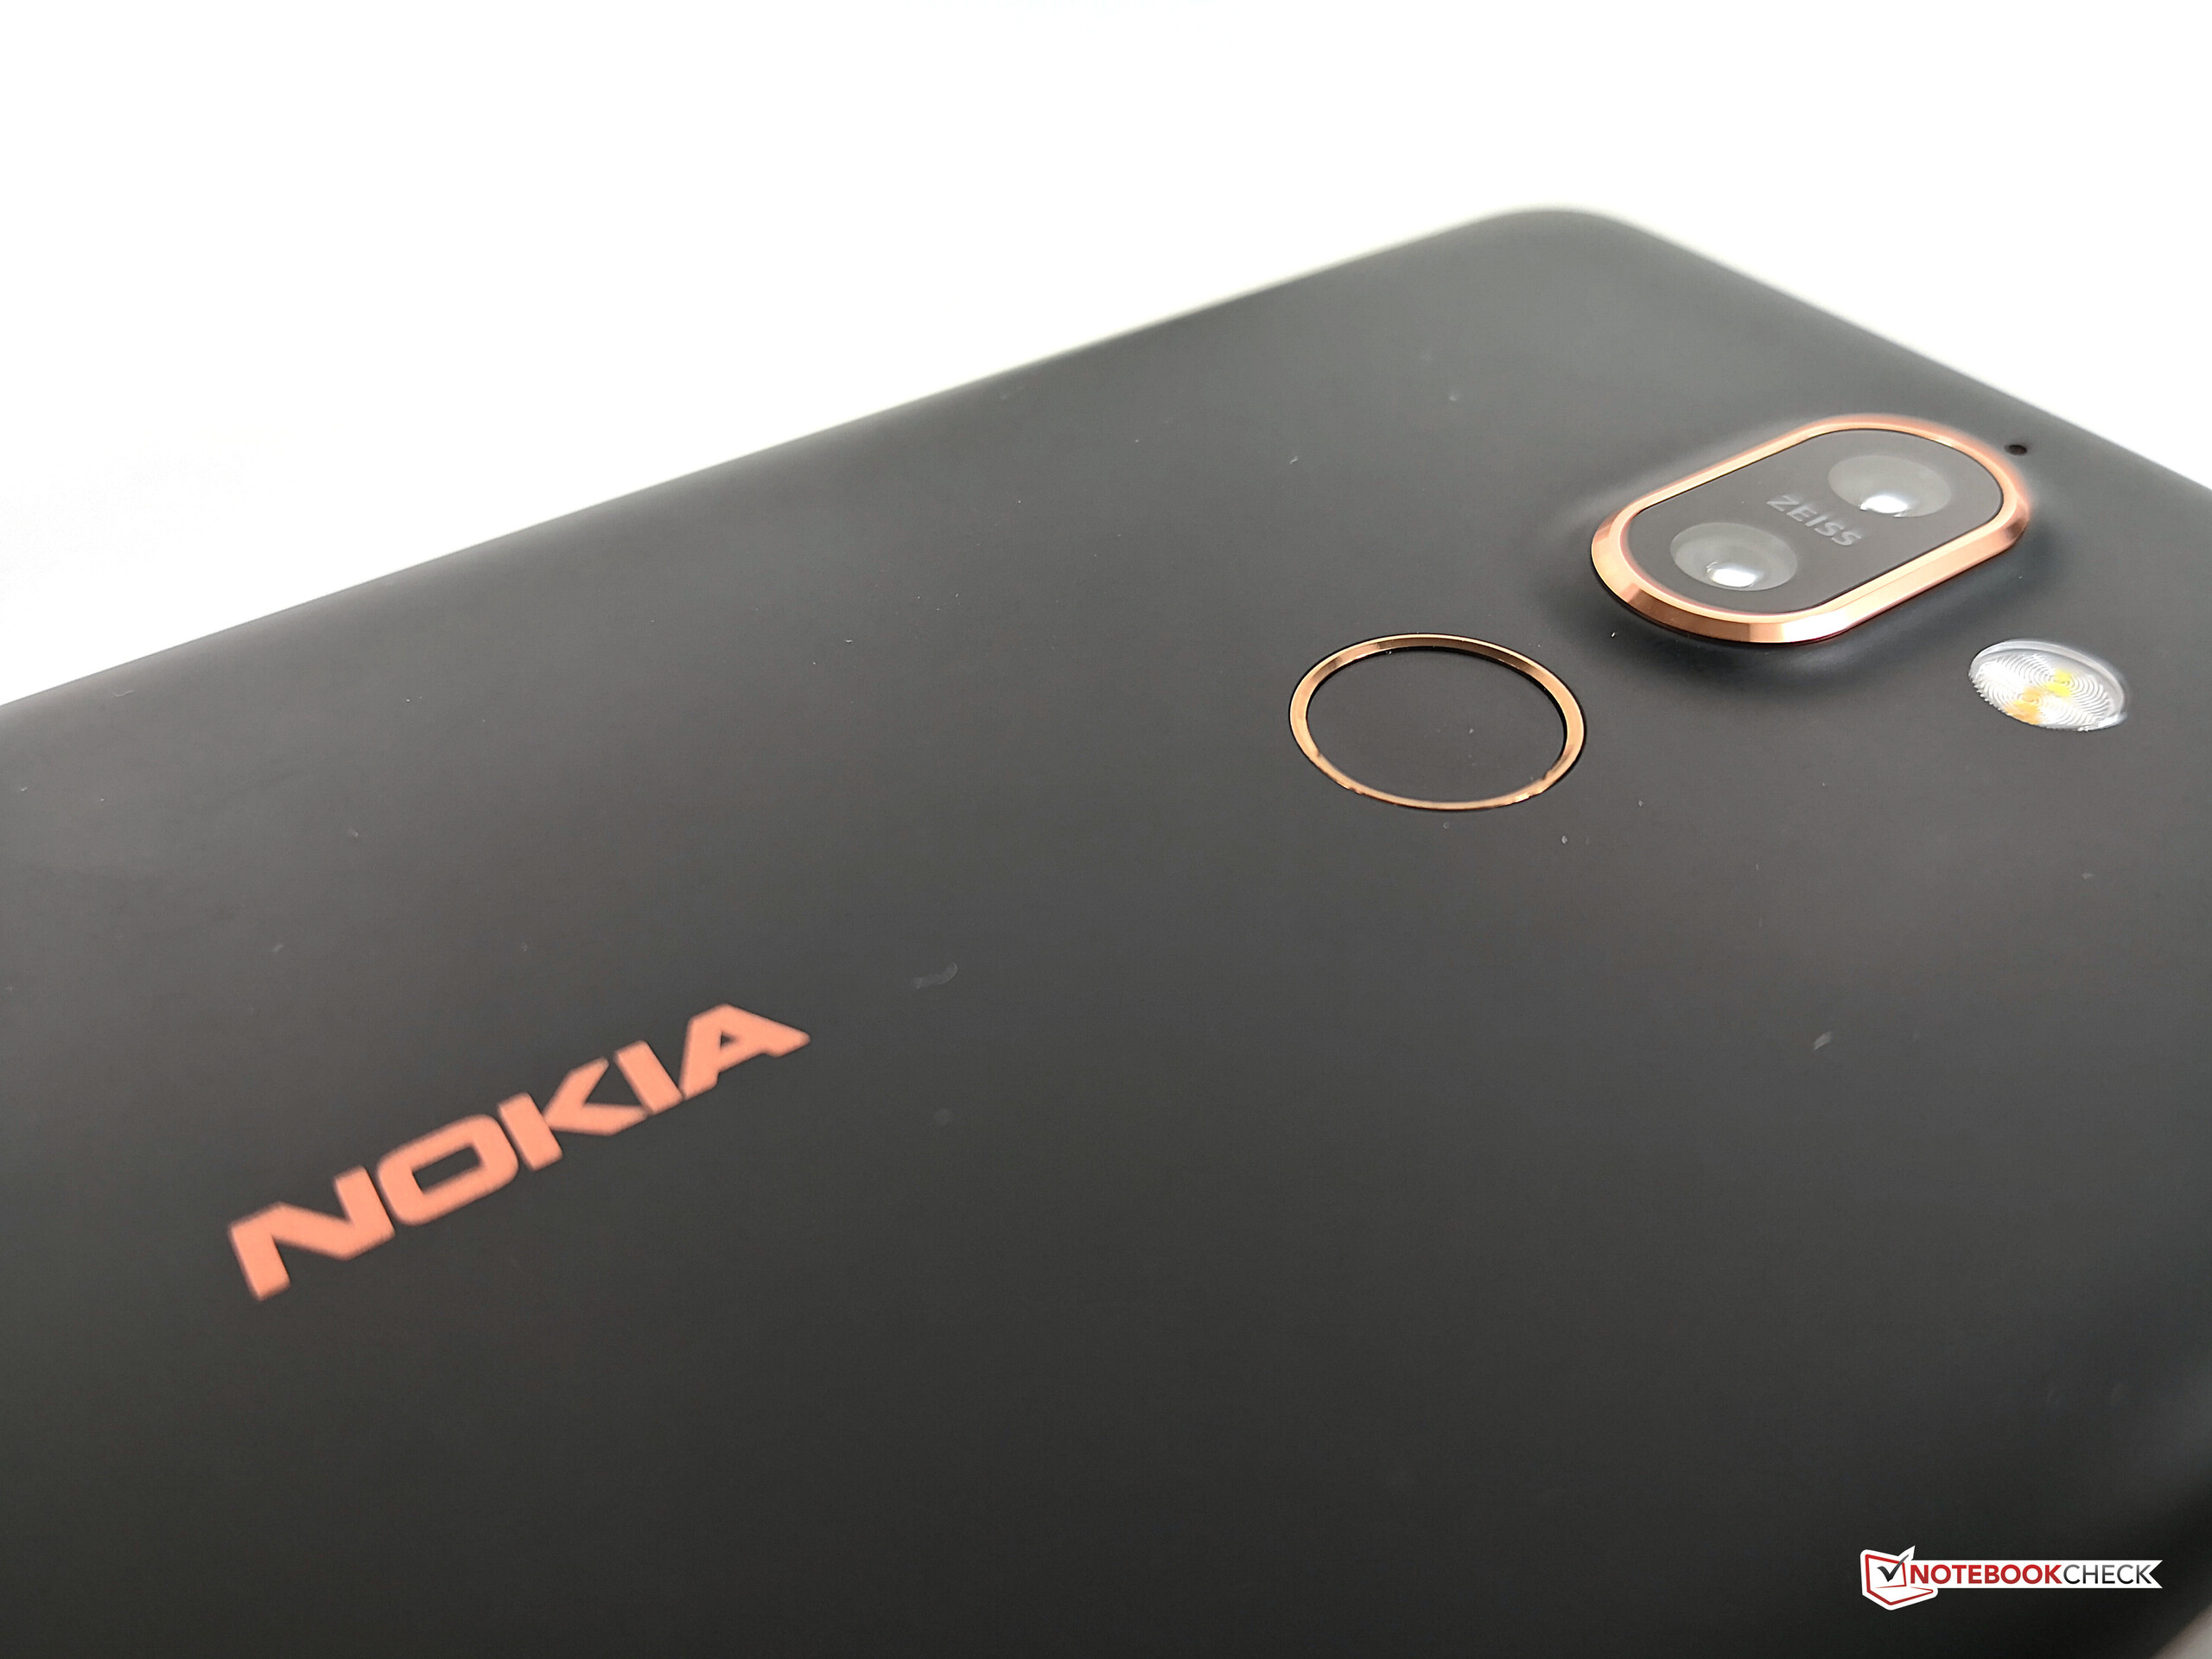
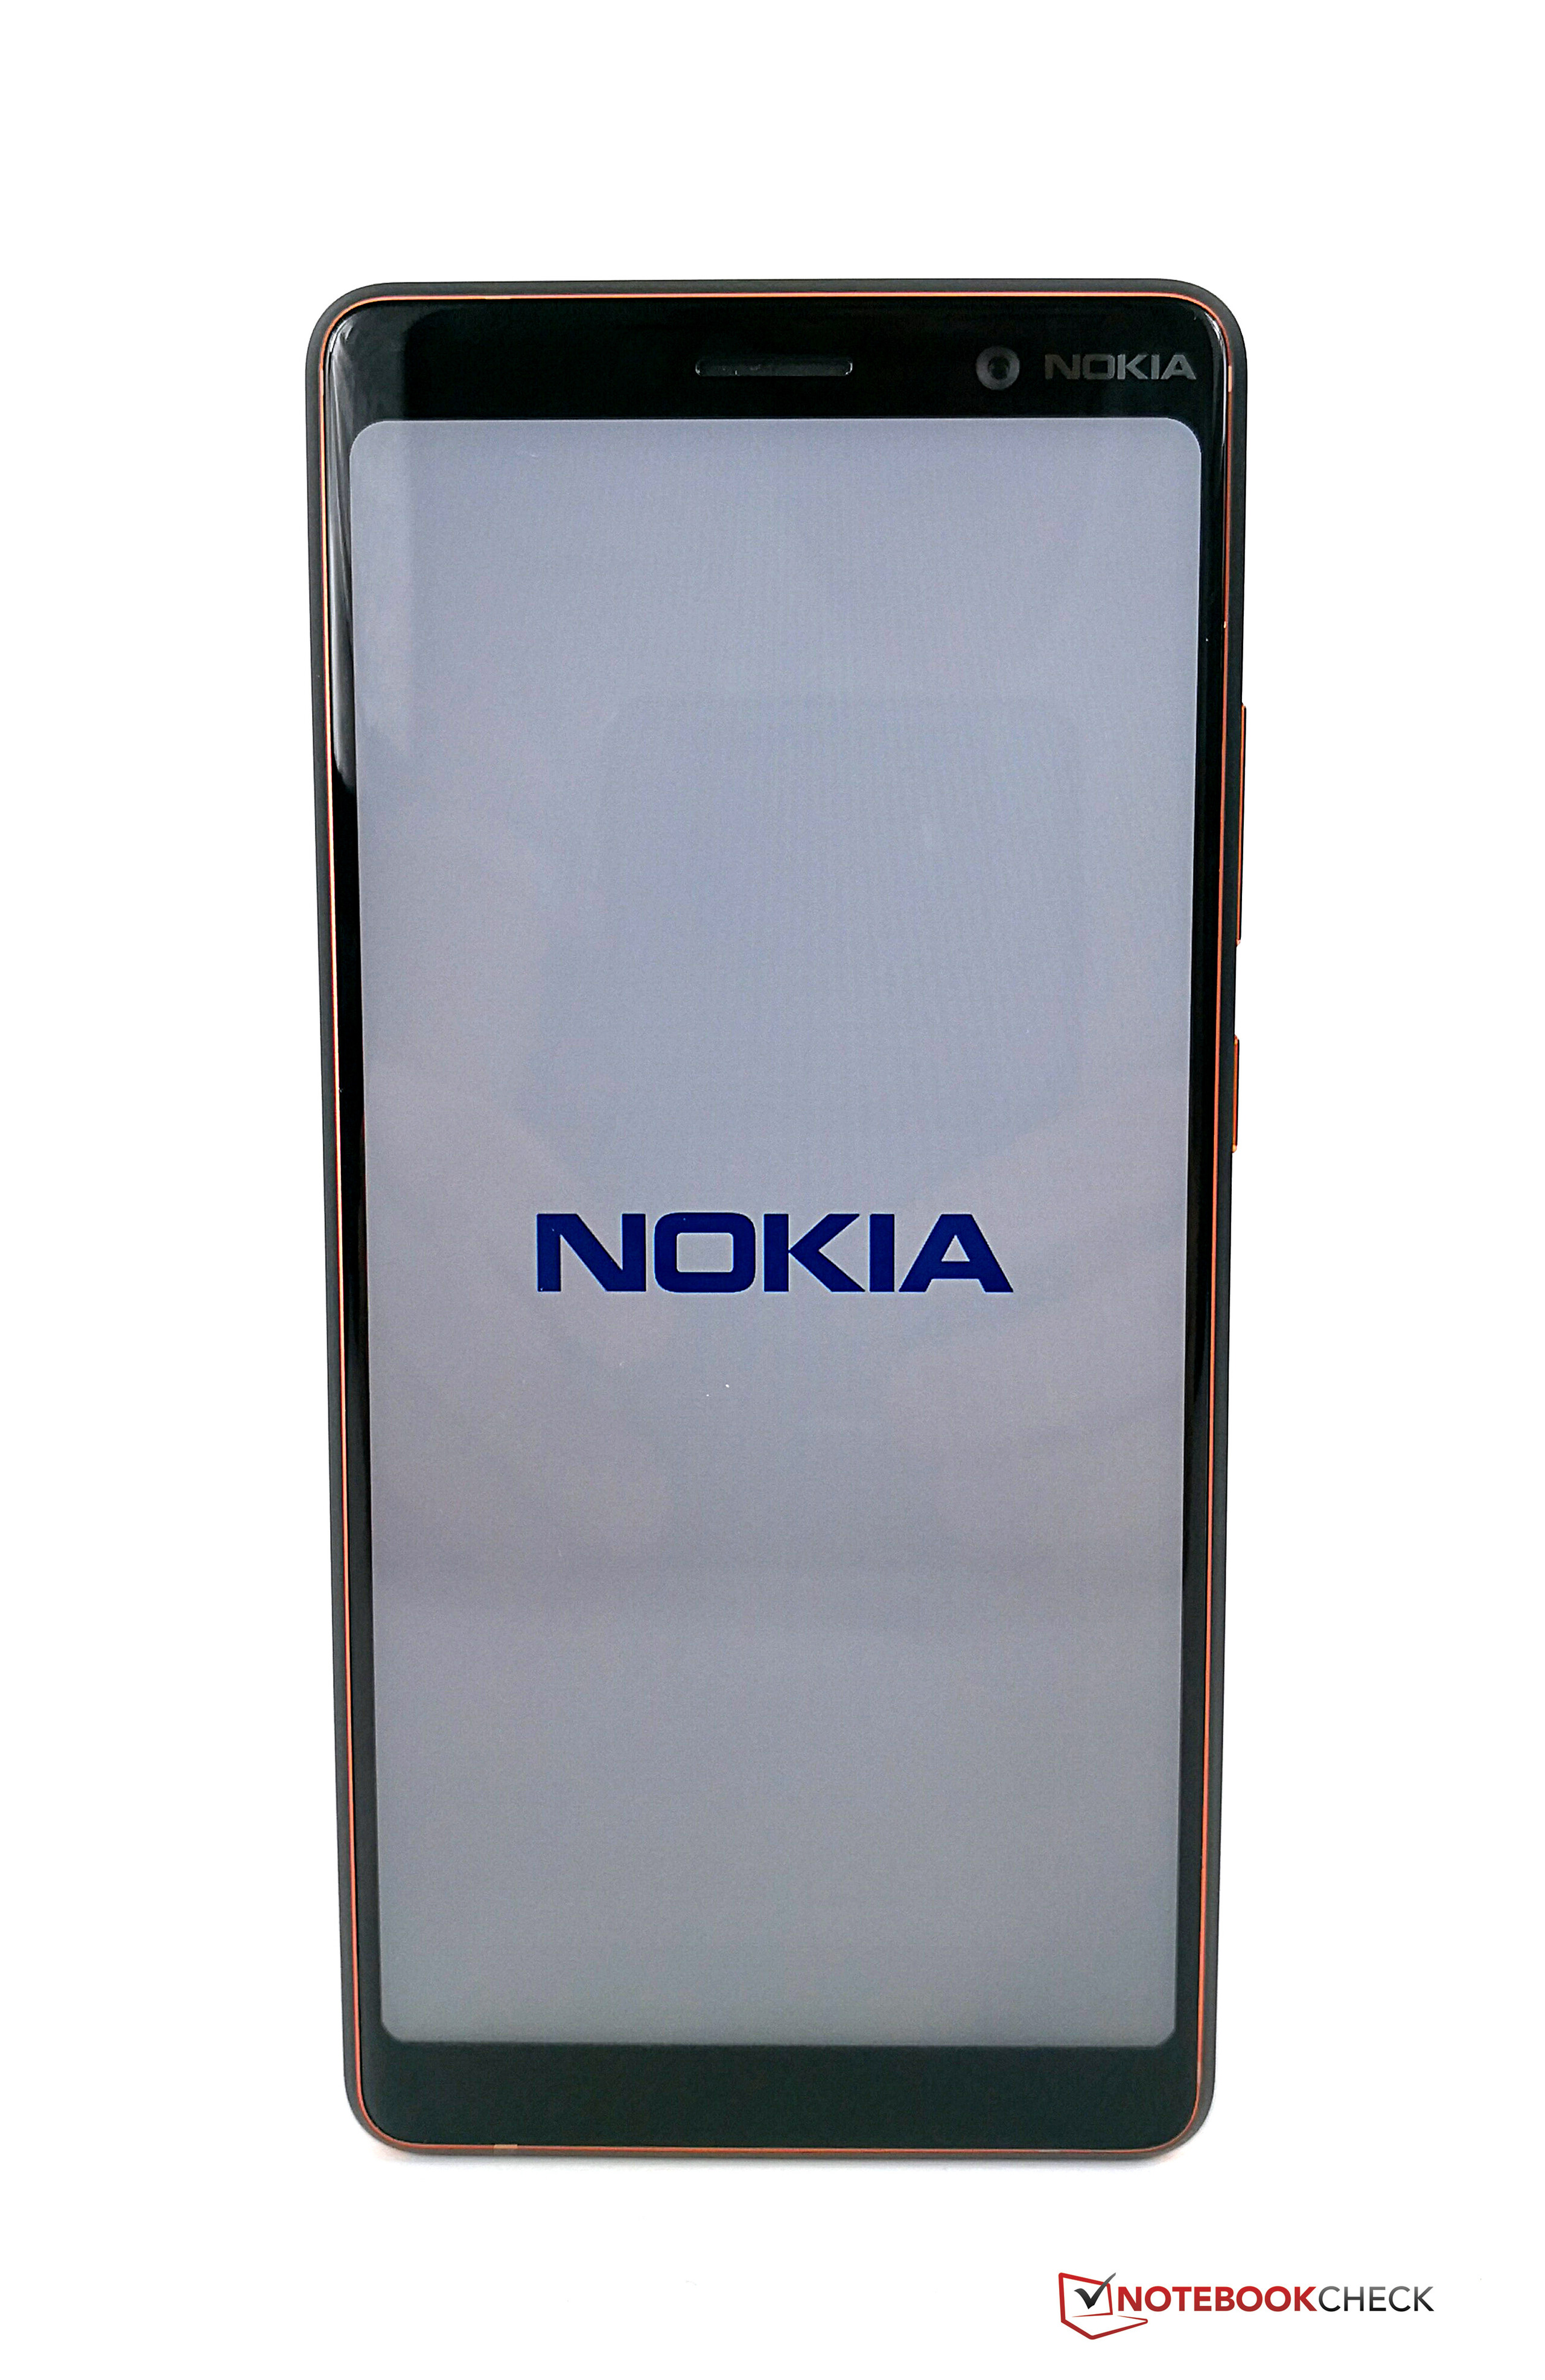
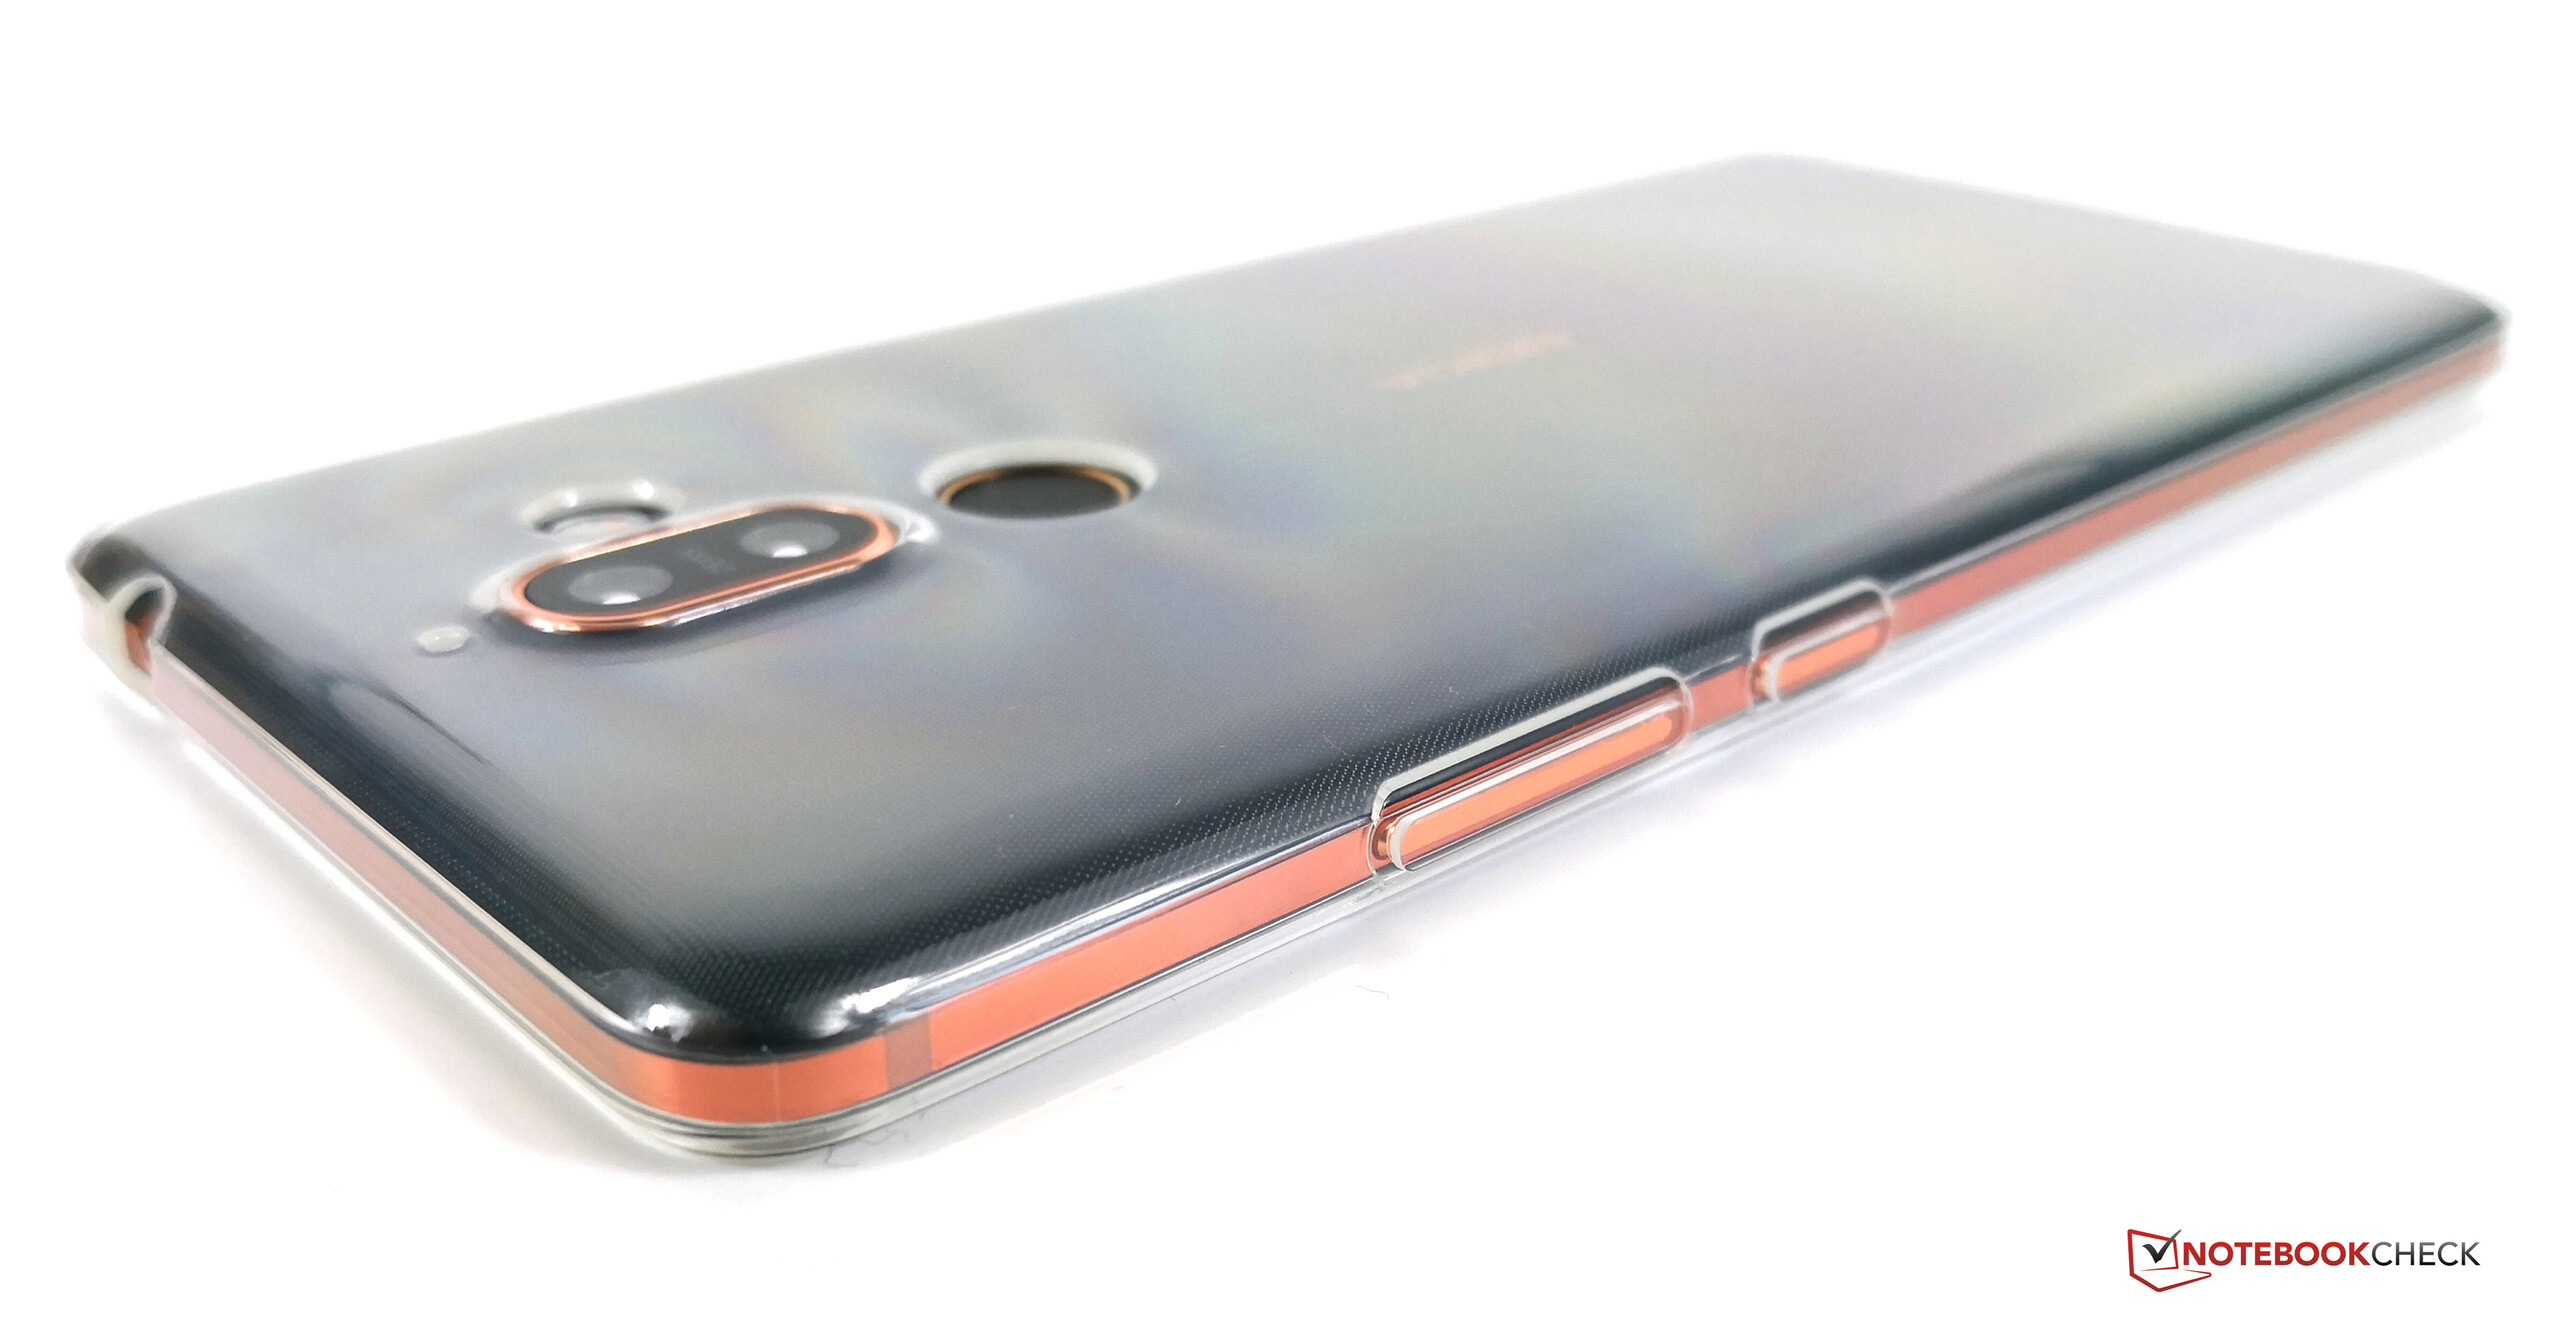
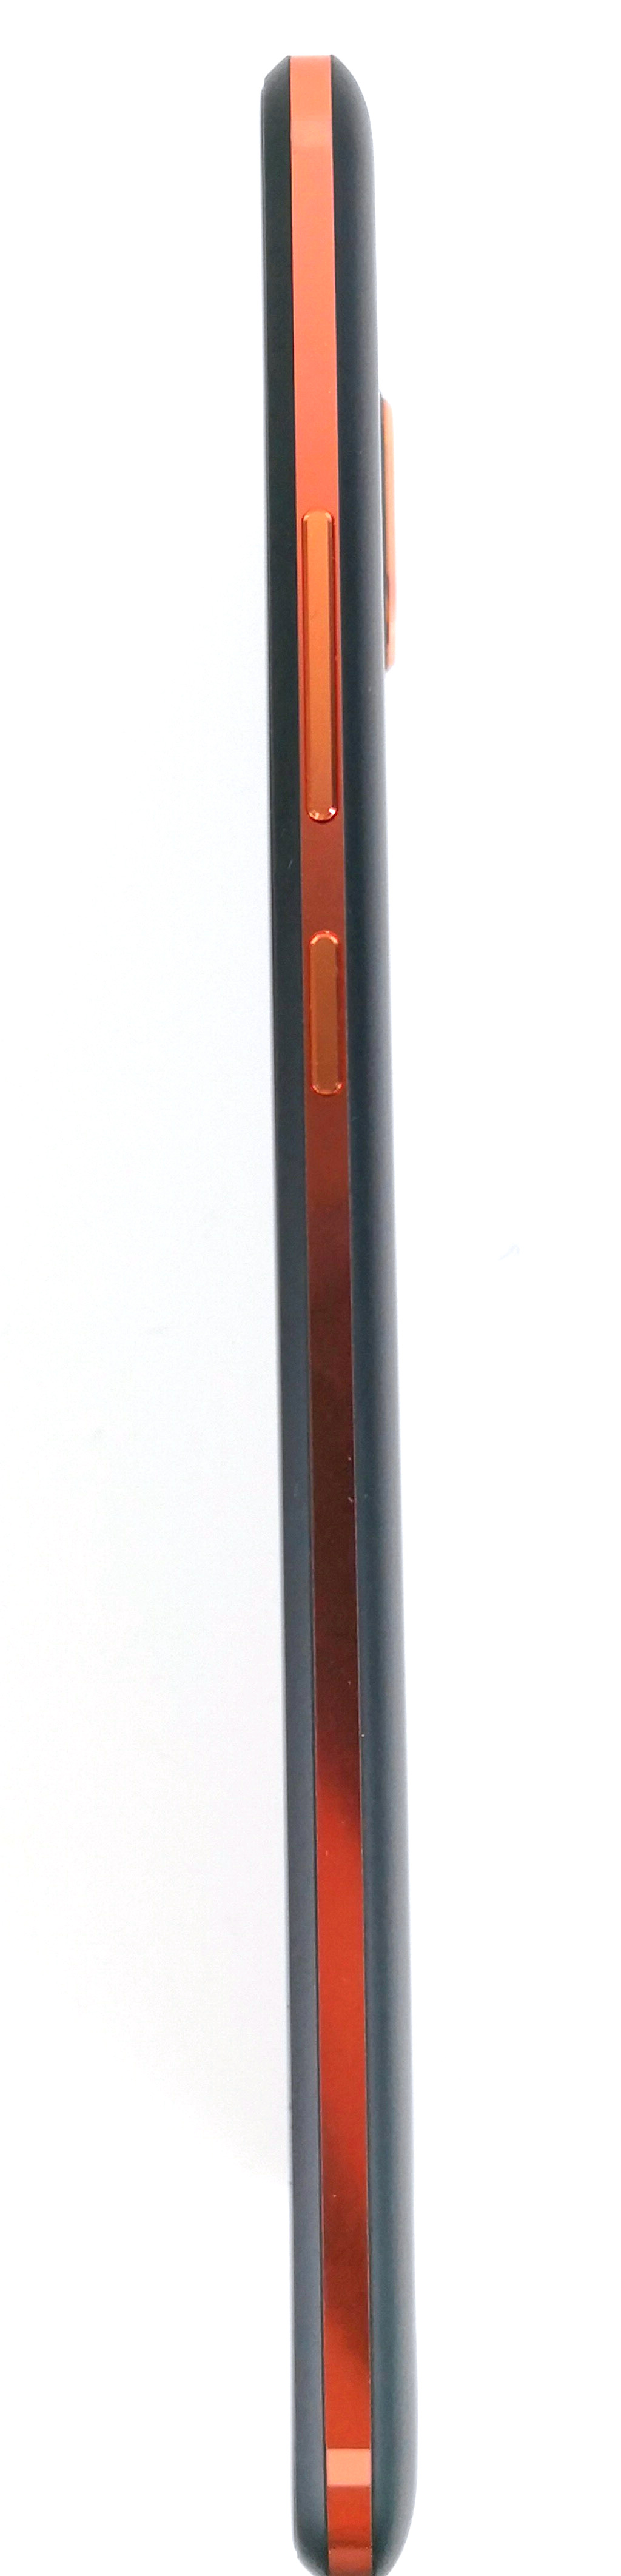
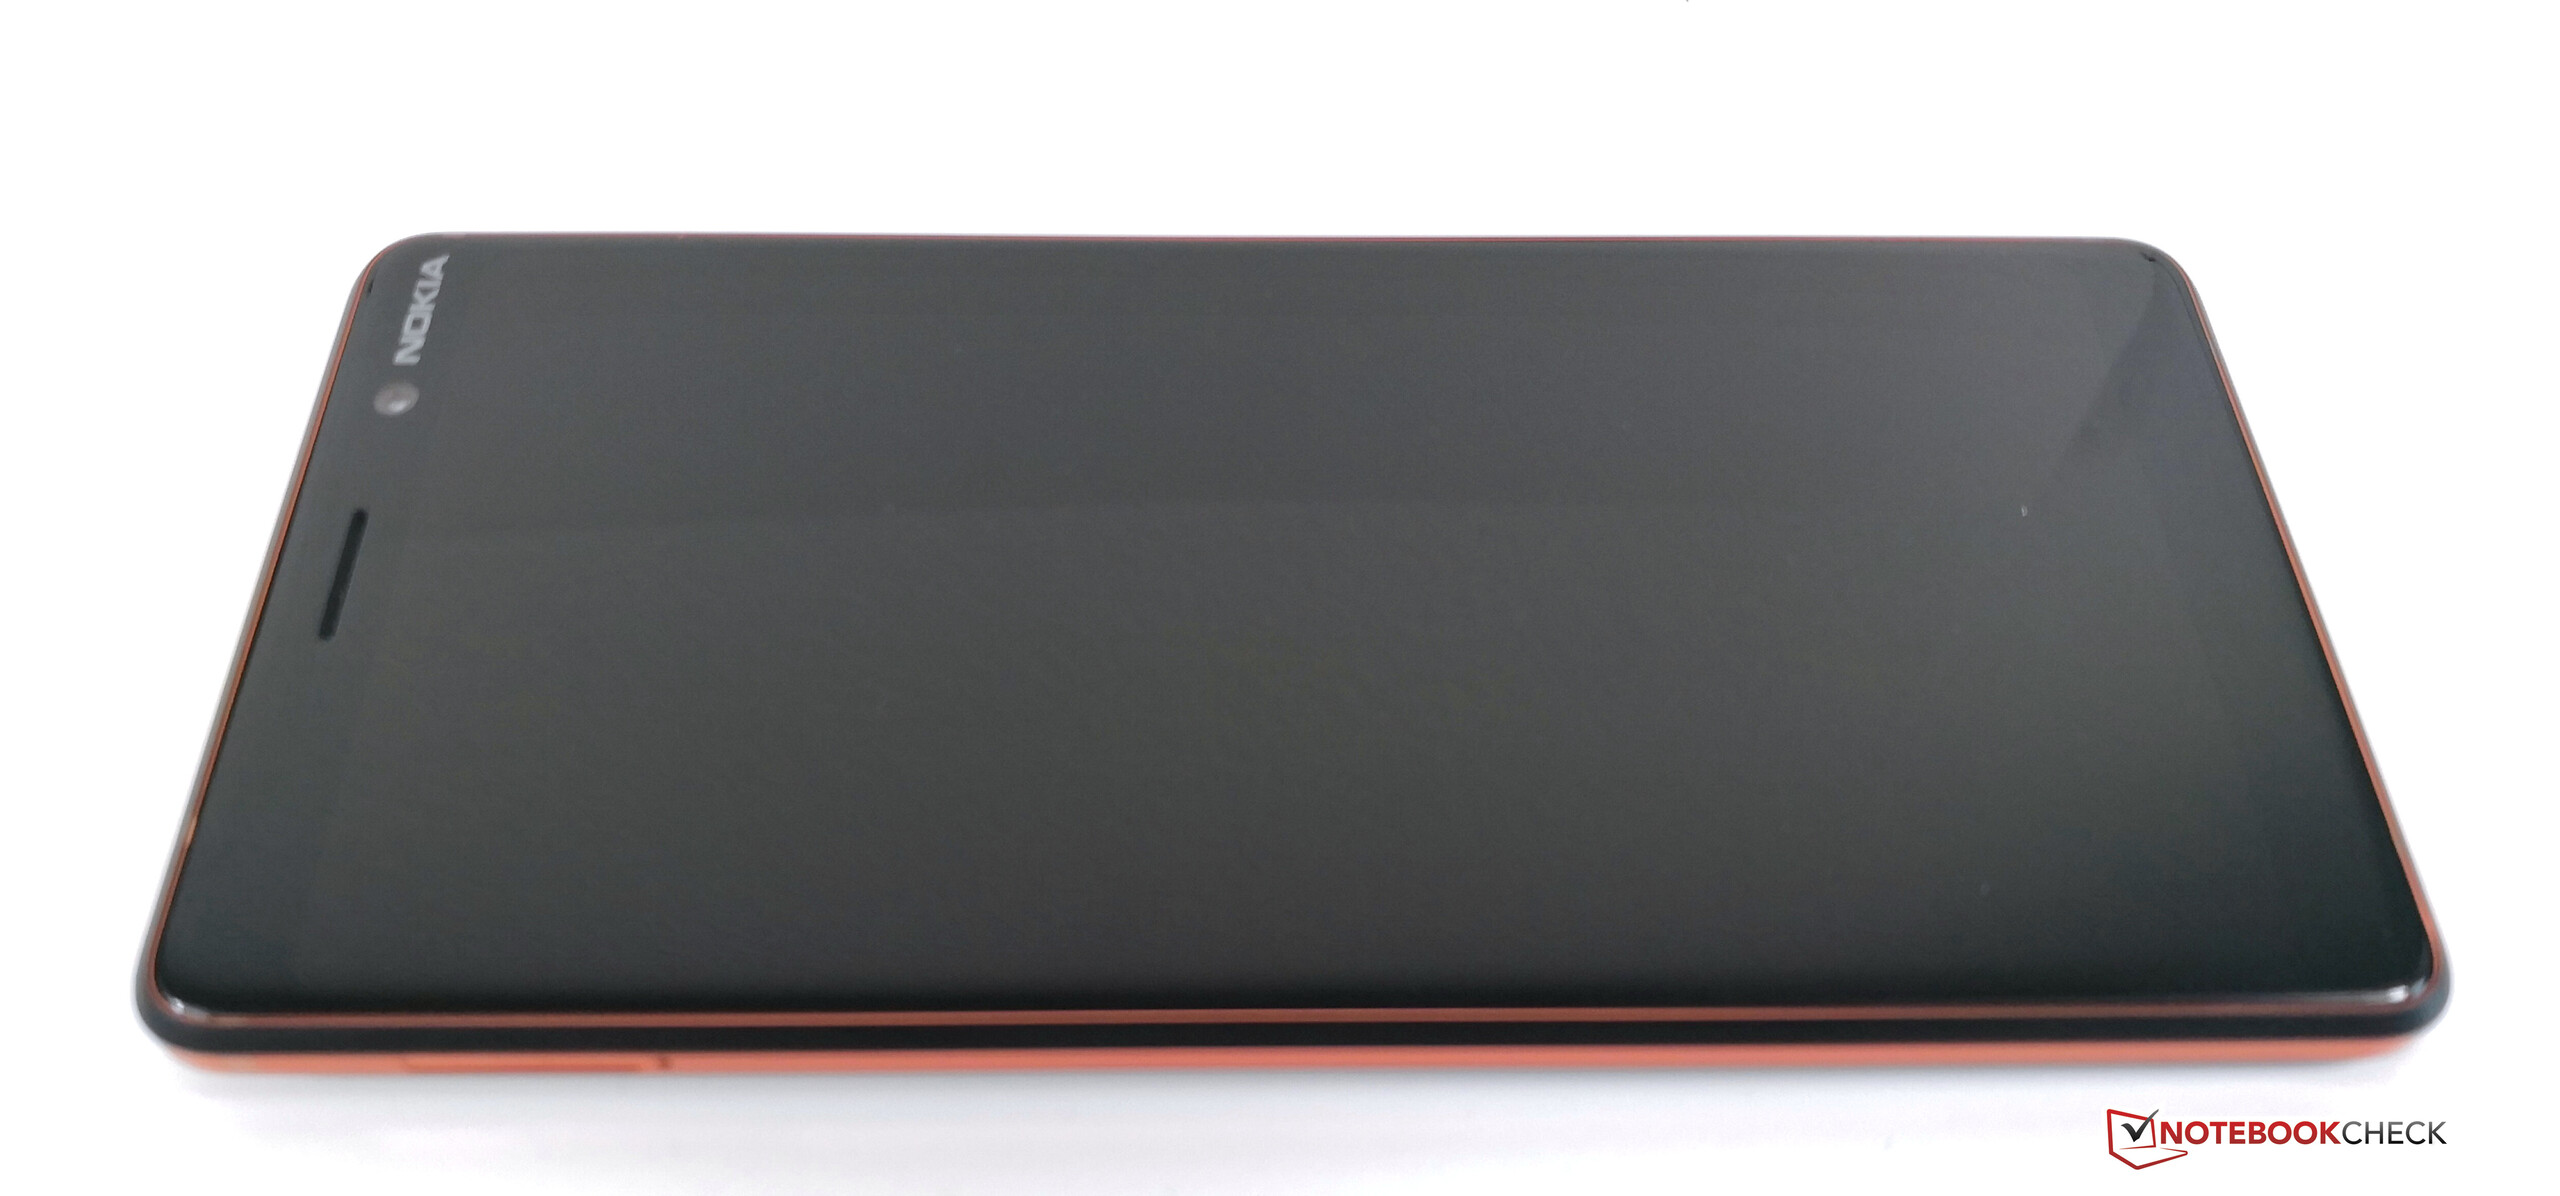
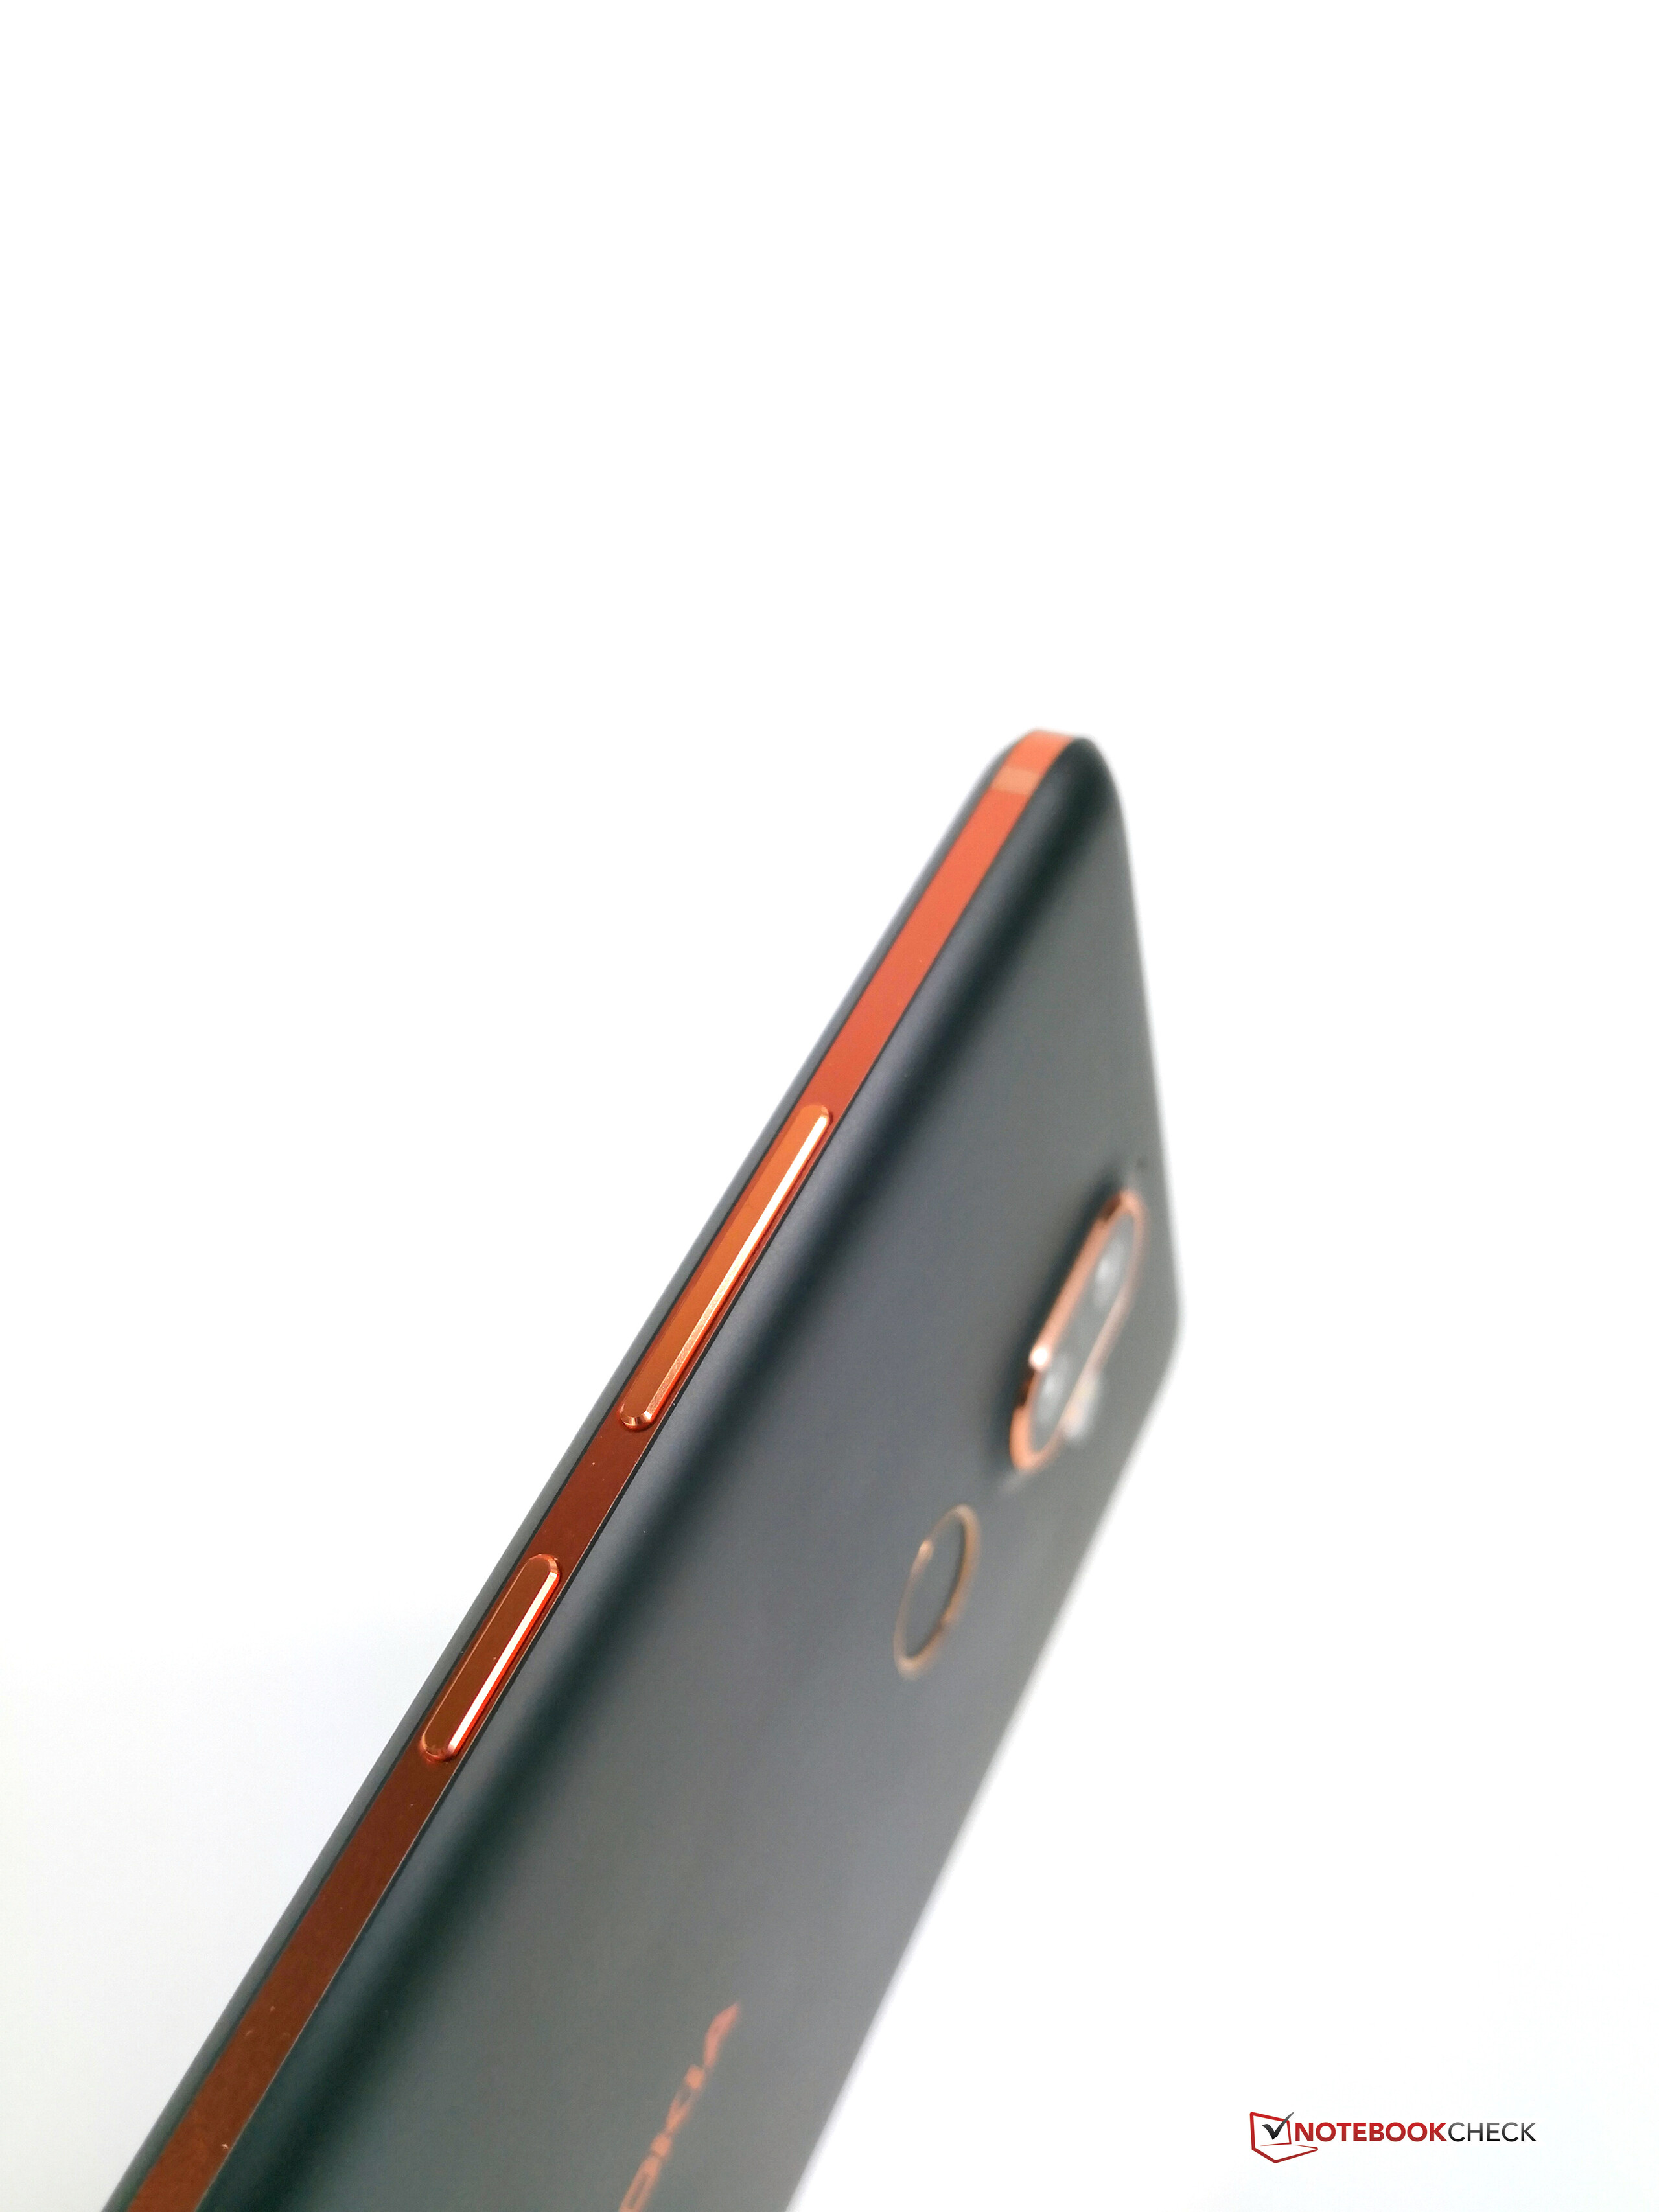
O Nokia 7 Plus se vê e se sente muito bem. Dito isto, não achamos que a escolha de materiais para a parte traseira do dispositivo seja 100% impressionante. Além disso, os lados do smartphone se sentem angulares e desajeitados na mão.
A tela, a câmera e o SoC são bastante competitivos para um dispositivo de 400 euros (~$471). No entanto, se você está disposto a gastar cerca de 50/100 Euros (~ $58-117) a mais, então você poderá obter o Samsung Galaxy S8, que conta com uma tela muito melhor e um SoC mais rápido. A duração da bateria é muito boa no momento do lançamento, mas ainda há espaço para melhorias.
Desde que as quedas de preços pós-lançamento habituais ocorram, o Nokia 7 Plus oferece uma combinação muito interessante de hardware e software. Os potenciais compradores que procuram um smartphone de gama média devem dar uma olhada mais de perto no Nokia 7 Plus.
Nokia 7 Plus
- 11/04/2019 v7 (old)
Marcus Herbrich