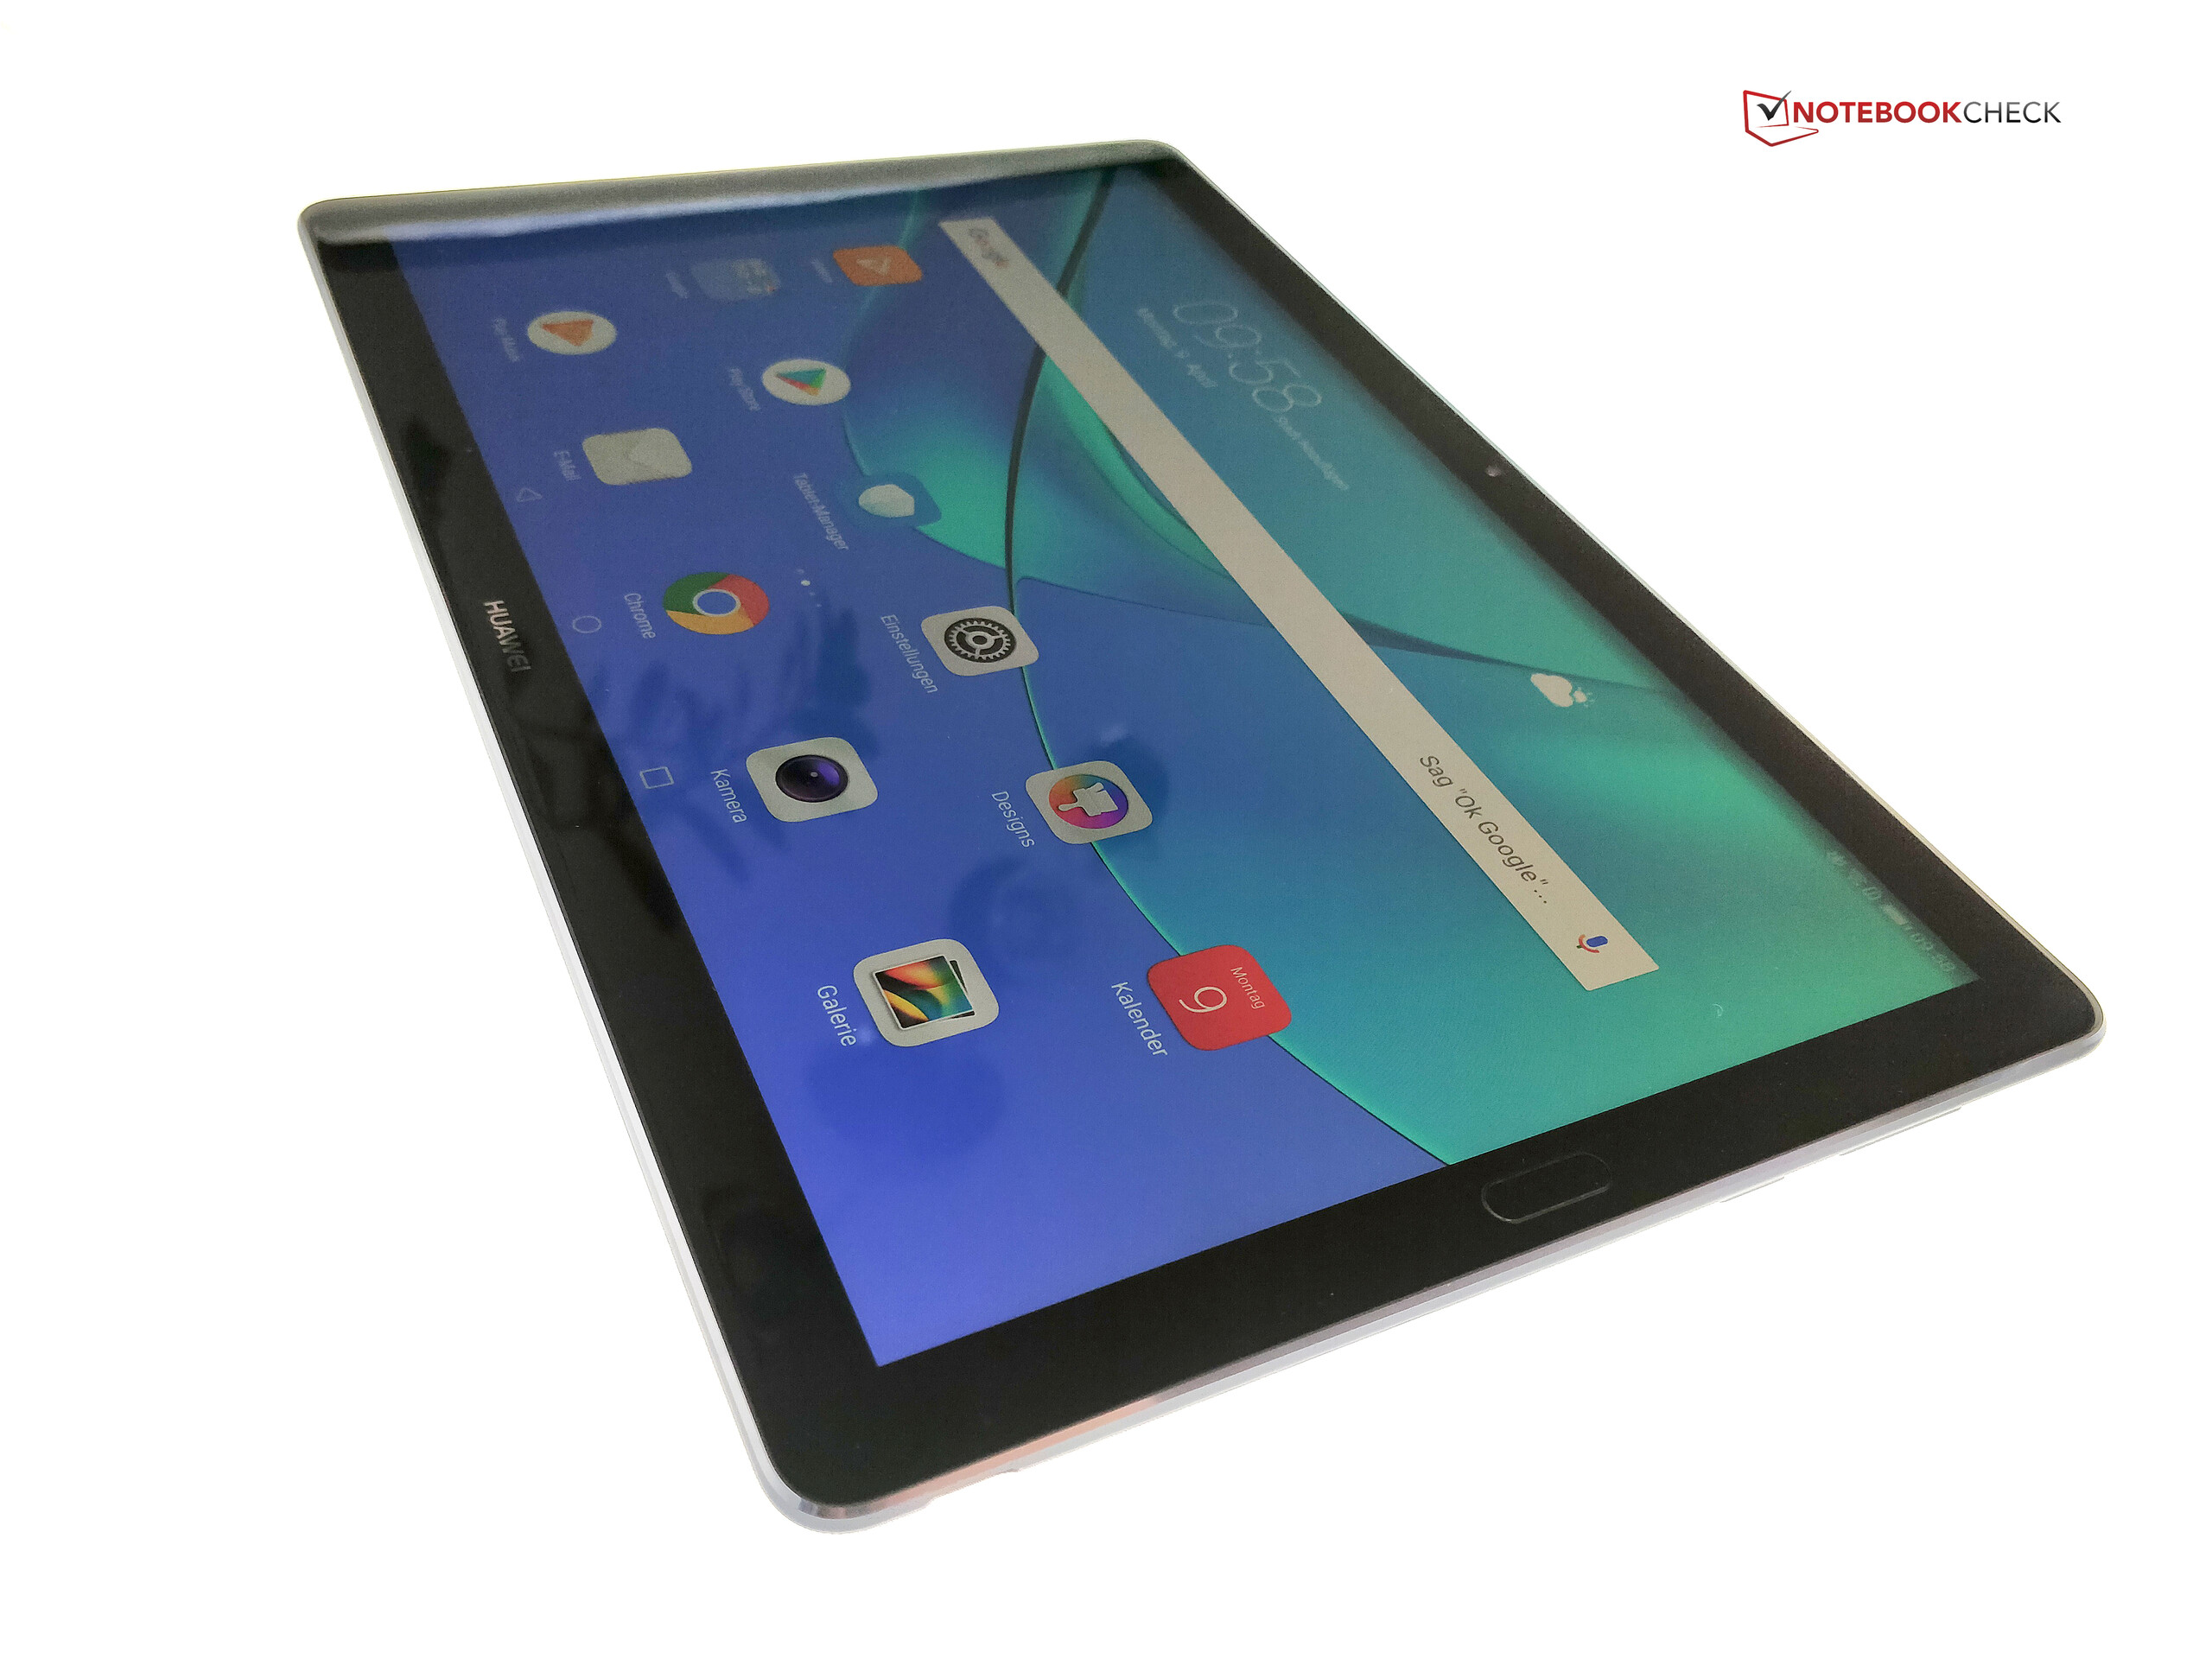
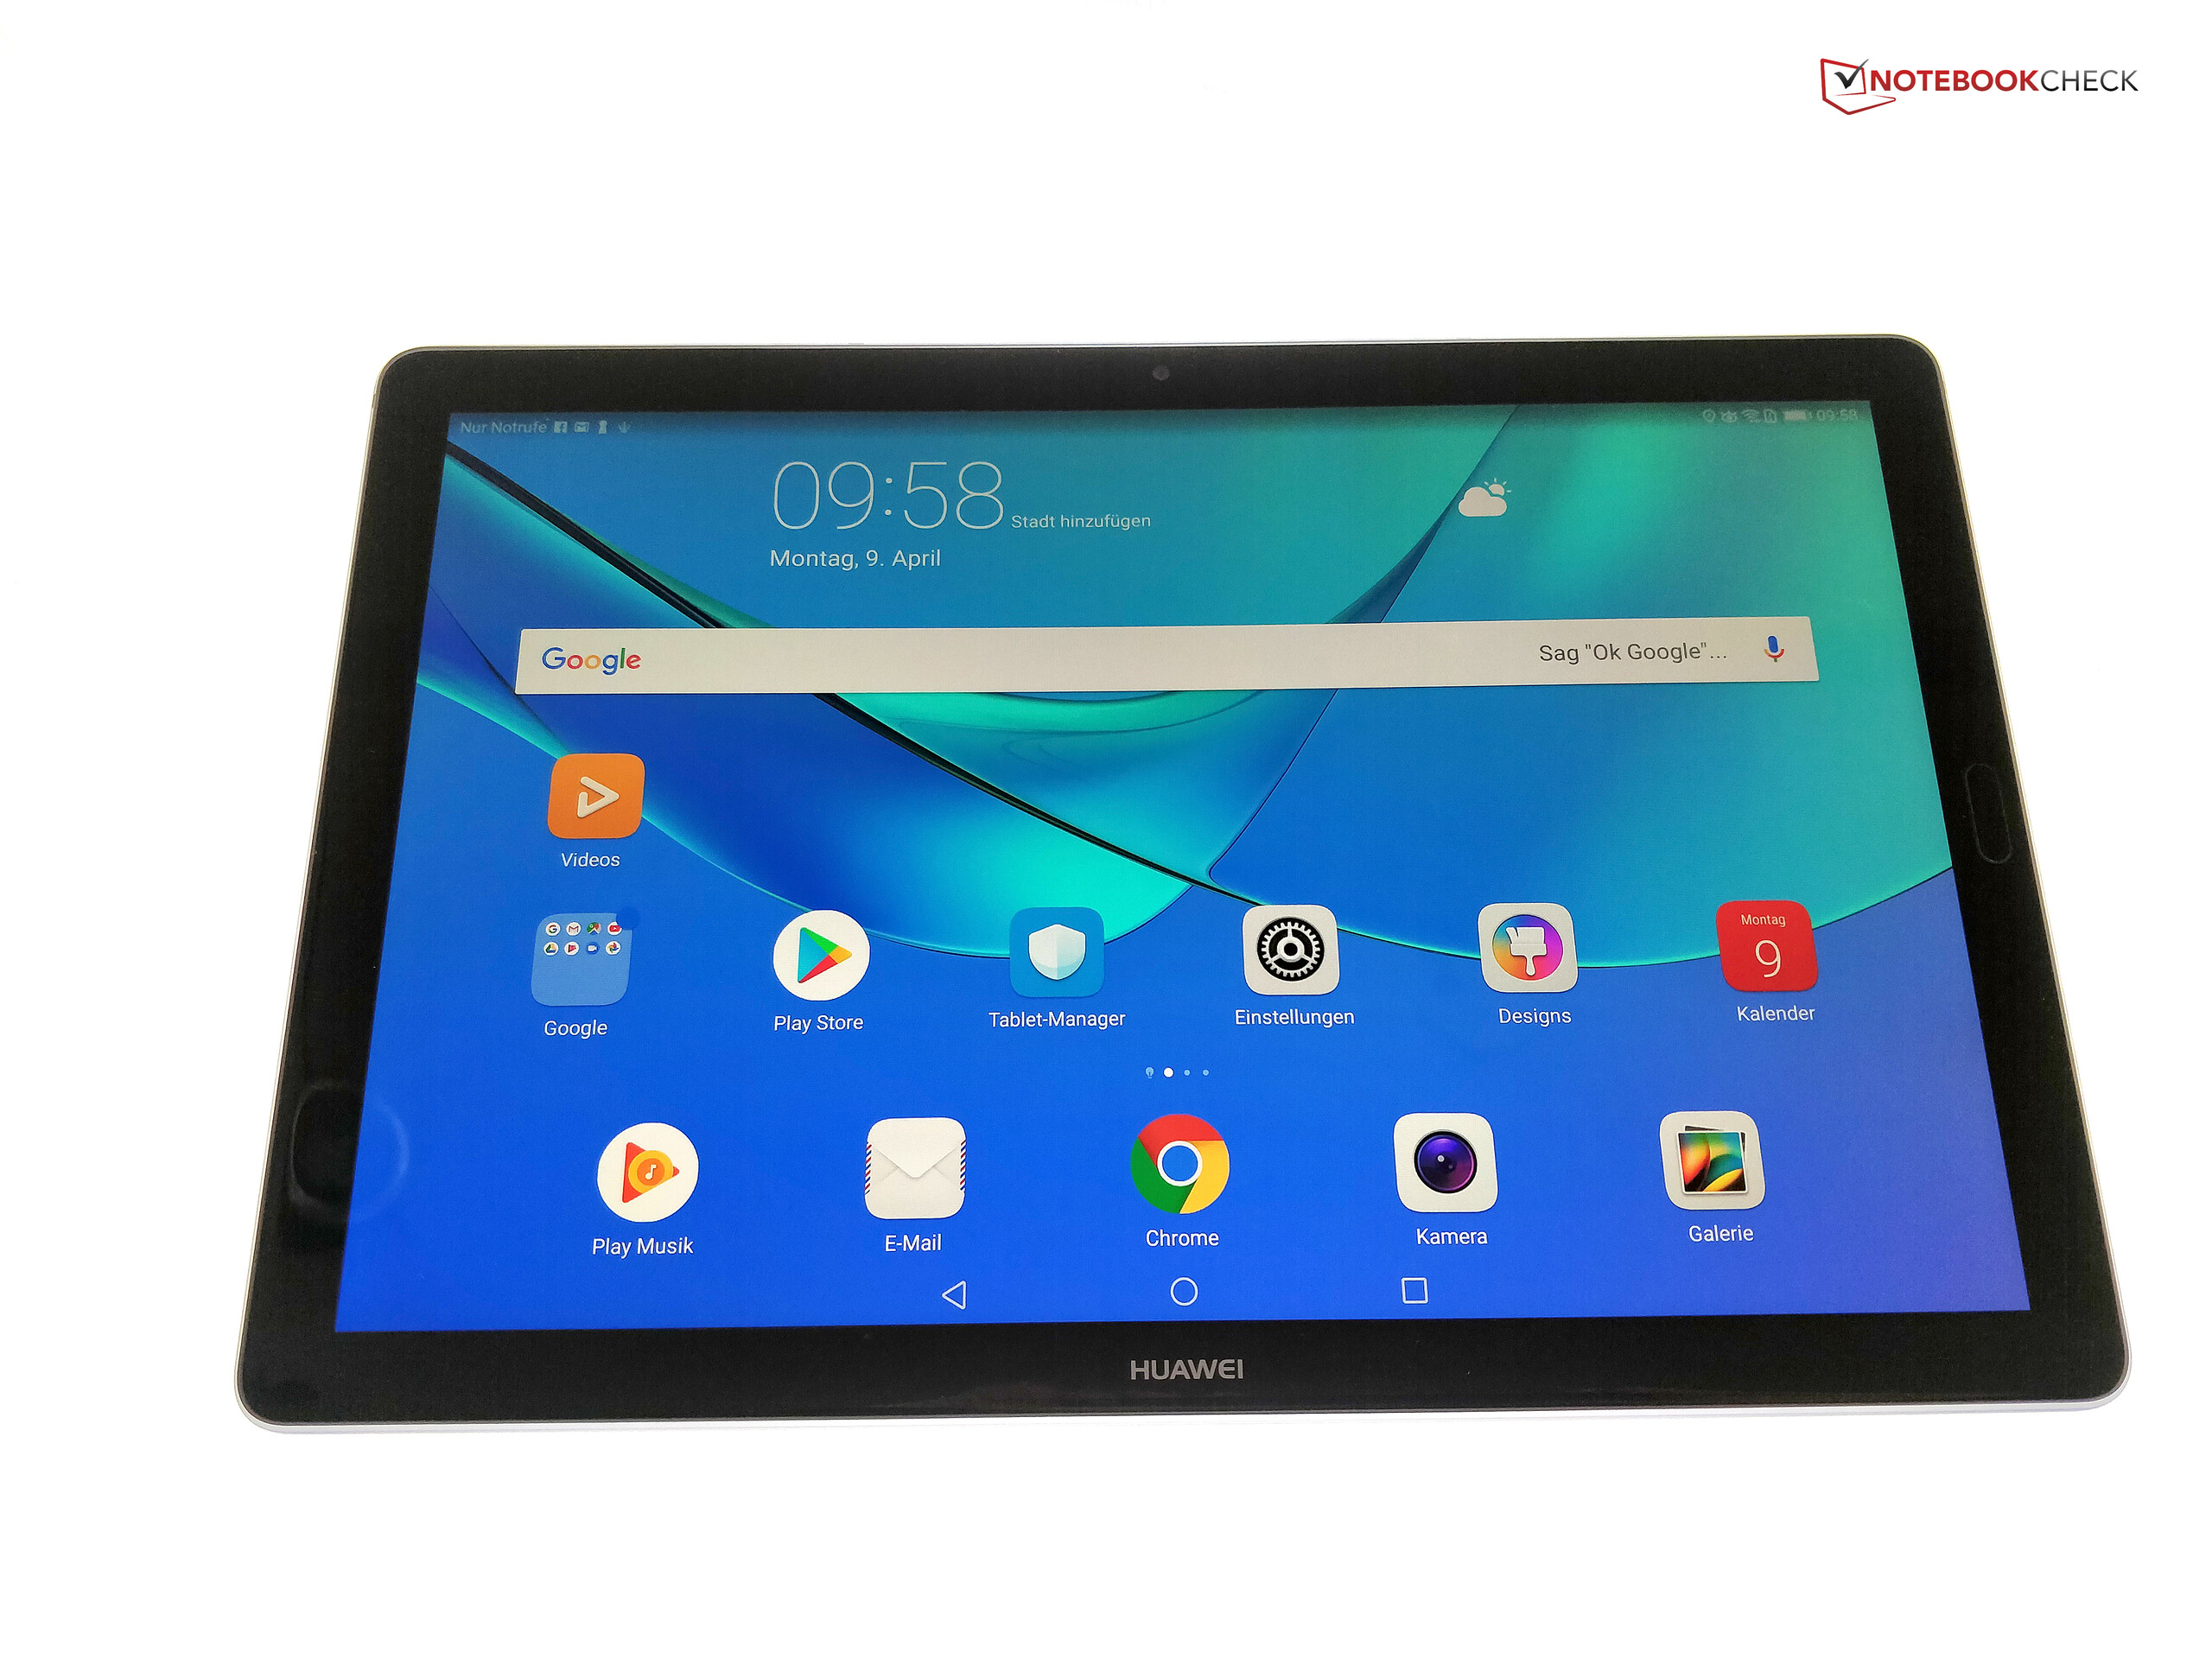
Breve Análise do Tablet Huawei MediaPad M5 (10,8 polegadas, LTE)


| |||||||||||||||||||||||||
iluminação: 92 %
iluminação com acumulador: 382 cd/m²
Contraste: 1592:1 (Preto: 0.24 cd/m²)
ΔE ColorChecker Calman: 2.8 | ∀{0.5-29.43 Ø4.73}
ΔE Greyscale Calman: 3.5 | ∀{0.09-98 Ø4.97}
Gamma: 2.33
CCT: 6903 K
| Huawei MediaPad M5 10.8 IPS, 2560x1600, 10.8" | Apple iPad 6 2018 IPS, 2048x1536, 9.7" | Acer Iconia Tab 10 A3-A50 IPS, 1920x1200, 10.1" | Lenovo Tab 4 10 Plus IPS, 1920x1200, 10.1" | Amazon Fire HD 10 2017 IPS, 1920x1200, 10.1" | Huawei MediaPad M3 Lite IPS, 1920x1200, 10.1" | |
|---|---|---|---|---|---|---|
| Screen | 6% | -92% | -8% | -27% | -6% | |
| Brightness middle (cd/m²) | 382 | 530 39% | 340 -11% | 443 16% | 426 12% | 435 14% |
| Brightness (cd/m²) | 378 | 513 36% | 320 -15% | 428 13% | 399 6% | 413 9% |
| Brightness Distribution (%) | 92 | 92 0% | 84 -9% | 94 2% | 91 -1% | 93 1% |
| Black Level * (cd/m²) | 0.24 | 0.61 -154% | 0.19 21% | 0.36 -50% | 0.38 -58% | 0.25 -4% |
| Contrast (:1) | 1592 | 869 -45% | 1789 12% | 1231 -23% | 1121 -30% | 1740 9% |
| Colorchecker dE 2000 * | 2.8 | 1.2 57% | 15 -436% | 3.3 -18% | 4.5 -61% | 4.4 -57% |
| Colorchecker dE 2000 max. * | 6 | 3.2 47% | 22.8 -280% | 7.2 -20% | 7.9 -32% | 7.7 -28% |
| Greyscale dE 2000 * | 3.5 | 1 71% | 4 -14% | 2.9 17% | 5.2 -49% | 3.2 9% |
| Gamma | 2.33 94% | 2.28 96% | 2.09 105% | 2.27 97% | 2.23 99% | 2.35 94% |
| CCT | 6903 94% | 6588 99% | 6940 94% | 6961 93% | 6875 95% | 7056 92% |
* ... menor é melhor
Cintilação da tela / PWM (modulação por largura de pulso)
| Tela tremeluzindo/PWM detectado | 19530 Hz | ≤ 45 % configuração de brilho | 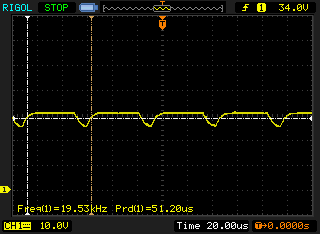 |
A luz de fundo da tela pisca em 19530 Hz (pior caso, por exemplo, utilizando PWM) Cintilação detectada em uma configuração de brilho de 45 % e abaixo. Não deve haver cintilação ou PWM acima desta configuração de brilho. A frequência de 19530 Hz é bastante alta, então a maioria dos usuários sensíveis ao PWM não deve notar nenhuma oscilação. [pwm_comparison] Em comparação: 52 % de todos os dispositivos testados não usam PWM para escurecer a tela. Se PWM foi detectado, uma média de 7798 (mínimo: 5 - máximo: 343500) Hz foi medida. | |||
Exibir tempos de resposta
| ↔ Tempo de resposta preto para branco | ||
|---|---|---|
| 30.4 ms ... ascensão ↗ e queda ↘ combinadas | ↗ 16.4 ms ascensão | 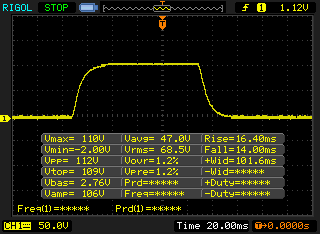 |
| ↘ 14 ms queda | ||
| A tela mostra taxas de resposta lentas em nossos testes e será insatisfatória para os jogadores. Em comparação, todos os dispositivos testados variam de 0.1 (mínimo) a 240 (máximo) ms. » 82 % de todos os dispositivos são melhores. Isso significa que o tempo de resposta medido é pior que a média de todos os dispositivos testados (19.9 ms). | ||
| ↔ Tempo de resposta 50% cinza a 80% cinza | ||
| 42.4 ms ... ascensão ↗ e queda ↘ combinadas | ↗ 22 ms ascensão | 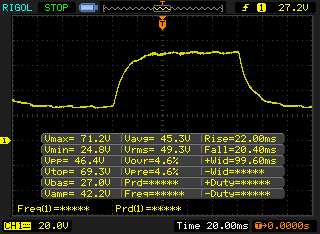 |
| ↘ 20.4 ms queda | ||
| A tela mostra taxas de resposta lentas em nossos testes e será insatisfatória para os jogadores. Em comparação, todos os dispositivos testados variam de 0.165 (mínimo) a 636 (máximo) ms. » 70 % de todos os dispositivos são melhores. Isso significa que o tempo de resposta medido é pior que a média de todos os dispositivos testados (31.1 ms). | ||
| AnTuTu v6 - Total Score | |
| Huawei MediaPad M5 10.8 | |
| Média HiSilicon Kirin 960s (n=1) | |
| Acer Iconia Tab 10 A3-A50 | |
| Amazon Fire HD 10 2017 | |
| Lenovo Tab 4 10 Plus | |
| Huawei MediaPad M3 Lite | |
| PCMark for Android | |
| Work performance score | |
| Acer Iconia Tab 10 A3-A50 | |
| Lenovo Tab 4 10 Plus | |
| Huawei MediaPad M3 Lite | |
| Huawei MediaPad M5 10.8 | |
| Média HiSilicon Kirin 960s (n=1) | |
| Amazon Fire HD 10 2017 | |
| Work 2.0 performance score | |
| Huawei MediaPad M5 10.8 | |
| Média HiSilicon Kirin 960s (n=1) | |
| Acer Iconia Tab 10 A3-A50 | |
| Lenovo Tab 4 10 Plus | |
| Huawei MediaPad M3 Lite | |
| Amazon Fire HD 10 2017 | |
| Octane V2 - Total Score | |
| Média da turma Tablet (763 - 138481, n=73, últimos 2 anos) | |
| Apple iPad 6 2018 (Safari Mobile 11.3) | |
| Acer Iconia Tab 10 A3-A50 (Browser: Chrome Version 63) | |
| Amazon Fire HD 10 2017 (Amazon Silk 61.2) | |
| Huawei MediaPad M5 10.8 (Chrome 65) | |
| Média HiSilicon Kirin 960s (n=1) | |
| Lenovo Tab 4 10 Plus (Chrome 60) | |
| Huawei MediaPad M3 Lite (Chrome 58) | |
| WebXPRT 2015 - Overall | |
| Apple iPad 6 2018 (Safari Mobile 11.3) | |
| Amazon Fire HD 10 2017 (Amazon Silk 61.2) | |
| Huawei MediaPad M5 10.8 (Chrome 65) | |
| Média HiSilicon Kirin 960s (n=1) | |
| Lenovo Tab 4 10 Plus (Chrome 60) | |
| Huawei MediaPad M3 Lite (Chrome 58) | |
| JetStream 1.1 - 1.1 Total | |
| Apple iPad 6 2018 (Safari Mobile 11.3) | |
| Acer Iconia Tab 10 A3-A50 (Browser: Chrome Version 63) | |
| Amazon Fire HD 10 2017 (Amazon Silk 61.2) | |
| Huawei MediaPad M5 10.8 (Chrome 65) | |
| Média HiSilicon Kirin 960s (n=1) | |
| Lenovo Tab 4 10 Plus (Chrome 60) | |
| Huawei MediaPad M3 Lite (Chrome 58) | |
| Mozilla Kraken 1.1 - Total | |
| Huawei MediaPad M3 Lite (Chrome 58) | |
| Lenovo Tab 4 10 Plus (Chrome 60) | |
| Huawei MediaPad M5 10.8 (Chrome 65) | |
| Média HiSilicon Kirin 960s (n=1) | |
| Amazon Fire HD 10 2017 (Amazon Silk 61.2) | |
| Acer Iconia Tab 10 A3-A50 (Browser: Chrome Version 63) | |
| Média da turma Tablet (243 - 27101, n=67, últimos 2 anos) | |
| Apple iPad 6 2018 (Safari Mobile 11.3) | |
* ... menor é melhor
| Huawei MediaPad M5 10.8 | Acer Iconia Tab 10 A3-A50 | Lenovo Tab 4 10 Plus | Amazon Fire HD 10 2017 | Huawei MediaPad M3 Lite | Média 32 GB eMMC Flash | Média da turma Tablet | |
|---|---|---|---|---|---|---|---|
| AndroBench 3-5 | -41% | -19% | -34% | -41% | -25% | 663% | |
| Sequential Read 256KB (MB/s) | 247.8 | 173.7 -30% | 270.1 9% | 262.2 6% | 133.5 -46% | 242 ? -2% | 1987 ? 702% |
| Sequential Write 256KB (MB/s) | 126.8 | 92.4 -27% | 135.5 7% | 147.7 16% | 60.3 -52% | 100.5 ? -21% | 1580 ? 1146% |
| Random Read 4KB (MB/s) | 54.7 | 13.7 -75% | 37.3 -32% | 27.72 -49% | 38.8 -29% | 43.1 ? -21% | 268 ? 390% |
| Random Write 4KB (MB/s) | 60.8 | 8.77 -86% | 11.8 -81% | 9.37 -85% | 8.5 -86% | 22.3 ? -63% | 312 ? 413% |
| Sequential Read 256KB SDCard (MB/s) | 85.1 ? | 80.4 ? -6% | 83.9 -1% | 55.5 ? -35% | 78.7 -8% | 71.8 ? -16% | |
| Sequential Write 256KB SDCard (MB/s) | 73.8 ? | 56.8 ? -23% | 61.1 -17% | 30.14 ? -59% | 56.8 -23% | 52.9 ? -28% |
| Arena of Valor | |||
| Configurações | Valor | ||
| min | 60 fps | ||
| high HD | 60 fps | ||
| Battle Bay | |||
| Configurações | Valor | ||
| half resolution | 60 fps | ||
| full resolution | 60 fps | ||
| Shadow Fight 3 | |||
| Configurações | Valor | ||
| high | 30 fps | ||
| minimal | 30 fps | ||
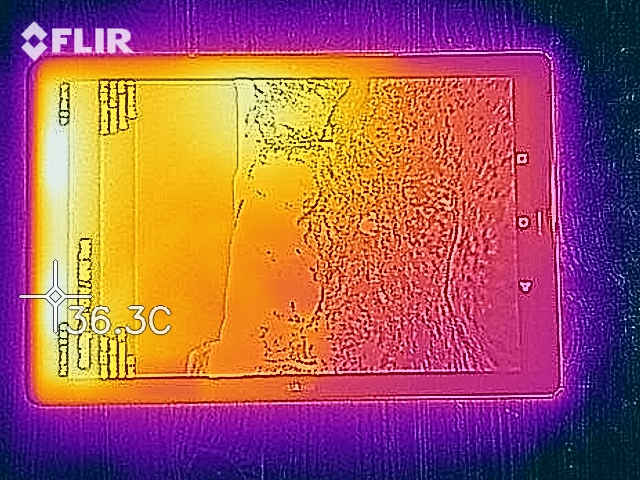
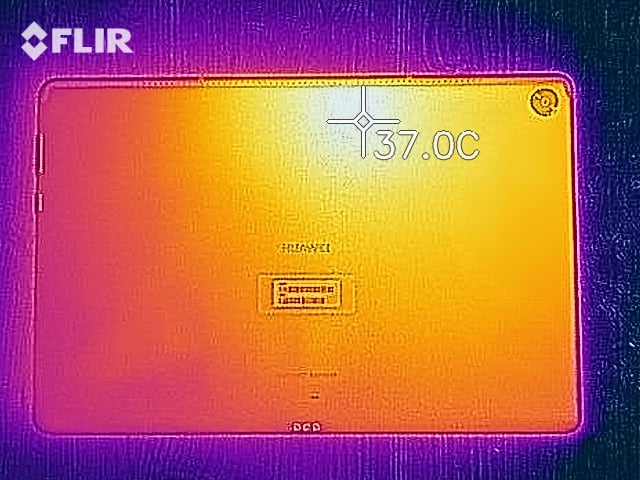
(+) A temperatura máxima no lado superior é 33.6 °C / 92 F, em comparação com a média de 33.6 °C / 92 F , variando de 20.7 a 53.2 °C para a classe Tablet.
(+) A parte inferior aquece até um máximo de 32.9 °C / 91 F, em comparação com a média de 33.2 °C / 92 F
(+) Em uso inativo, a temperatura média para o lado superior é 29.3 °C / 85 F, em comparação com a média do dispositivo de 30 °C / ### class_avg_f### F.
Huawei MediaPad M5 10.8 análise de áudio
(±) | o volume do alto-falante é médio, mas bom (###valor### dB)
Graves 100 - 315Hz
(±) | graves reduzidos - em média 11.9% menor que a mediana
(-) | graves não são lineares (16.4% delta para frequência anterior)
Médios 400 - 2.000 Hz
(+) | médios equilibrados - apenas 3.2% longe da mediana
(+) | médios são lineares (5.7% delta para frequência anterior)
Altos 2 - 16 kHz
(+) | agudos equilibrados - apenas 4.6% longe da mediana
(+) | os máximos são lineares (6.9% delta da frequência anterior)
Geral 100 - 16.000 Hz
(±) | a linearidade do som geral é média (15.9% diferença em relação à mediana)
Comparado com a mesma classe
» 35% de todos os dispositivos testados nesta classe foram melhores, 6% semelhantes, 59% piores
» O melhor teve um delta de 7%, a média foi 20%, o pior foi 129%
Comparado com todos os dispositivos testados
» 25% de todos os dispositivos testados foram melhores, 5% semelhantes, 70% piores
» O melhor teve um delta de 4%, a média foi 24%, o pior foi 134%
Apple iPad 6 2018 análise de áudio
(±) | o volume do alto-falante é médio, mas bom (###valor### dB)
Graves 100 - 315Hz
(±) | graves reduzidos - em média 11.2% menor que a mediana
(±) | a linearidade dos graves é média (11.9% delta para a frequência anterior)
Médios 400 - 2.000 Hz
(+) | médios equilibrados - apenas 1.3% longe da mediana
(+) | médios são lineares (5.9% delta para frequência anterior)
Altos 2 - 16 kHz
(+) | agudos equilibrados - apenas 3.3% longe da mediana
(±) | a linearidade dos máximos é média (11% delta para frequência anterior)
Geral 100 - 16.000 Hz
(+) | o som geral é linear (13.3% diferença em relação à mediana)
Comparado com a mesma classe
» 24% de todos os dispositivos testados nesta classe foram melhores, 5% semelhantes, 71% piores
» O melhor teve um delta de 7%, a média foi 20%, o pior foi 129%
Comparado com todos os dispositivos testados
» 14% de todos os dispositivos testados foram melhores, 3% semelhantes, 83% piores
» O melhor teve um delta de 4%, a média foi 24%, o pior foi 134%
| desligado | |
| Ocioso | |
| Carga |
|
Key:
min: | |
| Huawei MediaPad M5 10.8 7500 mAh | Apple iPad 6 2018 mAh | Acer Iconia Tab 10 A3-A50 6100 mAh | Lenovo Tab 4 10 Plus 7000 mAh | Amazon Fire HD 10 2017 6300 mAh | Huawei MediaPad M3 Lite 6600 mAh | |
|---|---|---|---|---|---|---|
| Power Consumption | -31% | -17% | 35% | 20% | 27% | |
| Idle Minimum * (Watt) | 2.01 | 2.2 -9% | 3.21 -60% | 1.23 39% | 1.55 23% | 1.45 28% |
| Idle Average * (Watt) | 5.4 | 7.8 -44% | 5.97 -11% | 3.92 27% | 4.17 23% | 4.44 18% |
| Idle Maximum * (Watt) | 5.44 | 7.9 -45% | 6.19 -14% | 4.03 26% | 4.25 22% | 4.61 15% |
| Load Average * (Watt) | 8.55 | 12.6 -47% | 9.72 -14% | 5 42% | 7.13 17% | 6.21 27% |
| Load Maximum * (Watt) | 11.53 | 12.8 -11% | 9.97 14% | 7.09 39% | 9.63 16% | 6.33 45% |
* ... menor é melhor
| Huawei MediaPad M5 10.8 7500 mAh | Apple iPad 6 2018 mAh | Acer Iconia Tab 10 A3-A50 6100 mAh | Lenovo Tab 4 10 Plus 7000 mAh | Amazon Fire HD 10 2017 6300 mAh | Huawei MediaPad M3 Lite 6600 mAh | |
|---|---|---|---|---|---|---|
| Duração da bateria | 2% | -32% | 16% | -6% | 25% | |
| Reader / Idle (h) | 22.4 | 12.3 -45% | 27.1 21% | 16 -29% | 22.4 0% | |
| H.264 (h) | 11.7 | 13.3 14% | 9.8 -16% | 13.9 19% | ||
| WiFi v1.3 (h) | 10.8 | 11.9 10% | 6.5 -40% | 10.8 0% | 9 -17% | 13.4 24% |
| Load (h) | 3.3 | 3.1 -6% | 2.9 -12% | 4.3 30% | 4.6 39% | 5.2 58% |
Pro
Contra
No início de nossa análise, nos perguntamos se o tablet da Huawei realmente valeria o preço. A resposta é: Há vários destaques que fazem com que o tablet não pareça tão caro. Além disso, a relação preço/desempenho também é muito boa.
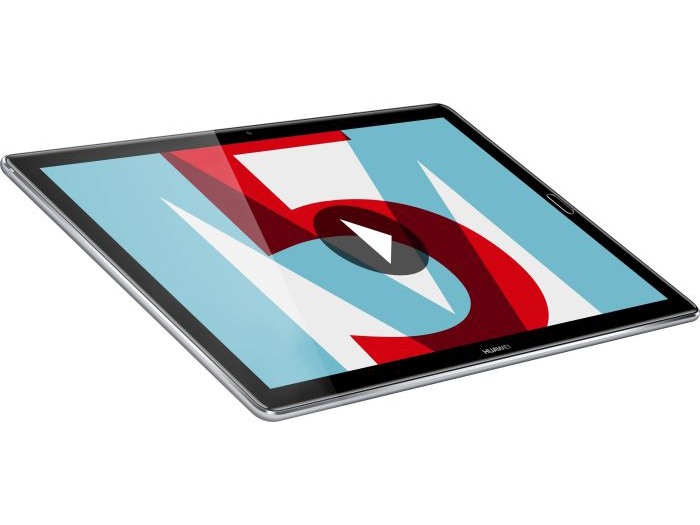
Esses destaques incluem: A tela de alta resolução com boa cobertura de espaço de cor, os alto-falantes poderosos e o ótimo desempenho. O fato de você poder fazer ligações telefônicas com o tablet também é um ponto positivo Bons dispositivos de entrada, software abrangente e carga rápida, completam o pacote.
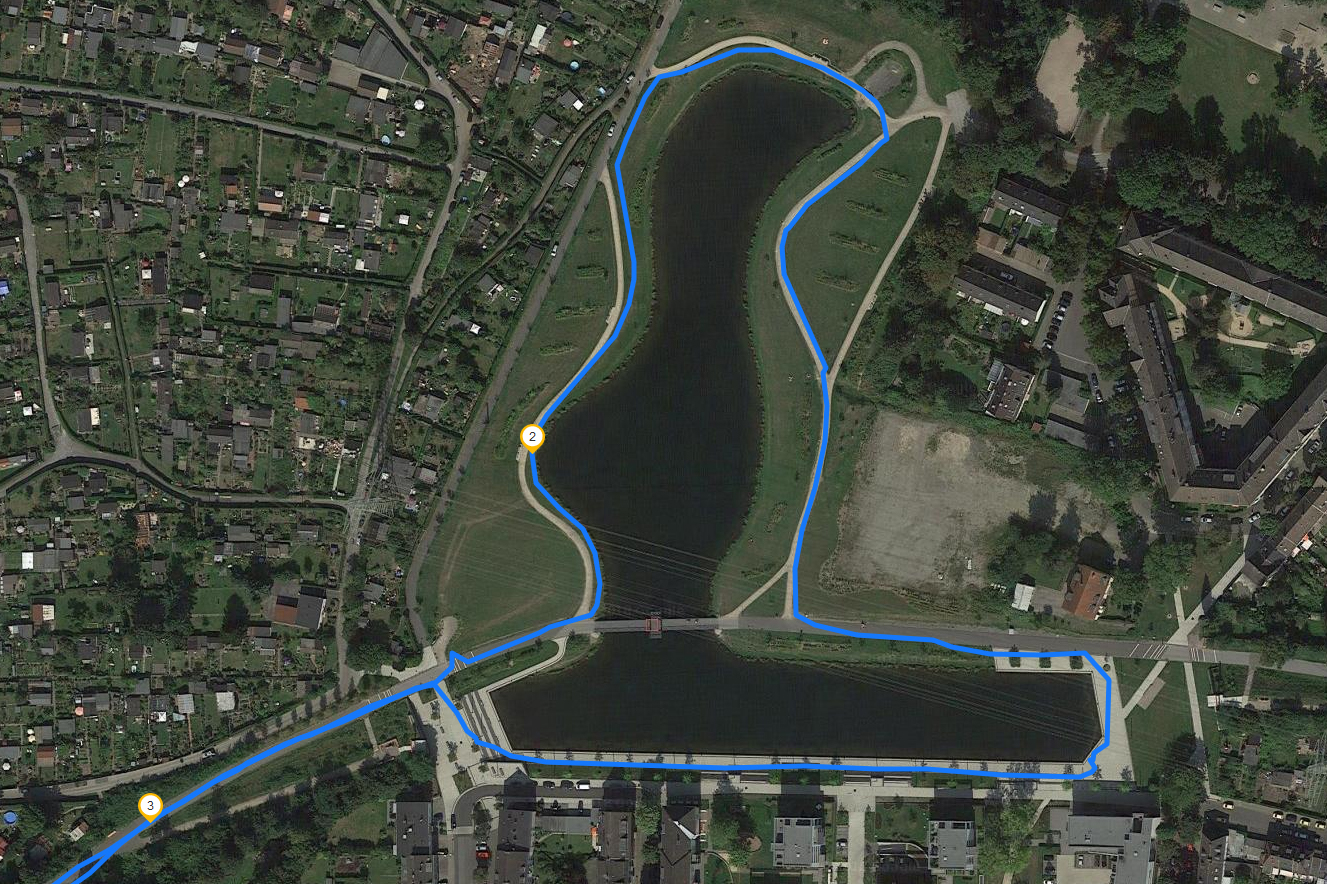
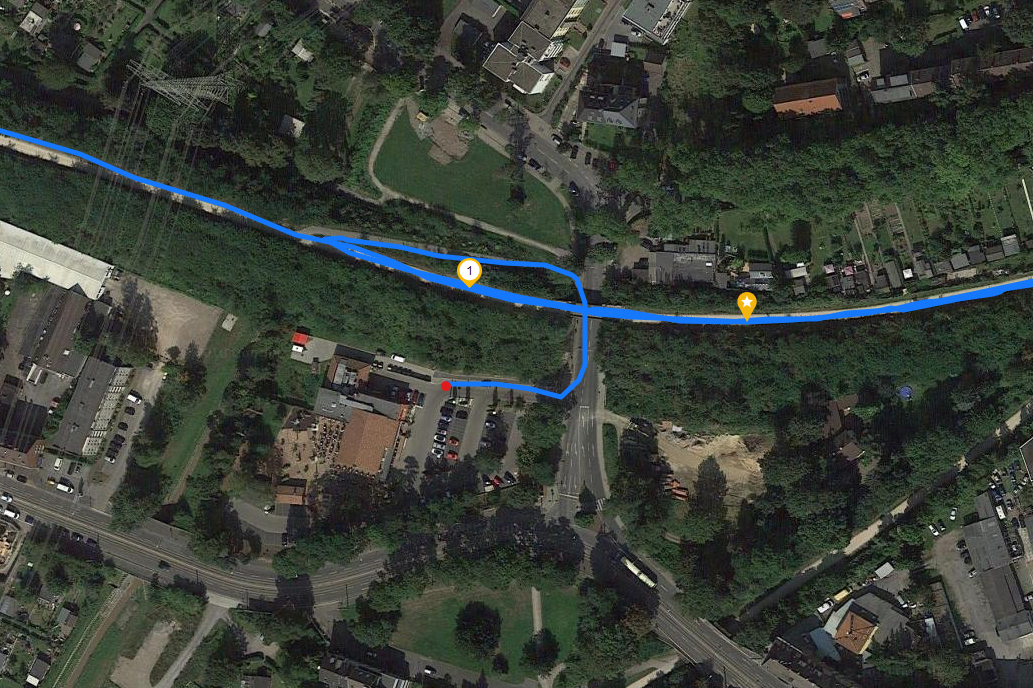
No decorrer de nossa análise, também surgiram alguns pontos negativos: Os patches de segurança não estão atualizados, há muitos recursos de bloatware pré-instalados, o Wi-Fi é realmente lento e o GPS leva muito tempo para adquirir uma localização. O alto desempenho também não está disponível o tempo todo e o tablet se afoga drasticamente de vez em quando. Além disso, o dispositivo poderia ter sido um pouco mais rígido. A falta de rigidez elimina a impressão geral de alto valor que o tablet deixa.
Um tablet caro que vale o dinheiro.
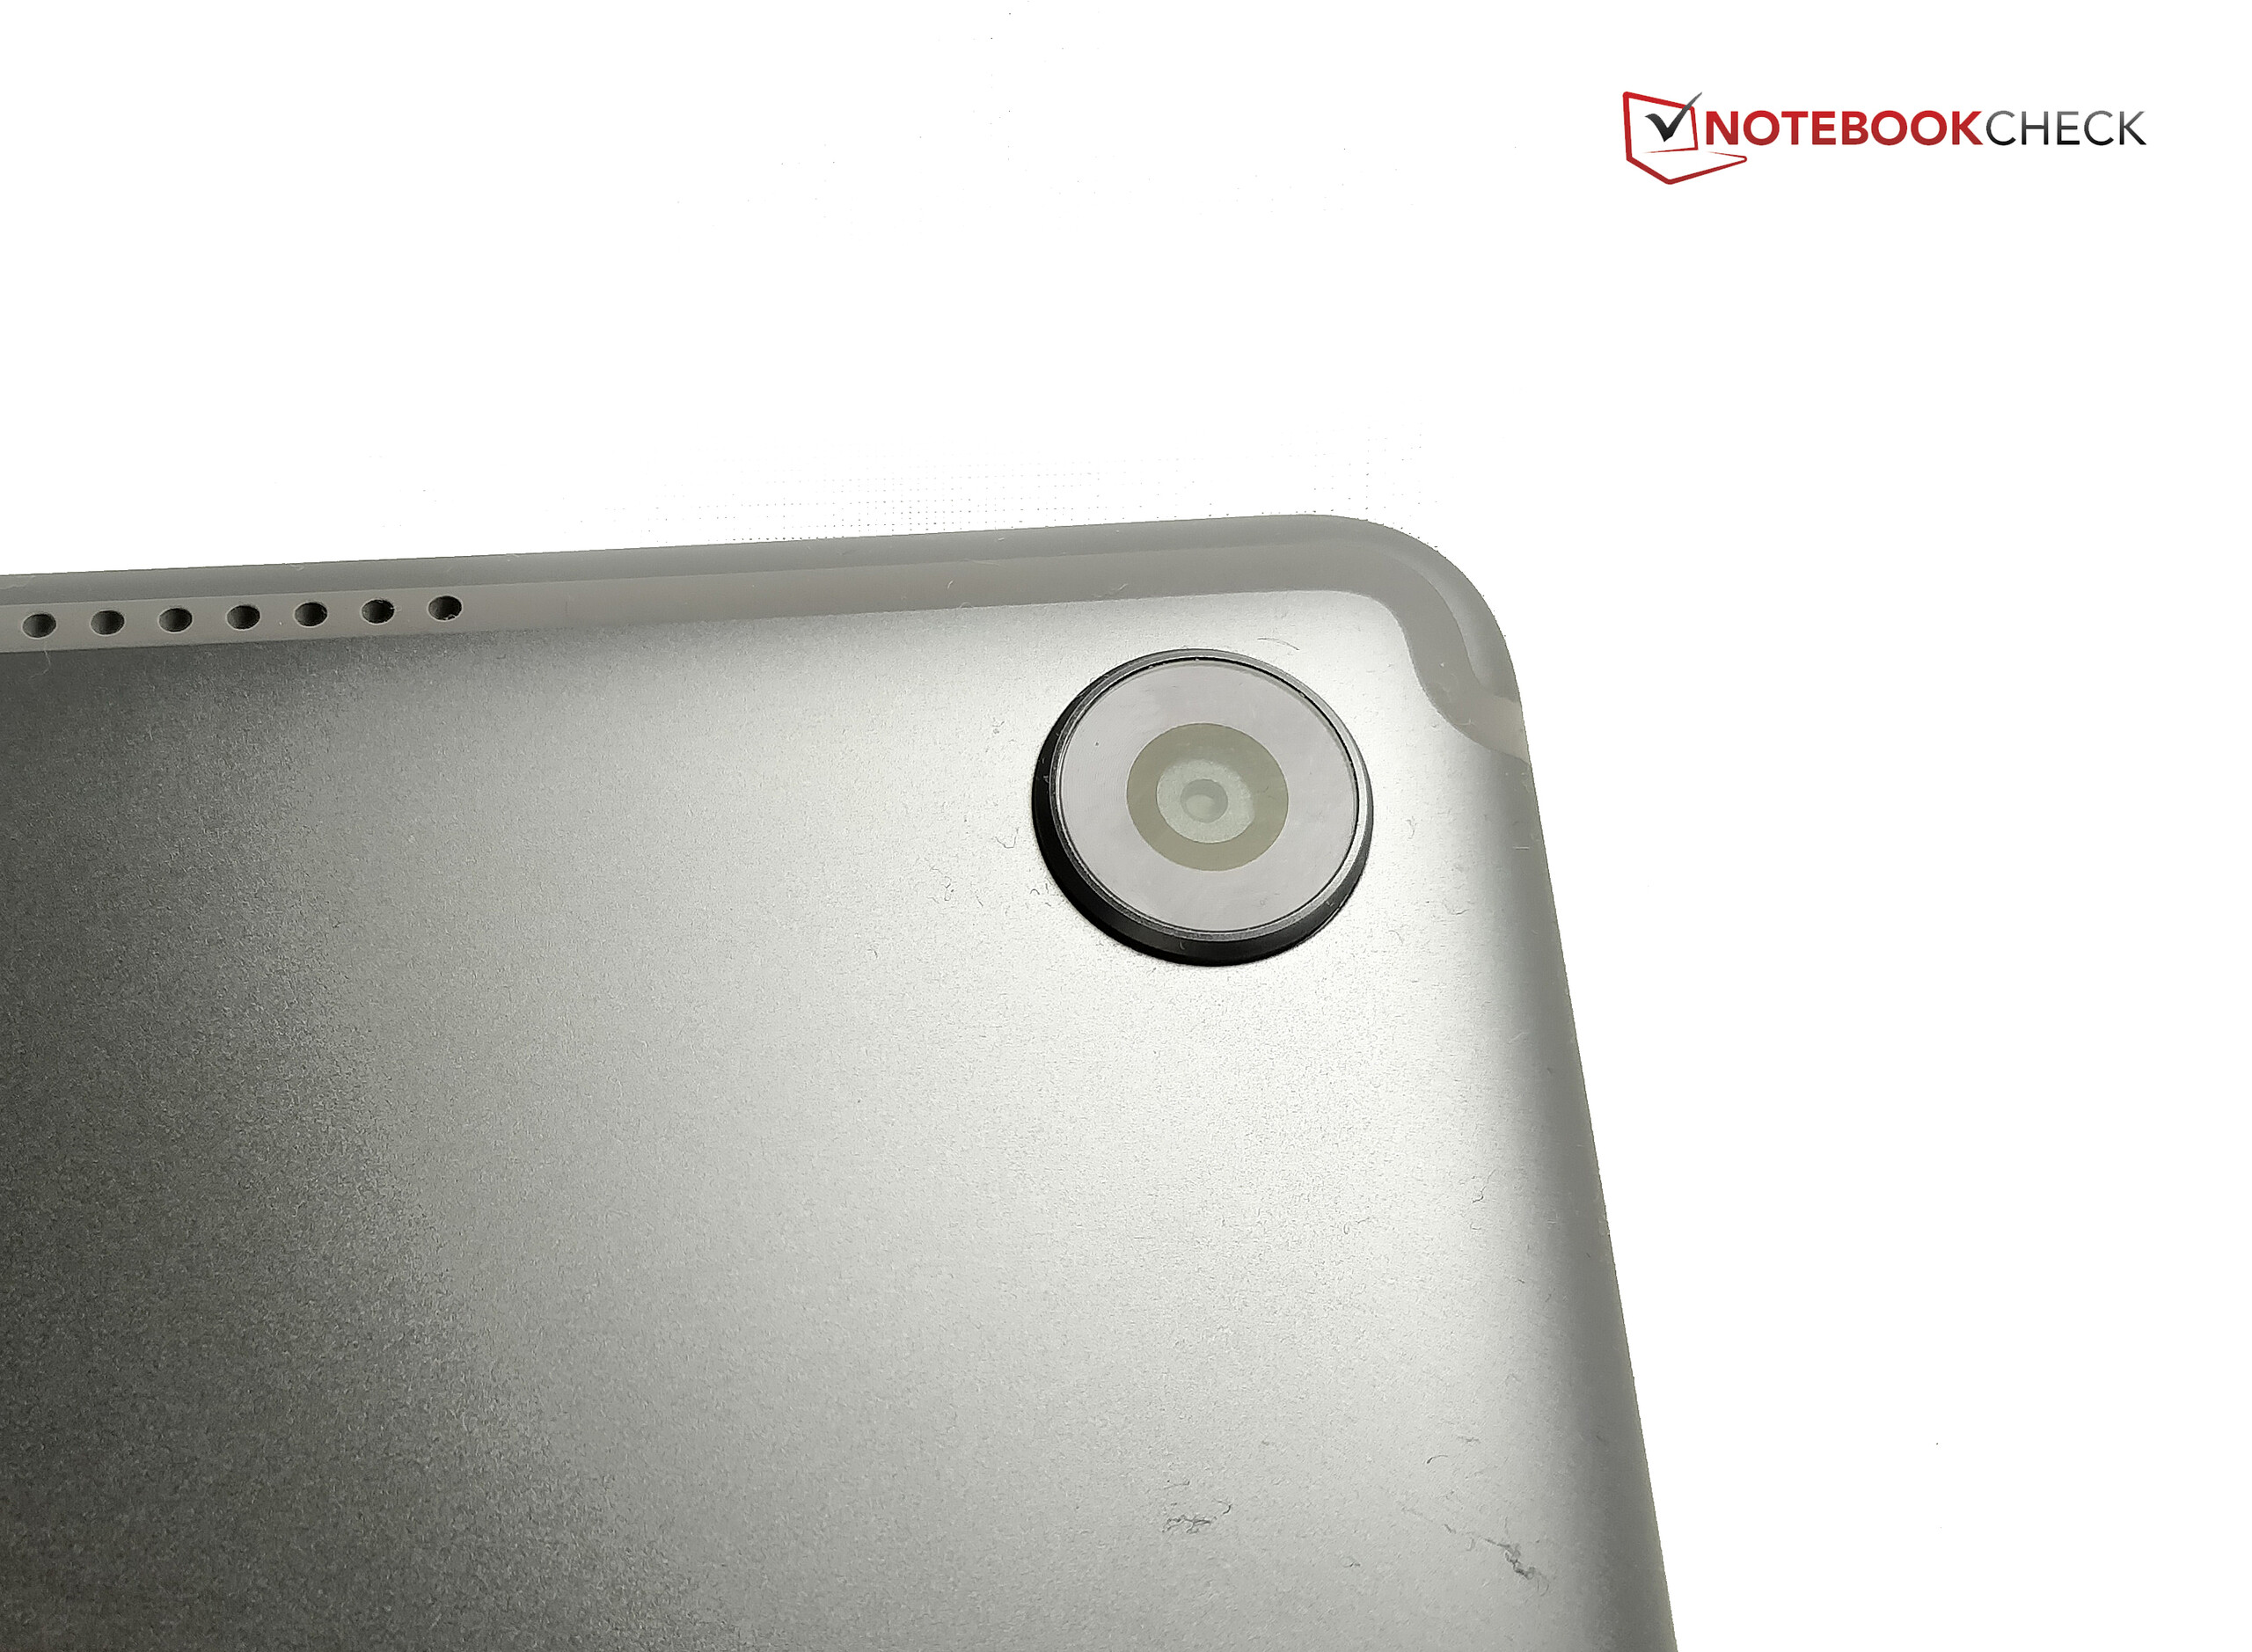
No entanto, devido a que as câmeras são muito boas para um tablet e os dispositivos de entrada funcionam de forma muito confiável e oferecem opções de personalização extensas, podemos facilmente dar ao Huawei MediaPad M5 10.8 uma recomendação clara. Aqueles que não precisam da funcionalidade LTE podem economizar dinheiro obtendo uma versão Wi-Fi simples.
Huawei MediaPad M5 10.8
- 09/16/2019 v7 (old)
Florian Wimmer