Breve Análise do Tablet Apple iPad 6 2018


| |||||||||||||||||||||||||
iluminação: 92 %
iluminação com acumulador: 530 cd/m²
Contraste: 869:1 (Preto: 0.61 cd/m²)
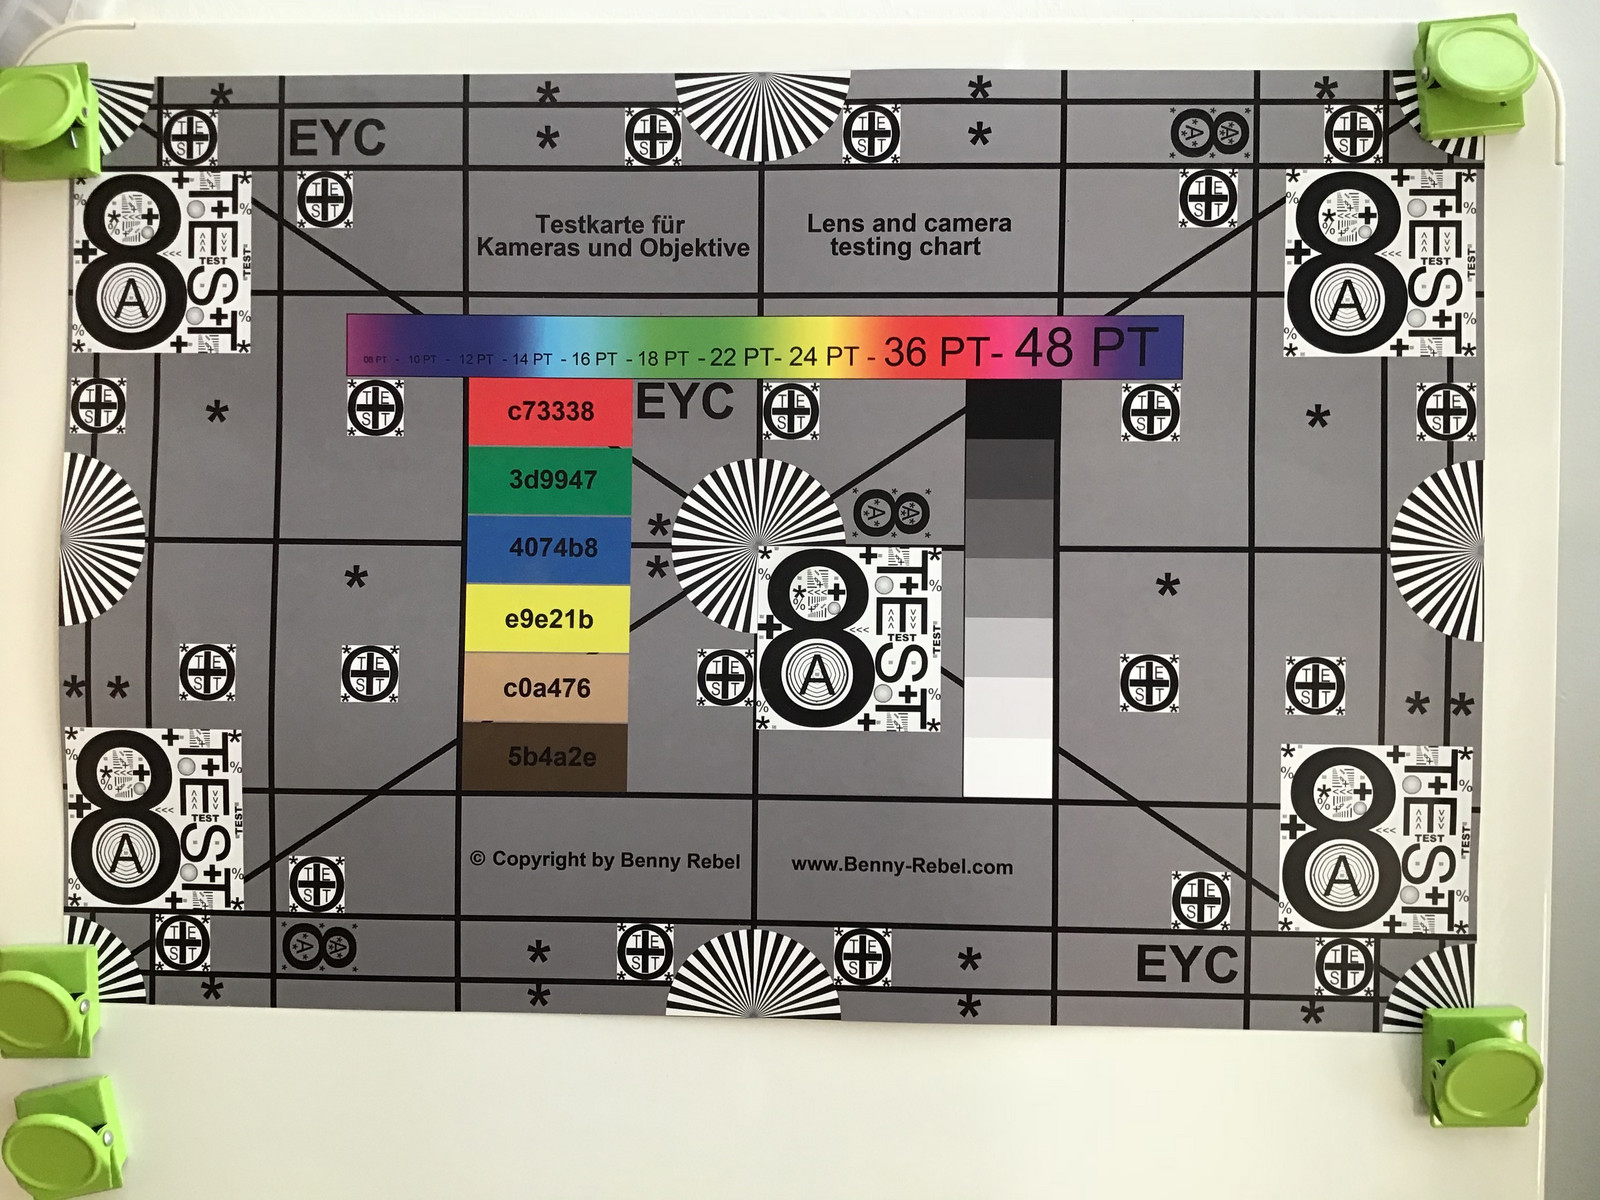
ΔE ColorChecker Calman: 1.2 | ∀{0.5-29.43 Ø4.71}
ΔE Greyscale Calman: 1 | ∀{0.09-98 Ø4.96}
97.5% sRGB (Calman 2D)
Gamma: 2.28
CCT: 6588 K
| Apple iPad 6 2018 IPS, 2048x1536, 9.7" | Apple iPad (2017) IPS, 2048x1536, 9.7" | Apple iPad Pro 10.5 2017 IPS, 2224x1668, 10.5" | Apple iPad Pro 12.9 2017 IPS, 2732x2048, 12.9" | Samsung Galaxy Tab S3 SM-T825 Super AMOLED, 2048x1526, 9.7" | Huawei MediaPad M5 10.8 IPS, 2560x1600, 10.8" | |
|---|---|---|---|---|---|---|
| Screen | -10% | -13% | 20% | -22% | -48% | |
| Brightness middle (cd/m²) | 530 | 514 -3% | 634 20% | 650 23% | 452 -15% | 382 -28% |
| Brightness (cd/m²) | 513 | 485 -5% | 625 22% | 614 20% | 468 -9% | 378 -26% |
| Brightness Distribution (%) | 92 | 88 -4% | 87 -5% | 90 -2% | 82 -11% | 92 0% |
| Black Level * (cd/m²) | 0.61 | 0.46 25% | 0.39 36% | 0.42 31% | 0.24 61% | |
| Contrast (:1) | 869 | 1117 29% | 1626 87% | 1548 78% | 1592 83% | |
| Colorchecker dE 2000 * | 1.2 | 1.4 -17% | 1.9 -58% | 1 17% | 1.8 -50% | 2.8 -133% |
| Colorchecker dE 2000 max. * | 3.2 | 2.9 9% | 3.9 -22% | 1.9 41% | 4 -25% | 6 -88% |
| Greyscale dE 2000 * | 1 | 2.1 -110% | 2.8 -180% | 1.5 -50% | 1.2 -20% | 3.5 -250% |
| Gamma | 2.28 96% | 2.22 99% | 2.26 97% | 2.25 98% | 2.11 104% | 2.33 94% |
| CCT | 6588 99% | 6647 98% | 7027 93% | 6734 97% | 6500 100% | 6903 94% |
| Color Space (Percent of AdobeRGB 1998) (%) | 82.32 | |||||
| Color Space (Percent of sRGB) (%) | 99.06 |
* ... menor é melhor
Cintilação da tela / PWM (modulação por largura de pulso)
| Tela tremeluzindo / PWM não detectado | 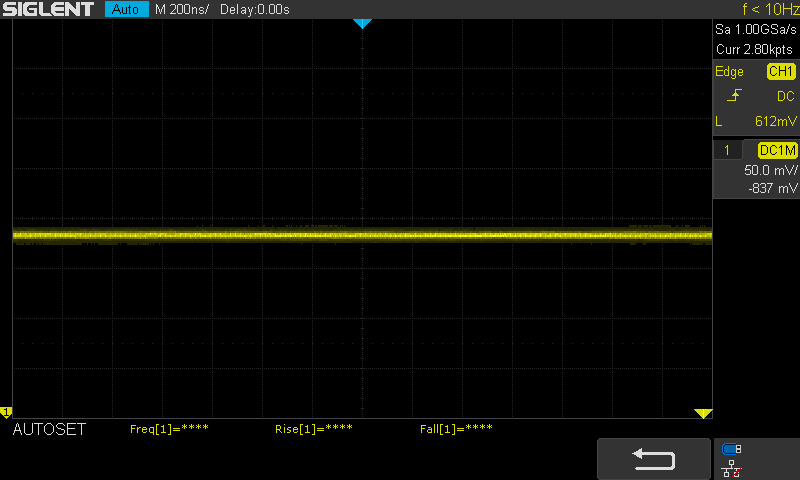 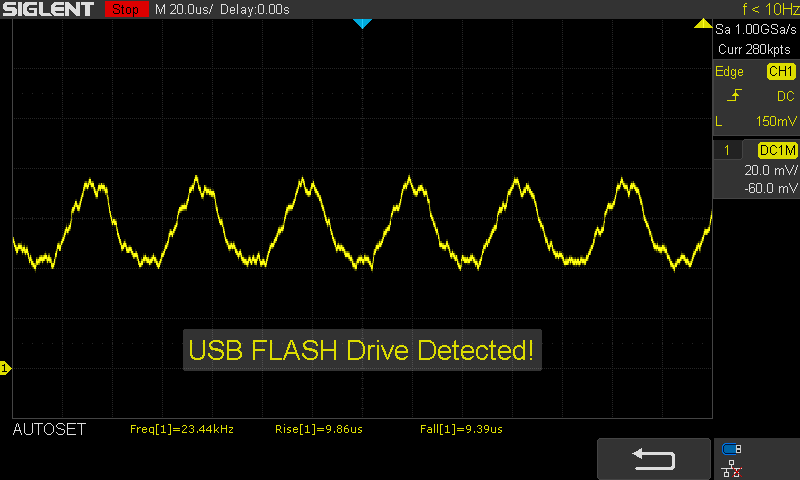 | ||
[pwm_comparison] Em comparação: 52 % de todos os dispositivos testados não usam PWM para escurecer a tela. Se PWM foi detectado, uma média de 7757 (mínimo: 5 - máximo: 343500) Hz foi medida. | |||
Exibir tempos de resposta
| ↔ Tempo de resposta preto para branco | ||
|---|---|---|
| 25.9 ms ... ascensão ↗ e queda ↘ combinadas | ↗ 14.4 ms ascensão | 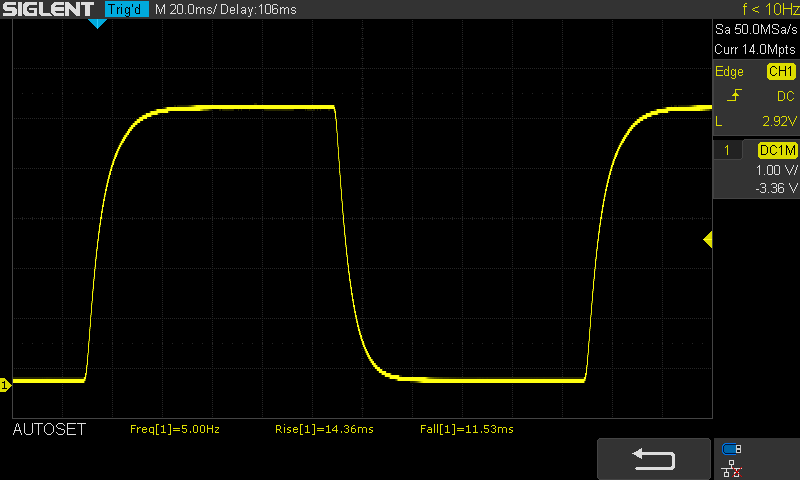 |
| ↘ 11.5 ms queda | ||
| A tela mostra taxas de resposta relativamente lentas em nossos testes e pode ser muito lenta para os jogadores. Em comparação, todos os dispositivos testados variam de 0.1 (mínimo) a 240 (máximo) ms. » 62 % de todos os dispositivos são melhores. Isso significa que o tempo de resposta medido é pior que a média de todos os dispositivos testados (19.8 ms). | ||
| ↔ Tempo de resposta 50% cinza a 80% cinza | ||
| 26.4 ms ... ascensão ↗ e queda ↘ combinadas | ↗ 17.7 ms ascensão | 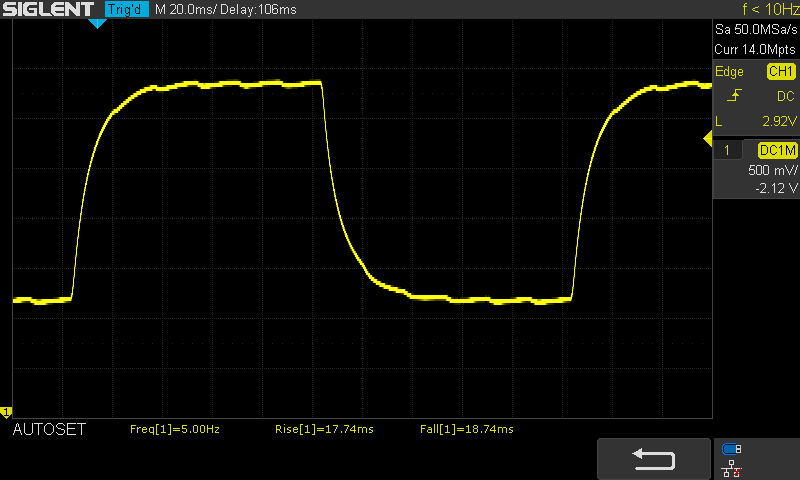 |
| ↘ 18.7 ms queda | ||
| A tela mostra taxas de resposta relativamente lentas em nossos testes e pode ser muito lenta para os jogadores. Em comparação, todos os dispositivos testados variam de 0.165 (mínimo) a 636 (máximo) ms. » 36 % de todos os dispositivos são melhores. Isso significa que o tempo de resposta medido é melhor que a média de todos os dispositivos testados (31 ms). | ||
| Basemark X 1.1 | |
| Medium Quality | |
| Samsung Galaxy Tab S3 SM-T825 | |
| Samsung Galaxy Tab S3 SM-T825 | |
| High Quality | |
| Samsung Galaxy Tab S3 SM-T825 | |
| Basemark ES 3.1 / Metal - offscreen Overall Score | |
| Média da turma Tablet (255 - 5784, n=6, últimos 2 anos) | |
| Apple iPad 6 2018 | |
| Apple iPhone 7 | |
| Apple iPhone 7 | |
| Média Apple A10 Fusion (1059 - 1693, n=5) | |
| Apple iPad (2017) | |
| Samsung Galaxy Tab S3 SM-T825 | |
| Octane V2 - Total Score | |
| Média da turma Tablet (1633 - 138481, n=71, últimos 2 anos) | |
| Apple iPhone X (IOS 11.1.2) | |
| Apple iPhone 8 Plus | |
| Apple iPhone 8 | |
| Apple iPad Pro 12.9 2017 (Safari Mobile 10) | |
| Apple iPad Pro 10.5 2017 (Safari Mobile 10) | |
| Apple iPad 6 2018 (Safari Mobile 11.3) | |
| Média Apple A10 Fusion (19783 - 27967, n=5) | |
| Apple iPhone 7 (Safari Mobile 10.0) | |
| Apple iPad (2017) | |
| Apple iPad Mini 4 (Safari iOS 9) | |
| Samsung Galaxy Tab S3 SM-T825 (Samsung Browser 5.2) | |
| Huawei MediaPad M5 10.8 (Chrome 65) | |
| Samsung Galaxy Tab Active 2 | |
| Huawei MediaPad M2 10 inch (Chrome 49) | |
| WebXPRT 2015 - Overall | |
| Apple iPhone 8 Plus | |
| Apple iPhone 8 | |
| Apple iPhone X (Safari Mobile 11.0) | |
| Apple iPad Pro 10.5 2017 (Safari Mobile 10) | |
| Apple iPad Pro 12.9 2017 (Safari Mobile 10) | |
| Apple iPad (2017) | |
| Apple iPhone 7 (Safari Mobile 10.0) | |
| Média Apple A10 Fusion (200 - 204, n=3) | |
| Apple iPad 6 2018 (Safari Mobile 11.3) | |
| Apple iPad Mini 4 (Safari iOS 9) | |
| Samsung Galaxy Tab S3 SM-T825 (Samsung Browser 5.2) | |
| Huawei MediaPad M5 10.8 (Chrome 65) | |
| Huawei MediaPad M2 10 inch (Chrome 49) | |
| Samsung Galaxy Tab Active 2 | |
| JetStream 1.1 - 1.1 Total | |
| Apple iPhone X (IOS 11.1.1) | |
| Apple iPhone 8 Plus | |
| Apple iPhone 8 | |
| Apple iPad Pro 12.9 2017 (Safari Mobile 10) | |
| Apple iPad Pro 10.5 2017 (Safari Mobile 10) | |
| Média Apple A10 Fusion (165.9 - 172.6, n=4) | |
| Apple iPad 6 2018 (Safari Mobile 11.3) | |
| Apple iPhone 7 (Safari Mobile 10.0) | |
| Apple iPad (2017) | |
| Samsung Galaxy Tab S3 SM-T825 (Samsung Browser 5.2) | |
| Huawei MediaPad M5 10.8 (Chrome 65) | |
| Huawei MediaPad M2 10 inch (Chrome 49) | |
| Samsung Galaxy Tab Active 2 | |
| Mozilla Kraken 1.1 - Total | |
| Huawei MediaPad M2 10 inch (Chrome 49) | |
| Samsung Galaxy Tab Active 2 | |
| Huawei MediaPad M5 10.8 (Chrome 65) | |
| Apple iPad Mini 4 (Safari iOS 9) | |
| Samsung Galaxy Tab S3 SM-T825 (Samsung Browser 5.2) | |
| Média da turma Tablet (243 - 16233, n=65, últimos 2 anos) | |
| Apple iPad (2017) | |
| Média Apple A10 Fusion (1026 - 1531, n=5) | |
| Apple iPhone 7 (Safari Mobile 10.0) | |
| Apple iPad 6 2018 (Safari Mobile 11.3) | |
| Apple iPad Pro 10.5 2017 (Safari Mobile 10) | |
| Apple iPad Pro 12.9 2017 (Safari Mobile 10) | |
| Apple iPhone 8 | |
| Apple iPhone 8 Plus | |
| Apple iPhone X (IOS 11.1.2) | |
* ... menor é melhor
(+) A temperatura máxima no lado superior é 38 °C / 100 F, em comparação com a média de 33.7 °C / 93 F , variando de 20.7 a 53.2 °C para a classe Tablet.
(+) A parte inferior aquece até um máximo de 39 °C / 102 F, em comparação com a média de 33.2 °C / 92 F
Apple iPad 6 2018 análise de áudio
(±) | o volume do alto-falante é médio, mas bom (###valor### dB)
Graves 100 - 315Hz
(±) | graves reduzidos - em média 11.2% menor que a mediana
(±) | a linearidade dos graves é média (11.9% delta para a frequência anterior)
Médios 400 - 2.000 Hz
(+) | médios equilibrados - apenas 1.3% longe da mediana
(+) | médios são lineares (5.9% delta para frequência anterior)
Altos 2 - 16 kHz
(+) | agudos equilibrados - apenas 3.3% longe da mediana
(±) | a linearidade dos máximos é média (11% delta para frequência anterior)
Geral 100 - 16.000 Hz
(+) | o som geral é linear (13.3% diferença em relação à mediana)
Comparado com a mesma classe
» 24% de todos os dispositivos testados nesta classe foram melhores, 4% semelhantes, 71% piores
» O melhor teve um delta de 7%, a média foi 20%, o pior foi 129%
Comparado com todos os dispositivos testados
» 14% de todos os dispositivos testados foram melhores, 3% semelhantes, 83% piores
» O melhor teve um delta de 4%, a média foi 23%, o pior foi 134%
Apple iPad Pro 10.5 2017 análise de áudio
(+) | os alto-falantes podem tocar relativamente alto (###valor### dB)
Graves 100 - 315Hz
(±) | graves reduzidos - em média 10.4% menor que a mediana
(±) | a linearidade dos graves é média (12.3% delta para a frequência anterior)
Médios 400 - 2.000 Hz
(±) | médios mais altos - em média 5.8% maior que a mediana
(+) | médios são lineares (4.3% delta para frequência anterior)
Altos 2 - 16 kHz
(±) | máximos mais altos - em média 6.6% maior que a mediana
(±) | a linearidade dos máximos é média (7% delta para frequência anterior)
Geral 100 - 16.000 Hz
(±) | a linearidade do som geral é média (16.1% diferença em relação à mediana)
Comparado com a mesma classe
» 37% de todos os dispositivos testados nesta classe foram melhores, 6% semelhantes, 57% piores
» O melhor teve um delta de 7%, a média foi 20%, o pior foi 129%
Comparado com todos os dispositivos testados
» 26% de todos os dispositivos testados foram melhores, 5% semelhantes, 69% piores
» O melhor teve um delta de 4%, a média foi 23%, o pior foi 134%
Apple iPad Pro 12.9 2017 análise de áudio
(±) | o volume do alto-falante é médio, mas bom (###valor### dB)
Graves 100 - 315Hz
(±) | graves reduzidos - em média 5.7% menor que a mediana
(±) | a linearidade dos graves é média (10.7% delta para a frequência anterior)
Médios 400 - 2.000 Hz
(+) | médios equilibrados - apenas 1.6% longe da mediana
(+) | médios são lineares (5.1% delta para frequência anterior)
Altos 2 - 16 kHz
(+) | agudos equilibrados - apenas 4.7% longe da mediana
(+) | os máximos são lineares (5.9% delta da frequência anterior)
Geral 100 - 16.000 Hz
(+) | o som geral é linear (8.9% diferença em relação à mediana)
Comparado com a mesma classe
» 2% de todos os dispositivos testados nesta classe foram melhores, 2% semelhantes, 96% piores
» O melhor teve um delta de 7%, a média foi 20%, o pior foi 129%
Comparado com todos os dispositivos testados
» 3% de todos os dispositivos testados foram melhores, 1% semelhantes, 97% piores
» O melhor teve um delta de 4%, a média foi 23%, o pior foi 134%
Apple iPad (2017) análise de áudio
(+) | os alto-falantes podem tocar relativamente alto (###valor### dB)
Graves 100 - 315Hz
(-) | quase nenhum baixo - em média 17.5% menor que a mediana
(±) | a linearidade dos graves é média (10.8% delta para a frequência anterior)
Médios 400 - 2.000 Hz
(+) | médios equilibrados - apenas 2.8% longe da mediana
(+) | médios são lineares (5.3% delta para frequência anterior)
Altos 2 - 16 kHz
(±) | máximos mais altos - em média 8.5% maior que a mediana
(+) | os máximos são lineares (3.9% delta da frequência anterior)
Geral 100 - 16.000 Hz
(±) | a linearidade do som geral é média (19% diferença em relação à mediana)
Comparado com a mesma classe
» 52% de todos os dispositivos testados nesta classe foram melhores, 5% semelhantes, 43% piores
» O melhor teve um delta de 7%, a média foi 20%, o pior foi 129%
Comparado com todos os dispositivos testados
» 45% de todos os dispositivos testados foram melhores, 7% semelhantes, 47% piores
» O melhor teve um delta de 4%, a média foi 23%, o pior foi 134%
Huawei MediaPad M2 10 inch análise de áudio
(+) | os alto-falantes podem tocar relativamente alto (###valor### dB)
Graves 100 - 315Hz
(-) | quase nenhum baixo - em média 25.1% menor que a mediana
(±) | a linearidade dos graves é média (11.9% delta para a frequência anterior)
Médios 400 - 2.000 Hz
(+) | médios equilibrados - apenas 1.6% longe da mediana
(+) | médios são lineares (3.1% delta para frequência anterior)
Altos 2 - 16 kHz
(+) | agudos equilibrados - apenas 3.8% longe da mediana
(+) | os máximos são lineares (3.1% delta da frequência anterior)
Geral 100 - 16.000 Hz
(±) | a linearidade do som geral é média (17.7% diferença em relação à mediana)
Comparado com a mesma classe
» 44% de todos os dispositivos testados nesta classe foram melhores, 6% semelhantes, 50% piores
» O melhor teve um delta de 7%, a média foi 20%, o pior foi 129%
Comparado com todos os dispositivos testados
» 35% de todos os dispositivos testados foram melhores, 8% semelhantes, 57% piores
» O melhor teve um delta de 4%, a média foi 23%, o pior foi 134%
| desligado | |
| Ocioso | |
| Carga |
|
Key:
min: | |
| Apple iPad 6 2018 mAh | Apple iPad Pro 10.5 2017 8134 mAh | Apple iPad Pro 12.9 2017 10875 mAh | Apple iPad (2017) 8.827 mAh | Apple iPhone 8 Plus 2691 mAh | Apple iPhone X 2716 mAh | Apple iPhone 8 1821 mAh | Apple iPad Mini 4 mAh | Samsung Galaxy Tab S3 SM-T825 6000 mAh | Huawei MediaPad M5 10.8 7500 mAh | Samsung Galaxy Tab Active 2 4450 mAh | Apple iPhone 7 1960 mAh | Huawei MediaPad M2 10 inch 6660 mAh | Média da turma Tablet | |
|---|---|---|---|---|---|---|---|---|---|---|---|---|---|---|
| Power Consumption | 26% | 10% | 9% | 61% | 63% | 70% | 52% | 40% | 23% | 61% | 74% | 41% | 22% | |
| Idle Minimum * (Watt) | 2.2 | 1.44 35% | 1.55 30% | 2.06 6% | 0.72 67% | 1.03 53% | 0.54 75% | 0.8 64% | 2.08 5% | 2.01 9% | 0.89 60% | 0.54 75% | 1.6 27% | 2.21 ? -0% |
| Idle Average * (Watt) | 7.8 | 6.12 22% | 8.58 -10% | 7.42 5% | 2.45 69% | 2.4 69% | 1.63 79% | 3.6 54% | 3.5 55% | 5.4 31% | 3.13 60% | 1.51 81% | 4.13 47% | 4.01 ? 49% |
| Idle Maximum * (Watt) | 7.9 | 6.14 22% | 8.59 -9% | 7.47 5% | 2.52 68% | 2.6 67% | 1.67 79% | 3.9 51% | 3.58 55% | 5.44 31% | 3.36 57% | 1.54 81% | 4.22 47% | 4.4 ? 44% |
| Load Average * (Watt) | 12.6 | 8.55 32% | 10.09 20% | 9.45 25% | 3.84 70% | 2.96 77% | 2.74 78% | 6.1 52% | 6.97 45% | 8.55 32% | 3.93 69% | 3.75 70% | 6.57 48% | 8.92 ? 29% |
| Load Maximum * (Watt) | 12.8 | 10.62 17% | 10.61 17% | 12.31 4% | 9.02 30% | 6.6 48% | 7.78 39% | 8 37% | 7.4 42% | 11.53 10% | 5.45 57% | 5.01 61% | 8.32 35% | 14.4 ? -13% |
* ... menor é melhor
| Apple iPad 6 2018 mAh | Apple iPad (2017) 8.827 mAh | Apple iPad Pro 10.5 2017 8134 mAh | Apple iPad Pro 12.9 2017 10875 mAh | Samsung Galaxy Tab S3 SM-T825 6000 mAh | Samsung Galaxy Tab Active 2 4450 mAh | Huawei MediaPad M2 10 inch 6660 mAh | |
|---|---|---|---|---|---|---|---|
| Duração da bateria | 15% | 2% | 21% | 55% | 69% | 20% | |
| WiFi v1.3 (h) | 11.9 | 12.7 7% | 11.6 -3% | 12.3 3% | 12.7 7% | 14.9 25% | 11.6 -3% |
| Load (h) | 3.1 | 3.8 23% | 3.3 6% | 4.3 39% | 6.3 103% | 6.6 113% | 4.4 42% |
| Reader / Idle (h) | 24.9 | 33.9 | 48.7 | 31.7 | 22.6 | 16.5 | |
| H.264 (h) | 14.1 | 10.5 | 11.3 | 9.2 | 8.2 | 10 |
Pro
Contra
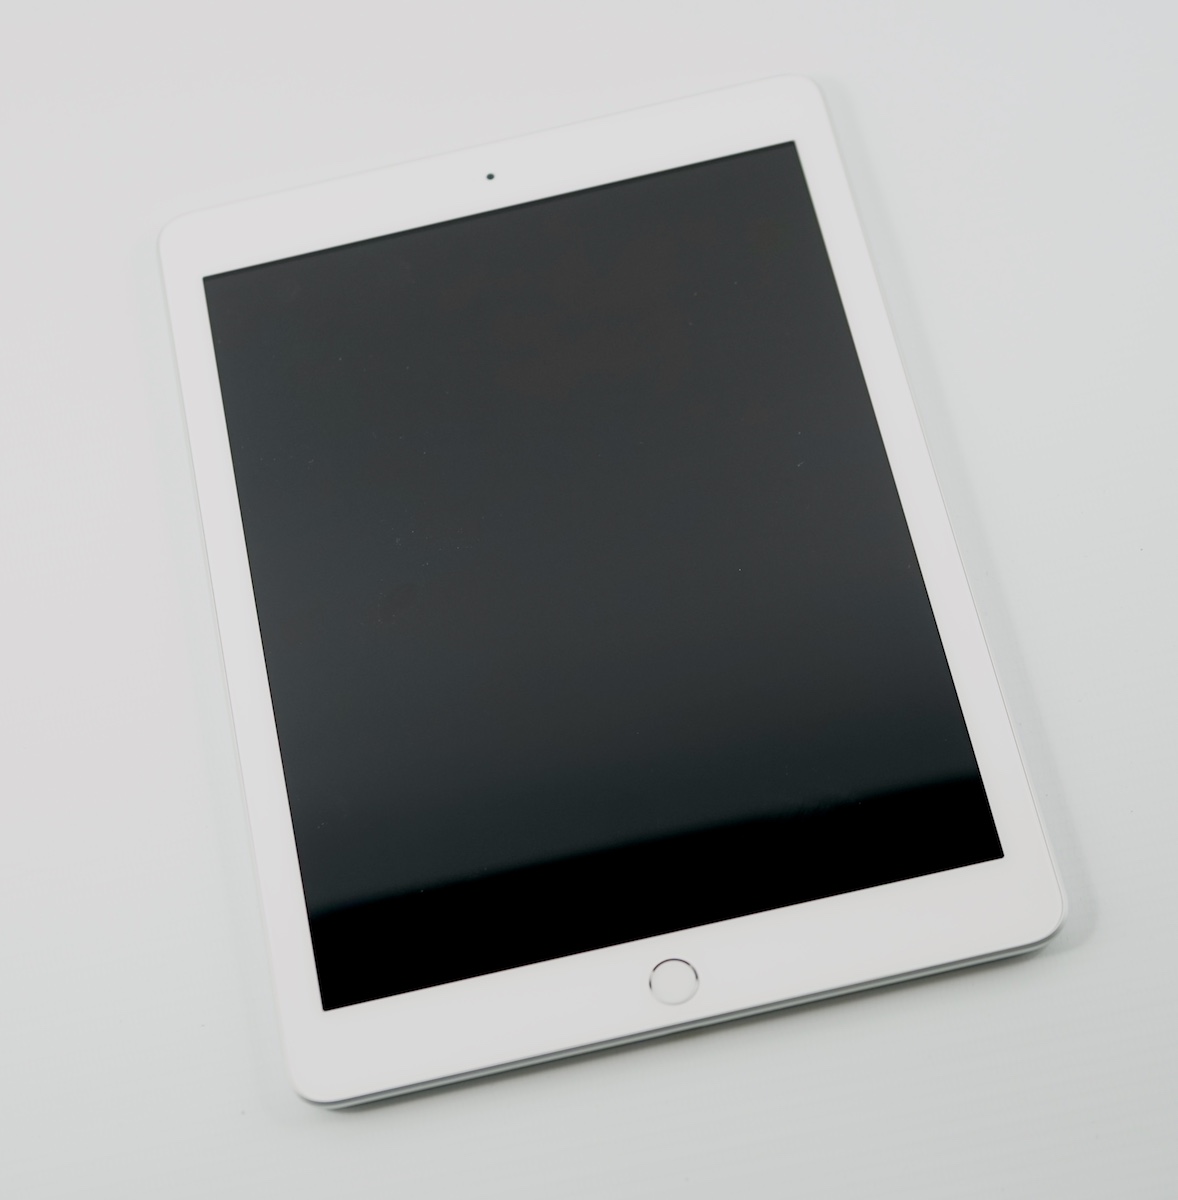
O iPad 2018 (6ª geração) é a pequena atualização que a folha de especificações promete. O SoC mais rápido, mas ainda desatualizado e o suporte para o Apple Pencil são os novos recursos mais importantes. A duração da bateria e o consumo de energia sofreram devido a essas atualizações, mas ainda são bons, em geral.
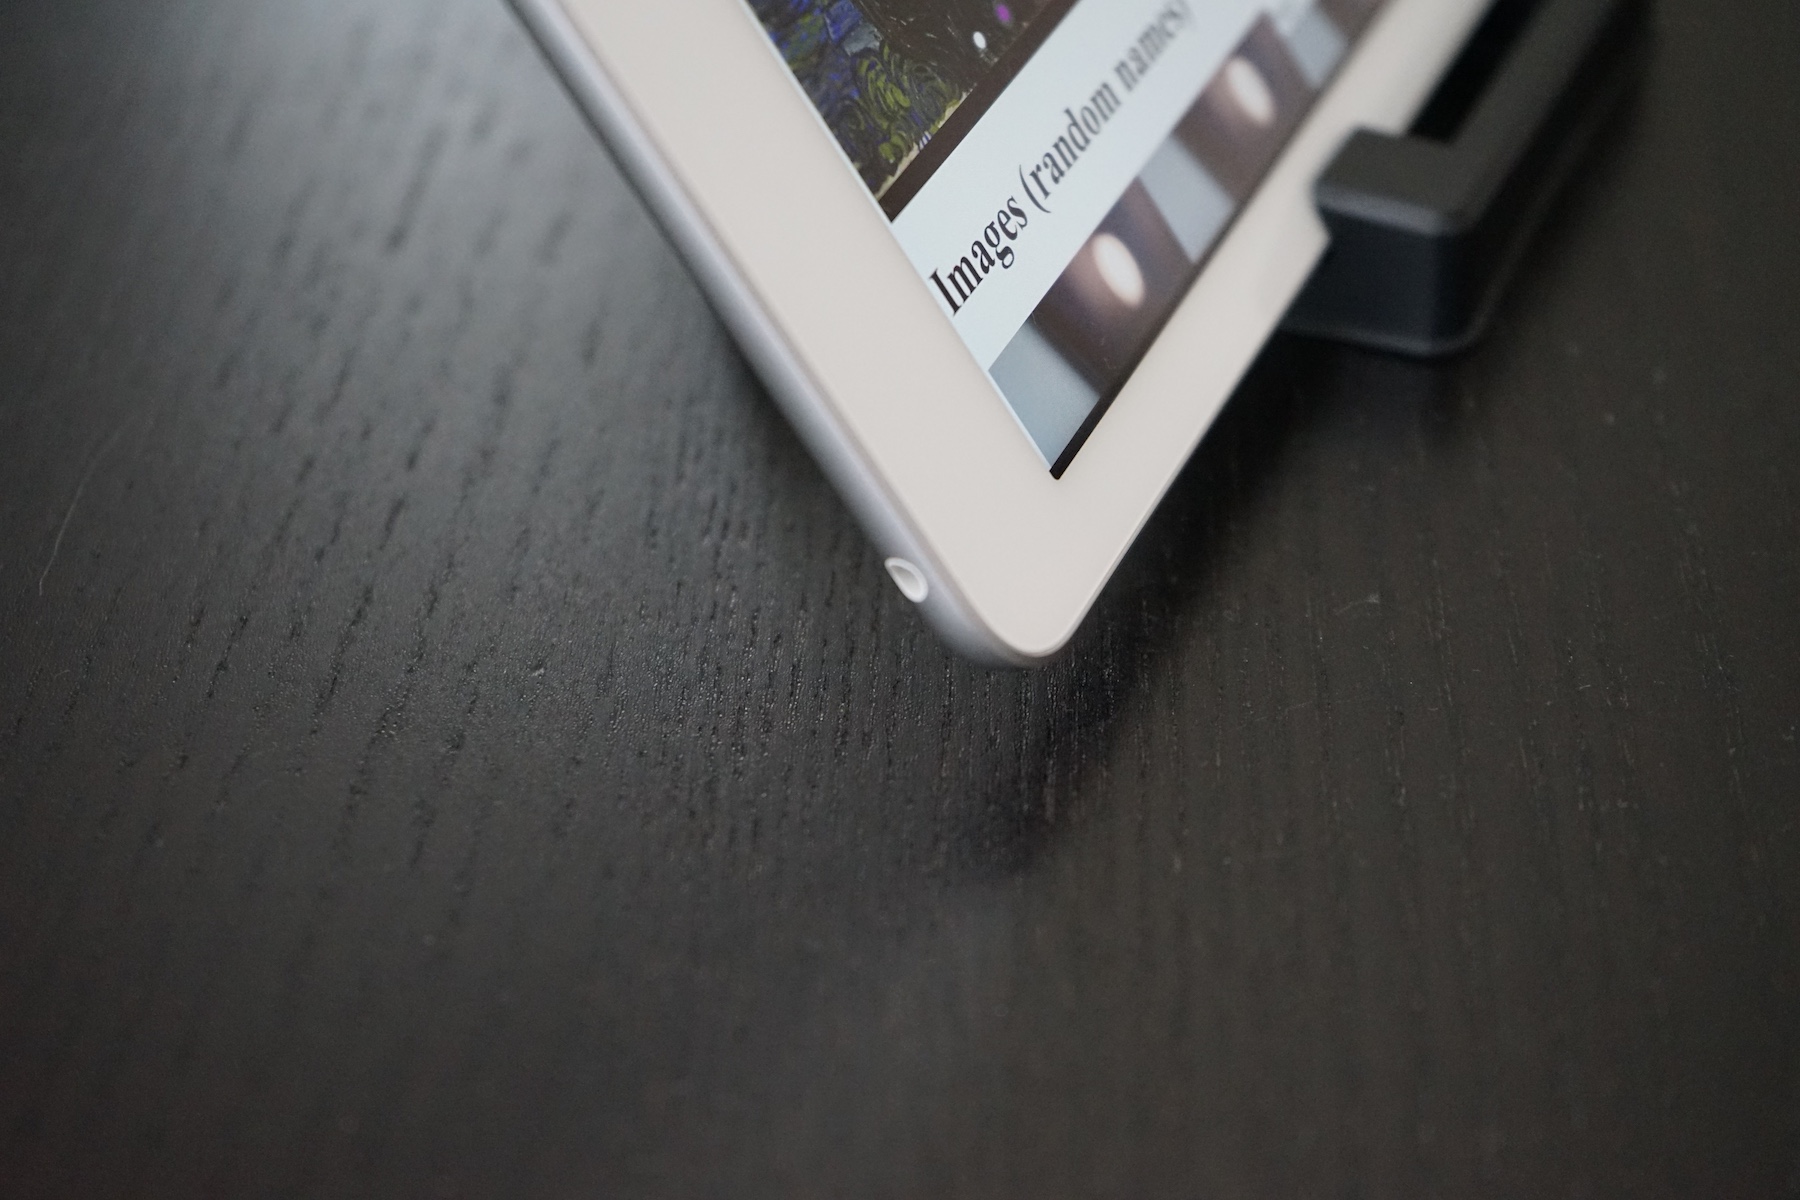
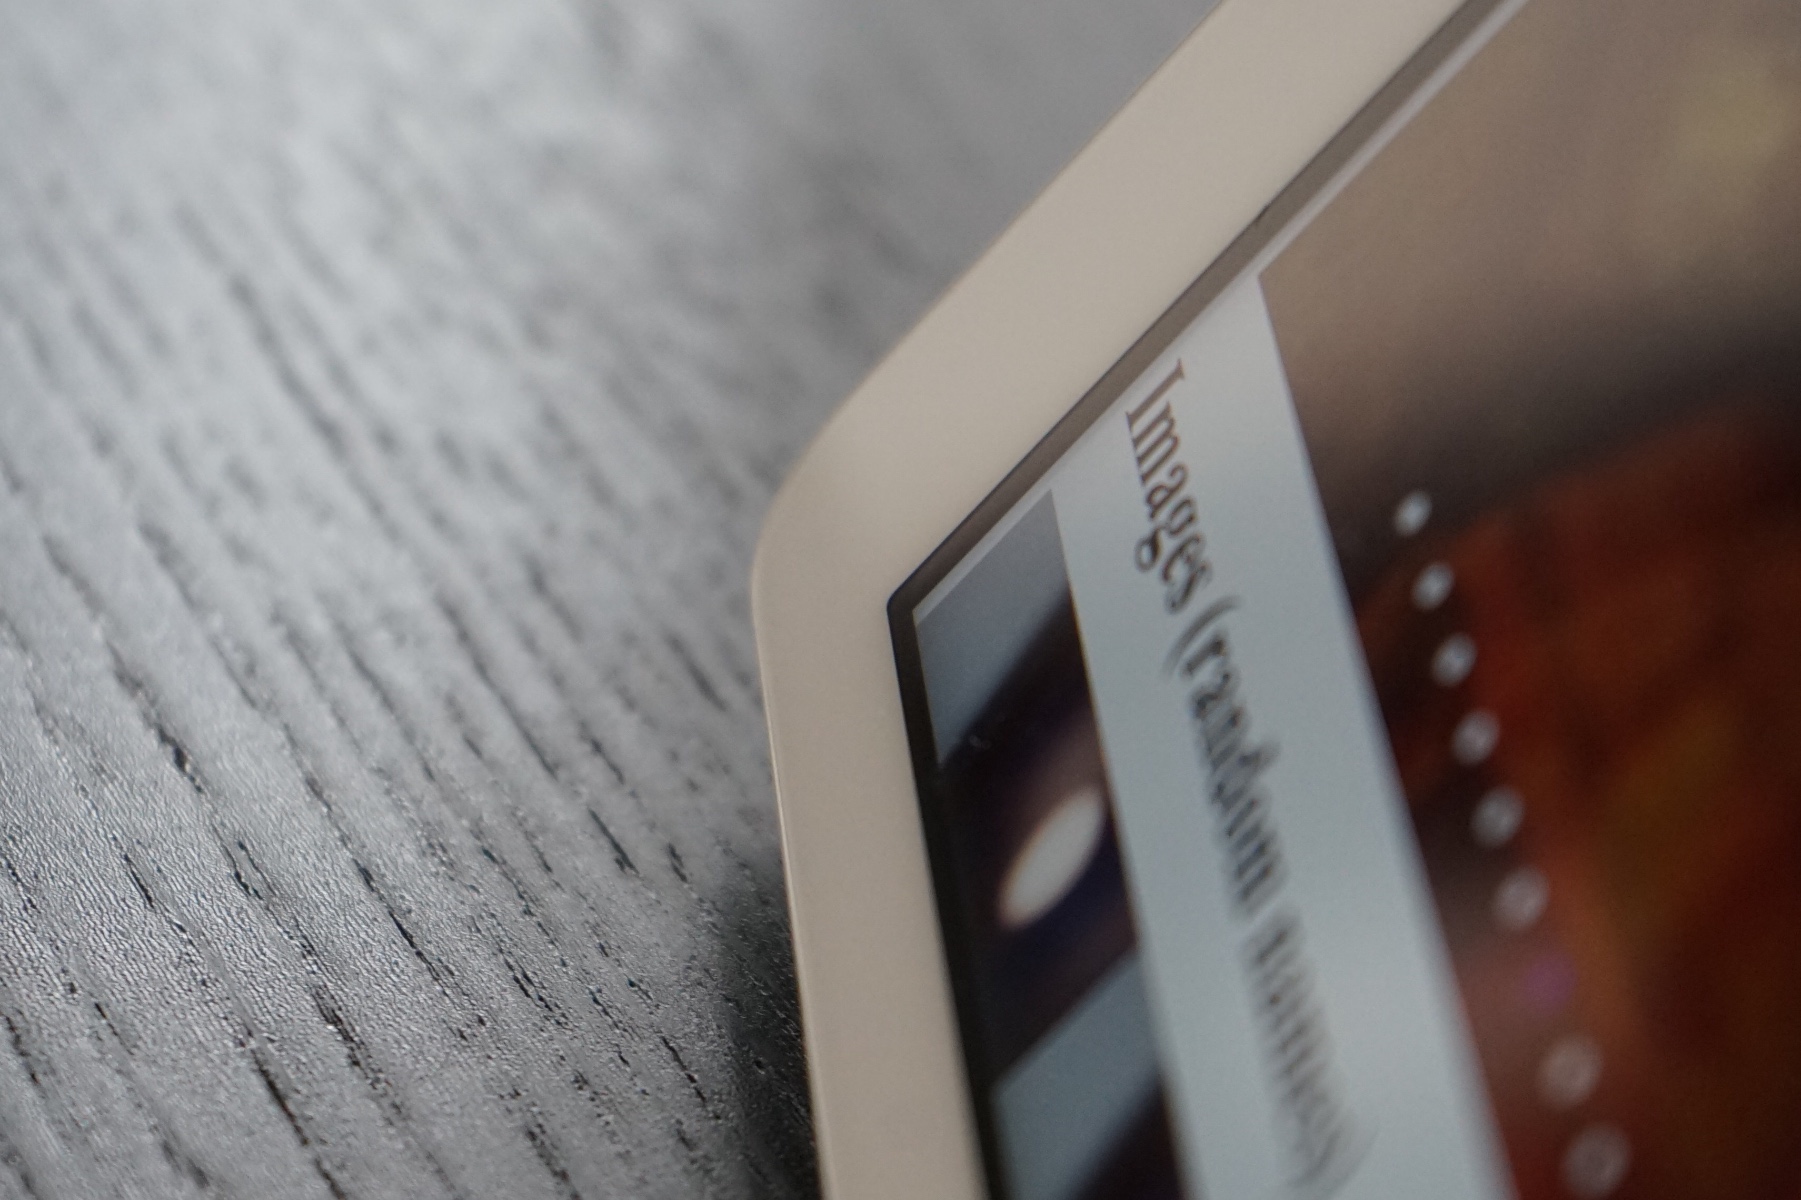
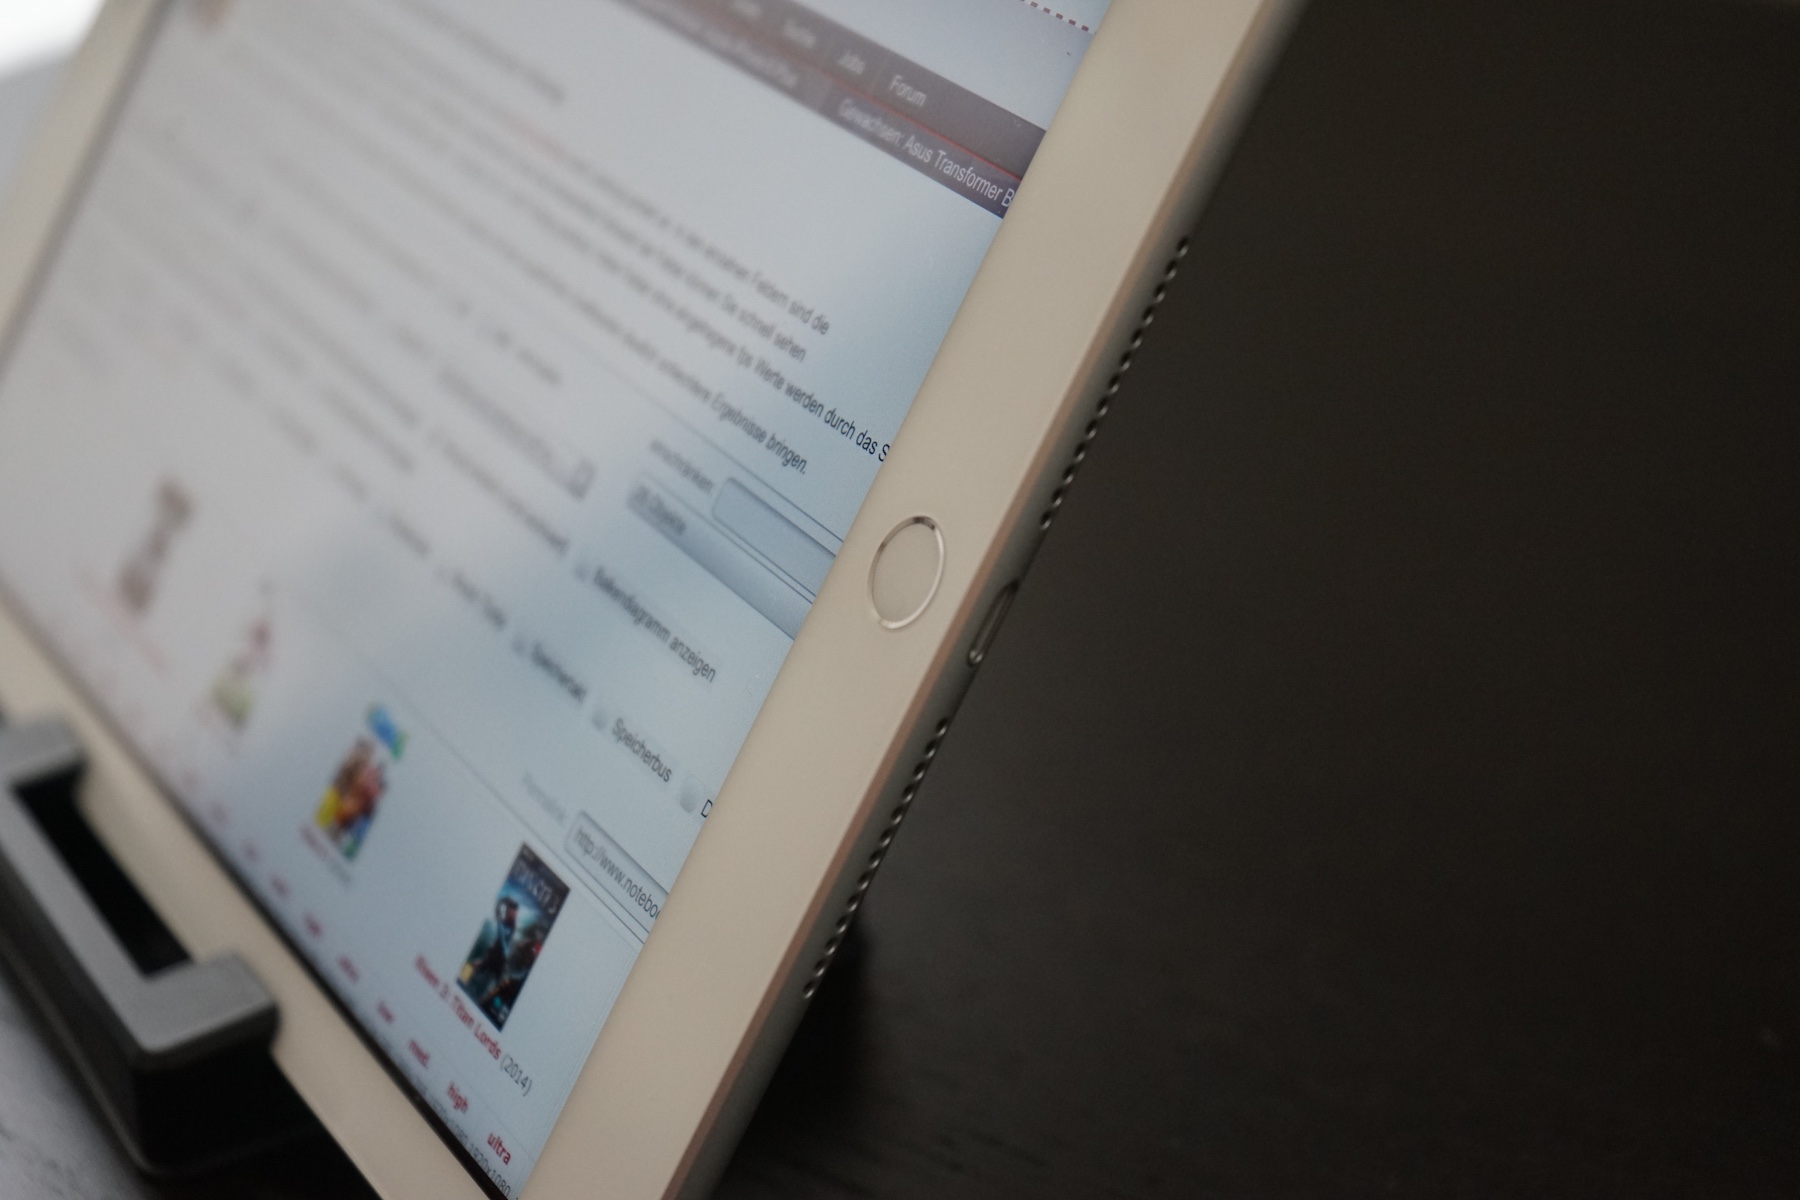
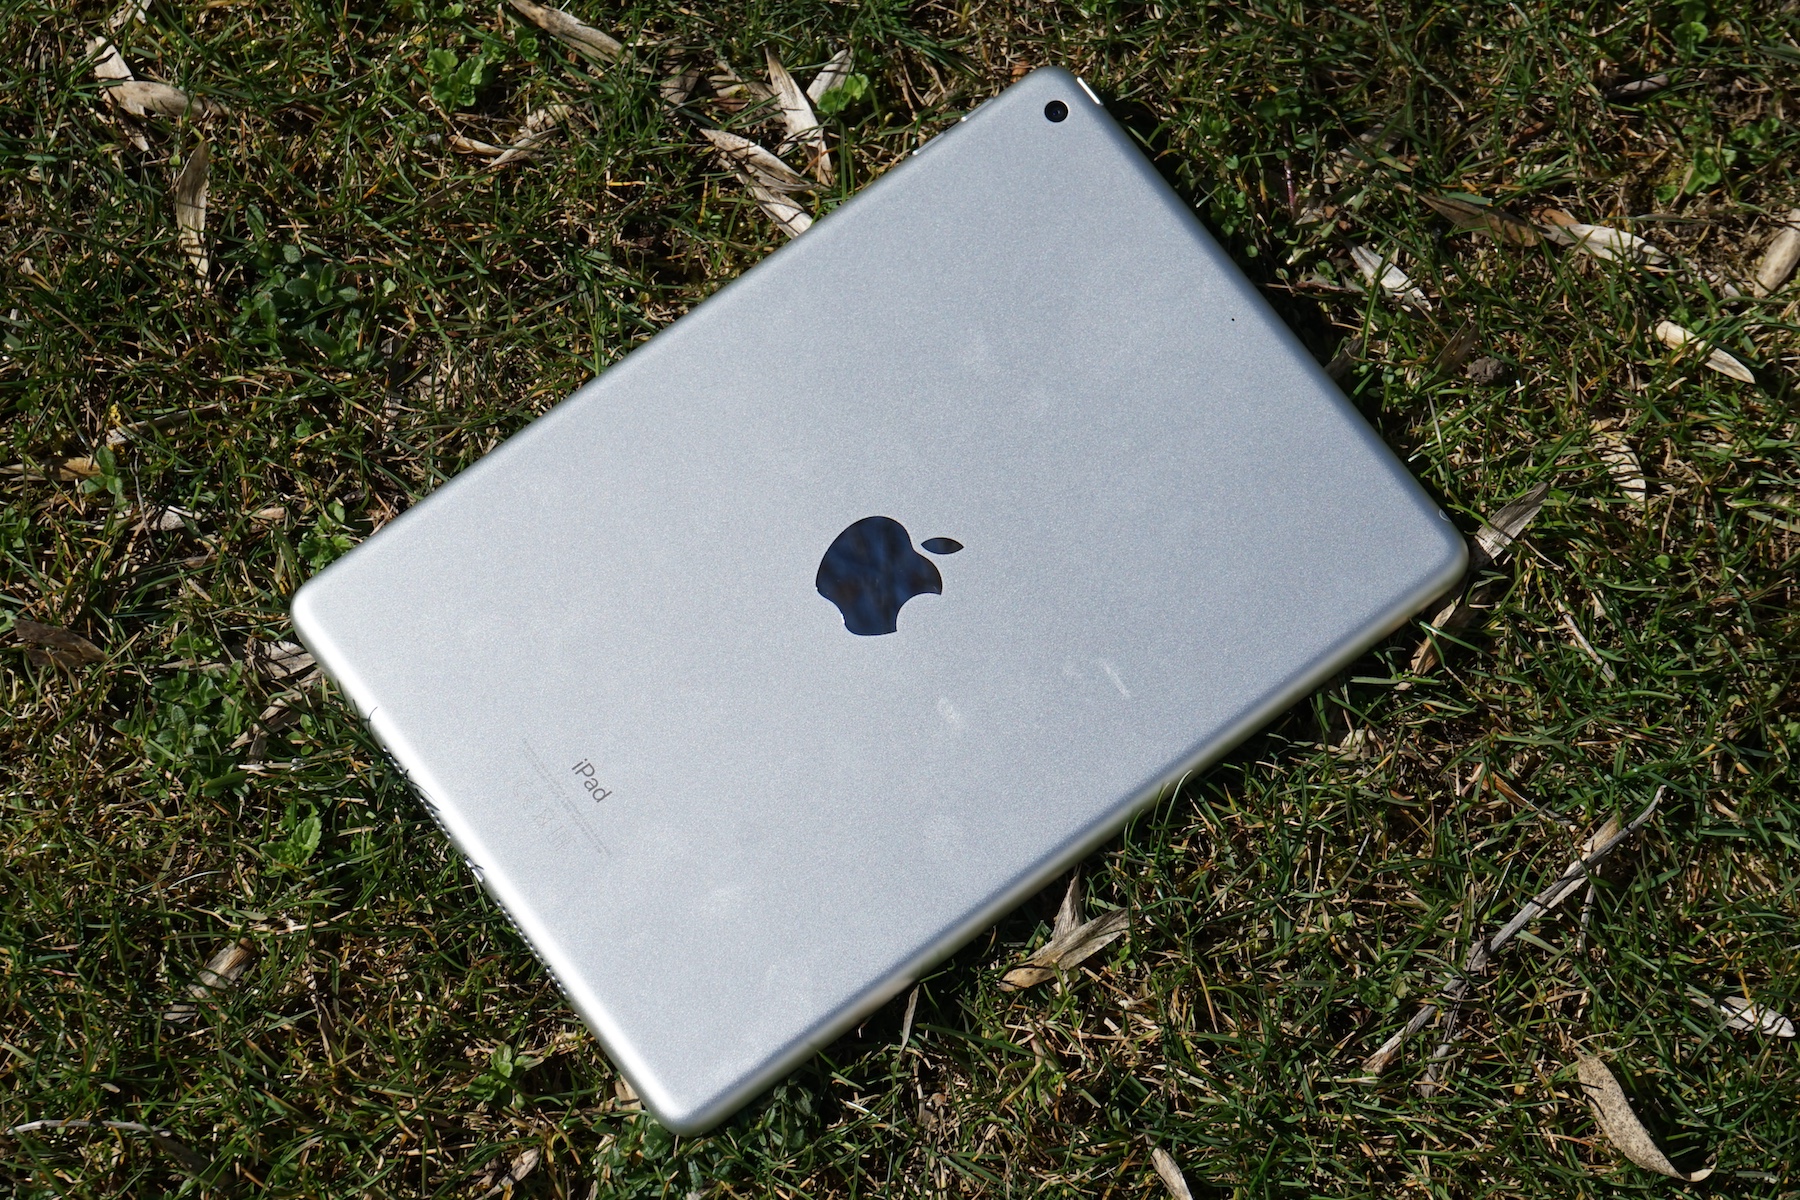
O aquecimento não nos preocupa e a tela ainda é muito boa. O espaço entre o vidro frontal e o painel do visor não é perfeito, mas, em compensação, o dispositivo é mais fácil de reparar se tela for quebrada. No entanto, se o iPad pode rivalizar Chromebooks nas escolas é questionável. O preço com o Pencil e o teclado é muito maior. Isso significa que o software tem que fazer a diferença, e a Apple geralmente consegue ganhar pontos com aplicativos de alta qualidade.
O novo iPad é acessível? O novo iPad é cerca de $80 mais barato que o iPad Mini, e os modelos Pro custam $649 na loja online da Apple. Bons tablets Android com tela comparável já estão disponíveis por menos de $350.
Apple iPad 6 2018
- 09/16/2019 v7 (old)
Klaus Hinum, J. Simon Leitner
Price comparison
