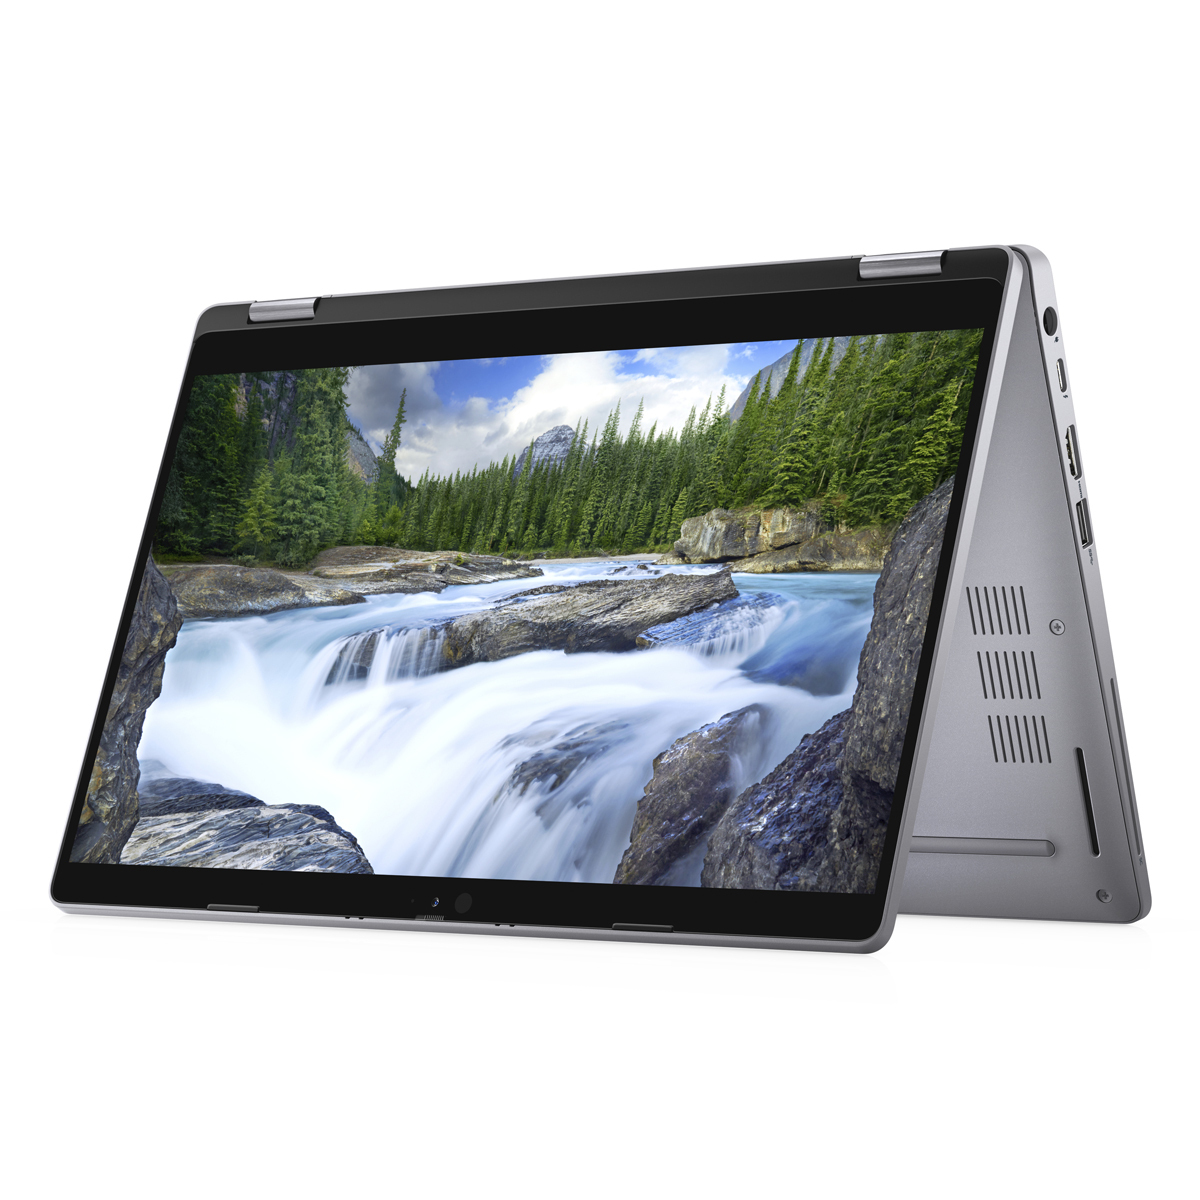
Dell Latitude 5310 2 em 1 conversível em revisão: corredora de longa distância de 11 horas
A série Latitude 5000 da Dell é a gama média sólida entre a gama alta 7000 e o nível de entrada 3000. No entanto, o dispositivo de teste não é barato como resultado. Ele se une perfeitamente à classe superior do HP Spectre, o LenovoThinkpad X1 e oSamsung Galaxy Livro em termos
de preço.O que o Latitude 5310 2 em 1 tem a oferecer? Um pouco e quase nenhum inconveniente, como nossa análise vai revelar.
Possible competitors compared
Avaliação | Data | Modelo | Peso | Altura | Size | Resolução | Preço |
|---|---|---|---|---|---|---|---|
| 87.2 % v7 (old) | 01/2021 | Dell Latitude 5310-23VP6 i5-10310U, UHD Graphics 620 | 1.3 kg | 19.7 mm | 13.30" | 1920x1080 | |
| 89.4 % v7 (old) | 12/2020 | HP Spectre x360 14t-ea000 i7-1165G7, Iris Xe G7 96EUs | 1.3 kg | 17.2 mm | 13.50" | 1920x1280 | |
| 84.4 % v7 (old) | 07/2020 | Samsung Galaxy Book Flex 13.3 i5-1035G4, Iris Plus Graphics G4 (Ice Lake 48 EU) | 1.2 kg | 13 mm | 13.30" | 1920x1080 | |
| 89.8 % v7 (old) | 07/2020 | Lenovo ThinkPad X1 Yoga 2020-20UCS03S00 i7-10510U, UHD Graphics 620 | 1.3 kg | 15.5 mm | 14.00" | 1920x1080 | |
| 84.3 % v7 (old) | 03/2020 | Lenovo Yoga C740-14IML i5-10210U, UHD Graphics 620 | 1.4 kg | 16.9 mm | 14.00" | 1920x1080 |
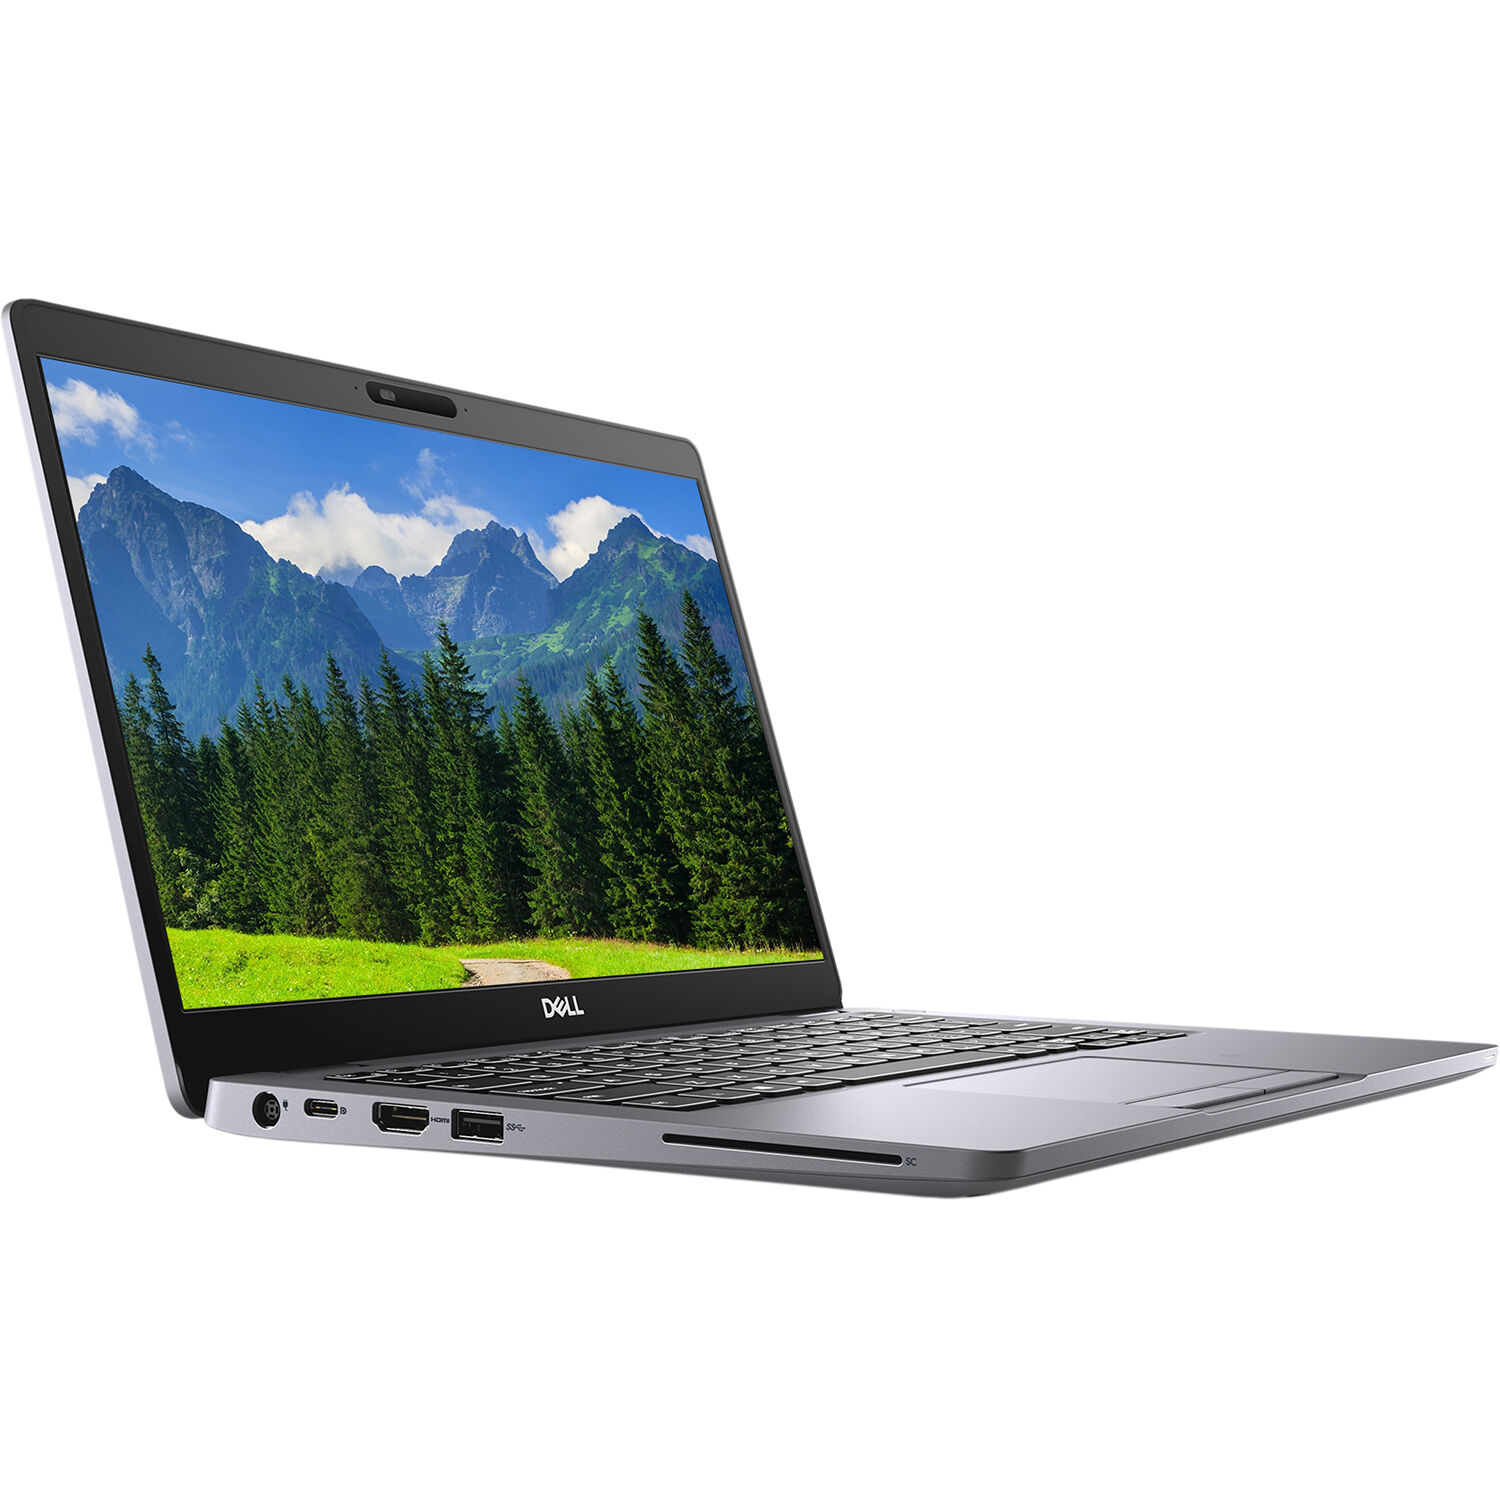
Estojo e conectividade: Atualizações de hardware são possíveis
A caixa de magnésio leve é muito sólida, especialmente a tampa e as dobradiças são incomumente rígidas. O acabamento fosco e sem brilho não recolhe as impressões digitais e sente-se pegajoso na mão. Não há revestimento de borracha.
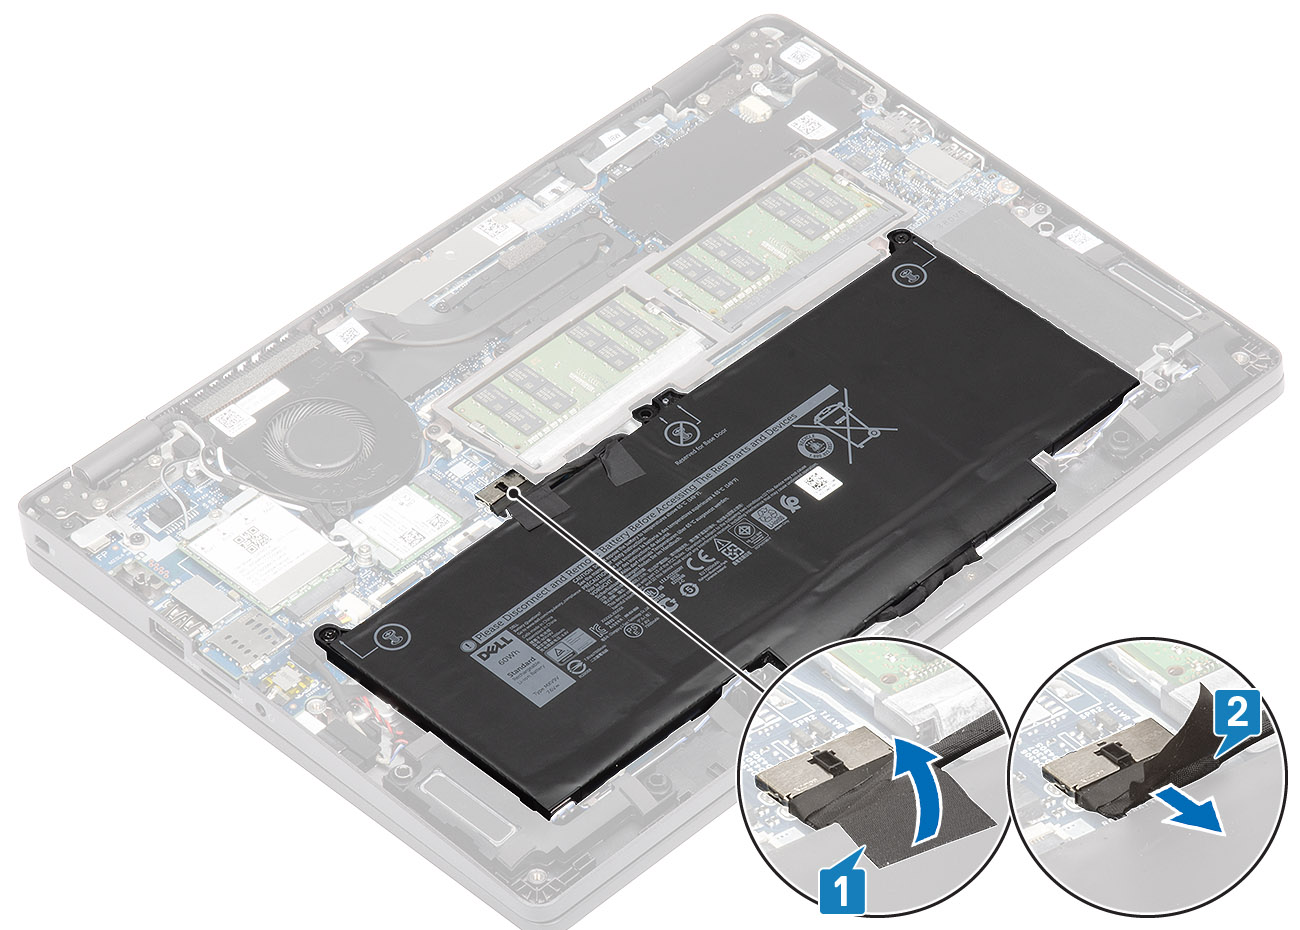
A tampa inferior pode ser facilmente removida, revelando dois slots de RAM, o ventilador, o módulo Wi-Fi e o SSD embaixo. Tudo isso pode ser substituído, assim como a bateria de 60 Wh. A Dell não usa RAM a bordo, e um slot está livre em nosso dispositivo de teste de 16 GB (monocanal).
A porta USB tipo C sai DisplayPort 1.4 e suporta o fornecimento de energia; um adaptador de energia correspondente fornece energia para nosso dispositivo de teste. Infelizmente, existe apenas uma porta Type-C, razão pela qual o uso simultâneo da DisplayPort e do adaptador de energia não é possível.
O leitor de cartões suporta cartões microSD e tem velocidades de leitura muito rápidas. Com o AX201, um chip Wi-Fi 6 moderno está a bordo; seu desempenho está acima da média no teste, mas não na recepção.
A garantia padrão da Dell cobre apenas 12 meses, mas estão disponíveis extensões.
| SD Card Reader | |
| average JPG Copy Test (av. of 3 runs) | |
| HP Spectre x360 14t-ea000 (Toshiba Exceria Pro M501 microSDXC 32GB) | |
| Dell Latitude 5310-23VP6 (Toshiba Exceria Pro M501 microSDXC 64GB) | |
| Samsung Galaxy Book Flex 13.3 (Toshiba Exceria Pro M501 microSDXC 64GB) | |
| Média da turma Convertible (29.4 - 141, n=20, últimos 2 anos) | |
| maximum AS SSD Seq Read Test (1GB) | |
| HP Spectre x360 14t-ea000 (Toshiba Exceria Pro M501 microSDXC 32GB) | |
| Dell Latitude 5310-23VP6 (Toshiba Exceria Pro M501 microSDXC 64GB) | |
| Média da turma Convertible (67.5 - 254, n=19, últimos 2 anos) | |
| Samsung Galaxy Book Flex 13.3 (Toshiba Exceria Pro M501 microSDXC 64GB) | |


, i5-1035G4, Samsung SSD PM981a MZVLB256HBHQ")
, i5-1035G4, Samsung SSD PM981a MZVLB256HBHQ")


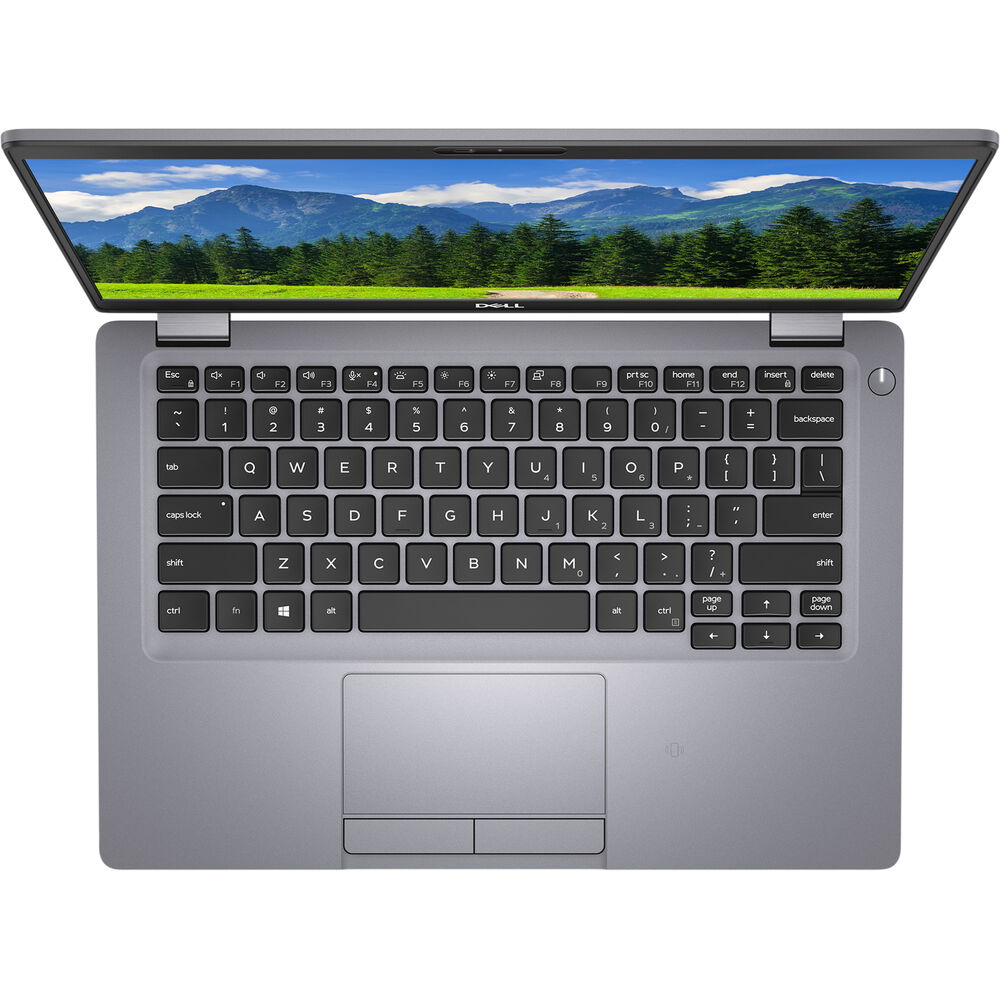
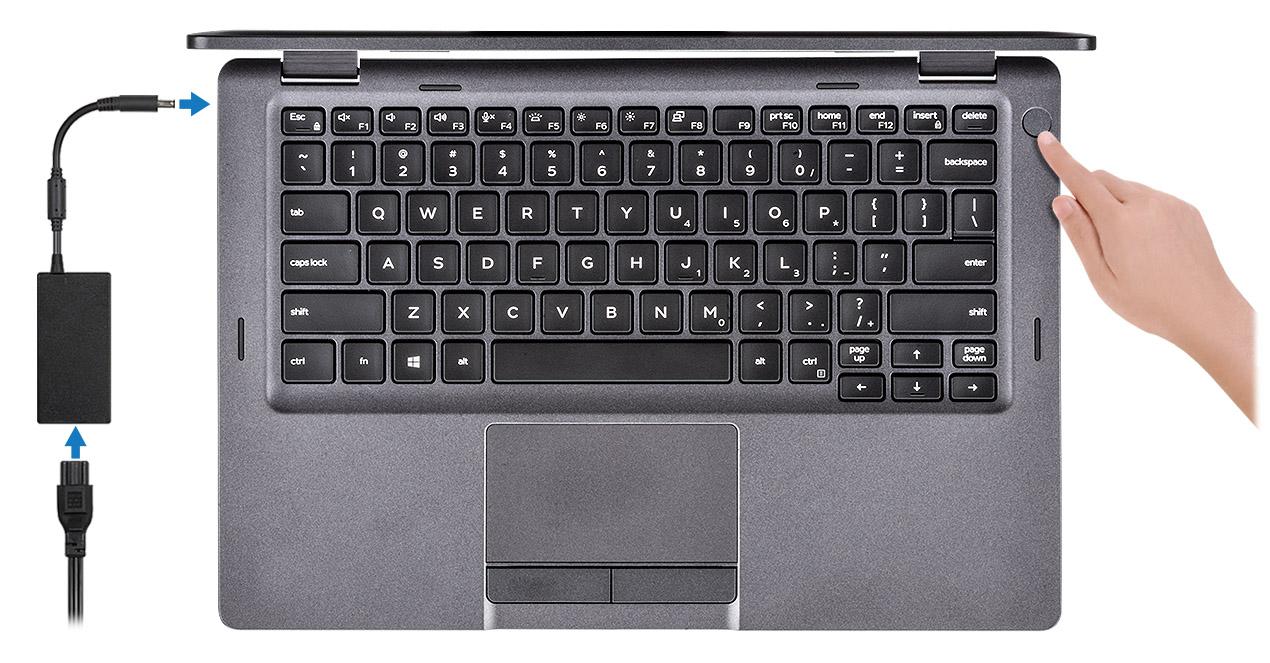
Dispositivos de entrada - Estável
As chaves oferecem um curso firme, um ponto de pressão claro e uma pequena curvatura cônica. Isto resulta em uma experiência de digitação rápida e silenciosa. O espaçamento de quatro milímetros e as setas separadas das teclas tornam a digitação rápida, precisa e fácil. Além disso, a retroiluminação do teclado tem dois estágios.
Com seus dois botões ágeis, o ClickPad pode ser usado de forma rápida e infalível. Os botões têm um curso claro, um curso amortecido e são silenciosos, assim como as teclas do teclado. Como é habitual com um touchpad Precision, há gestos multi-toque e multi-dedos.
O painel de toque está localizado sob um painel que ocupa a tela inteira até as bordas. Entretanto, a área de exibição é menor; a relação tela/corpo é de 72%. Os dedos deslizam confortavelmente sobre o vidro, e as ações são implementadas sem atrasos.
Mostrar
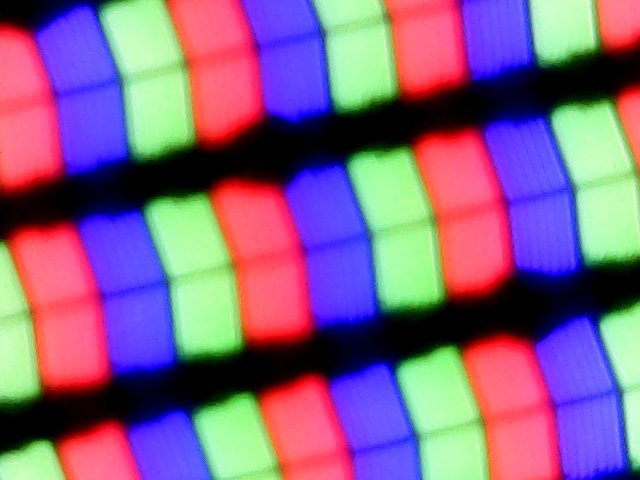
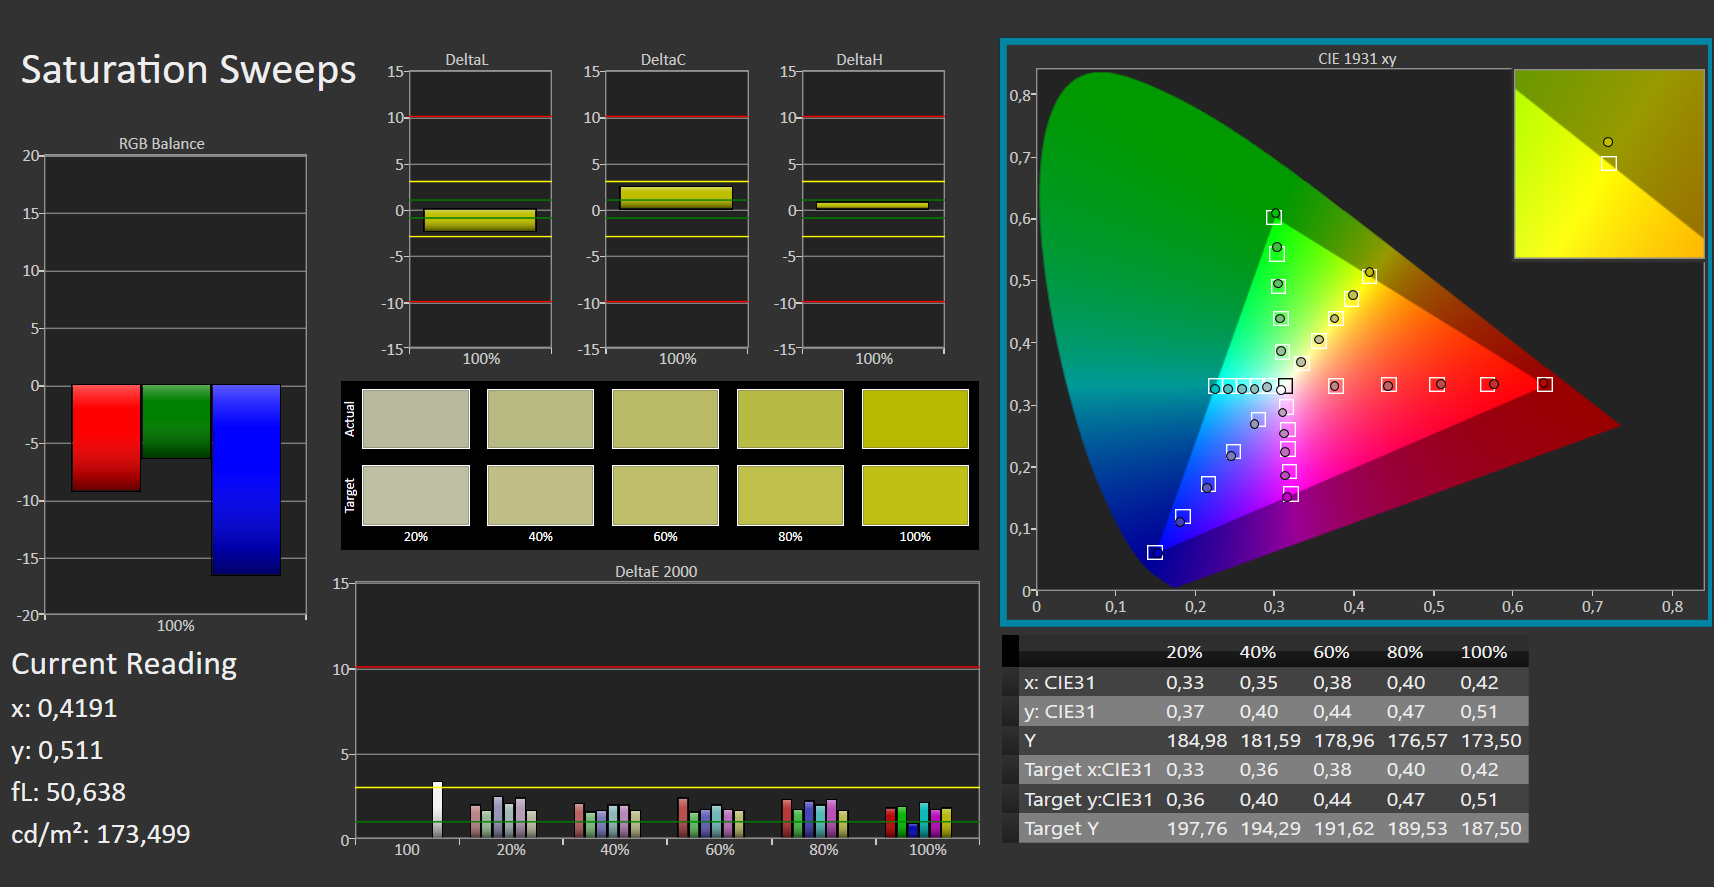
A Dell utiliza um painel IPS de Chi Mei com uma resolução de 1920x1080 pixels. A luminosidade de quase 400 cd/m² é impressionante. Isto torna possível o uso externo, desde que haja sombra para reduzir os reflexos do painel brilhante. Entretanto, a luminância é limitada a 327 cd/m² (centro do visor) na energia da bateria.
A concorrência, equipada unanimemente com displays Full HD, pode fazer um trabalho melhor, pelo menos em termos de brilho. O PWM é usado para regular a luminosidade neste painel; ele entra em ação a níveis de luminosidade de 80% e inferiores. Como a freqüência é bastante alta a 2.500 Hz, a maioria dos usuários não deve ter nenhuma reclamação sobre isso. Além disso, com um fundo preto e brilho máximo, você pode ver a tela sangrando nas bordas superior e inferior da tela. No entanto, isto só é perceptível a olho nu quando se usa um fundo preto.
| |||||||||||||||||||||||||
iluminação: 84 %
iluminação com acumulador: 327 cd/m²
Contraste: 1126:1 (Preto: 0.34 cd/m²)
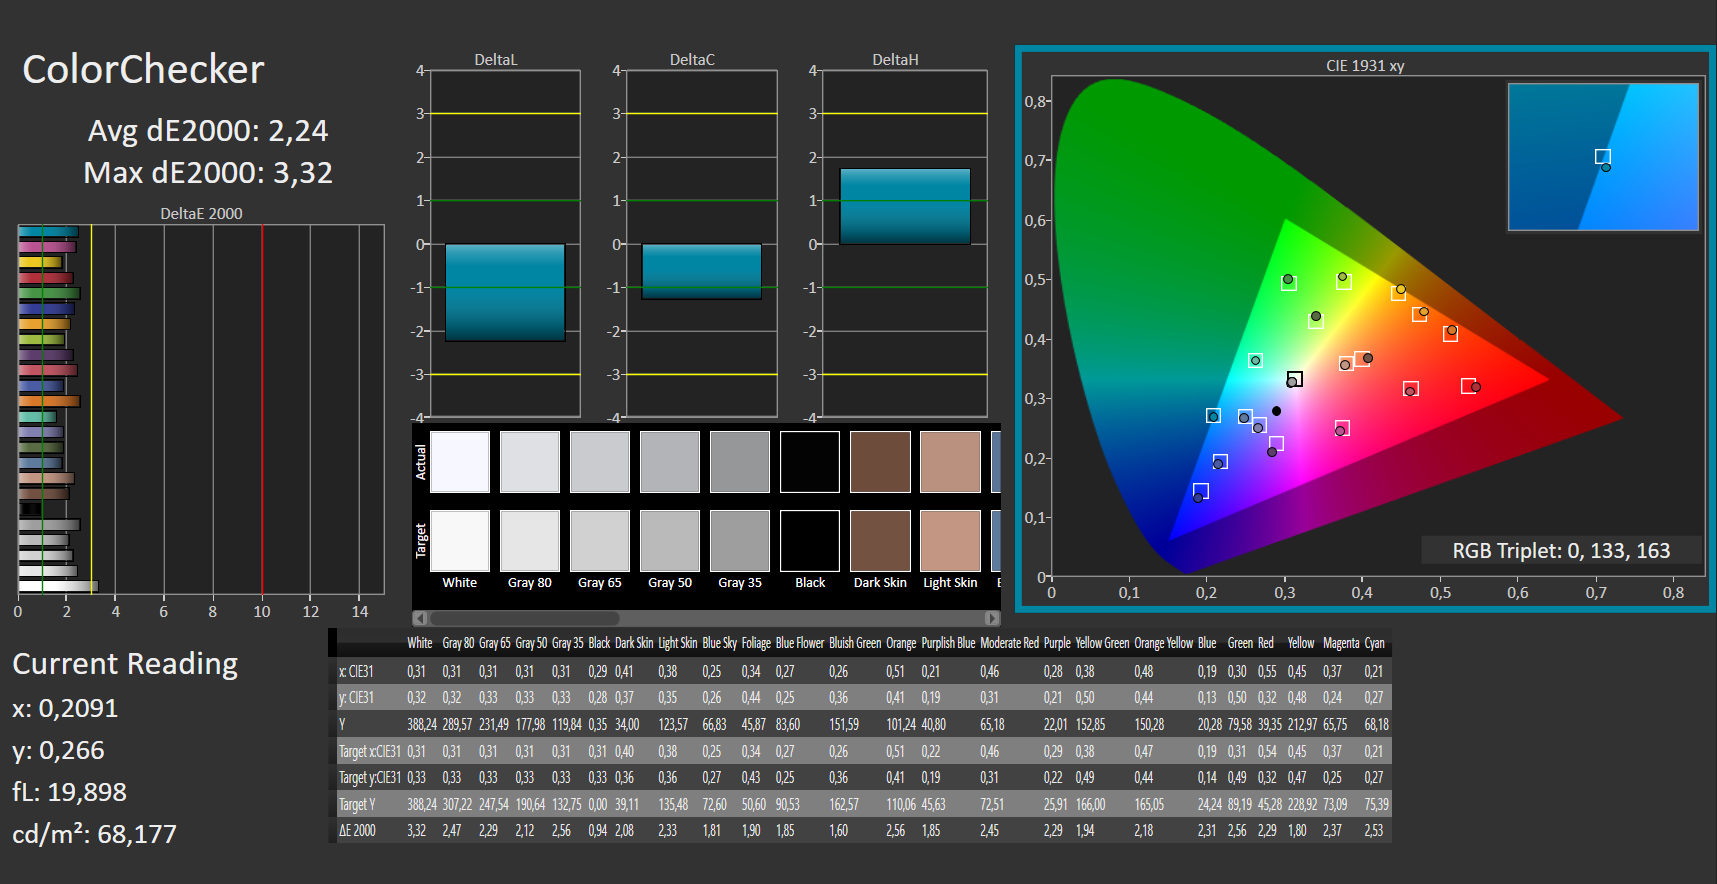
ΔE ColorChecker Calman: 2.24 | ∀{0.5-29.43 Ø4.71}
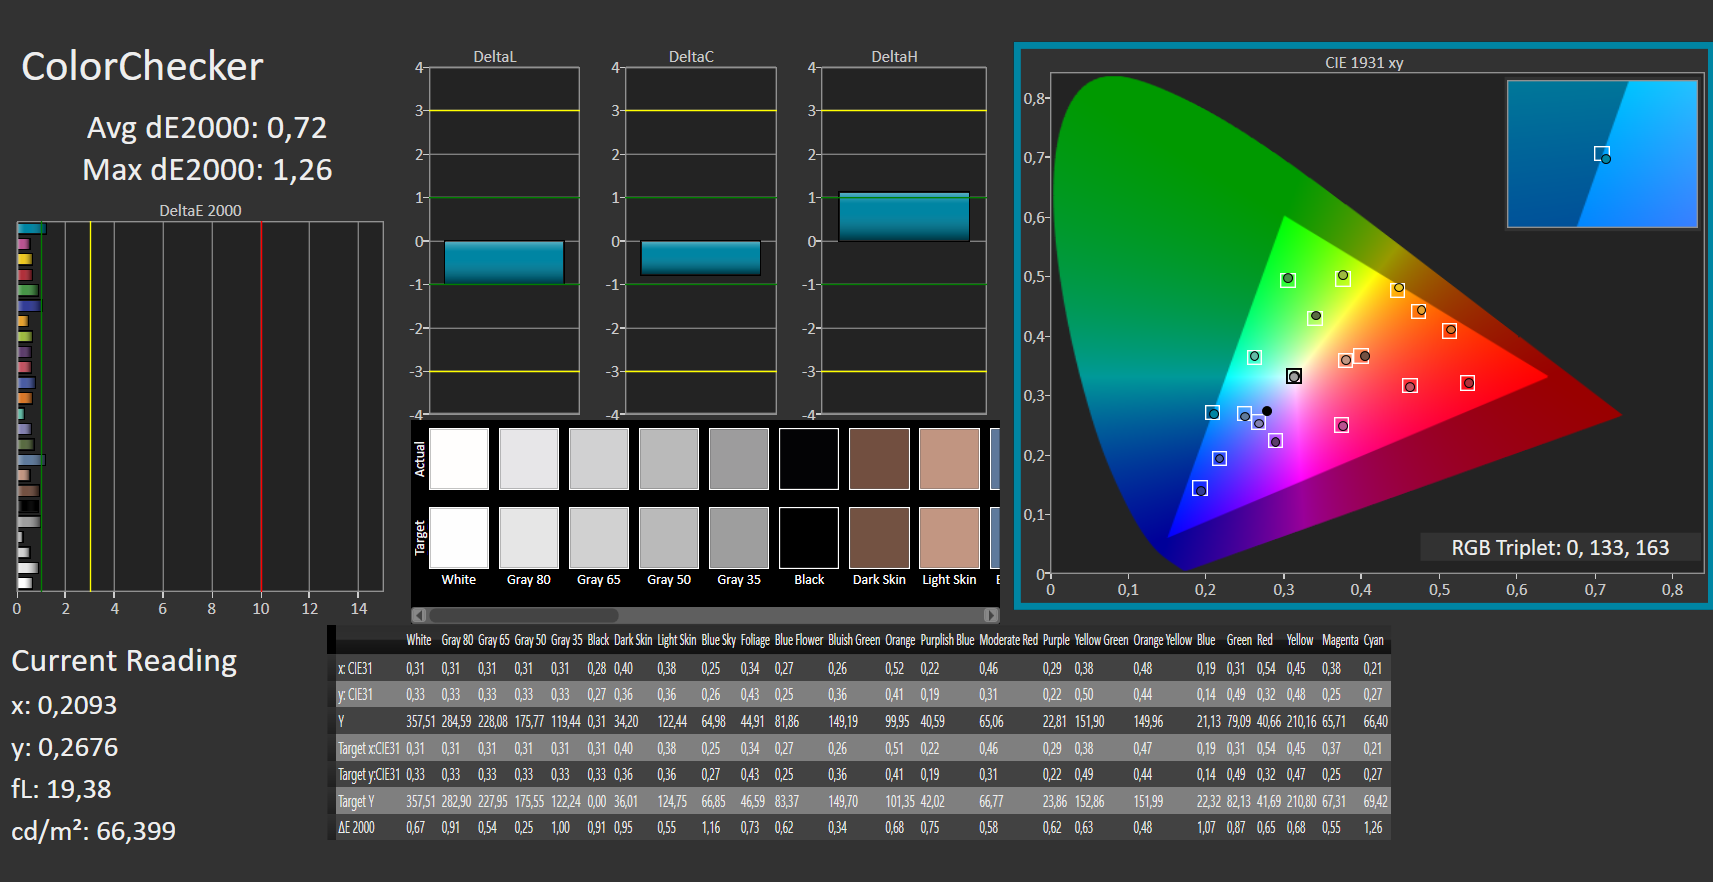
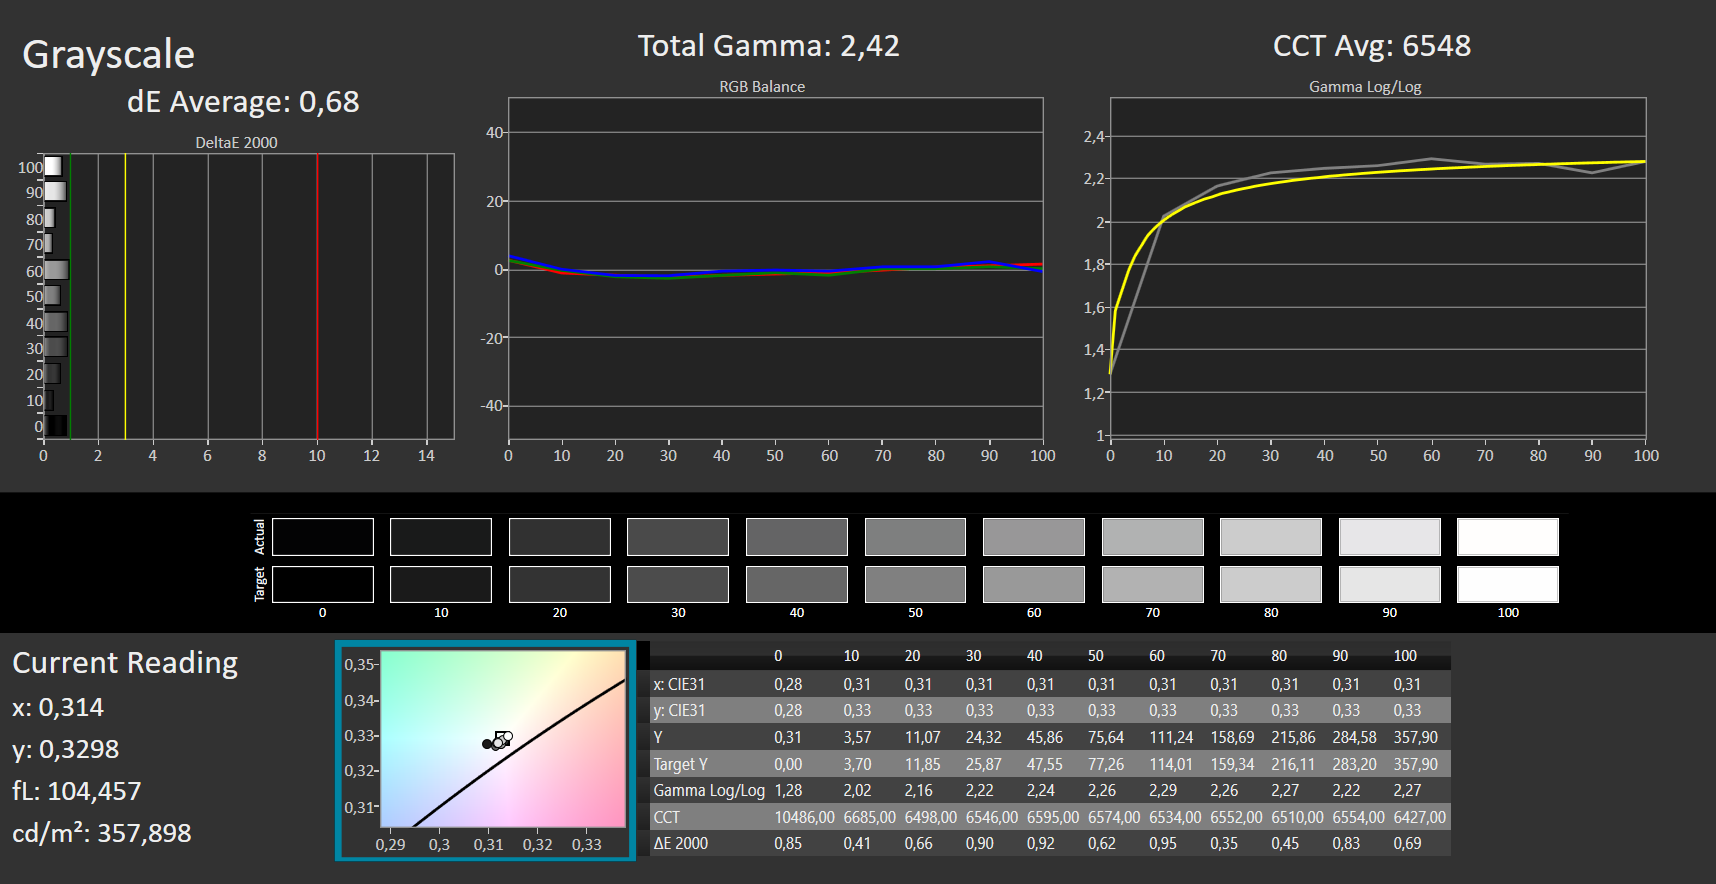
calibrated: 0.72
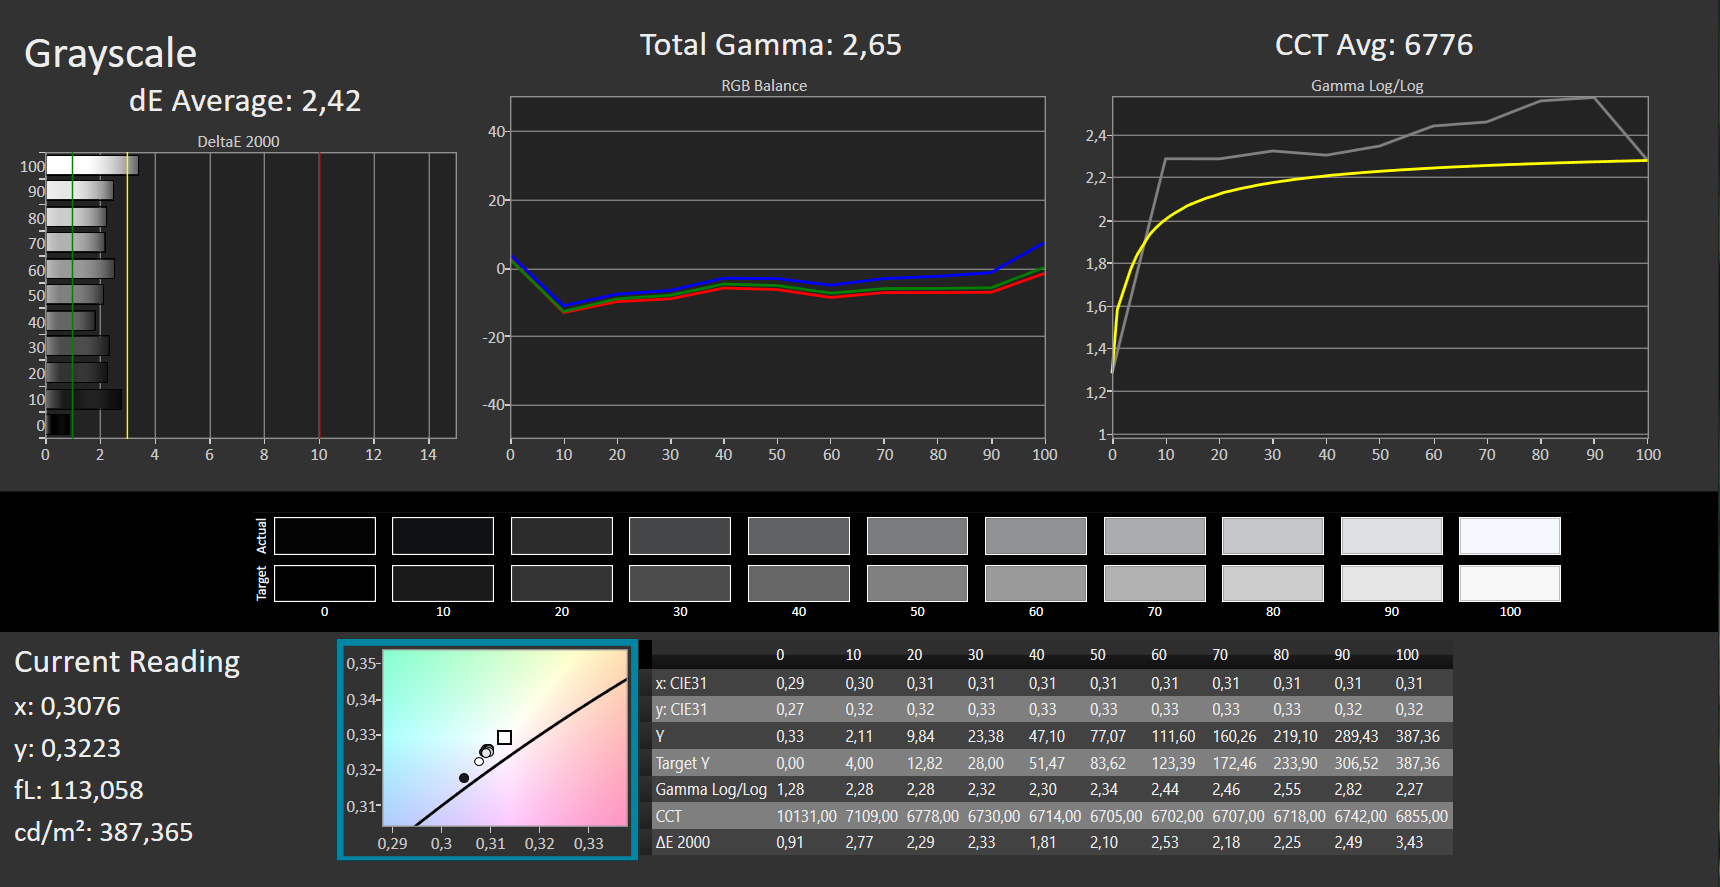
ΔE Greyscale Calman: 2.42 | ∀{0.09-98 Ø4.96}
99% sRGB (Argyll 1.6.3 3D)
56% AdobeRGB 1998 (Argyll 1.6.3 3D)
69.2% AdobeRGB 1998 (Argyll 3D)
99% sRGB (Argyll 3D)
67.5% Display P3 (Argyll 3D)
Gamma: 2.65
CCT: 6776 K
| Dell Latitude 5310-23VP6 Chi Mei CMN1382, IPS, 1920x1080, 13.3" | HP Spectre x360 14t-ea000 LG Philips LGD0663, IPS, 1920x1280, 13.5" | Samsung Galaxy Book Flex 13.3 BOE087A, IPS, 1920x1080, 13.3" | Lenovo ThinkPad X1 Yoga 2020-20UCS03S00 LP140WF9-SPE1, IPS LED, 1920x1080, 14" | Lenovo Yoga C740-14IML CMN N140HCE-ET2, IPS, 1920x1080, 14" | |
|---|---|---|---|---|---|
| Display | -2% | -5% | 0% | ||
| Display P3 Coverage (%) | 67.5 | 65.8 -3% | 64.3 -5% | 67.9 1% | |
| sRGB Coverage (%) | 99 | 98.2 -1% | 95.5 -4% | 98.3 -1% | |
| AdobeRGB 1998 Coverage (%) | 69.2 | 67.9 -2% | 65.6 -5% | 70.1 1% | |
| Response Times | -69% | -18% | -26% | -26% | |
| Response Time Grey 50% / Grey 80% * (ms) | 36 ? | 62 ? -72% | 44 ? -22% | 52 ? -44% | 35.6 ? 1% |
| Response Time Black / White * (ms) | 24 ? | 39.6 ? -65% | 27 ? -13% | 25.6 ? -7% | 36.8 ? -53% |
| PWM Frequency (Hz) | 2500 ? | 27030 ? | |||
| Screen | -13% | -61% | -32% | -38% | |
| Brightness middle (cd/m²) | 383 | 443.5 16% | 473 23% | 409 7% | 329.9 -14% |
| Brightness (cd/m²) | 364 | 394 8% | 434 19% | 405 11% | 315 -13% |
| Brightness Distribution (%) | 84 | 78 -7% | 86 2% | 95 13% | 90 7% |
| Black Level * (cd/m²) | 0.34 | 0.17 50% | 0.39 -15% | 0.21 38% | 0.29 15% |
| Contrast (:1) | 1126 | 2609 132% | 1213 8% | 1948 73% | 1138 1% |
| Colorchecker dE 2000 * | 2.24 | 2.7 -21% | 5.18 -131% | 4.9 -119% | 3.68 -64% |
| Colorchecker dE 2000 max. * | 3.32 | 4.36 -31% | 10.01 -202% | 8.4 -153% | 8.64 -160% |
| Colorchecker dE 2000 calibrated * | 0.72 | 2.61 -263% | 1.3 -81% | 1.03 -43% | |
| Greyscale dE 2000 * | 2.42 | 3.4 -40% | 7.04 -191% | 5.8 -140% | 6.4 -164% |
| Gamma | 2.65 83% | 2.09 105% | 2.35 94% | 2.53 87% | 2.17 101% |
| CCT | 6776 96% | 6144 106% | 6753 96% | 7009 93% | 6195 105% |
| Color Space (Percent of AdobeRGB 1998) (%) | 56 | 62.1 11% | 60.7 8% | 63.6 14% | |
| Color Space (Percent of sRGB) (%) | 99 | 98.5 -1% | 95.3 -4% | 98.4 -1% | |
| Média Total (Programa/Configurações) | -28% /
-18% | -40% /
-52% | -21% /
-26% | -21% /
-30% |
* ... menor é melhor
O contraste de 1.126:1 não é ruim em princípio, mas fica atrás da concorrência em comparação. Pelo menos as cores são exatas fora da caixa e sem calibração. No entanto, o esforço de realizar uma calibração com o espectrofotômetro vale a pena. Conseguimos reduzir os valores Delta E das escalas de cinza e cores de 2,4 para 0,7 e 3,3 para 0,7, respectivamente.
Apenas 99% do pequeno espaço de cor sRGB é coberto, mas a concorrência também gerencia isto. Portanto, o Latitude é adequado para designers gráficos profissionais e editores de fotos.

Exibir tempos de resposta
| ↔ Tempo de resposta preto para branco | ||
|---|---|---|
| 24 ms ... ascensão ↗ e queda ↘ combinadas | ↗ 14 ms ascensão | 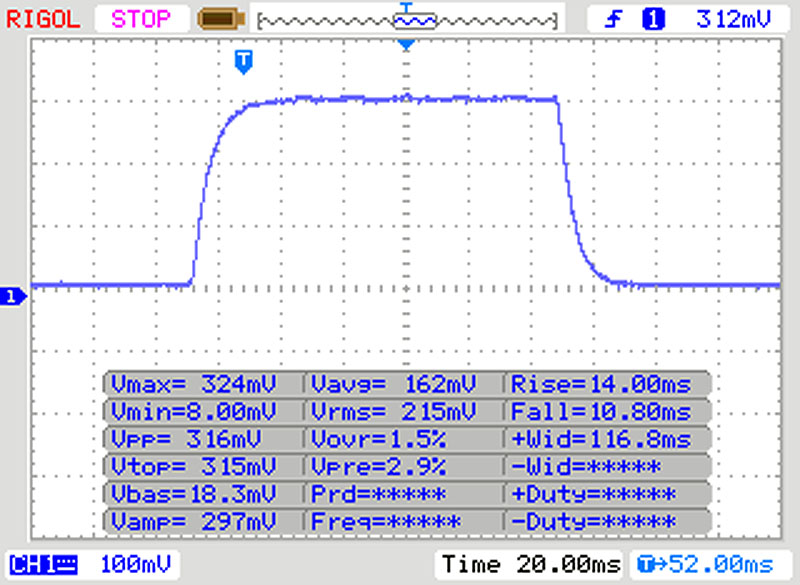 |
| ↘ 10 ms queda | ||
| A tela mostra boas taxas de resposta em nossos testes, mas pode ser muito lenta para jogadores competitivos. Em comparação, todos os dispositivos testados variam de 0.1 (mínimo) a 240 (máximo) ms. » 54 % de todos os dispositivos são melhores. Isso significa que o tempo de resposta medido é pior que a média de todos os dispositivos testados (19.8 ms). | ||
| ↔ Tempo de resposta 50% cinza a 80% cinza | ||
| 36 ms ... ascensão ↗ e queda ↘ combinadas | ↗ 18 ms ascensão | 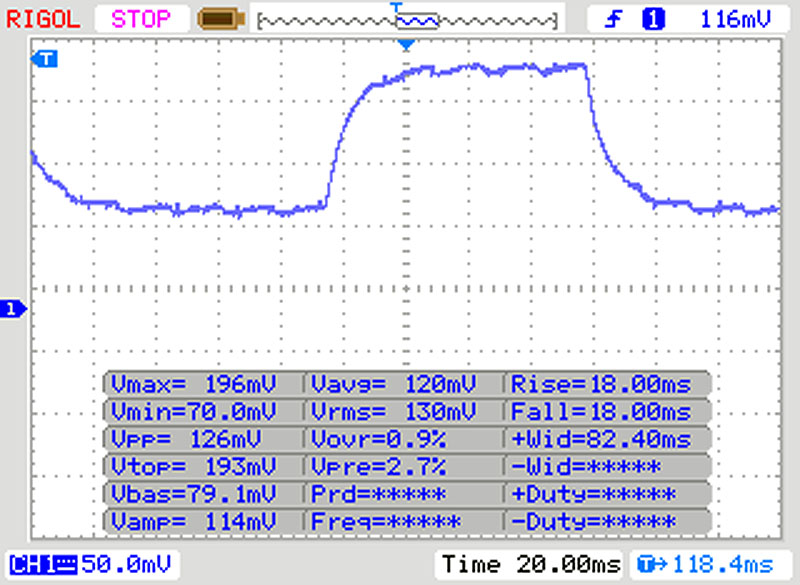 |
| ↘ 18 ms queda | ||
| A tela mostra taxas de resposta lentas em nossos testes e será insatisfatória para os jogadores. Em comparação, todos os dispositivos testados variam de 0.165 (mínimo) a 636 (máximo) ms. » 51 % de todos os dispositivos são melhores. Isso significa que o tempo de resposta medido é pior que a média de todos os dispositivos testados (31 ms). | ||
Cintilação da tela / PWM (modulação por largura de pulso)
| Tela tremeluzindo/PWM detectado | 2500 Hz | ≤ 80 % configuração de brilho | 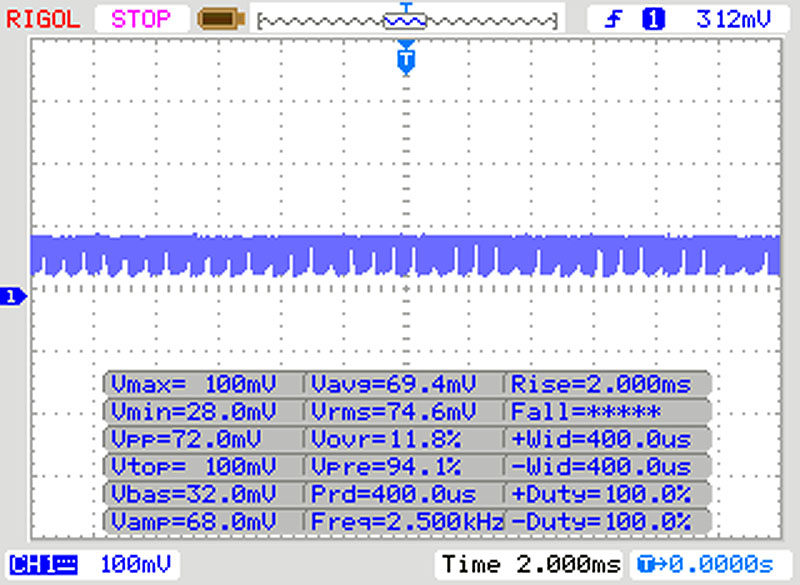 |
A luz de fundo da tela pisca em 2500 Hz (pior caso, por exemplo, utilizando PWM) Cintilação detectada em uma configuração de brilho de 80 % e abaixo. Não deve haver cintilação ou PWM acima desta configuração de brilho. A frequência de 2500 Hz é bastante alta, então a maioria dos usuários sensíveis ao PWM não deve notar nenhuma oscilação. [pwm_comparison] Em comparação: 52 % de todos os dispositivos testados não usam PWM para escurecer a tela. Se PWM foi detectado, uma média de 7754 (mínimo: 5 - máximo: 343500) Hz foi medida. | |||
Desempenho
O processador, um Intel Corei5-10310U com
quatro núcleos (Comet Lake), é um processador típico para laptops pequenos e leves, destinados a serem duradouros, mas também silenciosos. A taxa de clock tem uma ampla faixa de 1,7 a 1,44 GHz, sendo que este último só pode ser alcançado com um único núcleo.O processador é suportado por 16 GB de RAM em modo monocanal (um módulo) e um SSD de 512 GB de hynix SK.
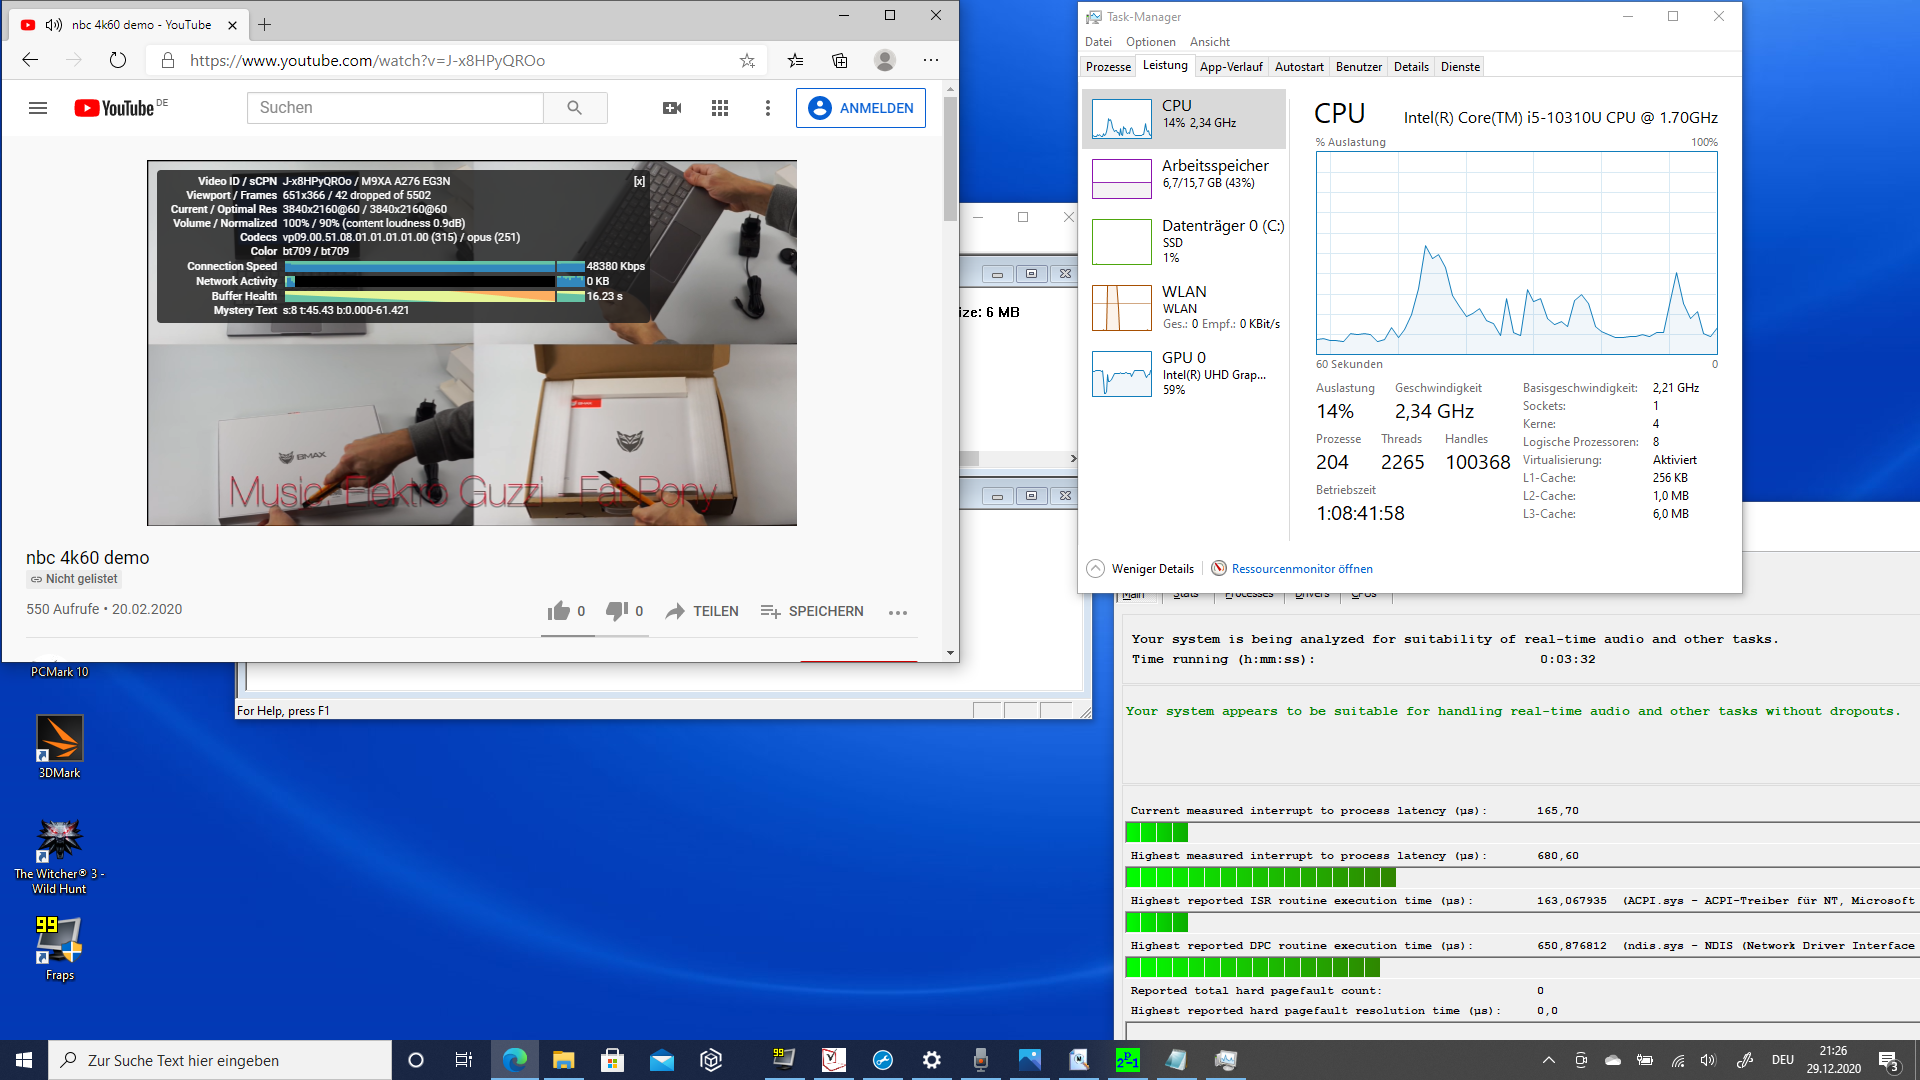
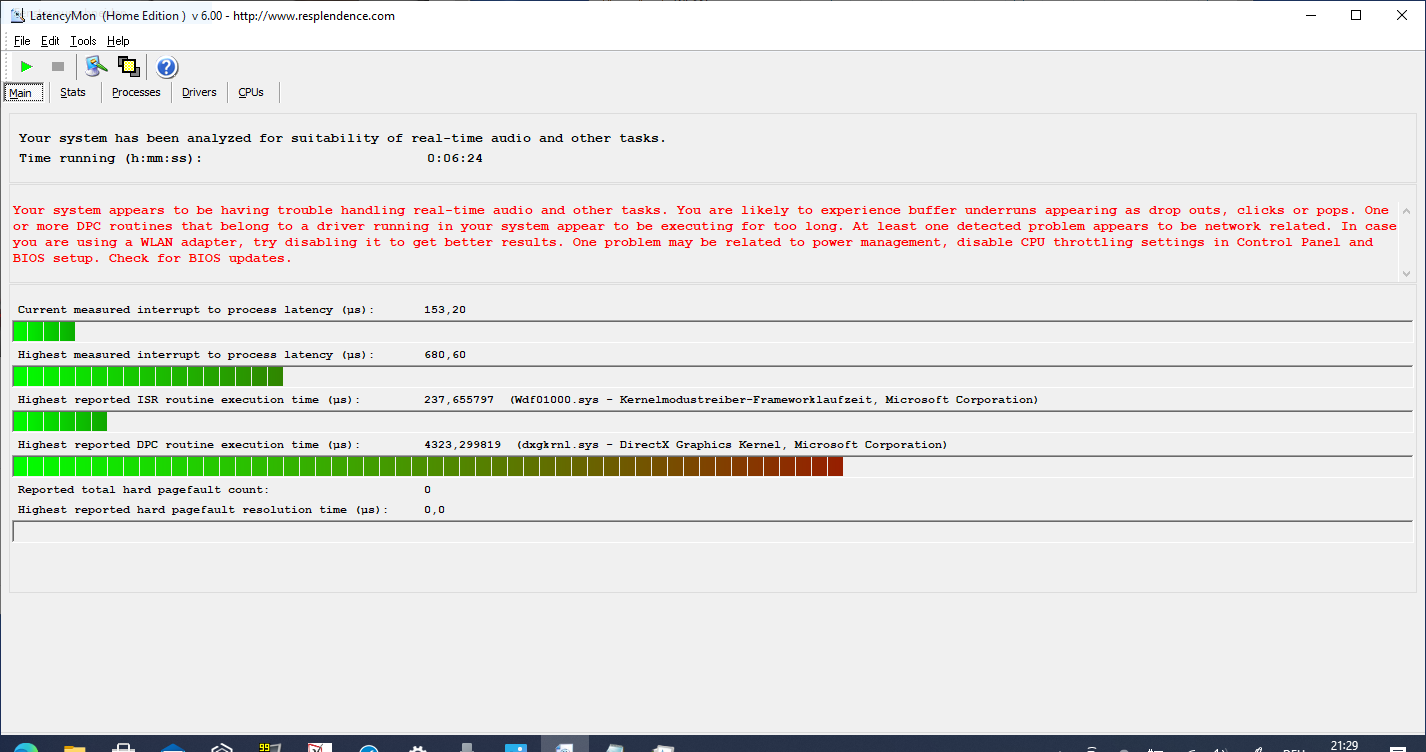
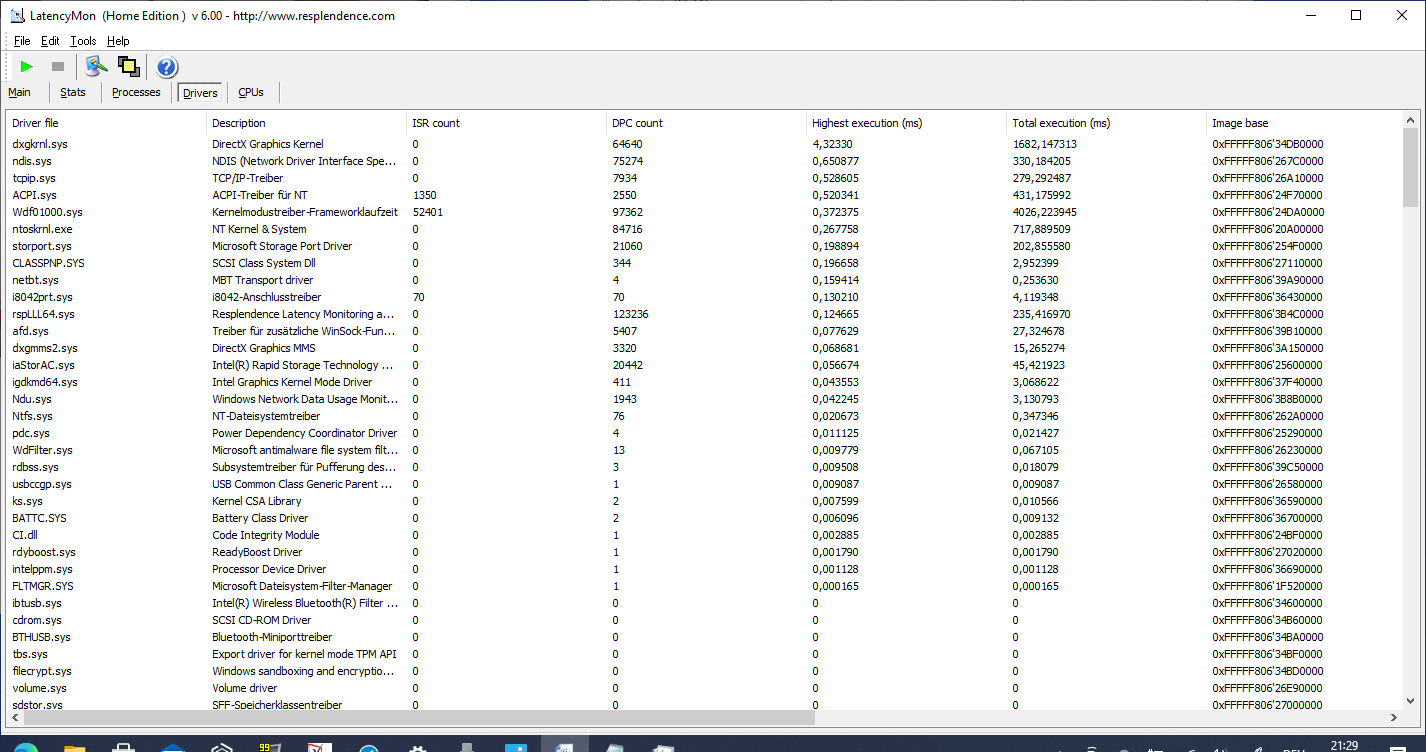
LatencyMon nos mostrou latências DPC perceptíveis. A edição de vídeo em tempo real não é possível com base nos drivers disponíveis
Processador
OCore i5-10310U não funciona tão rápido quanto poderia no laptop Dell. Em troca, porém, ele funciona de forma consistente e a pontuação não cai mesmo depois de 10 passes. A velocidade do relógio de base não é subcotada.
A comparação com outros sistemas da Intel que utilizam a mesma geração de CPU ou a geração de CPU posterior superior (Tiger Lake) mostra que o Latitude é moderadamente poderoso. O chip não pode explorar totalmente seu desempenho no 5310, provavelmente em favor de uma superfície fria e um baixo nível de ruído.
Cinebench R15: CPU Single 64Bit | CPU Multi 64Bit
Blender: v2.79 BMW27 CPU
7-Zip 18.03: 7z b 4 -mmt1 | 7z b 4
Geekbench 5.5: Single-Core | Multi-Core
HWBOT x265 Benchmark v2.2: 4k Preset
LibreOffice : 20 Documents To PDF
R Benchmark 2.5: Overall mean
| Cinebench R20 / CPU (Single Core) | |
| Média da turma Convertible (273 - 834, n=48, últimos 2 anos) | |
| HP Spectre x360 14t-ea000 | |
| Média Intel Core i5-10310U (411 - 438, n=5) | |
| Lenovo ThinkPad X1 Yoga 2020-20UCS03S00 | |
| Lenovo Yoga C740-14IML | |
| Samsung Galaxy Book Flex 13.3 | |
| Dell Latitude 5310-23VP6 | |
| Cinebench R20 / CPU (Multi Core) | |
| Média da turma Convertible (595 - 12102, n=48, últimos 2 anos) | |
| HP Spectre x360 14t-ea000 | |
| Média Intel Core i5-10310U (1192 - 1588, n=5) | |
| Lenovo Yoga C740-14IML | |
| Lenovo ThinkPad X1 Yoga 2020-20UCS03S00 | |
| Samsung Galaxy Book Flex 13.3 | |
| Dell Latitude 5310-23VP6 | |
| Cinebench R15 / CPU Single 64Bit | |
| Média da turma Convertible (149.8 - 317, n=47, últimos 2 anos) | |
| HP Spectre x360 14t-ea000 | |
| Lenovo ThinkPad X1 Yoga 2020-20UCS03S00 | |
| Média Intel Core i5-10310U (164 - 173.8, n=5) | |
| Lenovo Yoga C740-14IML | |
| Dell Latitude 5310-23VP6 | |
| Samsung Galaxy Book Flex 13.3 | |
| Cinebench R15 / CPU Multi 64Bit | |
| Média da turma Convertible (478 - 4940, n=47, últimos 2 anos) | |
| HP Spectre x360 14t-ea000 | |
| Lenovo ThinkPad X1 Yoga 2020-20UCS03S00 | |
| Lenovo Yoga C740-14IML | |
| Média Intel Core i5-10310U (499 - 767, n=5) | |
| Samsung Galaxy Book Flex 13.3 | |
| Dell Latitude 5310-23VP6 | |
| Blender / v2.79 BMW27 CPU | |
| Samsung Galaxy Book Flex 13.3 | |
| Dell Latitude 5310-23VP6 | |
| Média Intel Core i5-10310U (683 - 896, n=5) | |
| Lenovo ThinkPad X1 Yoga 2020-20UCS03S00 | |
| HP Spectre x360 14t-ea000 | |
| Média da turma Convertible (105 - 1051, n=47, últimos 2 anos) | |
| 7-Zip 18.03 / 7z b 4 -mmt1 | |
| Média da turma Convertible (3672 - 6655, n=47, últimos 2 anos) | |
| HP Spectre x360 14t-ea000 | |
| Lenovo ThinkPad X1 Yoga 2020-20UCS03S00 | |
| Dell Latitude 5310-23VP6 | |
| Samsung Galaxy Book Flex 13.3 | |
| Média Intel Core i5-10310U (3615 - 4398, n=5) | |
| 7-Zip 18.03 / 7z b 4 | |
| Média da turma Convertible (12977 - 121368, n=47, últimos 2 anos) | |
| HP Spectre x360 14t-ea000 | |
| Lenovo ThinkPad X1 Yoga 2020-20UCS03S00 | |
| Média Intel Core i5-10310U (15976 - 19935, n=5) | |
| Dell Latitude 5310-23VP6 | |
| Samsung Galaxy Book Flex 13.3 | |
| Geekbench 5.5 / Single-Core | |
| Média da turma Convertible (806 - 2275, n=48, últimos 2 anos) | |
| HP Spectre x360 14t-ea000 | |
| Samsung Galaxy Book Flex 13.3 | |
| Lenovo ThinkPad X1 Yoga 2020-20UCS03S00 | |
| Dell Latitude 5310-23VP6 | |
| Média Intel Core i5-10310U (1040 - 1128, n=6) | |
| Geekbench 5.5 / Multi-Core | |
| Média da turma Convertible (1608 - 22023, n=48, últimos 2 anos) | |
| HP Spectre x360 14t-ea000 | |
| Samsung Galaxy Book Flex 13.3 | |
| Lenovo ThinkPad X1 Yoga 2020-20UCS03S00 | |
| Dell Latitude 5310-23VP6 | |
| Média Intel Core i5-10310U (2821 - 3854, n=6) | |
| HWBOT x265 Benchmark v2.2 / 4k Preset | |
| Média da turma Convertible (3.43 - 36.2, n=47, últimos 2 anos) | |
| HP Spectre x360 14t-ea000 | |
| Média Intel Core i5-10310U (3.88 - 5.35, n=5) | |
| Dell Latitude 5310-23VP6 | |
| Lenovo ThinkPad X1 Yoga 2020-20UCS03S00 | |
| Samsung Galaxy Book Flex 13.3 | |
| LibreOffice / 20 Documents To PDF | |
| Média Intel Core i5-10310U (60 - 71.4, n=5) | |
| Dell Latitude 5310-23VP6 | |
| Samsung Galaxy Book Flex 13.3 | |
| Lenovo ThinkPad X1 Yoga 2020-20UCS03S00 | |
| Média da turma Convertible (42.5 - 84.3, n=47, últimos 2 anos) | |
| HP Spectre x360 14t-ea000 | |
| R Benchmark 2.5 / Overall mean | |
| Samsung Galaxy Book Flex 13.3 | |
| Média Intel Core i5-10310U (0.703 - 0.806, n=5) | |
| Lenovo ThinkPad X1 Yoga 2020-20UCS03S00 | |
| Dell Latitude 5310-23VP6 | |
| HP Spectre x360 14t-ea000 | |
| Média da turma Convertible (0.3915 - 0.84, n=47, últimos 2 anos) | |
* ... menor é melhor
Desempenho do sistema
O desempenho do sistema segue a avaliação do processador: Nenhuma pontuação máxima é alcançada aqui; a concorrência é geralmente mais rápida
| PCMark 10 Score | 3982 pontos | |
Ajuda | ||
| DPC Latencies / LatencyMon - interrupt to process latency (max), Web, Youtube, Prime95 | |
| HP Spectre x360 14t-ea000 | |
| Samsung Galaxy Book Flex 13.3 | |
| Dell Latitude 5310-23VP6 | |
| Lenovo ThinkPad X1 Yoga 2020-20UCS03S00 | |
* ... menor é melhor
Armazenamento
A hnix SK é inferior aos SSDs da Samsung da concorrência em todas as disciplinas. Isto não tem impacto no bom funcionamento do sistema, mas nossos benchmarks mostram lentidão em diversas áreas, como leitura seqüencial.
| Dell Latitude 5310-23VP6 SK hynix BC511 HFM512GDHTNI-87A0B | HP Spectre x360 14t-ea000 Samsung SSD PM981a MZVLB512HBJQ | Samsung Galaxy Book Flex 13.3 Samsung SSD PM981a MZVLB256HBHQ | Lenovo ThinkPad X1 Yoga 2020-20UCS03S00 Samsung SSD PM981a MZVLB512HBJQ | Lenovo Yoga C740-14IML Samsung SSD PM981a MZVLB256HBHQ | Média SK hynix BC511 HFM512GDHTNI-87A0B | |
|---|---|---|---|---|---|---|
| CrystalDiskMark 5.2 / 6 | 54% | 62% | 56% | 46% | 9% | |
| Write 4K (MB/s) | 119.1 | 82.2 -31% | 157.9 33% | 158.5 33% | 125.6 5% | 135.9 ? 14% |
| Read 4K (MB/s) | 43.41 | 45.7 5% | 48.37 11% | 49.78 15% | 43.46 0% | 45.3 ? 4% |
| Write Seq (MB/s) | 1077 | 2000 86% | 2196 104% | 1534 42% | 2011 87% | 1057 ? -2% |
| Read Seq (MB/s) | 1071 | 2206 106% | 2064 93% | 1464 37% | 2046 91% | 1144 ? 7% |
| Write 4K Q32T1 (MB/s) | 348.5 | 451.2 29% | 457 31% | 435.5 25% | 375.8 8% | 458 ? 31% |
| Read 4K Q32T1 (MB/s) | 349.4 | 351 0% | 514 47% | 554 59% | 338.1 -3% | 425 ? 22% |
| Write Seq Q32T1 (MB/s) | 1055 | 2982 183% | 2354 123% | 2984 183% | 2346 122% | 1040 ? -1% |
| Read Seq Q32T1 (MB/s) | 2292 | 3529 54% | 3557 55% | 3557 55% | 3562 55% | 2274 ? -1% |
| Write 4K Q8T8 (MB/s) | 1444 | |||||
| Read 4K Q8T8 (MB/s) | 1052 | |||||
| AS SSD | 30% | 21% | 71% | -13% | -3% | |
| Seq Read (MB/s) | 1796 | 2188 22% | 2637 47% | 2724 52% | 1719 -4% | 1601 ? -11% |
| Seq Write (MB/s) | 741 | 1320 78% | 2000 170% | 2344 216% | 1211 63% | 879 ? 19% |
| 4K Read (MB/s) | 48.33 | 53.5 11% | 52.7 9% | 56.8 18% | 53.1 10% | 48.7 ? 1% |
| 4K Write (MB/s) | 123.3 | 123.7 0% | 148.4 20% | 148.3 20% | 131.4 7% | 114.9 ? -7% |
| 4K-64 Read (MB/s) | 731 | 1010 38% | 647 -11% | 1238 69% | 508 -31% | 764 ? 5% |
| 4K-64 Write (MB/s) | 754 | 1808 140% | 865 15% | 1638 117% | 883 17% | 754 ? 0% |
| Access Time Read * (ms) | 0.04 | 0.055 -38% | 0.072 -80% | 0.035 12% | 0.05 -25% | 0.0535 ? -34% |
| Access Time Write * (ms) | 0.031 | 0.076 -145% | 0.026 16% | 0.025 19% | 0.085 -174% | 0.034 ? -10% |
| Score Read (Points) | 959 | 1282 34% | 963 0% | 1567 63% | 733 -24% | 973 ? 1% |
| Score Write (Points) | 952 | 2063 117% | 1214 28% | 2021 112% | 1135 19% | 957 ? 1% |
| Score Total (Points) | 2362 | 3970 68% | 2653 12% | 4381 85% | 2235 -5% | 2405 ? 2% |
| Copy ISO MB/s (MB/s) | 1644 | 2191 | 1636 | 653 ? | ||
| Copy Program MB/s (MB/s) | 920 | 570 | 698 | 326 ? | ||
| Copy Game MB/s (MB/s) | 1725 | 1131 | 1246 | 544 ? | ||
| Média Total (Programa/Configurações) | 42% /
40% | 42% /
38% | 64% /
65% | 17% /
11% | 3% /
2% |
* ... menor é melhor

Continuous load read: DiskSpd Read Loop, Queue Depth 8
Placa gráfica
A integraçãoUHD Graphics 620 é o próprio processador gráfico da Intel para o mais simples suporte de hardware. Desta forma, o iGPU ajuda a decodificar vídeos como, por exemplo, ao assistir material em HD ou 4K no YouTube.
OUHD 620 não é realmente destinado a jogos, a menos que sejam jogos da Microsoft Store. As áreas vermelhas de nossa pequena rodada de jogos mostram que não há muito o que obter mesmo com títulos mais antigos. Devido à memória de um canal, oUHD 620 tem um desempenho um pouco pior que o normal.
| 3DMark Fire Strike Score | 1079 pontos | |
Ajuda | ||
| The Witcher 3 | |
| 1024x768 Low Graphics & Postprocessing | |
| HP Spectre x360 14t-ea000 | |
| Média da turma Convertible (22 - 124.6, n=3, últimos 2 anos) | |
| Samsung Galaxy Book Flex 13.3 | |
| Média Intel UHD Graphics 620 (8.8 - 50.9, n=64) | |
| Dell Latitude 5310-23VP6 | |
| 1366x768 Medium Graphics & Postprocessing | |
| Média da turma Convertible (44.3 - 77.6, n=2, últimos 2 anos) | |
| HP Spectre x360 14t-ea000 | |
| Samsung Galaxy Book Flex 13.3 | |
| Média Intel UHD Graphics 620 (8 - 27.9, n=29) | |
| Dell Latitude 5310-23VP6 | |
| Strange Brigade | |
| 1280x720 lowest AF:1 | |
| Média da turma Convertible (27.6 - 484, n=46, últimos 2 anos) | |
| Média Intel UHD Graphics 620 (17 - 31, n=5) | |
| Dell Latitude 5310-23VP6 | |
| 1920x1080 medium AA:medium AF:4 | |
| Média da turma Convertible (14.9 - 224, n=45, últimos 2 anos) | |
| Média Intel UHD Graphics 620 (7 - 12.5, n=5) | |
| Dell Latitude 5310-23VP6 | |
| baixo | média | alto | ultra | |
|---|---|---|---|---|
| GTA IV - Grand Theft Auto (2008) | 31 | 27 | 6 | |
| The Witcher 3 (2015) | 15.7 | 10.6 | ||
| Dota 2 Reborn (2015) | 71 | 37.6 | 18.4 | 16.8 |
| X-Plane 11.11 (2018) | 8.7 | 7.9 | 7.94 | |
| Strange Brigade (2018) | 18 | 10 |
Emissões: Latitude silencioso como um sussurro
Emissões sonoras
O Latitude tem um ventilador? Você certamente pode se encontrar fazendo esta pergunta ao usar o laptop no escritório para navegar na web e documentos Word, porque o pequeno ventilador quase nunca faz efeito. As chances de ter uma operação de sussurro-assossego são muito boas com o 5530. Entretanto, ouvimos isso durante a carga contínua, primeiro a 30 dB(A), depois a 36 dB(A) no teste de estresse.
Barulho
| Ocioso |
| 24.9 / 24.9 / 24.9 dB |
| Carga |
| 30 / 36.3 dB |
 | ||
30 dB silencioso 40 dB(A) audível 50 dB(A) ruidosamente alto |
||
min: | ||
Temperatura
As temperaturas sobem consideravelmente, até quase 45 °C (~113 °F) sob carga constante (em certos pontos). Entretanto, mesmo neste estado, o apoio de palma e a área central do teclado permanecem razoavelmente tépidos a 25 a 35 °C (~77 a ~95 °F)
(+) A temperatura máxima no lado superior é 39 °C / 102 F, em comparação com a média de 35.4 °C / 96 F , variando de 19.6 a 60 °C para a classe Convertible.
(±) A parte inferior aquece até um máximo de 44.8 °C / 113 F, em comparação com a média de 36.9 °C / 98 F
(+) Em uso inativo, a temperatura média para o lado superior é 23.2 °C / 74 F, em comparação com a média do dispositivo de 30.3 °C / ### class_avg_f### F.
(±) Jogando The Witcher 3, a temperatura média para o lado superior é 33.1 °C / 92 F, em comparação com a média do dispositivo de 30.3 °C / ## #class_avg_f### F.
(+) Os apoios para as mãos e o touchpad são mais frios que a temperatura da pele, com um máximo de 29 °C / 84.2 F e, portanto, são frios ao toque.
(±) A temperatura média da área do apoio para as mãos de dispositivos semelhantes foi 28 °C / 82.4 F (-1 °C / -1.8 F).
Oradores
Os pequenos alto-falantes estão localizados à direita e à esquerda sob o apoio da palma da mão, e o som ricocheteia na parte superior da mesa. O som tem médios equilibrados, mas os graves não estão presentes de forma alguma.
A boa captação do microfone com o microfone de dois raios ao lado da webcam é louvável. Esta é uma excelente qualidade para videoconferência.
Dell Latitude 5310-23VP6 análise de áudio
(-) | alto-falantes não muito altos (###valor### dB)
Graves 100 - 315Hz
(±) | graves reduzidos - em média 14.7% menor que a mediana
(±) | a linearidade dos graves é média (10.5% delta para a frequência anterior)
Médios 400 - 2.000 Hz
(+) | médios equilibrados - apenas 3.7% longe da mediana
(+) | médios são lineares (5.7% delta para frequência anterior)
Altos 2 - 16 kHz
(+) | agudos equilibrados - apenas 2.1% longe da mediana
(+) | os máximos são lineares (5% delta da frequência anterior)
Geral 100 - 16.000 Hz
(+) | o som geral é linear (13.8% diferença em relação à mediana)
Comparado com a mesma classe
» 19% de todos os dispositivos testados nesta classe foram melhores, 4% semelhantes, 77% piores
» O melhor teve um delta de 6%, a média foi 20%, o pior foi 57%
Comparado com todos os dispositivos testados
» 15% de todos os dispositivos testados foram melhores, 4% semelhantes, 81% piores
» O melhor teve um delta de 4%, a média foi 23%, o pior foi 134%
Samsung Galaxy Book Flex 13.3 análise de áudio
(-) | alto-falantes não muito altos (###valor### dB)
Graves 100 - 315Hz
(-) | quase nenhum baixo - em média 22% menor que a mediana
(±) | a linearidade dos graves é média (11.9% delta para a frequência anterior)
Médios 400 - 2.000 Hz
(+) | médios equilibrados - apenas 2.4% longe da mediana
(+) | médios são lineares (5.8% delta para frequência anterior)
Altos 2 - 16 kHz
(+) | agudos equilibrados - apenas 4.5% longe da mediana
(±) | a linearidade dos máximos é média (7.1% delta para frequência anterior)
Geral 100 - 16.000 Hz
(±) | a linearidade do som geral é média (22.6% diferença em relação à mediana)
Comparado com a mesma classe
» 68% de todos os dispositivos testados nesta classe foram melhores, 5% semelhantes, 27% piores
» O melhor teve um delta de 6%, a média foi 20%, o pior foi 57%
Comparado com todos os dispositivos testados
» 67% de todos os dispositivos testados foram melhores, 6% semelhantes, 28% piores
» O melhor teve um delta de 4%, a média foi 23%, o pior foi 134%
Energia e duração da bateria: 11 horas de funcionamento
Consumo de energia
Em comparação com a classe do laptop, o consumo de energia é muito baixo com três a quase sete watts. Sob carga, ele aumenta brevemente para 55 watts e depois permanece em torno de 49 watts no teste de estresse. A carga moderada se manifesta em 42 watts. A concorrência é muitas vezes mais forte neste aspecto, especialmente durante a carga máxima. É mostrado aqui que a Dell reduziu o TDP máximo de curto prazo (PL1)
| desligado | |
| Ocioso | |
| Carga |
|
Key:
min: | |
| Dell Latitude 5310-23VP6 i5-10310U, UHD Graphics 620, SK hynix BC511 HFM512GDHTNI-87A0B, IPS, 1920x1080, 13.3" | HP Spectre x360 14t-ea000 i7-1165G7, Iris Xe G7 96EUs, Samsung SSD PM981a MZVLB512HBJQ, IPS, 1920x1280, 13.5" | Samsung Galaxy Book Flex 13.3 i5-1035G4, Iris Plus Graphics G4 (Ice Lake 48 EU), Samsung SSD PM981a MZVLB256HBHQ, IPS, 1920x1080, 13.3" | Lenovo ThinkPad X1 Yoga 2020-20UCS03S00 i7-10510U, UHD Graphics 620, Samsung SSD PM981a MZVLB512HBJQ, IPS LED, 1920x1080, 14" | Lenovo Yoga C740-14IML i5-10210U, UHD Graphics 620, Samsung SSD PM981a MZVLB256HBHQ, IPS, 1920x1080, 14" | Média Intel UHD Graphics 620 | Média da turma Convertible | |
|---|---|---|---|---|---|---|---|
| Power Consumption | 3% | -7% | -16% | -2% | -12% | -26% | |
| Idle Minimum * (Watt) | 2.9 | 3 -3% | 3.3 -14% | 2.9 -0% | 3 -3% | 3.81 ? -31% | 4.2 ? -45% |
| Idle Average * (Watt) | 5.9 | 5.1 14% | 8.9 -51% | 6 -2% | 3.9 34% | 6.94 ? -18% | 6.89 ? -17% |
| Idle Maximum * (Watt) | 6.7 | 6.4 4% | 10.4 -55% | 9.6 -43% | 7.3 -9% | 8.75 ? -31% | 8.63 ? -29% |
| Load Average * (Watt) | 42 | 39.6 6% | 40 5% | 42.6 -1% | 42.5 -1% | 35 ? 17% | 44.1 ? -5% |
| Witcher 3 ultra * (Watt) | 43 | 39.6 8% | 28 35% | ||||
| Load Maximum * (Watt) | 50 | 56.2 -12% | 32 36% | 67.3 -35% | 65.5 -31% | 47.5 ? 5% | 66.5 ? -33% |
* ... menor é melhor
Duração da bateria
O tempo de execução de 11 horas no teste Wi-Fi onde a navegação na web é realizada com um brilho de 150 cd/m² supera alguns modelos concorrentes, exceto o Spectre x360 com suas 66 horas watt
| Dell Latitude 5310-23VP6 i5-10310U, UHD Graphics 620, 60 Wh | HP Spectre x360 14t-ea000 i7-1165G7, Iris Xe G7 96EUs, 66 Wh | Samsung Galaxy Book Flex 13.3 i5-1035G4, Iris Plus Graphics G4 (Ice Lake 48 EU), 69.7 Wh | Lenovo ThinkPad X1 Yoga 2020-20UCS03S00 i7-10510U, UHD Graphics 620, 51 Wh | Lenovo Yoga C740-14IML i5-10210U, UHD Graphics 620, 51 Wh | Média da turma Convertible | |
|---|---|---|---|---|---|---|
| Duração da bateria | 6% | -35% | -2% | -17% | 8% | |
| WiFi v1.3 (h) | 11.1 | 11.8 6% | 7.2 -35% | 10.9 -2% | 9.2 -17% | 12 ? 8% |
| Reader / Idle (h) | 36.4 | 11.6 | 21.6 | 18.6 | 26.7 ? | |
| Load (h) | 2.4 | 2.6 | 2 | 1.7 | 1.713 ? | |
| H.264 (h) | 9.3 | 15 ? |
Pro
Contra
Veredicto
O Dell Latitude 5310 é um dispositivo de trabalho silencioso 2 em 1 de 13 polegadas que não impressiona com o desempenho, mas combina numerosas vantagens ergonômicas e de design. Enquanto o Core i5-10310U não desenvolve totalmente seu desempenho, o usuário se beneficia de uma operação que é na maioria das vezes sussurrante, um longo tempo de funcionamento (11 horas em nosso teste Wi-Fi), e geração moderada de calor
A tela sensível ao toque é apropriada para seu propósito em termos de brilho e contraste, mas não é um destaque. A reprodução de cores e a cobertura do espaço de cores são aspectos melhores, e o equipamento de 13 polegadas supera a concorrência aqui
Você tem que lidar com a tela sensível ao toque brilhante se quiser a versão 2 em 1. Caso contrário, há uma alternativa Latitude 5310 em formato clamshell. A aparência e as portas são quase idênticas
As opções de manutenção são um sucesso em qualquer caso. Todos os componentes, exceto o SoC, podem ser facilmente removidos e substituídos, inclusive a bateria. A Dell tem um manual de serviço online para isso.
Preço e disponibilidade
A variante da Dell Latitude 5310-23VP6 que analisamos está atualmente disponível por 1.400 Euros (~$1.722) em notebooksbilliger.
O menos caro modelo de nível básico com 256 GB de armazenamento e 8 GB de RAM custa consideravelmente menos, um pouco menos de 1.200 euros (~$1.476).
Dell Latitude 5310-23VP6
- 12/29/2020 v7 (old)
Sebastian Jentsch
Price comparison

