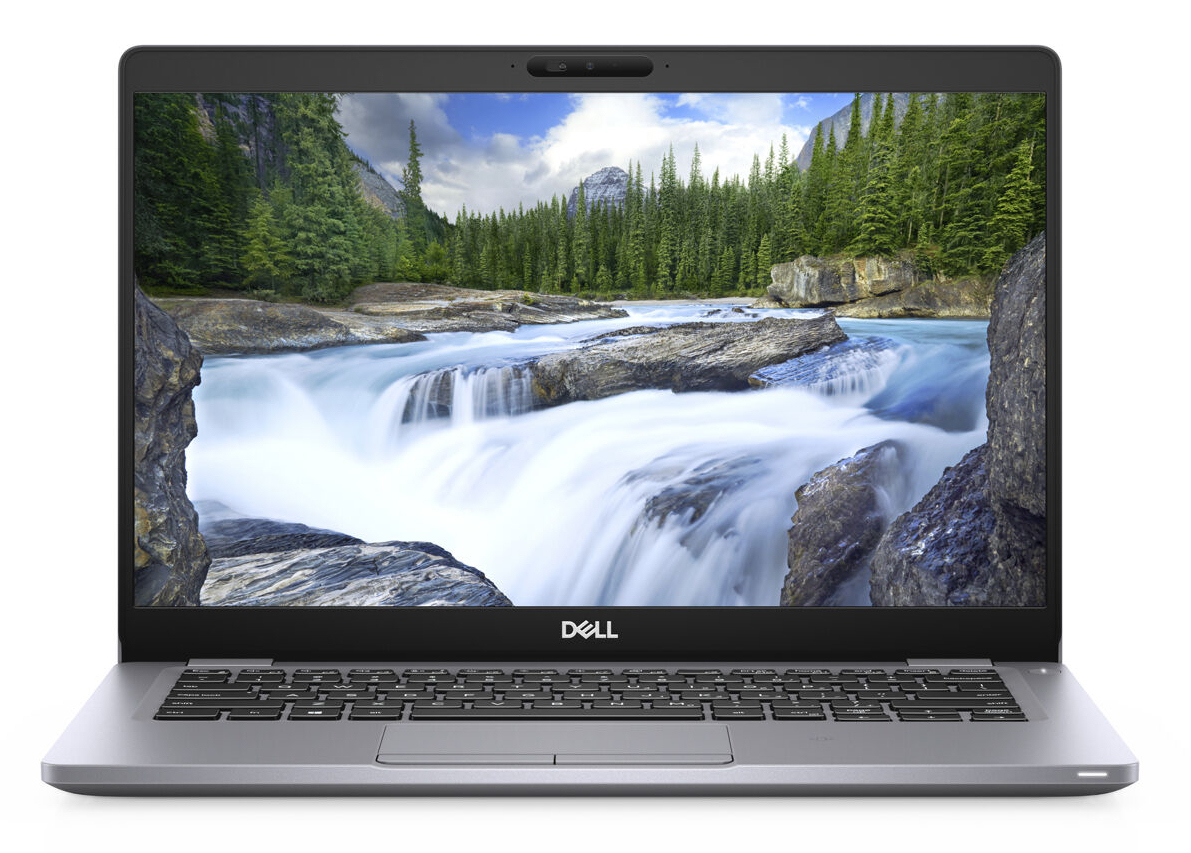
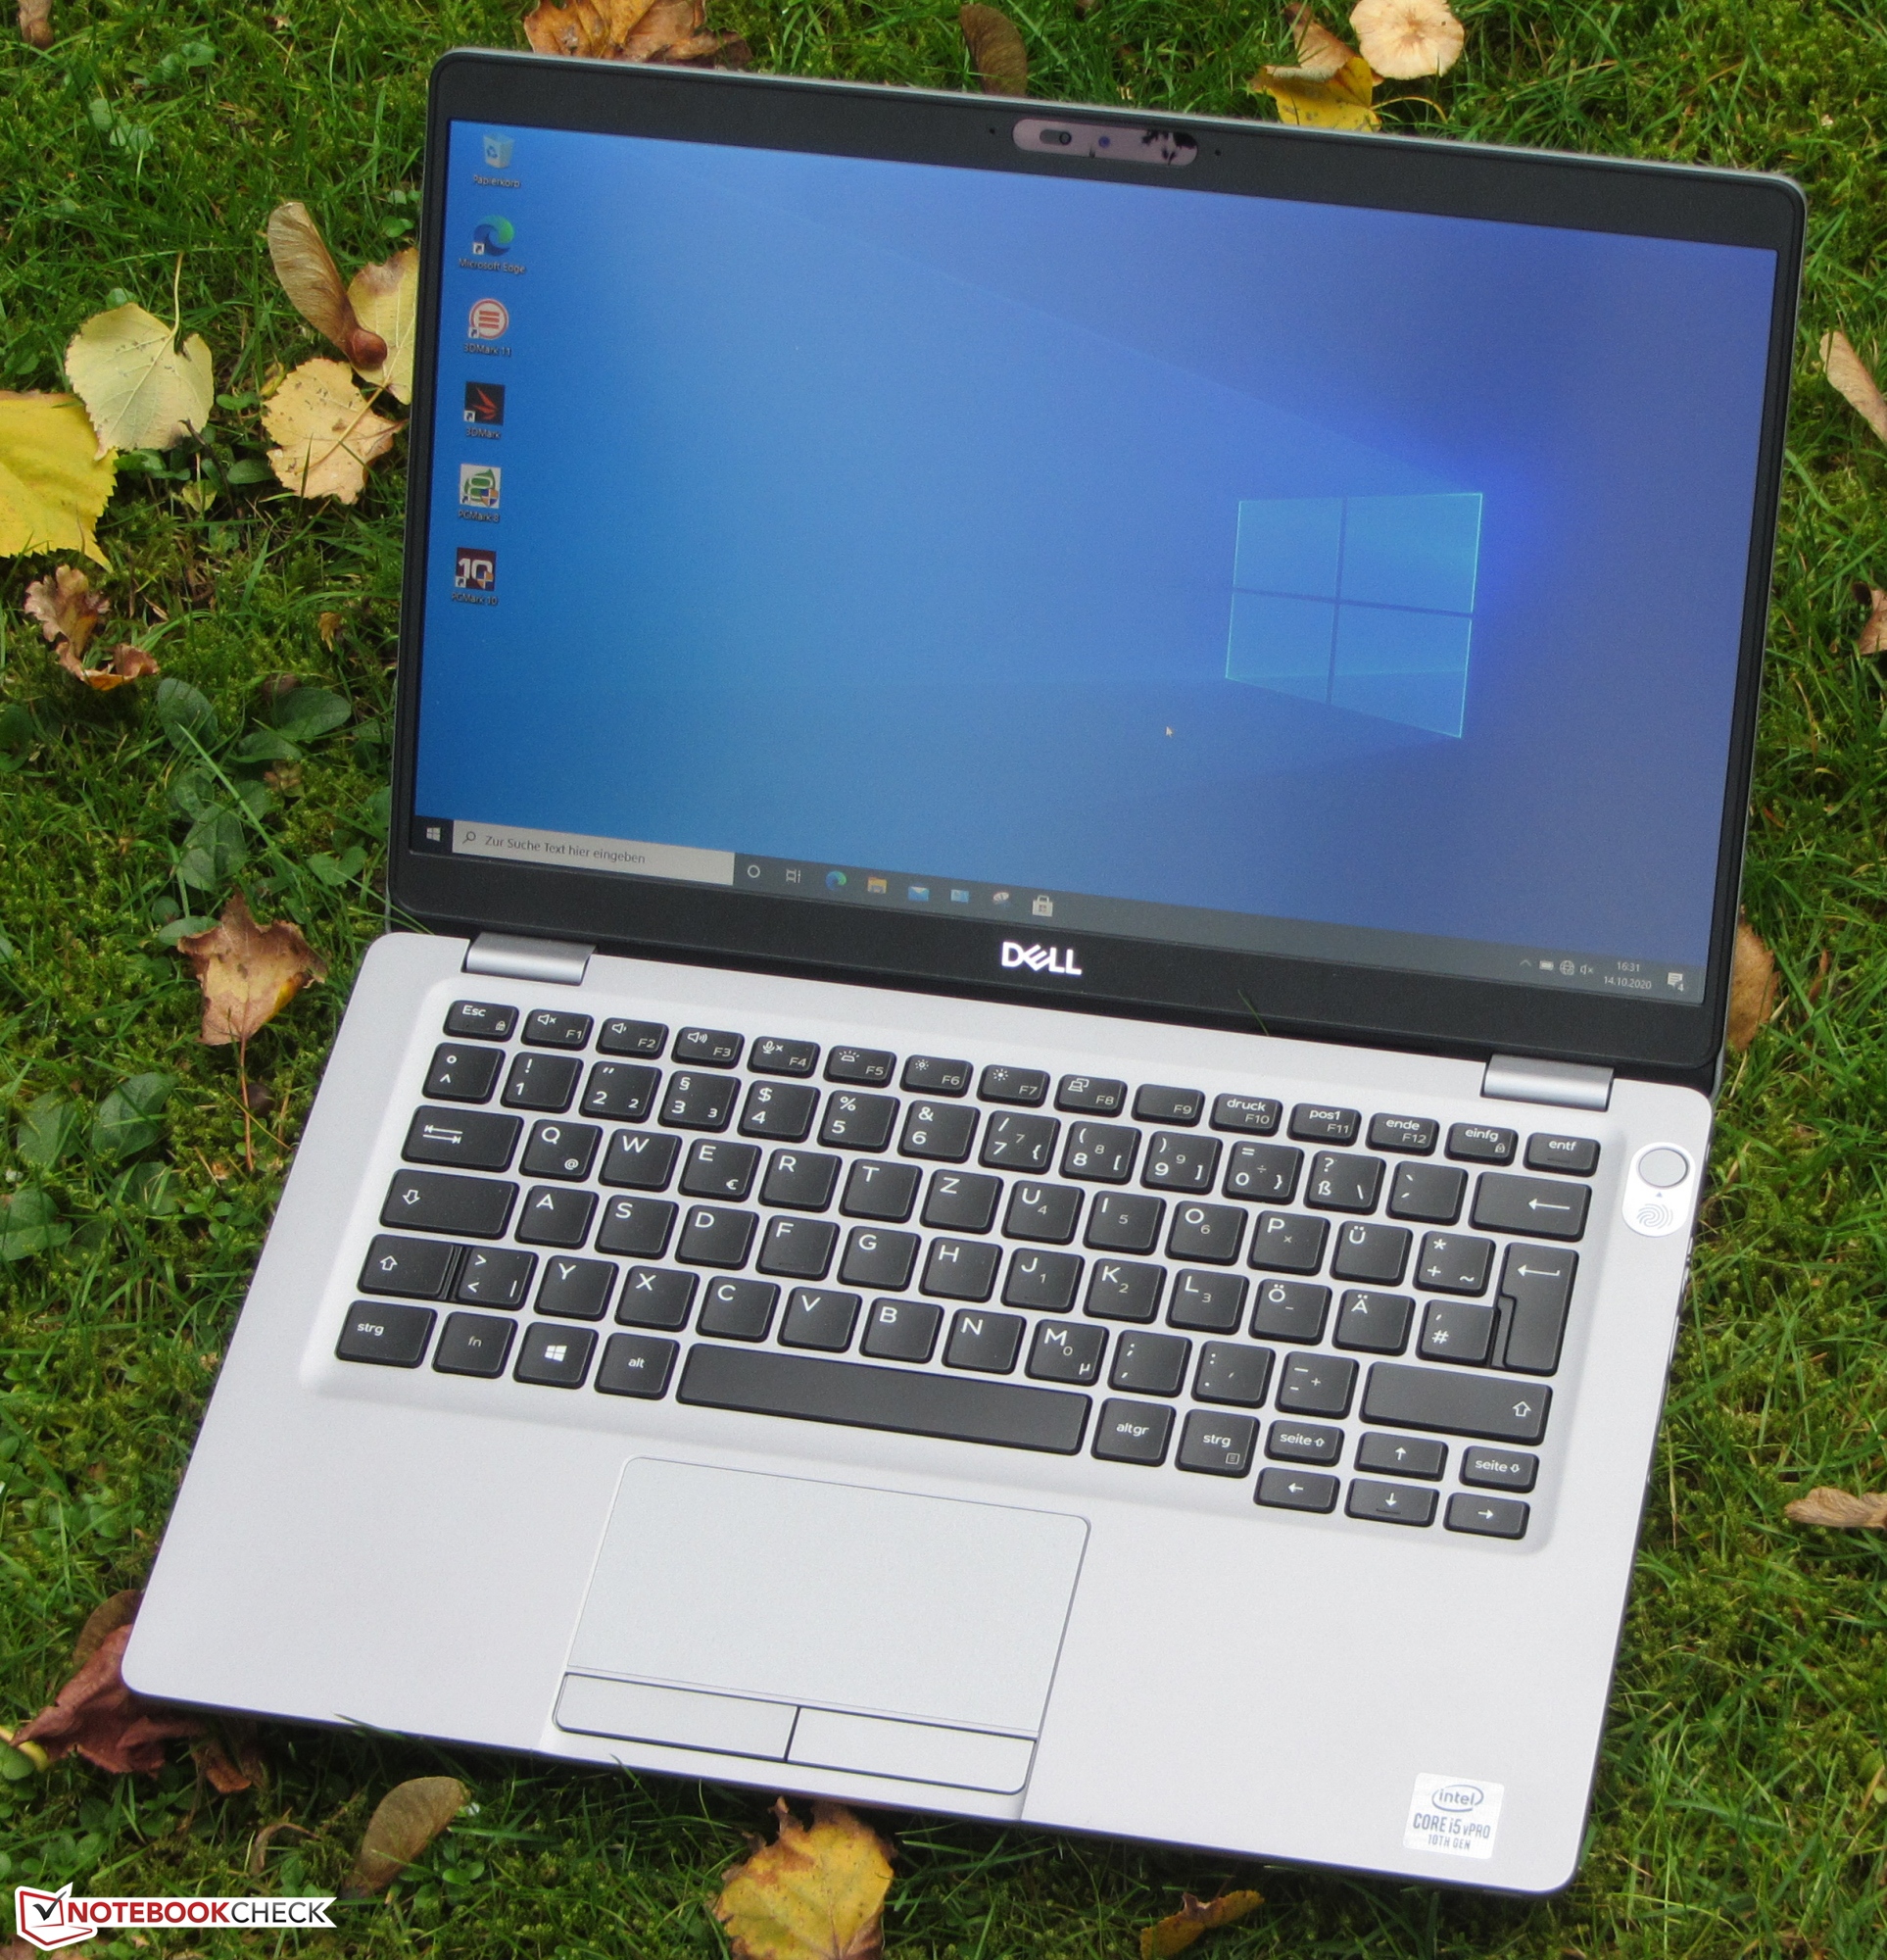
Breve Análise do Dell Latitude 5310: Portátil empresarial com longa duração da bateria
Avaliação | Data | Modelo | Peso | Altura | Size | Resolução | Preço |
|---|---|---|---|---|---|---|---|
| 86.8 % v7 (old) | 10/2020 | Dell Latitude 5310-GXX0D i5-10310U, UHD Graphics 620 | 1.2 kg | 19.7 mm | 13.30" | 1920x1080 | |
| 88.7 % v7 (old) | 09/2020 | HP EliteBook 830 G7 i7-10810U, UHD Graphics 620 | 1.3 kg | 18.1 mm | 13.30" | 1920x1080 | |
| 83.7 % v7 (old) | Fujitsu Lifebook U939 i5 i5-8265U, UHD Graphics 620 | 900 g | 15 mm | 13.30" | 1920x1080 | ||
| 85.1 % v7 (old) | Dynabook Portege X30L-G1331 i5-10210U, UHD Graphics 620 | 859 g | 17.9 mm | 13.30" | 1920x1080 | ||
| 89.5 % v7 (old) | 08/2020 | Lenovo ThinkPad X13-20UGS00800 R7 PRO 4750U, Vega 7 | 1.3 kg | 16.9 mm | 13.30" | 1920x1080 | |
| 88 % v7 (old) | 08/2020 | Lenovo ThinkPad X13-20T20033GE i5-10210U, UHD Graphics 620 | 1.3 kg | 16.9 mm | 13.30" | 1920x1080 |

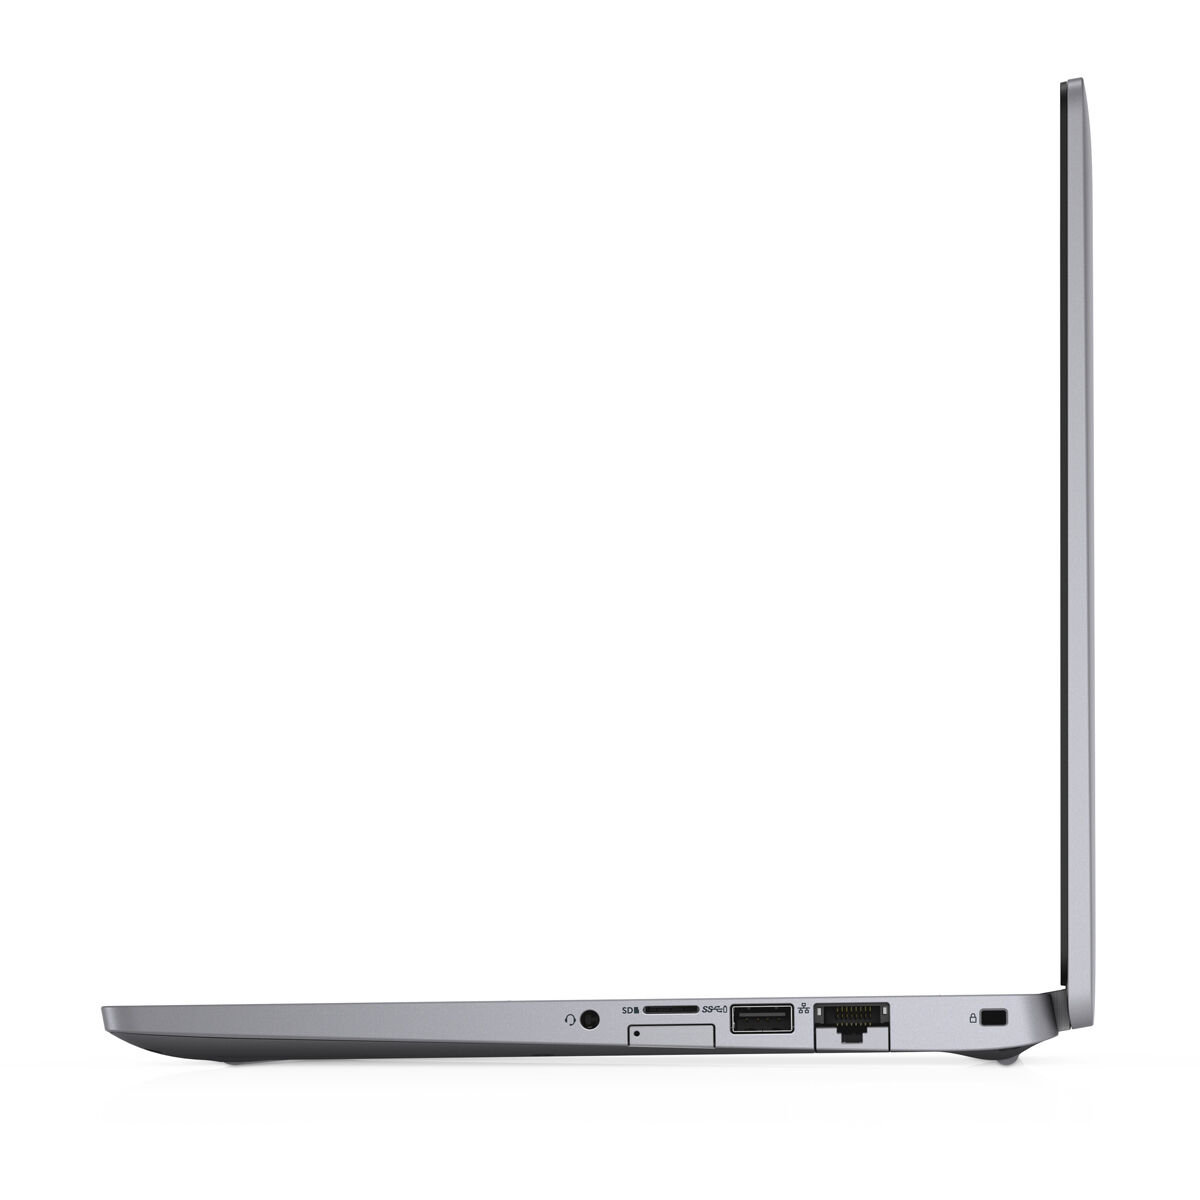
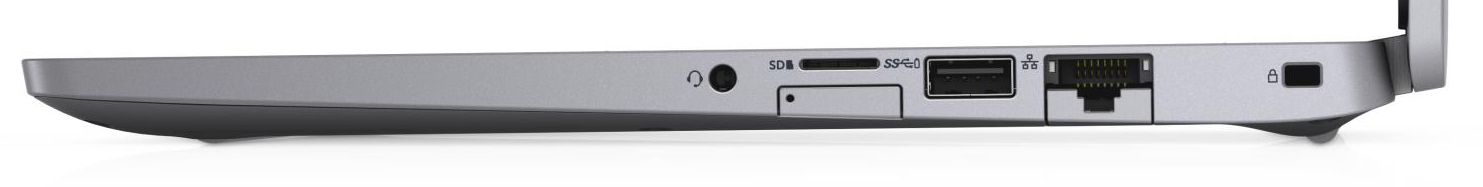
| SD Card Reader | |
| average JPG Copy Test (av. of 3 runs) | |
| Fujitsu Lifebook U939 i5 (Toshiba Exceria Pro SDXC 64 GB UHS-II) | |
| Dell Latitude 5310-GXX0D (Toshiba Exceria Pro M501 microSDXC 64GB) | |
| Dynabook Portege X30L-G1331 (Toshiba Exceria Pro M501 64 GB UHS-II) | |
| Média da turma Subnotebook (23.7 - 188, n=9, últimos 2 anos) | |
| Lenovo ThinkPad X13-20UGS00800 (Toshiba Exceria Pro M501 64 GB UHS-II) | |
| Lenovo ThinkPad X13-20T20033GE (Toshiba Exceria Pro M501 64 GB UHS-II) | |
| maximum AS SSD Seq Read Test (1GB) | |
| Dell Latitude 5310-GXX0D (Toshiba Exceria Pro M501 microSDXC 64GB) | |
| Fujitsu Lifebook U939 i5 (Toshiba Exceria Pro SDXC 64 GB UHS-II) | |
| Média da turma Subnotebook (24.9 - 195, n=8, últimos 2 anos) | |
| Dynabook Portege X30L-G1331 (Toshiba Exceria Pro M501 64 GB UHS-II) | |
| Lenovo ThinkPad X13-20UGS00800 (Toshiba Exceria Pro M501 64 GB UHS-II) | |
| Lenovo ThinkPad X13-20T20033GE (Toshiba Exceria Pro M501 64 GB UHS-II) | |
| Networking | |
| iperf3 transmit AX12 | |
| Dell Latitude 5310-GXX0D | |
| Dynabook Portege X30L-G1331 | |
| Média Intel Wi-Fi 6 AX201 (49.8 - 1775, n=324) | |
| HP EliteBook 830 G7 | |
| Lenovo ThinkPad X13-20UGS00800 | |
| Lenovo ThinkPad X13-20T20033GE | |
| Fujitsu Lifebook U939 i5 | |
| iperf3 receive AX12 | |
| Lenovo ThinkPad X13-20T20033GE | |
| Dell Latitude 5310-GXX0D | |
| HP EliteBook 830 G7 | |
| Lenovo ThinkPad X13-20UGS00800 | |
| Média Intel Wi-Fi 6 AX201 (136 - 1743, n=324) | |
| Dynabook Portege X30L-G1331 | |
| Fujitsu Lifebook U939 i5 | |


| |||||||||||||||||||||||||
iluminação: 83 %
iluminação com acumulador: 303 cd/m²
Contraste: 927:1 (Preto: 0.33 cd/m²)
ΔE ColorChecker Calman: 6.89 | ∀{0.5-29.43 Ø4.71}
ΔE Greyscale Calman: 7.32 | ∀{0.09-98 Ø4.96}
93% sRGB (Argyll 1.6.3 3D)
59% AdobeRGB 1998 (Argyll 1.6.3 3D)
63.2% AdobeRGB 1998 (Argyll 3D)
90.8% sRGB (Argyll 3D)
61.8% Display P3 (Argyll 3D)
Gamma: 3.74
CCT: 6101 K
| Dell Latitude 5310-GXX0D LG Philips LP133WF7-SPF1, IPS, 1920x1080, 13.3" | HP EliteBook 830 G7 Chi Mei CMN13A9, IPS, 1920x1080, 13.3" | Fujitsu Lifebook U939 i5 Sharp SHP14BD, IPS, 1920x1080, 13.3" | Dynabook Portege X30L-G1331 Toshiba TOS508F, IPS, 1920x1080, 13.3" | Lenovo ThinkPad X13-20UGS00800 B133HAK01.1, IPS LED, 1920x1080, 13.3" | Lenovo ThinkPad X13-20T20033GE Lenovo B133HAK01.1, IPS, 1920x1080, 13.3" | |
|---|---|---|---|---|---|---|
| Display | 7% | 5% | 7% | 5% | 6% | |
| Display P3 Coverage (%) | 61.8 | 65.7 6% | 65.3 6% | 66.9 8% | 64.8 5% | 66 7% |
| sRGB Coverage (%) | 90.8 | 97.4 7% | 95 5% | 97.6 7% | 95.6 5% | 96.2 6% |
| AdobeRGB 1998 Coverage (%) | 63.2 | 67.4 7% | 66 4% | 67.8 7% | 65.7 4% | 67.2 6% |
| Response Times | 4% | -1% | -9% | -3% | 3% | |
| Response Time Grey 50% / Grey 80% * (ms) | 51 ? | 46.8 ? 8% | 55.2 ? -8% | 54.8 ? -7% | 56.8 ? -11% | 52.8 ? -4% |
| Response Time Black / White * (ms) | 32 ? | 32 ? -0% | 29.6 ? 7% | 35.6 ? -11% | 30 ? 6% | 29.2 ? 9% |
| PWM Frequency (Hz) | 26600 ? | 211.9 ? | 23810 ? | |||
| Screen | 39% | 16% | 36% | 18% | 18% | |
| Brightness middle (cd/m²) | 306 | 454.5 49% | 384 25% | 482 58% | 331 8% | 359 17% |
| Brightness (cd/m²) | 293 | 435 48% | 362 24% | 452 54% | 315 8% | 342 17% |
| Brightness Distribution (%) | 83 | 91 10% | 90 8% | 91 10% | 90 8% | 90 8% |
| Black Level * (cd/m²) | 0.33 | 0.27 18% | 0.31 6% | 0.4 -21% | 0.21 36% | 0.21 36% |
| Contrast (:1) | 927 | 1683 82% | 1239 34% | 1205 30% | 1576 70% | 1710 84% |
| Colorchecker dE 2000 * | 6.89 | 3.12 55% | 4.8 30% | 1.85 73% | 6.1 11% | 6.7 3% |
| Colorchecker dE 2000 max. * | 11.66 | 4.85 58% | 9.4 19% | 3.08 74% | 10 14% | 10.9 7% |
| Greyscale dE 2000 * | 7.32 | 3.1 58% | 6.6 10% | 2 73% | 6.3 14% | 7.4 -1% |
| Gamma | 3.74 59% | 2.01 109% | 2.2 100% | 2.1 105% | 2.77 79% | 2.85 77% |
| CCT | 6101 107% | 6902 94% | 7999 81% | 6822 95% | 6938 94% | 6309 103% |
| Color Space (Percent of AdobeRGB 1998) (%) | 59 | 61.5 4% | 61.2 4% | 62.5 6% | 60.7 3% | 61.7 5% |
| Color Space (Percent of sRGB) (%) | 93 | 97 4% | 95 2% | 97.7 5% | 95.4 3% | 95.9 3% |
| Colorchecker dE 2000 calibrated * | 1.97 | 1.4 | 1.2 | 1.2 | 1.3 | |
| Média Total (Programa/Configurações) | 17% /
28% | 7% /
12% | 11% /
24% | 7% /
12% | 9% /
14% |
* ... menor é melhor
Exibir tempos de resposta
| ↔ Tempo de resposta preto para branco | ||
|---|---|---|
| 32 ms ... ascensão ↗ e queda ↘ combinadas | ↗ 18 ms ascensão | 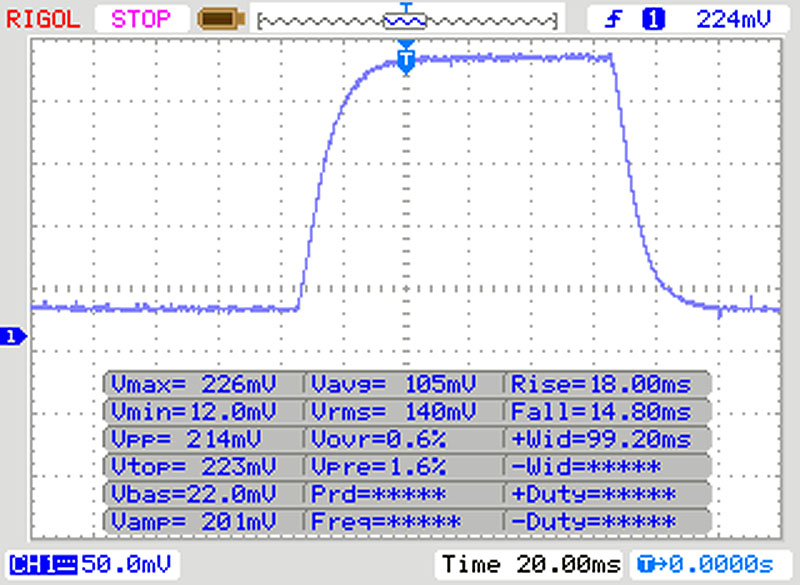 |
| ↘ 14 ms queda | ||
| A tela mostra taxas de resposta lentas em nossos testes e será insatisfatória para os jogadores. Em comparação, todos os dispositivos testados variam de 0.1 (mínimo) a 240 (máximo) ms. » 86 % de todos os dispositivos são melhores. Isso significa que o tempo de resposta medido é pior que a média de todos os dispositivos testados (19.8 ms). | ||
| ↔ Tempo de resposta 50% cinza a 80% cinza | ||
| 51 ms ... ascensão ↗ e queda ↘ combinadas | ↗ 23 ms ascensão | 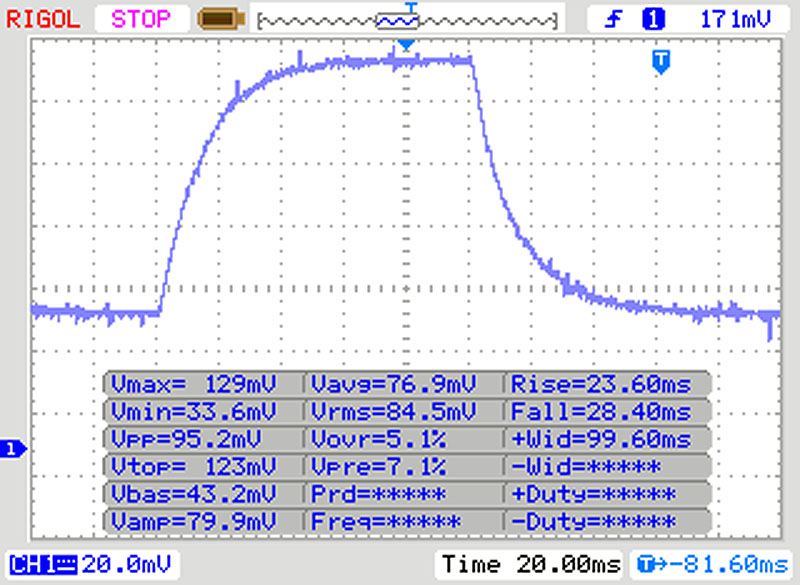 |
| ↘ 28 ms queda | ||
| A tela mostra taxas de resposta lentas em nossos testes e será insatisfatória para os jogadores. Em comparação, todos os dispositivos testados variam de 0.165 (mínimo) a 636 (máximo) ms. » 87 % de todos os dispositivos são melhores. Isso significa que o tempo de resposta medido é pior que a média de todos os dispositivos testados (30.9 ms). | ||
Cintilação da tela / PWM (modulação por largura de pulso)
| Tela tremeluzindo / PWM não detectado | 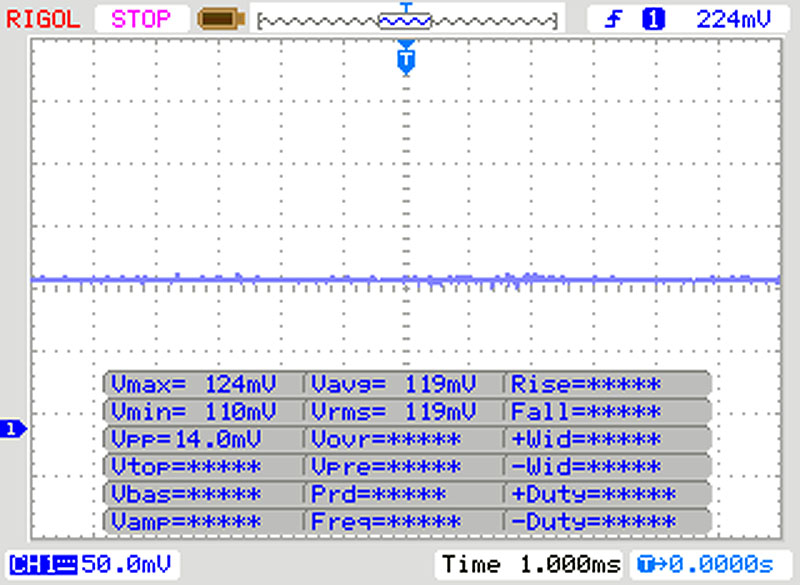 | ||
[pwm_comparison] Em comparação: 52 % de todos os dispositivos testados não usam PWM para escurecer a tela. Se PWM foi detectado, uma média de 7748 (mínimo: 5 - máximo: 343500) Hz foi medida. | |||

| Cinebench R15 | |
| CPU Single 64Bit | |
| Média da turma Subnotebook (72.4 - 322, n=57, últimos 2 anos) | |
| Lenovo ThinkPad X13-20UGS00800 | |
| HP EliteBook 830 G7 | |
| Dell Latitude 5310-GXX0D | |
| Média Intel Core i5-10310U (164 - 173.8, n=5) | |
| Lenovo ThinkPad X13-20T20033GE | |
| Dynabook Portege X30L-G1331 | |
| Fujitsu Lifebook U939 i5 | |
| CPU Multi 64Bit | |
| Média da turma Subnotebook (327 - 3345, n=57, últimos 2 anos) | |
| Lenovo ThinkPad X13-20UGS00800 | |
| Lenovo ThinkPad X13-20T20033GE | |
| Dell Latitude 5310-GXX0D | |
| Média Intel Core i5-10310U (499 - 767, n=5) | |
| Fujitsu Lifebook U939 i5 | |
| Dynabook Portege X30L-G1331 | |
| Blender - v2.79 BMW27 CPU | |
| Fujitsu Lifebook U939 i5 | |
| Dynabook Portege X30L-G1331 | |
| Média Intel Core i5-10310U (683 - 896, n=5) | |
| Lenovo ThinkPad X13-20T20033GE | |
| HP EliteBook 830 G7 | |
| Dell Latitude 5310-GXX0D | |
| Lenovo ThinkPad X13-20UGS00800 | |
| Média da turma Subnotebook (159 - 2271, n=58, últimos 2 anos) | |
| 7-Zip 18.03 | |
| 7z b 4 -mmt1 | |
| Média da turma Subnotebook (2643 - 6699, n=59, últimos 2 anos) | |
| HP EliteBook 830 G7 | |
| Lenovo ThinkPad X13-20UGS00800 | |
| Dynabook Portege X30L-G1331 | |
| Lenovo ThinkPad X13-20T20033GE | |
| Dell Latitude 5310-GXX0D | |
| Média Intel Core i5-10310U (3615 - 4398, n=5) | |
| Fujitsu Lifebook U939 i5 | |
| 7z b 4 | |
| Média da turma Subnotebook (11668 - 77867, n=57, últimos 2 anos) | |
| Lenovo ThinkPad X13-20UGS00800 | |
| HP EliteBook 830 G7 | |
| Dell Latitude 5310-GXX0D | |
| Lenovo ThinkPad X13-20T20033GE | |
| Média Intel Core i5-10310U (15976 - 19935, n=5) | |
| Dynabook Portege X30L-G1331 | |
| Fujitsu Lifebook U939 i5 | |
| Cinebench R20 | |
| CPU (Single Core) | |
| Média da turma Subnotebook (128 - 832, n=57, últimos 2 anos) | |
| Lenovo ThinkPad X13-20UGS00800 | |
| HP EliteBook 830 G7 | |
| Dell Latitude 5310-GXX0D | |
| Média Intel Core i5-10310U (411 - 438, n=5) | |
| Dynabook Portege X30L-G1331 | |
| Fujitsu Lifebook U939 i5 | |
| Lenovo ThinkPad X13-20T20033GE | |
| CPU (Multi Core) | |
| Média da turma Subnotebook (579 - 8541, n=57, últimos 2 anos) | |
| Lenovo ThinkPad X13-20UGS00800 | |
| Dell Latitude 5310-GXX0D | |
| HP EliteBook 830 G7 | |
| Lenovo ThinkPad X13-20T20033GE | |
| Média Intel Core i5-10310U (1192 - 1588, n=5) | |
| Fujitsu Lifebook U939 i5 | |
| Dynabook Portege X30L-G1331 | |
| Geekbench 5.5 | |
| Single-Core | |
| Média da turma Subnotebook (726 - 2224, n=49, últimos 2 anos) | |
| HP EliteBook 830 G7 | |
| Lenovo ThinkPad X13-20UGS00800 | |
| Dell Latitude 5310-GXX0D | |
| Média Intel Core i5-10310U (1040 - 1128, n=6) | |
| Dynabook Portege X30L-G1331 | |
| Lenovo ThinkPad X13-20T20033GE | |
| Fujitsu Lifebook U939 i5 | |
| Multi-Core | |
| Média da turma Subnotebook (2557 - 17218, n=49, últimos 2 anos) | |
| Lenovo ThinkPad X13-20UGS00800 | |
| Lenovo ThinkPad X13-20T20033GE | |
| Dell Latitude 5310-GXX0D | |
| HP EliteBook 830 G7 | |
| Dynabook Portege X30L-G1331 | |
| Fujitsu Lifebook U939 i5 | |
| Média Intel Core i5-10310U (2821 - 3854, n=6) | |
| HWBOT x265 Benchmark v2.2 - 4k Preset | |
| Média da turma Subnotebook (0.97 - 25.1, n=57, últimos 2 anos) | |
| Lenovo ThinkPad X13-20UGS00800 | |
| Dell Latitude 5310-GXX0D | |
| HP EliteBook 830 G7 | |
| Lenovo ThinkPad X13-20T20033GE | |
| Média Intel Core i5-10310U (3.88 - 5.35, n=5) | |
| Dynabook Portege X30L-G1331 | |
| Fujitsu Lifebook U939 i5 | |
| LibreOffice - 20 Documents To PDF | |
| HP EliteBook 830 G7 | |
| Média Intel Core i5-10310U (60 - 71.4, n=5) | |
| Fujitsu Lifebook U939 i5 | |
| Dynabook Portege X30L-G1331 | |
| Dell Latitude 5310-GXX0D | |
| Lenovo ThinkPad X13-20UGS00800 | |
| Média da turma Subnotebook (39.9 - 220, n=56, últimos 2 anos) | |
| Lenovo ThinkPad X13-20T20033GE | |
| R Benchmark 2.5 - Overall mean | |
| Fujitsu Lifebook U939 i5 | |
| Média Intel Core i5-10310U (0.703 - 0.806, n=5) | |
| Lenovo ThinkPad X13-20T20033GE | |
| Dynabook Portege X30L-G1331 | |
| Dell Latitude 5310-GXX0D | |
| HP EliteBook 830 G7 | |
| Lenovo ThinkPad X13-20UGS00800 | |
| Média da turma Subnotebook (0.4024 - 1.456, n=58, últimos 2 anos) | |
* ... menor é melhor
| PCMark 8 Home Score Accelerated v2 | 3469 pontos | |
| PCMark 8 Creative Score Accelerated v2 | 3539 pontos | |
| PCMark 8 Work Score Accelerated v2 | 4764 pontos | |
| PCMark 10 Score | 4085 pontos | |
Ajuda | ||
| PCMark 8 | |
| Home Score Accelerated v2 | |
| Lenovo ThinkPad X13-20UGS00800 | |
| Lenovo ThinkPad X13-20T20033GE | |
| Dynabook Portege X30L-G1331 | |
| HP EliteBook 830 G7 | |
| Média Intel Core i5-10310U, Intel UHD Graphics 620 (3469 - 3499, n=2) | |
| Dell Latitude 5310-GXX0D | |
| Média da turma Subnotebook (1739 - 1828, n=2, últimos 2 anos) | |
| Work Score Accelerated v2 | |
| Lenovo ThinkPad X13-20UGS00800 | |
| Lenovo ThinkPad X13-20T20033GE | |
| Dynabook Portege X30L-G1331 | |
| Média Intel Core i5-10310U, Intel UHD Graphics 620 (4764 - 5098, n=2) | |
| Dell Latitude 5310-GXX0D | |
| HP EliteBook 830 G7 | |
| Média da turma Subnotebook (1609 - 1656, n=2, últimos 2 anos) | |
| DPC Latencies / LatencyMon - interrupt to process latency (max), Web, Youtube, Prime95 | |
| Dell Latitude 5310-GXX0D | |
| Dynabook Portege X30L-G1331 | |
| Lenovo ThinkPad X13-20UGS00800 | |
| Lenovo ThinkPad X13-20T20033GE | |
| Fujitsu Lifebook U939 i5 | |
| HP EliteBook 830 G7 | |
* ... menor é melhor

| Dell Latitude 5310-GXX0D SK Hynix BC511 HFM512GDJTNI | HP EliteBook 830 G7 Samsung SSD PM981a MZVLB512HBJQ | Fujitsu Lifebook U939 i5 Samsung SSD PM981 MZVLB512HAJQ | Dynabook Portege X30L-G1331 Samsung SSD PM981a MZVLB512HBJQ | Lenovo ThinkPad X13-20UGS00800 Samsung SSD PM981a MZVLB512HBJQ | Lenovo ThinkPad X13-20T20033GE Samsung SSD PM981a MZVLB512HBJQ | Média SK Hynix BC511 HFM512GDJTNI | |
|---|---|---|---|---|---|---|---|
| CrystalDiskMark 5.2 / 6 | 49% | 26% | 46% | 46% | 48% | -6% | |
| Write 4K (MB/s) | 145.5 | 118.3 -19% | 159 9% | 164.1 13% | 95.7 -34% | 131.1 -10% | 111 ? -24% |
| Read 4K (MB/s) | 48.83 | 60.4 24% | 48.12 -1% | 49.34 1% | 37.47 -23% | 45.48 -7% | 42.6 ? -13% |
| Write Seq (MB/s) | 1067 | 2067 94% | 1657 55% | 1777 67% | 2032 90% | 2042 91% | 1037 ? -3% |
| Read Seq (MB/s) | 1133 | 2394 111% | 1522 34% | 1752 55% | 2207 95% | 2259 99% | 1100 ? -3% |
| Write 4K Q32T1 (MB/s) | 420.3 | 325.5 -23% | 349.2 -17% | 401.1 -5% | 517 23% | 429.1 2% | 410 ? -2% |
| Read 4K Q32T1 (MB/s) | 462.6 | 332.2 -28% | 452.2 -2% | 498.7 8% | 387 -16% | 370.7 -20% | 444 ? -4% |
| Write Seq Q32T1 (MB/s) | 1077 | 2978 177% | 1941 80% | 2988 177% | 2977 176% | 2963 175% | 1072 ? 0% |
| Read Seq Q32T1 (MB/s) | 2302 | 3552 54% | 3510 52% | 3544 54% | 3556 54% | 3564 55% | 2269 ? -1% |
| AS SSD | 8% | 38% | 59% | 35% | 29% | -11% | |
| Seq Read (MB/s) | 1975 | 2081 5% | 2677 36% | 2067 5% | 2553 29% | 2714 37% | 1458 ? -26% |
| Seq Write (MB/s) | 1002 | 1433 43% | 1819 82% | 2444 144% | 1406 40% | 1374 37% | 900 ? -10% |
| 4K Read (MB/s) | 51.8 | 49.92 -4% | 53.7 4% | 55.8 8% | 48.53 -6% | 51.2 -1% | 49 ? -5% |
| 4K Write (MB/s) | 121.7 | 119.1 -2% | 145.8 20% | 124.6 2% | 119.6 -2% | 135.7 12% | 114.9 ? -6% |
| 4K-64 Read (MB/s) | 806 | 585 -27% | 1202 49% | 1601 99% | 808 0% | 962 19% | 776 ? -4% |
| 4K-64 Write (MB/s) | 780 | 1630 109% | 1290 65% | 1696 117% | 1846 137% | 1420 82% | 744 ? -5% |
| Access Time Read * (ms) | 0.04 | 0.043 -8% | 0.044 -10% | 0.048 -20% | 0.062 -55% | 0.043 -8% | 0.061 ? -53% |
| Access Time Write * (ms) | 0.031 | 0.097 -213% | 0.026 16% | 0.091 -194% | 0.031 -0% | 0.028 10% | 0.03329 ? -7% |
| Score Read (Points) | 1055 | 843 -20% | 1523 44% | 1864 77% | 1112 5% | 1284 22% | 970 ? -8% |
| Score Write (Points) | 1002 | 1892 89% | 1618 61% | 2065 106% | 2107 110% | 1693 69% | 949 ? -5% |
| Score Total (Points) | 2562 | 3149 23% | 3887 52% | 4908 92% | 3742 46% | 3579 40% | 2401 ? -6% |
| Copy ISO MB/s (MB/s) | 742 | 2452 230% | 2051 176% | 1395 88% | 864 ? 16% | ||
| Copy Program MB/s (MB/s) | 389.9 | 72.2 -81% | 572 47% | 491.8 26% | 309 ? -21% | ||
| Copy Game MB/s (MB/s) | 556 | 404 -27% | 1447 160% | 948 71% | 499 ? -10% | ||
| Média Total (Programa/Configurações) | 29% /
23% | 32% /
33% | 53% /
54% | 41% /
39% | 39% /
37% | -9% /
-9% |
* ... menor é melhor
Continuous load read: DiskSpd Read Loop, Queue Depth 8
| 3DMark 11 Performance | 2067 pontos | |
| 3DMark Ice Storm Standard Score | 60188 pontos | |
| 3DMark Cloud Gate Standard Score | 8812 pontos | |
| 3DMark Fire Strike Score | 1110 pontos | |
| 3DMark Time Spy Score | 453 pontos | |
Ajuda | ||
| 3DMark 11 - 1280x720 Performance GPU | |
| Média da turma Subnotebook (995 - 18489, n=55, últimos 2 anos) | |
| Lenovo ThinkPad X13-20UGS00800 | |
| HP EliteBook 830 G7 | |
| Dell Latitude 5310-GXX0D | |
| Lenovo ThinkPad X13-20T20033GE | |
| Dynabook Portege X30L-G1331 | |
| Média Intel UHD Graphics 620 (1144 - 3432, n=244) | |
| Fujitsu Lifebook U939 i5 | |
| 3DMark | |
| 1280x720 Cloud Gate Standard Graphics | |
| Média da turma Subnotebook (5577 - 61591, n=29, últimos 2 anos) | |
| Lenovo ThinkPad X13-20UGS00800 | |
| HP EliteBook 830 G7 | |
| Dell Latitude 5310-GXX0D | |
| Média Intel UHD Graphics 620 (6205 - 16400, n=225) | |
| 1920x1080 Fire Strike Graphics | |
| Média da turma Subnotebook (832 - 32931, n=57, últimos 2 anos) | |
| Lenovo ThinkPad X13-20UGS00800 | |
| HP EliteBook 830 G7 | |
| Lenovo ThinkPad X13-20T20033GE | |
| Dynabook Portege X30L-G1331 | |
| Dell Latitude 5310-GXX0D | |
| Média Intel UHD Graphics 620 (557 - 2608, n=213) | |
| 2560x1440 Time Spy Graphics | |
| Média da turma Subnotebook (804 - 14477, n=56, últimos 2 anos) | |
| Lenovo ThinkPad X13-20UGS00800 | |
| HP EliteBook 830 G7 | |
| Lenovo ThinkPad X13-20T20033GE | |
| Dynabook Portege X30L-G1331 | |
| Dell Latitude 5310-GXX0D | |
| Média Intel UHD Graphics 620 (299 - 797, n=88) | |
| baixo | média | alto | ultra | |
|---|---|---|---|---|
| Tomb Raider (2013) | 97.6 | 47.6 | 28.2 | 13.1 |
| BioShock Infinite (2013) | 58.1 | 34.7 | 28.3 | 9 |
| Dota 2 Reborn (2015) | 73.5 | 39.5 | 19.5 | 17.3 |
| X-Plane 11.11 (2018) | 8.59 | 7.45 | 8.82 | |
| Far Cry 5 (2018) | 15 | 7 | 6 | 5 |
Barulho
| Ocioso |
| 24.9 / 24.9 / 24.9 dB |
| Carga |
| 37.7 / 41.2 dB |
 | ||
30 dB silencioso 40 dB(A) audível 50 dB(A) ruidosamente alto |
||
min: | ||
| Dell Latitude 5310-GXX0D i5-10310U, UHD Graphics 620 | HP EliteBook 830 G7 i7-10810U, UHD Graphics 620 | Fujitsu Lifebook U939 i5 i5-8265U, UHD Graphics 620 | Dynabook Portege X30L-G1331 i5-10210U, UHD Graphics 620 | Lenovo ThinkPad X13-20UGS00800 R7 PRO 4750U, Vega 7 | Lenovo ThinkPad X13-20T20033GE i5-10210U, UHD Graphics 620 | Média Intel UHD Graphics 620 | Média da turma Subnotebook | |
|---|---|---|---|---|---|---|---|---|
| Noise | -2% | -9% | -6% | -5% | -6% | -8% | 2% | |
| desligado / ambiente * (dB) | 24.9 | 26.8 -8% | 29.8 -20% | 28.5 -14% | 29.1 -17% | 29.3 -18% | 29 ? -16% | 24.2 ? 3% |
| Idle Minimum * (dB) | 24.9 | 27.1 -9% | 29.8 -20% | 28.5 -14% | 29.1 -17% | 29.3 -18% | 29.1 ? -17% | 24.3 ? 2% |
| Idle Average * (dB) | 24.9 | 27.1 -9% | 29.8 -20% | 28.5 -14% | 29.1 -17% | 29.3 -18% | 29.1 ? -17% | 24.5 ? 2% |
| Idle Maximum * (dB) | 24.9 | 27.1 -9% | 29.8 -20% | 28.5 -14% | 29.1 -17% | 29.3 -18% | 29.7 ? -19% | 25.1 ? -1% |
| Load Average * (dB) | 37.7 | 31.4 17% | 31.7 16% | 32 15% | 31.1 18% | 30.7 19% | 33.5 ? 11% | 34.6 ? 8% |
| Load Maximum * (dB) | 41.2 | 39 5% | 36.3 12% | 38 8% | 31.8 23% | 34 17% | 36.1 ? 12% | 42.2 ? -2% |
* ... menor é melhor
(±) A temperatura máxima no lado superior é 42.2 °C / 108 F, em comparação com a média de 35.9 °C / 97 F , variando de 21.4 a 59 °C para a classe Subnotebook.
(±) A parte inferior aquece até um máximo de 44 °C / 111 F, em comparação com a média de 39.2 °C / 103 F
(+) Em uso inativo, a temperatura média para o lado superior é 27.7 °C / 82 F, em comparação com a média do dispositivo de 30.8 °C / ### class_avg_f### F.
(+) Os apoios para as mãos e o touchpad são mais frios que a temperatura da pele, com um máximo de 29.6 °C / 85.3 F e, portanto, são frios ao toque.
(±) A temperatura média da área do apoio para as mãos de dispositivos semelhantes foi 28.2 °C / 82.8 F (-1.4 °C / -2.5 F).
| Dell Latitude 5310-GXX0D i5-10310U, UHD Graphics 620 | HP EliteBook 830 G7 i7-10810U, UHD Graphics 620 | Fujitsu Lifebook U939 i5 i5-8265U, UHD Graphics 620 | Dynabook Portege X30L-G1331 i5-10210U, UHD Graphics 620 | Lenovo ThinkPad X13-20UGS00800 R7 PRO 4750U, Vega 7 | Lenovo ThinkPad X13-20T20033GE i5-10210U, UHD Graphics 620 | Média Intel UHD Graphics 620 | Média da turma Subnotebook | |
|---|---|---|---|---|---|---|---|---|
| Heat | -3% | 3% | -11% | 7% | 2% | 3% | 4% | |
| Maximum Upper Side * (°C) | 42.2 | 41 3% | 46.3 -10% | 41.2 2% | 44.8 -6% | 48.4 -15% | 41.1 ? 3% | 41.7 ? 1% |
| Maximum Bottom * (°C) | 44 | 47.2 -7% | 44.9 -2% | 44 -0% | 42.1 4% | 43.8 -0% | 44.3 ? -1% | 43.5 ? 1% |
| Idle Upper Side * (°C) | 28.6 | 28 2% | 25.8 10% | 34.6 -21% | 24.1 16% | 25.2 12% | 26.8 ? 6% | 26.8 ? 6% |
| Idle Bottom * (°C) | 29.2 | 32 -10% | 25.8 12% | 36.2 -24% | 25.1 14% | 25.7 12% | 27.7 ? 5% | 27.4 ? 6% |
* ... menor é melhor
Dell Latitude 5310-GXX0D análise de áudio
(-) | alto-falantes não muito altos (###valor### dB)
Graves 100 - 315Hz
(±) | graves reduzidos - em média 13.8% menor que a mediana
(±) | a linearidade dos graves é média (13.5% delta para a frequência anterior)
Médios 400 - 2.000 Hz
(+) | médios equilibrados - apenas 4.3% longe da mediana
(±) | a linearidade dos médios é média (7% delta para frequência anterior)
Altos 2 - 16 kHz
(+) | agudos equilibrados - apenas 1.4% longe da mediana
(+) | os máximos são lineares (3% delta da frequência anterior)
Geral 100 - 16.000 Hz
(+) | o som geral é linear (14.4% diferença em relação à mediana)
Comparado com a mesma classe
» 29% de todos os dispositivos testados nesta classe foram melhores, 6% semelhantes, 65% piores
» O melhor teve um delta de 5%, a média foi 18%, o pior foi 53%
Comparado com todos os dispositivos testados
» 18% de todos os dispositivos testados foram melhores, 4% semelhantes, 78% piores
» O melhor teve um delta de 4%, a média foi 23%, o pior foi 134%
| desligado | |
| Ocioso | |
| Carga |
|
Key:
min: | |
| Dell Latitude 5310-GXX0D i5-10310U, UHD Graphics 620 | HP EliteBook 830 G7 i7-10810U, UHD Graphics 620 | Fujitsu Lifebook U939 i5 i5-8265U, UHD Graphics 620 | Dynabook Portege X30L-G1331 i5-10210U, UHD Graphics 620 | Lenovo ThinkPad X13-20UGS00800 R7 PRO 4750U, Vega 7 | Lenovo ThinkPad X13-20T20033GE i5-10210U, UHD Graphics 620 | Média Intel UHD Graphics 620 | Média da turma Subnotebook | |
|---|---|---|---|---|---|---|---|---|
| Power Consumption | -13% | -22% | -10% | -63% | -18% | -30% | -35% | |
| Idle Minimum * (Watt) | 2.2 | 3.6 -64% | 3.1 -41% | 2.8 -27% | 6 -173% | 2.9 -32% | 3.81 ? -73% | 3.71 ? -69% |
| Idle Average * (Watt) | 4 | 4.7 -18% | 5.9 -48% | 4.9 -23% | 8.9 -123% | 5.6 -40% | 6.94 ? -74% | 6.54 ? -64% |
| Idle Maximum * (Watt) | 6.9 | 5.1 26% | 9.2 -33% | 9 -30% | 11.3 -64% | 8.9 -29% | 8.75 ? -27% | 7.89 ? -14% |
| Load Average * (Watt) | 37 | 33.3 10% | 35.8 3% | 31.2 16% | 34.2 8% | 30.1 19% | 35 ? 5% | 42.1 ? -14% |
| Load Maximum * (Watt) | 58 | 70 -21% | 51.9 11% | 49.4 15% | 37.2 36% | 61.3 -6% | 47.5 ? 18% | 65.1 ? -12% |
* ... menor é melhor
| Dell Latitude 5310-GXX0D i5-10310U, UHD Graphics 620, 60 Wh | HP EliteBook 830 G7 i7-10810U, UHD Graphics 620, 53 Wh | Fujitsu Lifebook U939 i5 i5-8265U, UHD Graphics 620, 50 Wh | Dynabook Portege X30L-G1331 i5-10210U, UHD Graphics 620, 42 Wh | Lenovo ThinkPad X13-20UGS00800 R7 PRO 4750U, Vega 7, 48 Wh | Lenovo ThinkPad X13-20T20033GE i5-10210U, UHD Graphics 620, 48 Wh | Média da turma Subnotebook | |
|---|---|---|---|---|---|---|---|
| Duração da bateria | 14% | -35% | -35% | -45% | -24% | -7% | |
| Reader / Idle (h) | 26.5 | 34.6 31% | 28.6 ? 8% | ||||
| H.264 (h) | 17.1 | 8.3 -51% | 11.7 -32% | 15.3 ? -11% | |||
| WiFi v1.3 (h) | 12.7 | 11.5 -9% | 8.2 -35% | 8.3 -35% | 8.7 -31% | 9.3 -27% | 14.1 ? 11% |
| Load (h) | 3.1 | 3.7 19% | 1.5 -52% | 2.7 -13% | 1.998 ? -36% |
Pro
Contra
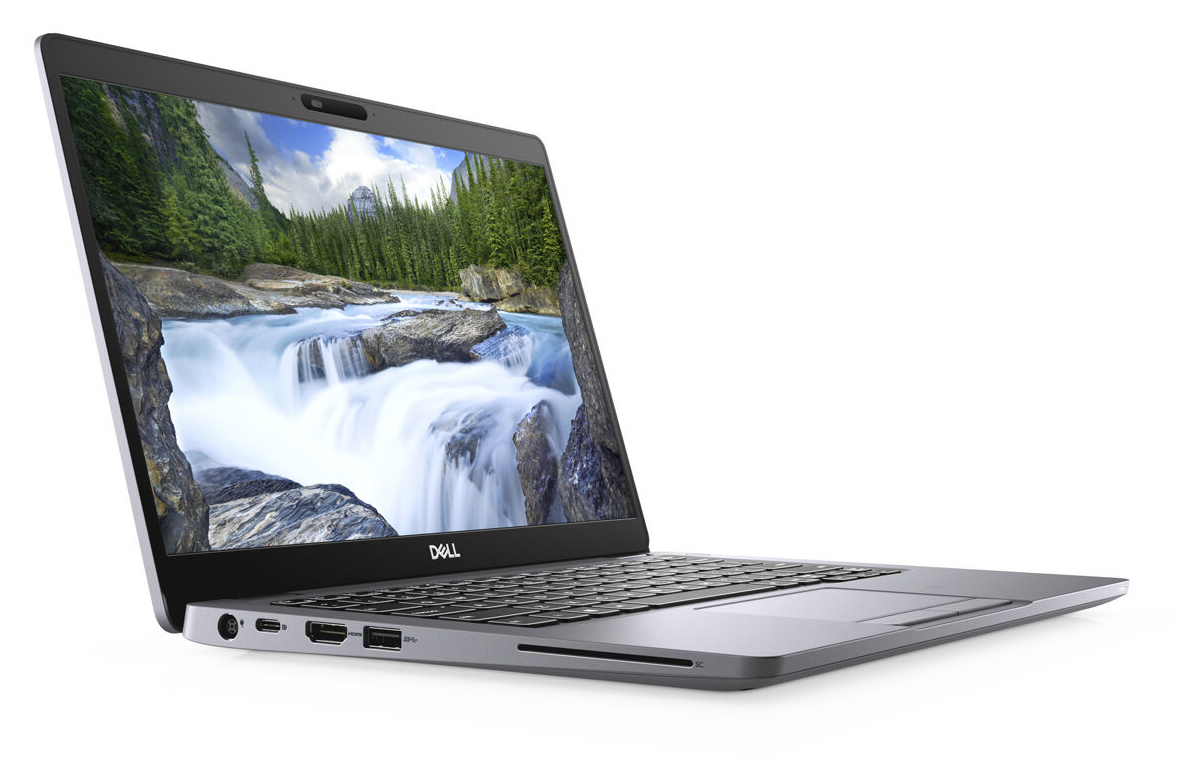
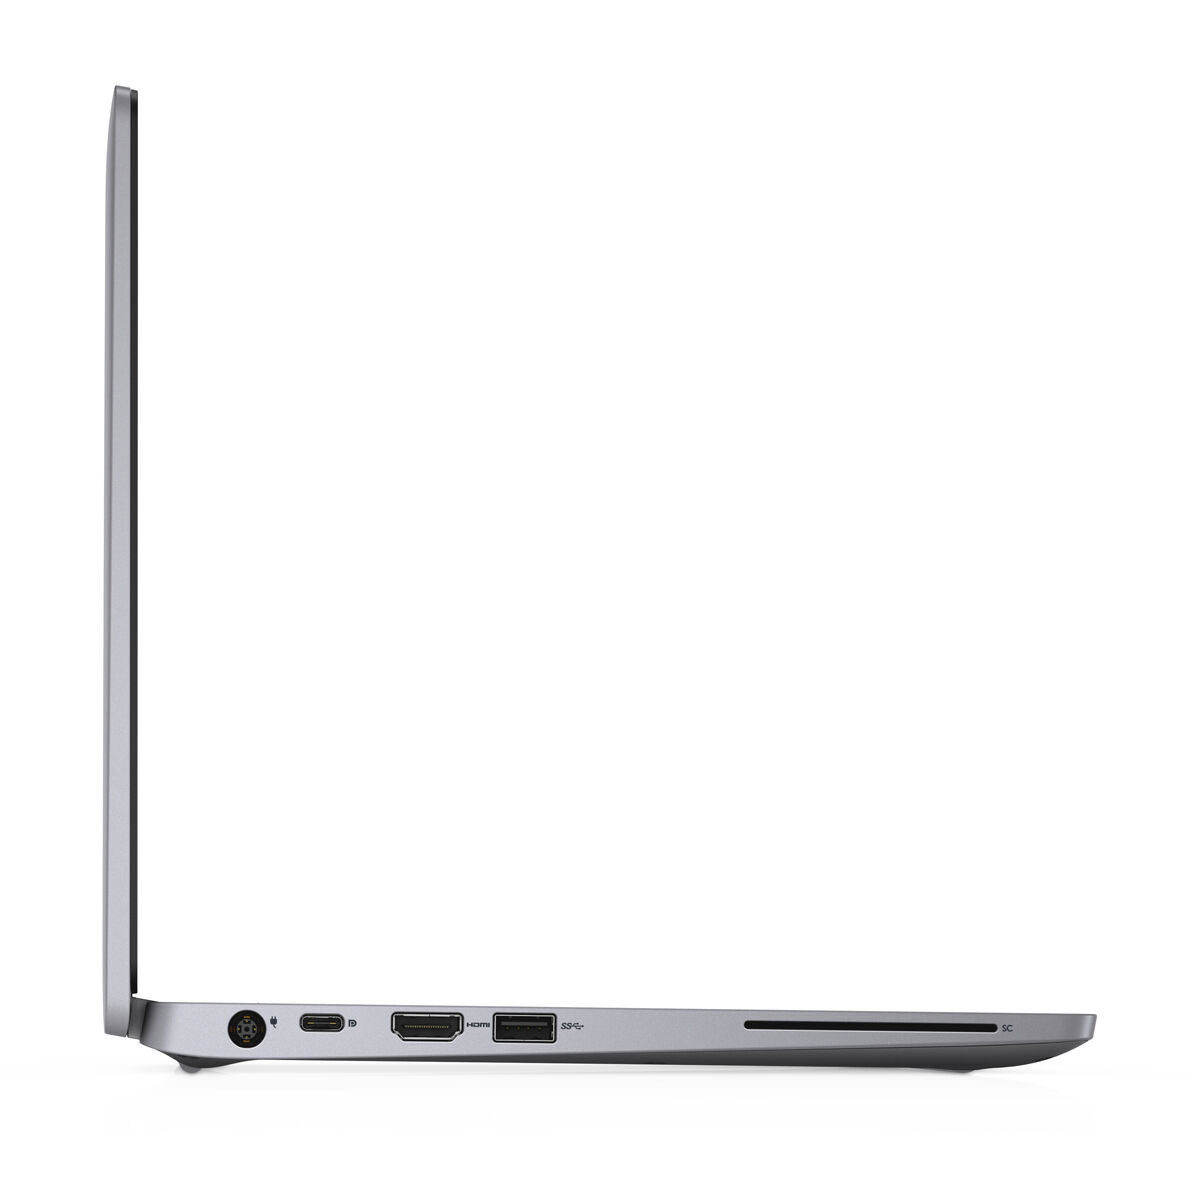
O Latitude é um companheiro duradouro para o trabalho diário. Uma carga de bateria deve manter o dispositivo durante o dia. A energia pode ser recarregada usando o adaptador de alimentação USB Tipo C incluído ou um adaptador de alimentação Dell proprietário.
Com o Latitude 5310, a Dell oferece um portátil corporativo completo sem deficiências graves.
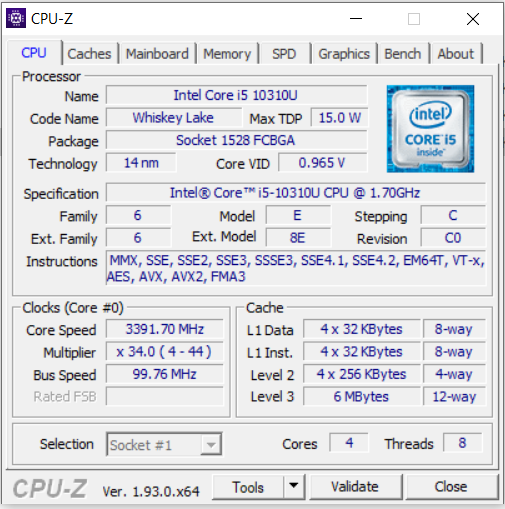
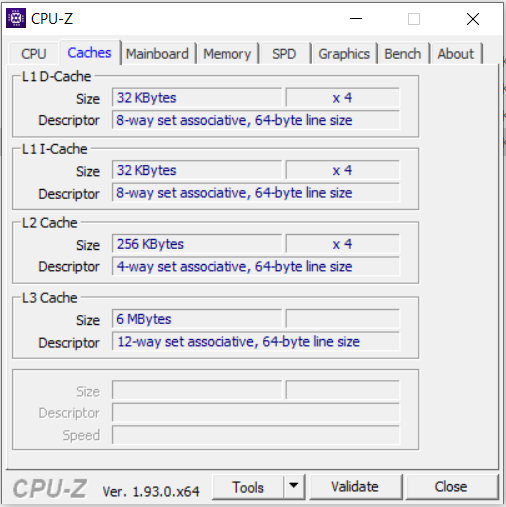
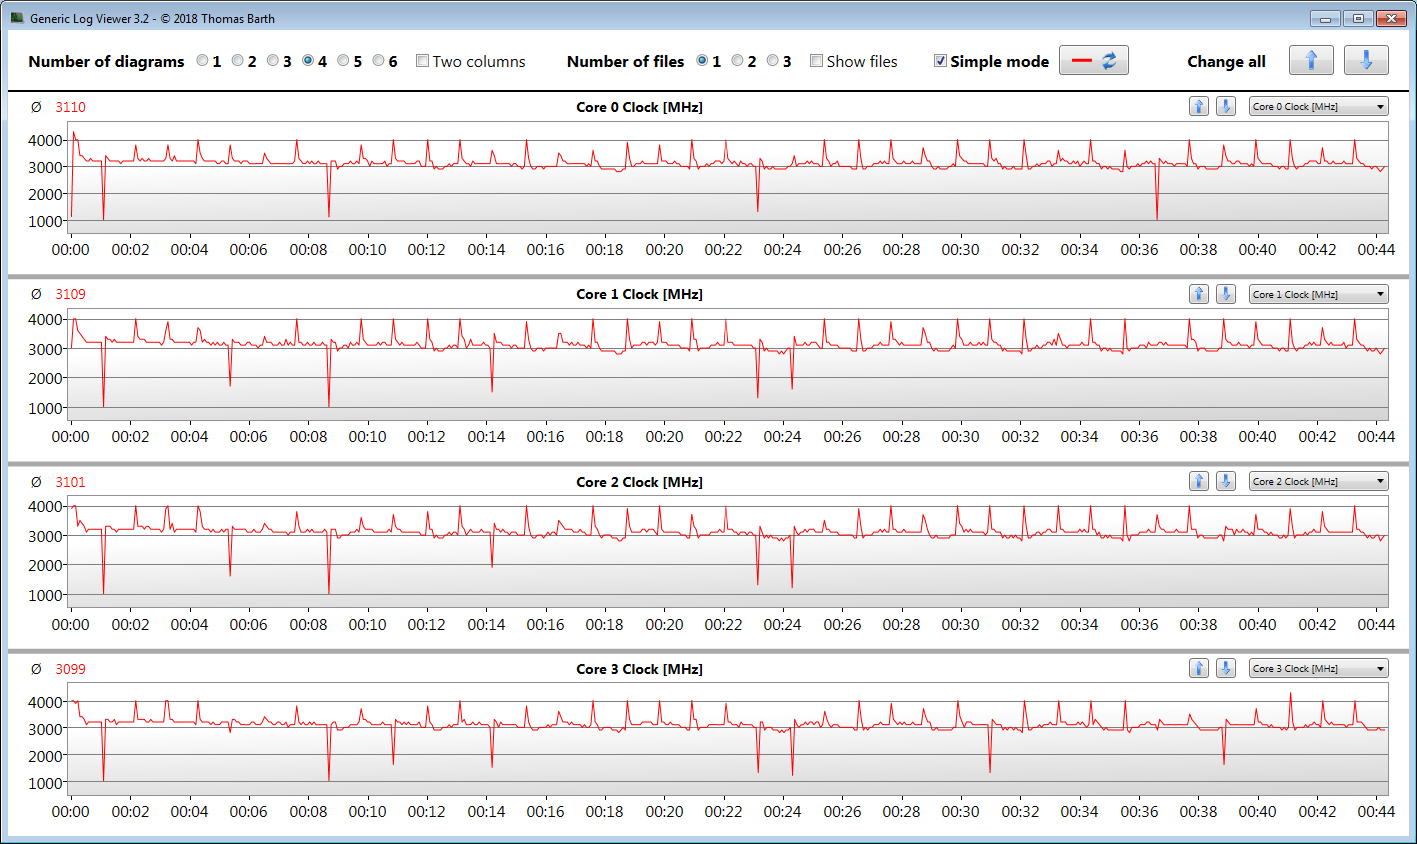
O processador Core i5 integrado fornece potência de computação mais do que suficiente para aplicativos de escritório e Internet. A emissão de calor e ruído está em um nível aceitável.
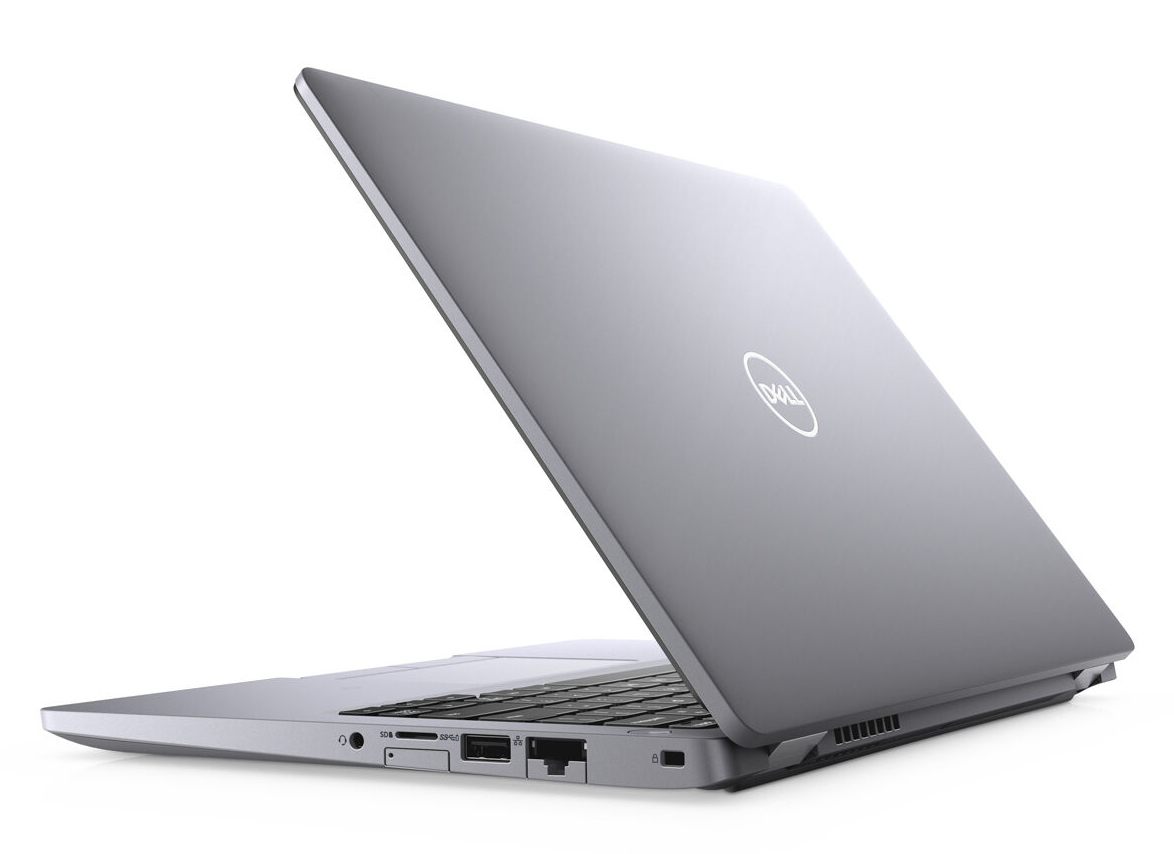
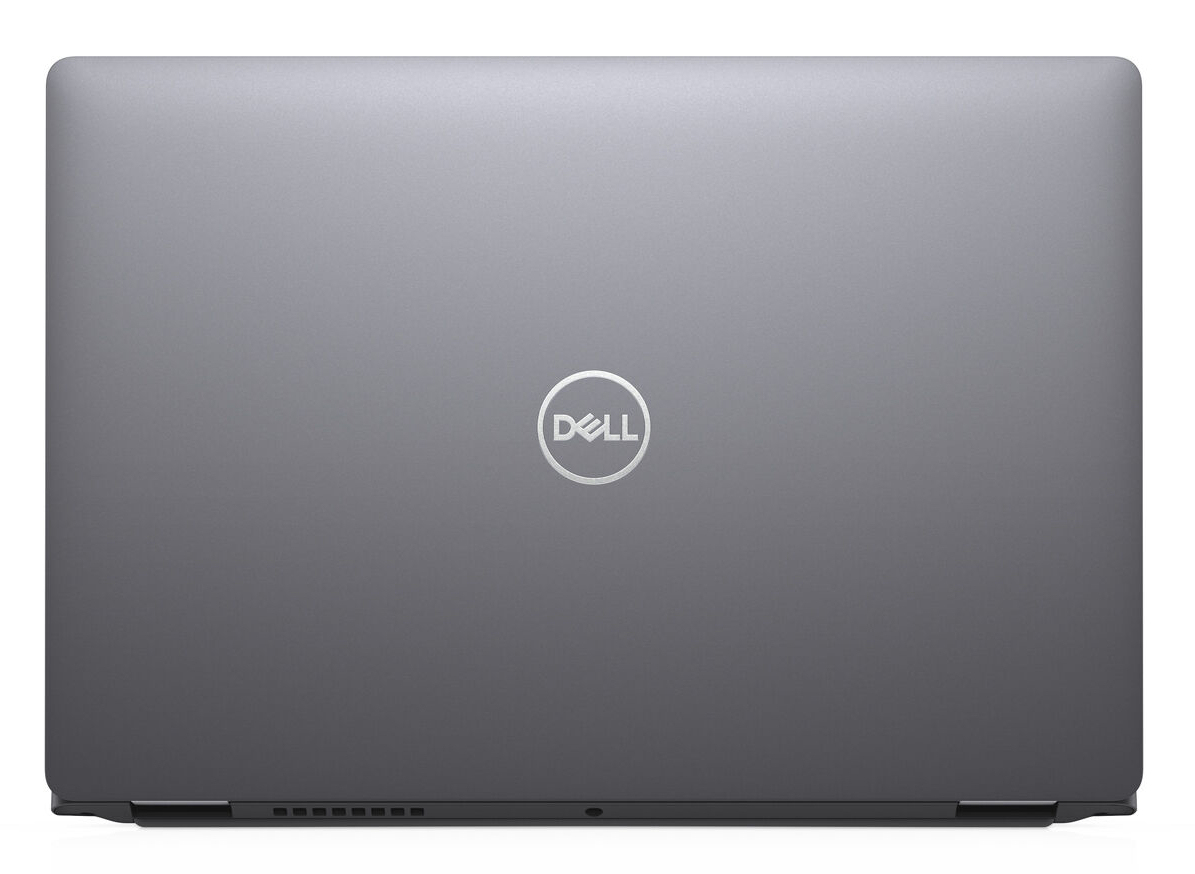
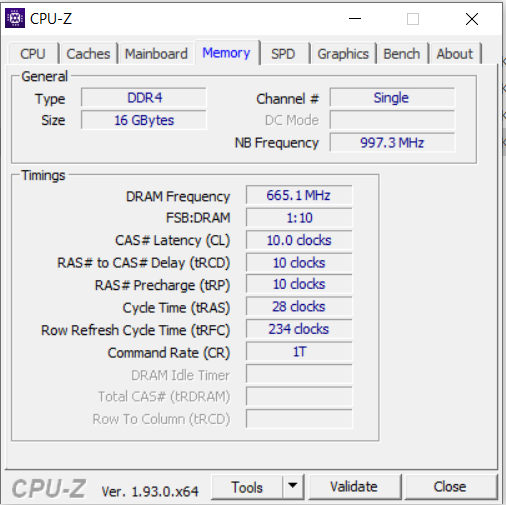
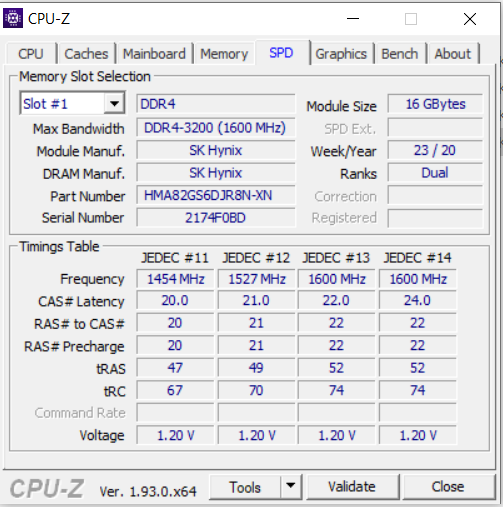
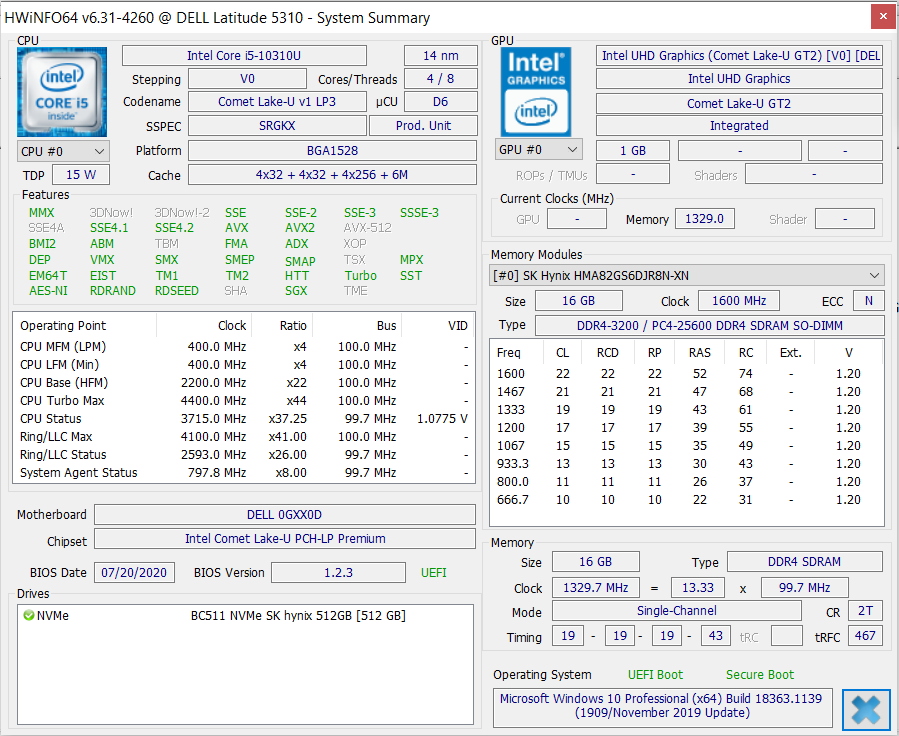
A CPU pode acessar 8 GB de RAM (1x 8 GB, modo de canal único, máx. 32 GB). A instalação de um segundo módulo de memória é recomendada para ativar o modo de canal duplo aqui. Um SSD NVMe (512 GB) garante um sistema rápido e sem problemas. É possível substituir o SSD por um modelo mais rápido e/ou de maior capacidade. Além disso, os procedimentos de atualização e manutenção requerem a remoção da tampa inferior.
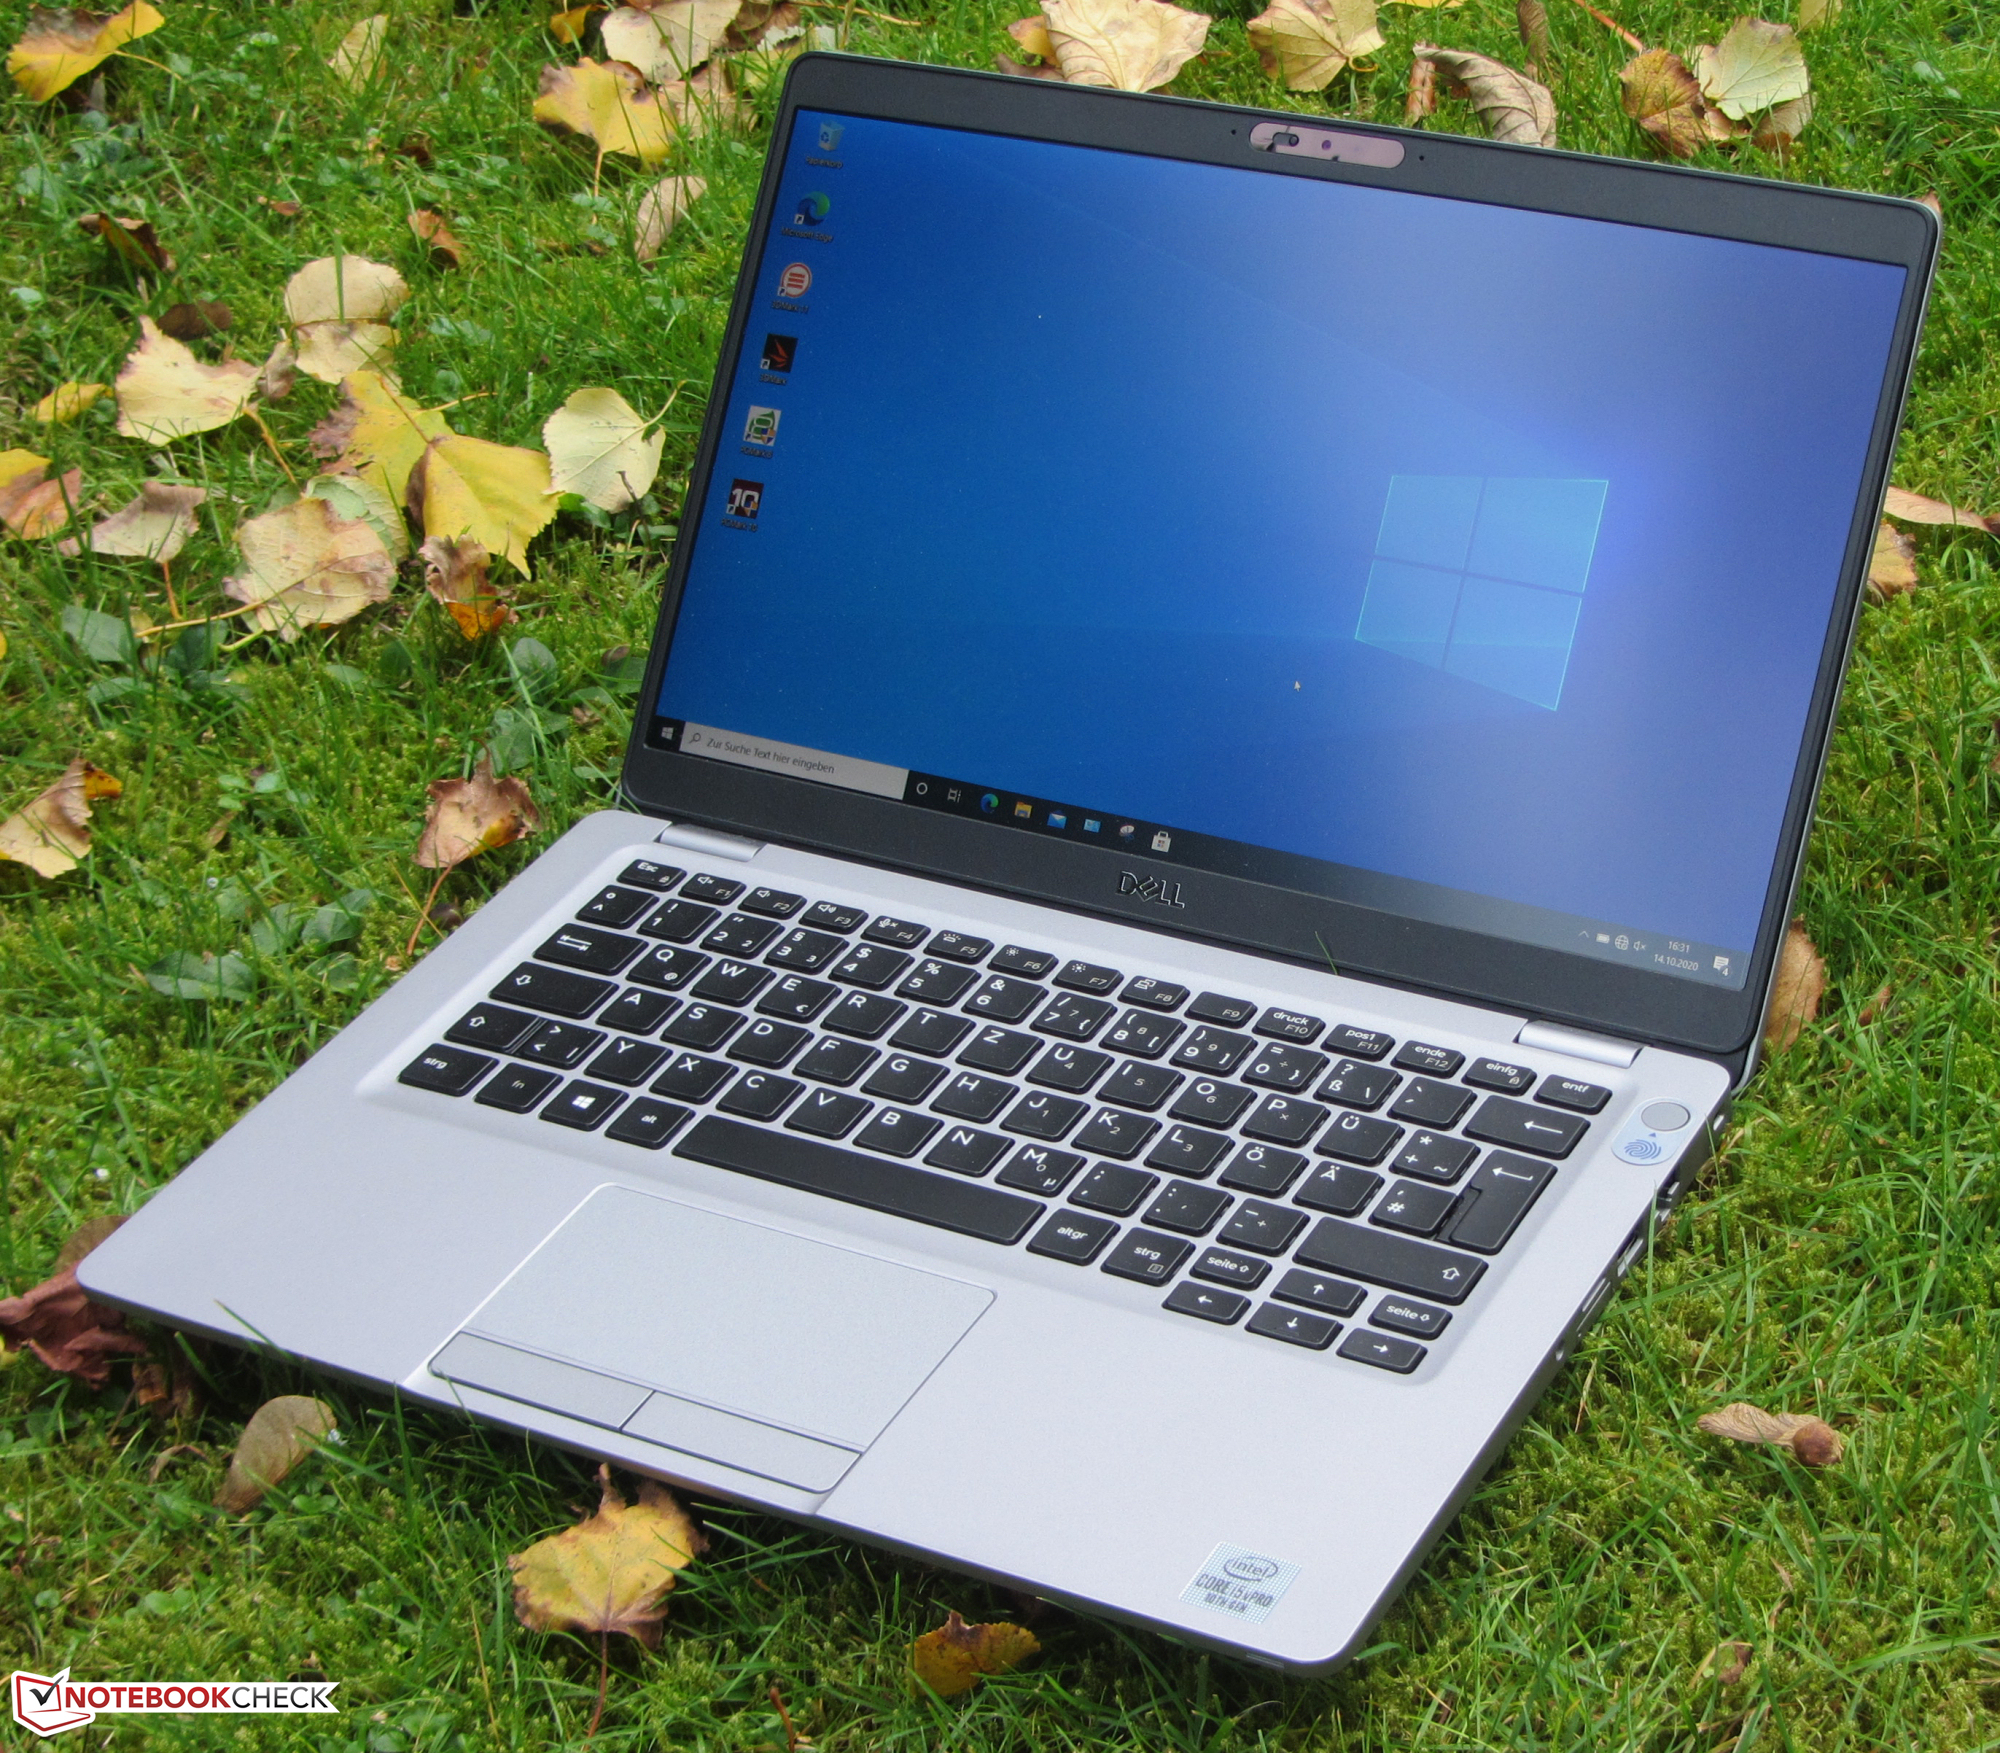
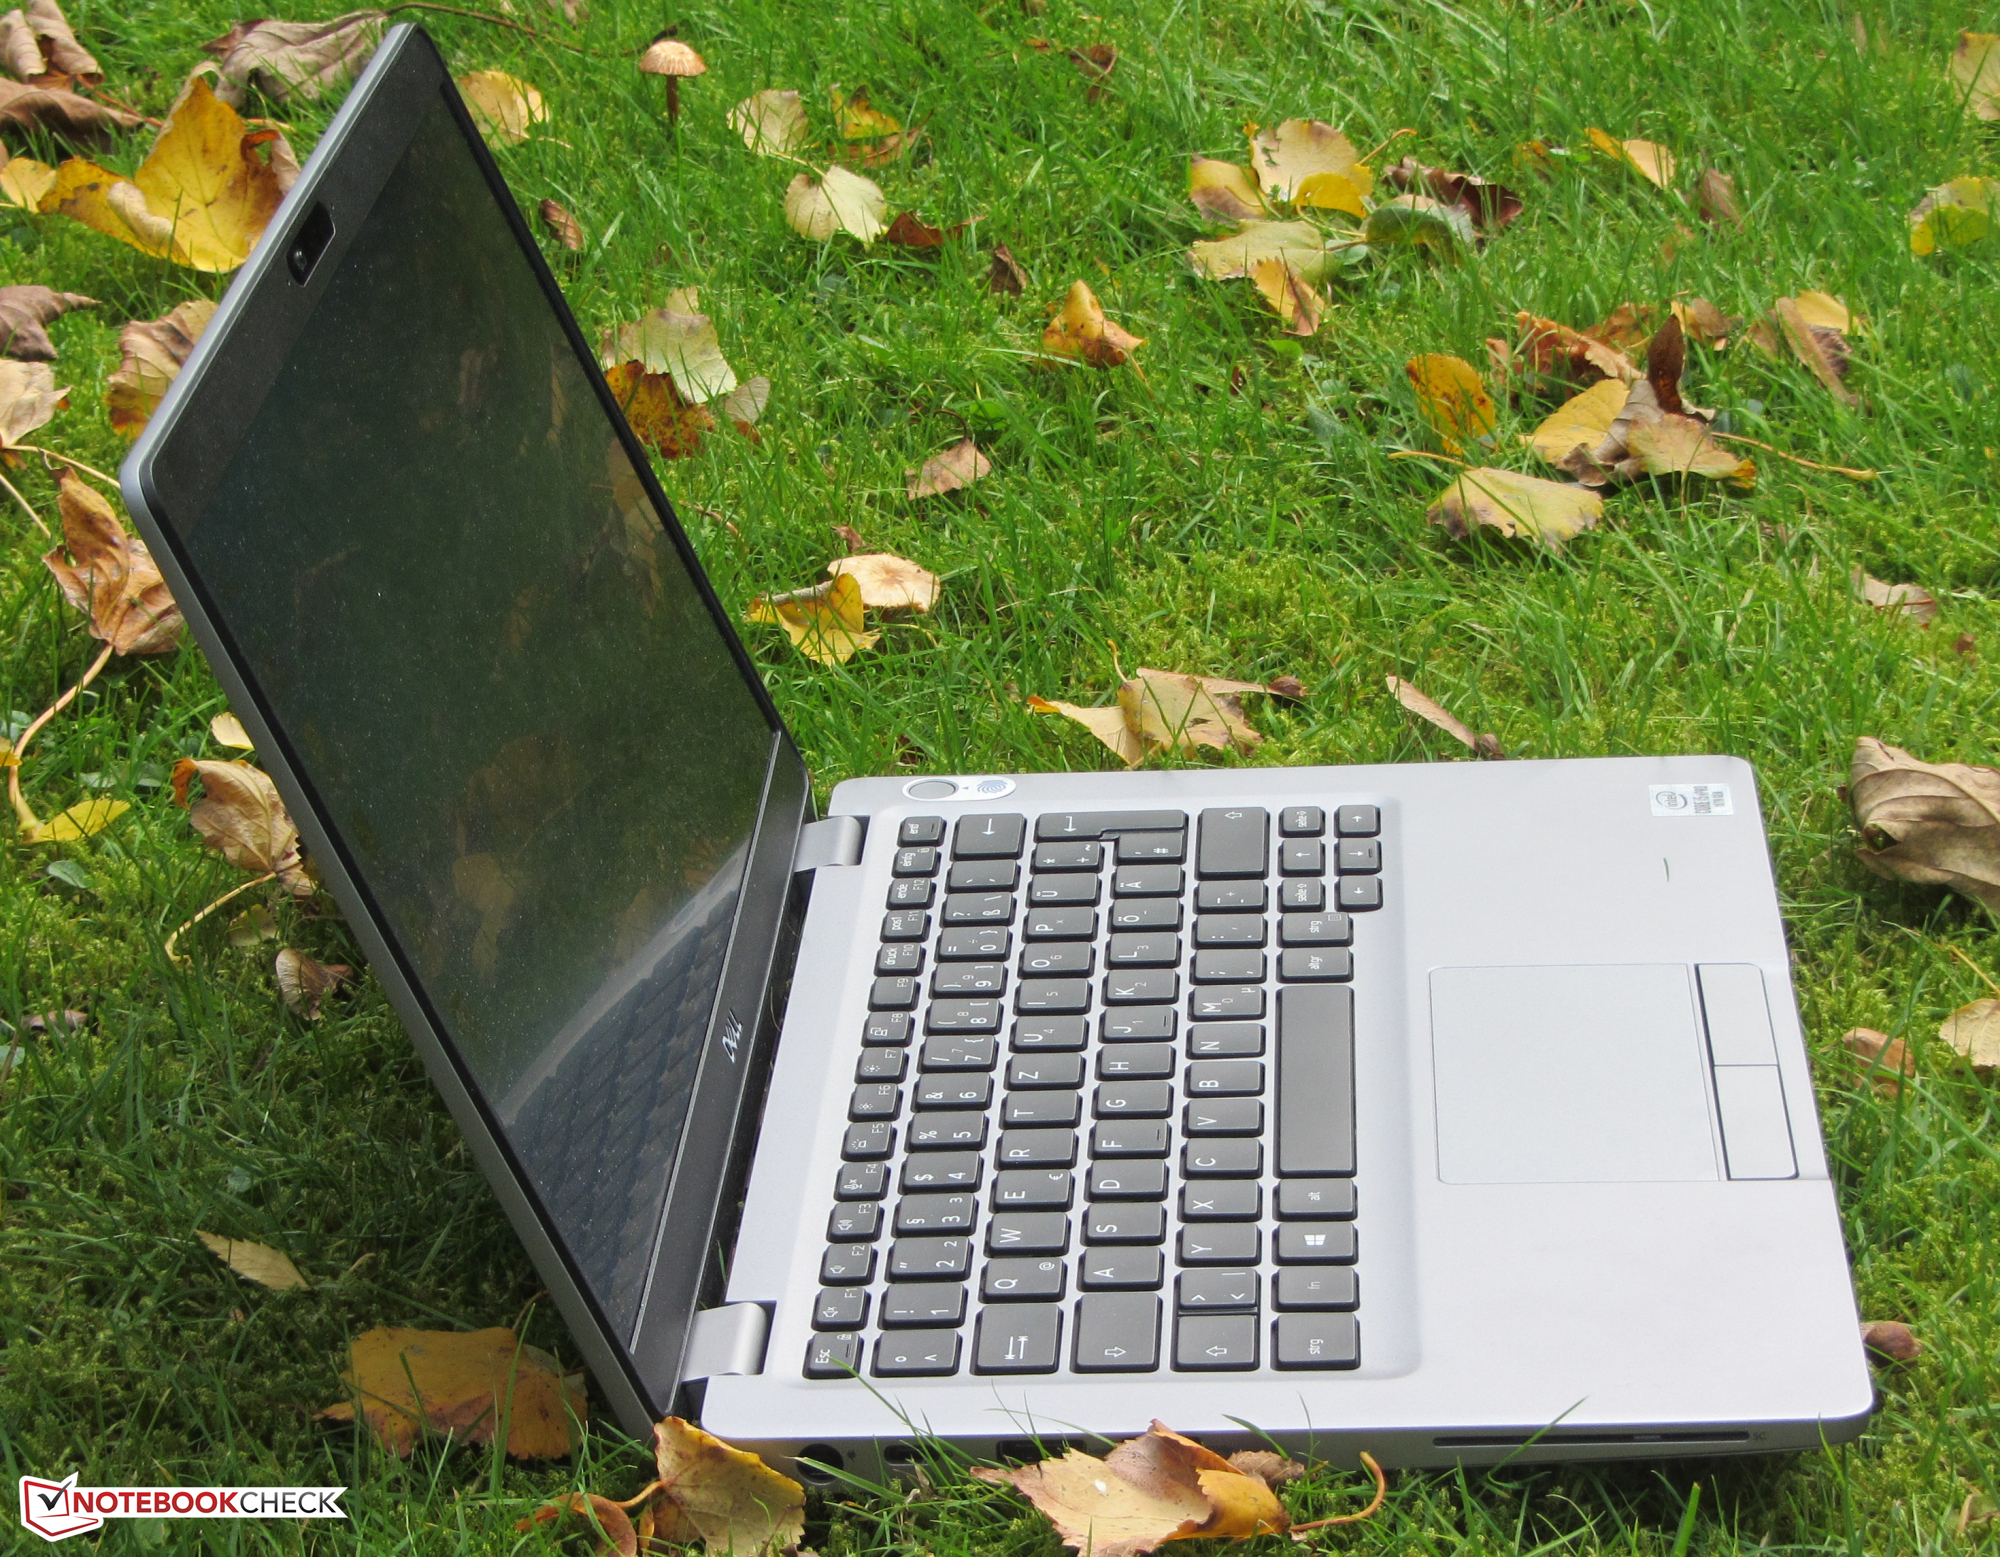
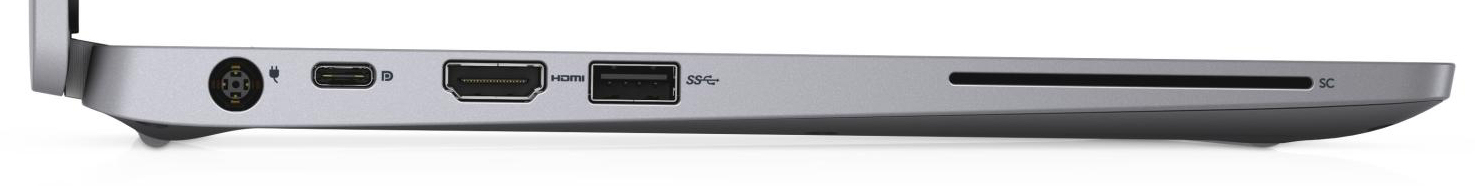
A tela (Full HD, IPS) ganha pontos com uma superfície mate, ângulos de visão estáveis, reprodução de cores aceitável e cobertura decente do espaço de cores. Brilho e contraste são fundamentalmente bons. No entanto, o nível de preço do portátil exige melhorias. A Dell oferece um modem LTE opcional para o Latitude. Nosso dispositivo de teste não possui um modem. No entanto, um pode ser adaptado. As antenas LTE e o slot do cartão SIM estão disponíveis.
Dell Latitude 5310-GXX0D
- 10/18/2020 v7 (old)
Sascha Mölck
Price comparison
