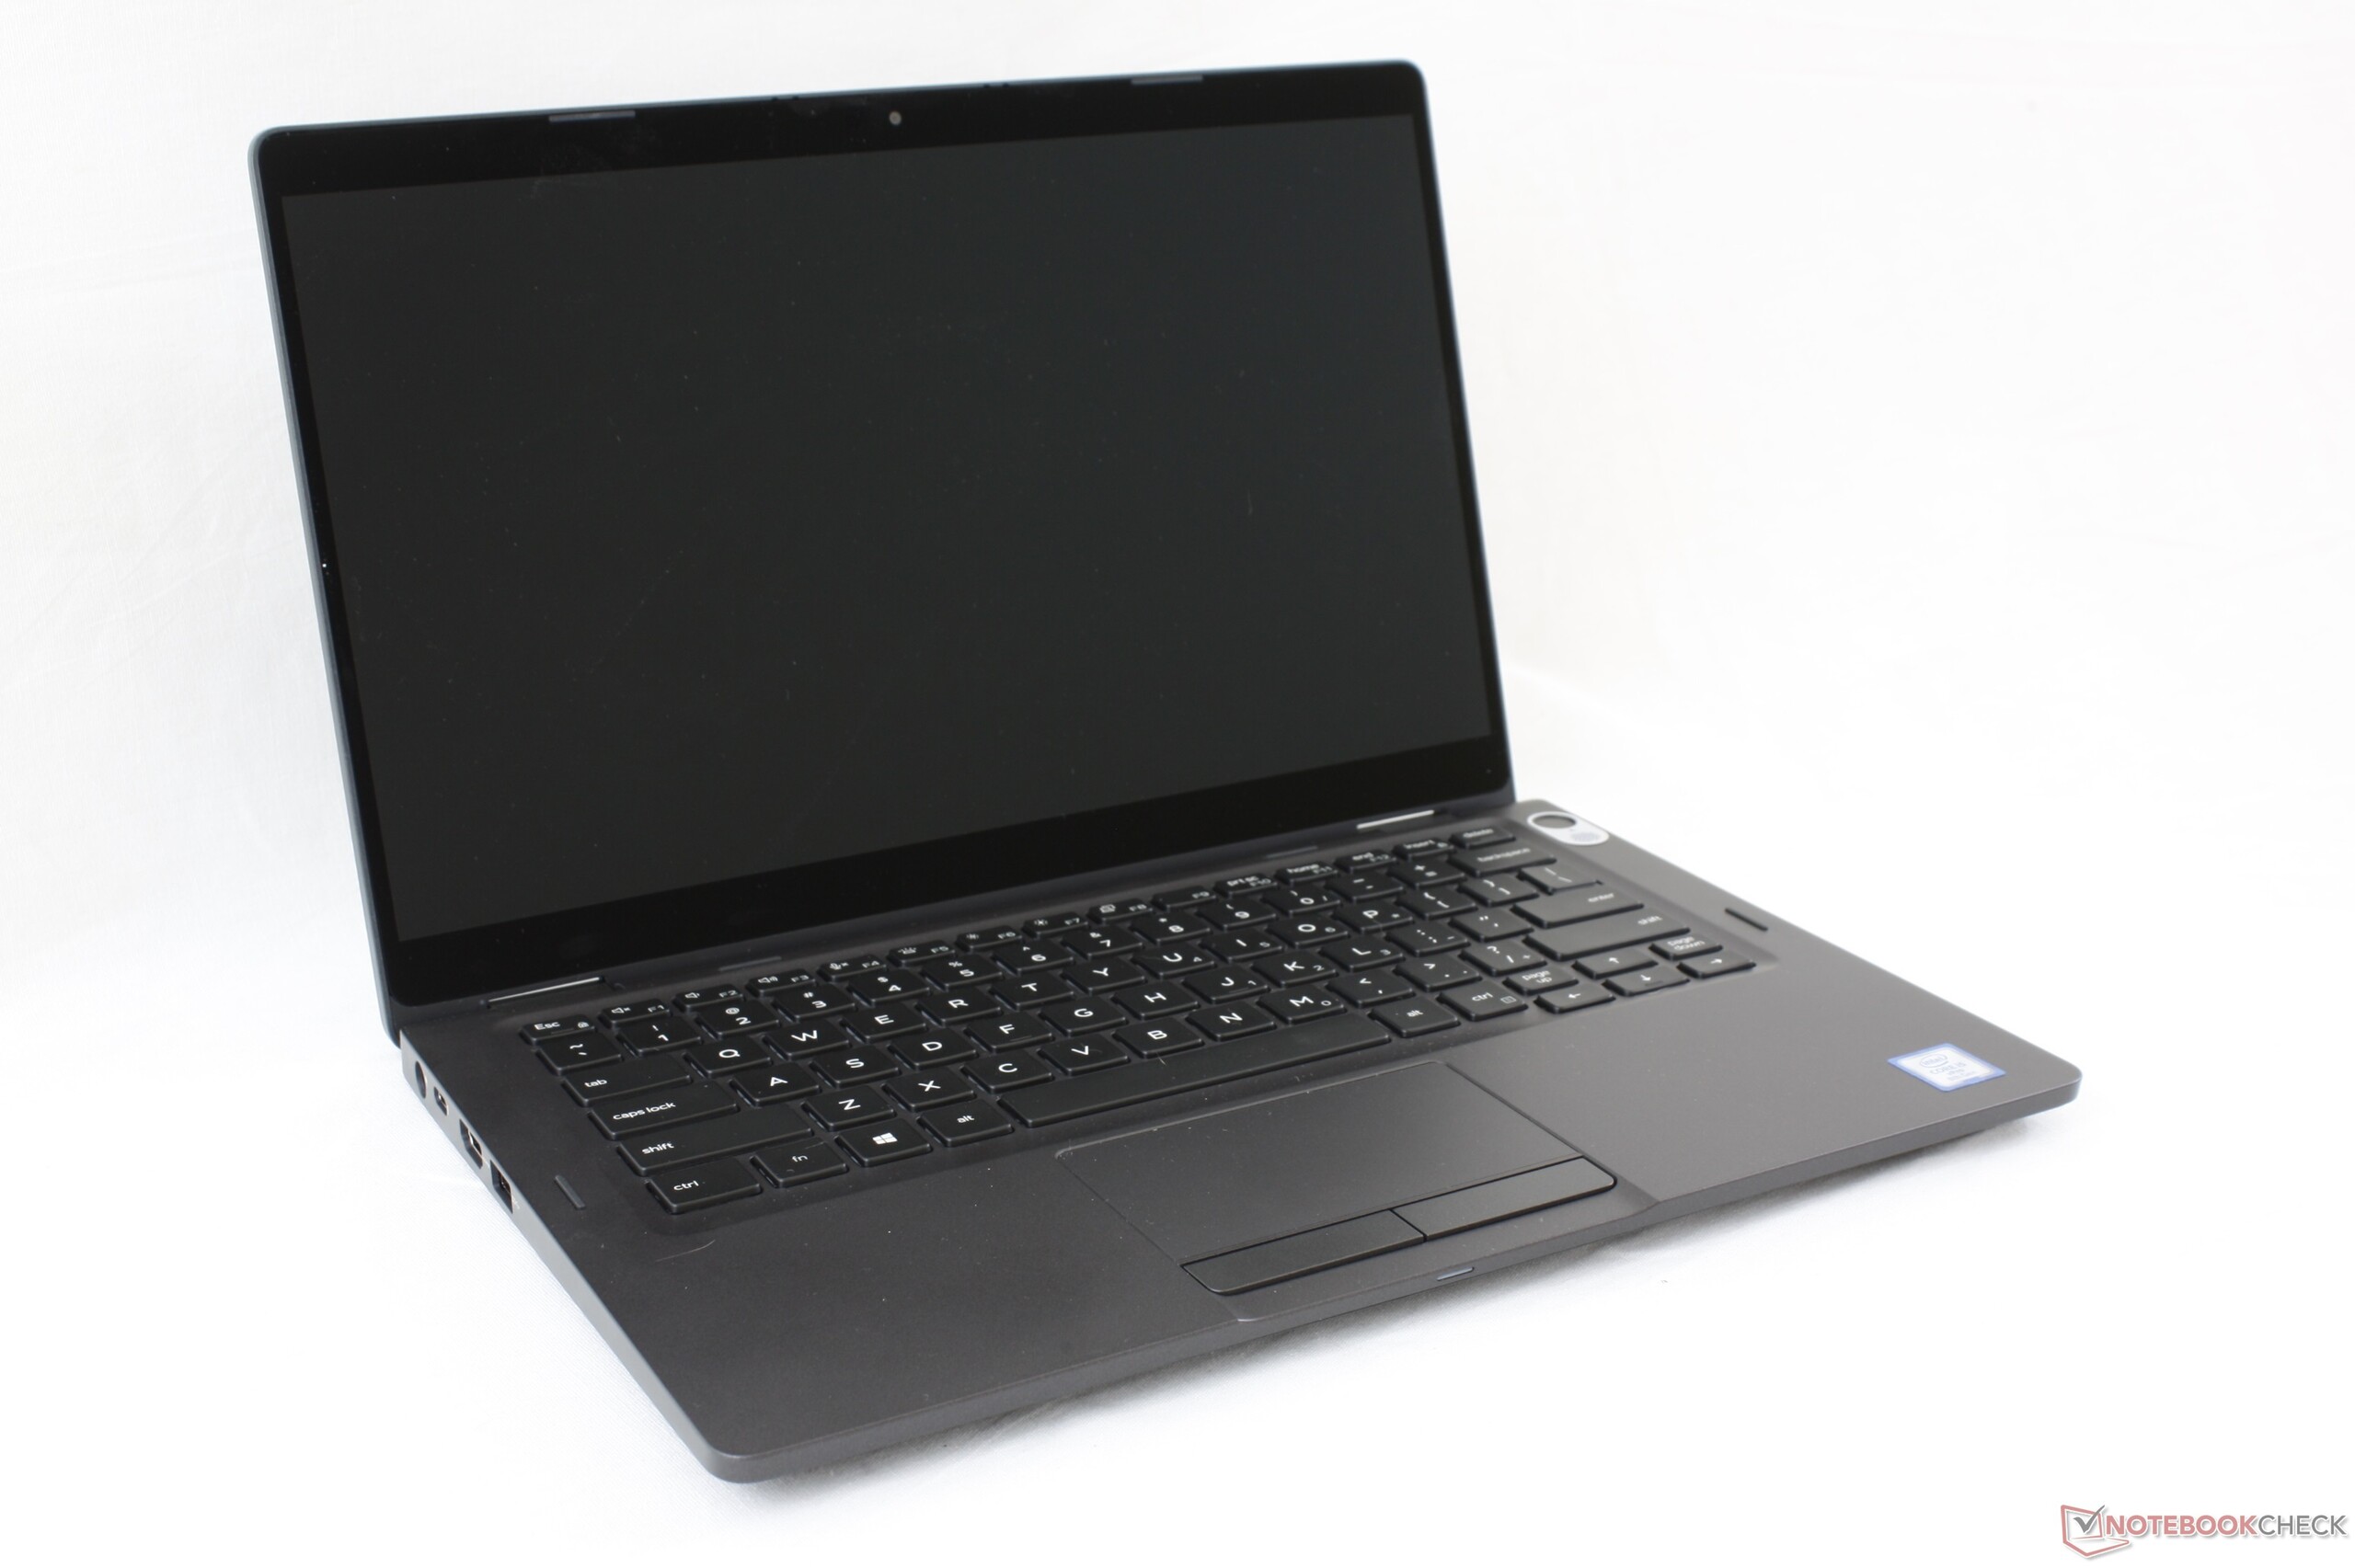
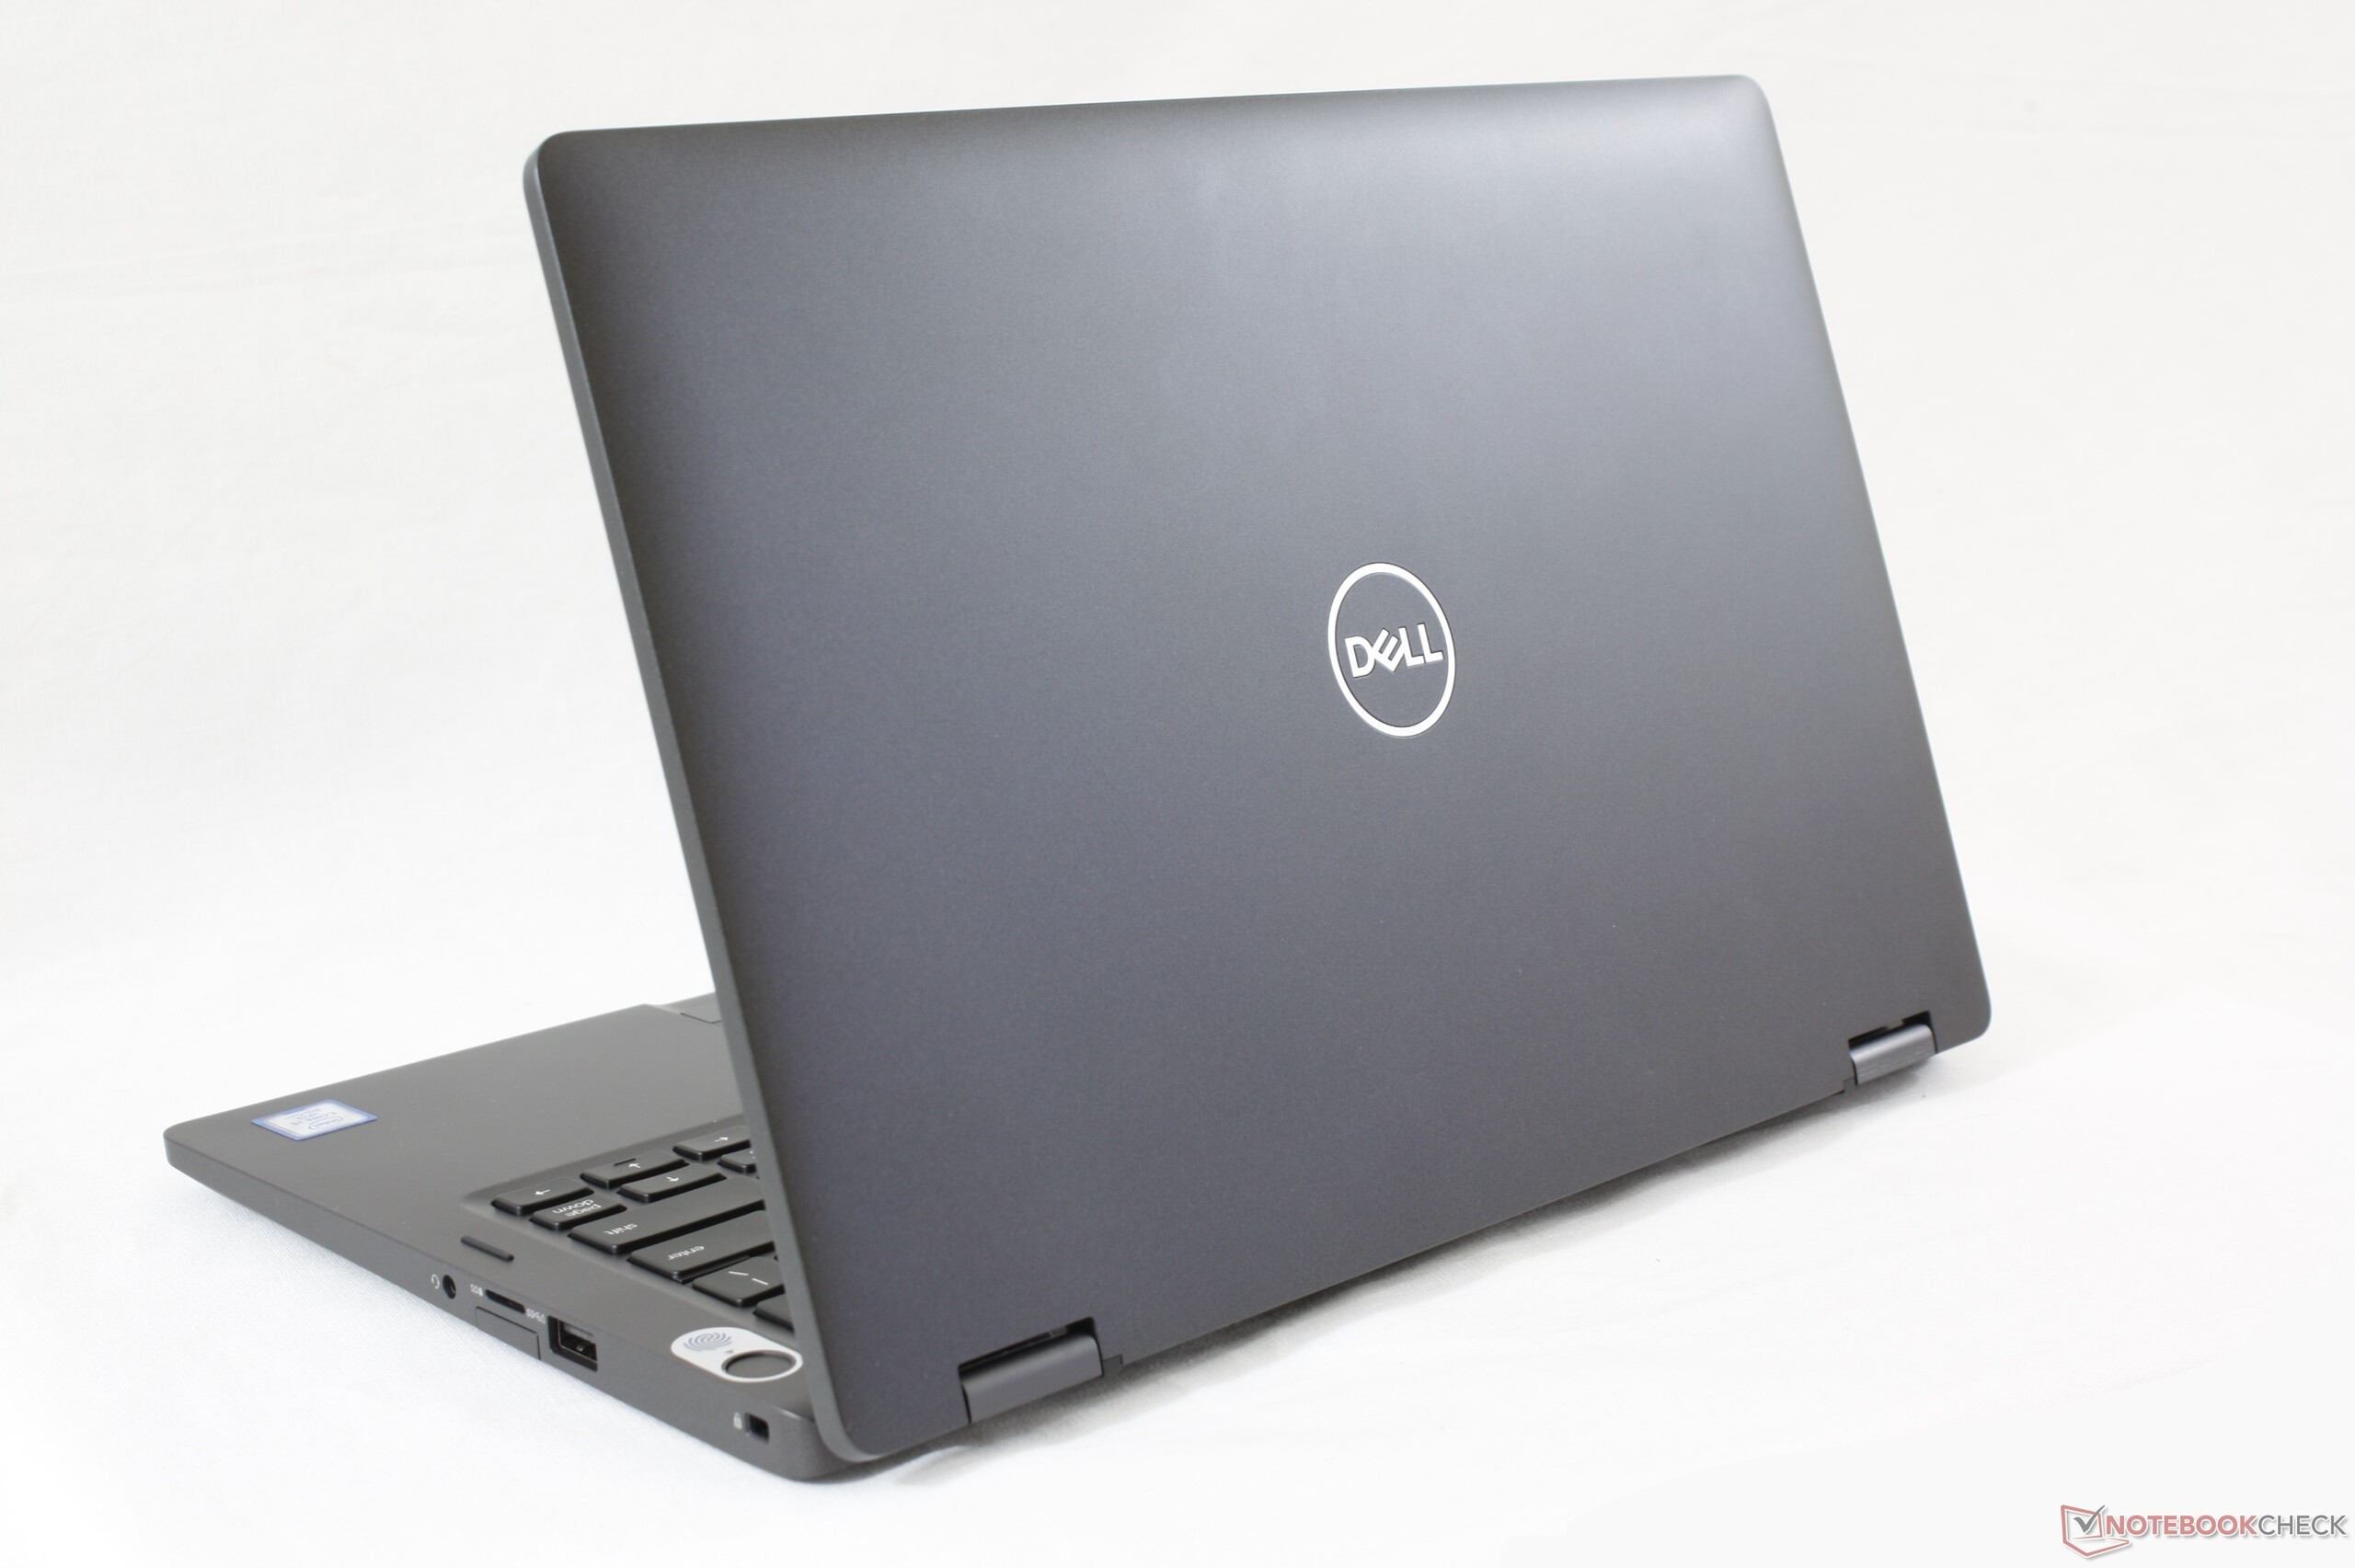
Breve Análise do Conversível Dell Latitude 13 5300 2-em-1: Uma alternativa ThinkPad X390 Yoga
| SD Card Reader | |
| average JPG Copy Test (av. of 3 runs) | |
| Dell XPS 13 9380 2019 (Toshiba Exceria Pro SDXC 64 GB UHS-II) | |
| Dell Latitude 13 5300 2-in-1 (Toshiba Exceria Pro M501) | |
| Samsung Notebook 9 NP930QAA (Toshiba Exceria Pro M501 microSDXC 64GB) | |
| Lenovo ThinkPad X390-20Q1S02M00 (Toshiba Exceria Pro M501) | |
| HP ProBook 430 G6-5TJ89EA (Toshiba Exceria Pro SDXC 64 GB UHS-II) | |
| maximum AS SSD Seq Read Test (1GB) | |
| Dell XPS 13 9380 2019 (Toshiba Exceria Pro SDXC 64 GB UHS-II) | |
| Dell Latitude 13 5300 2-in-1 (Toshiba Exceria Pro M501) | |
| Samsung Notebook 9 NP930QAA (Toshiba Exceria Pro M501 microSDXC 64GB) | |
| Lenovo ThinkPad X390-20Q1S02M00 (Toshiba Exceria Pro M501) | |
| HP ProBook 430 G6-5TJ89EA (Toshiba Exceria Pro SDXC 64 GB UHS-II) | |
| |||||||||||||||||||||||||
iluminação: 89 %
iluminação com acumulador: 316.2 cd/m²
Contraste: 1171:1 (Preto: 0.27 cd/m²)
ΔE ColorChecker Calman: 5.67 | ∀{0.5-29.43 Ø4.72}
calibrated: 1.26
ΔE Greyscale Calman: 7 | ∀{0.09-98 Ø4.97}
95.7% sRGB (Argyll 1.6.3 3D)
61.4% AdobeRGB 1998 (Argyll 1.6.3 3D)
66.5% AdobeRGB 1998 (Argyll 3D)
95.7% sRGB (Argyll 3D)
64.9% Display P3 (Argyll 3D)
Gamma: 2.64
CCT: 6440 K
| Dell Latitude 13 5300 2-in-1 LG Philips LGD05DC, IPS, 13.3", 1920x1080 | Lenovo ThinkPad X390-20Q1S02M00 LP133WF7-SPB1, IPS LED, 13.3", 1920x1080 | Samsung Notebook 9 NP930QAA BOE075E, IPS, 13.3", 1920x1080 | Dell XPS 13 9380 2019 ID: AUO 282B B133ZAN Dell: 90NTH, IPS, 13.3", 3840x2160 | HP Spectre x360 13t-ae000 LGD0588, IPS, 13.3", 3840x2160 | HP EliteBook x360 1030 G3 45X96UT Chi Mei CMN1380, IPS, 13.3", 1920x1080 | |
|---|---|---|---|---|---|---|
| Display | 0% | -1% | -2% | 8% | 3% | |
| Display P3 Coverage (%) | 64.9 | 65.3 1% | 65.4 1% | 64.7 0% | 71.9 11% | 66.7 3% |
| sRGB Coverage (%) | 95.7 | 95.9 0% | 91.5 -4% | 93.1 -3% | 98.1 3% | 98.6 3% |
| AdobeRGB 1998 Coverage (%) | 66.5 | 66.6 0% | 66.2 0% | 65.3 -2% | 73.1 10% | 68.7 3% |
| Response Times | -48% | -23% | -52% | -36% | -9% | |
| Response Time Grey 50% / Grey 80% * (ms) | 37.6 ? | 57.6 ? -53% | 49.2 ? -31% | 58 ? -54% | 51.6 ? -37% | 39.6 ? -5% |
| Response Time Black / White * (ms) | 24 ? | 34 ? -42% | 27.6 ? -15% | 36 ? -50% | 32.4 ? -35% | 27.2 ? -13% |
| PWM Frequency (Hz) | 3049 ? | 26040 ? | ||||
| Screen | 25% | -5% | 2% | 19% | 17% | |
| Brightness middle (cd/m²) | 316.2 | 356 13% | 473 50% | 404 28% | 329.8 4% | 467.2 48% |
| Brightness (cd/m²) | 298 | 336 13% | 441 48% | 389 31% | 318 7% | 445 49% |
| Brightness Distribution (%) | 89 | 88 -1% | 88 -1% | 85 -4% | 74 -17% | 91 2% |
| Black Level * (cd/m²) | 0.27 | 0.16 41% | 0.57 -111% | 0.37 -37% | 0.25 7% | 0.4 -48% |
| Contrast (:1) | 1171 | 2225 90% | 830 -29% | 1092 -7% | 1319 13% | 1168 0% |
| Colorchecker dE 2000 * | 5.67 | 3.6 37% | 3.72 34% | 3.72 34% | 2.37 58% | 2.41 57% |
| Colorchecker dE 2000 max. * | 7.97 | 5.5 31% | 7.83 2% | 7.38 7% | 4.08 49% | 5.58 30% |
| Colorchecker dE 2000 calibrated * | 1.26 | 1.1 13% | 2.14 -70% | 2.06 -63% | 1.33 -6% | |
| Greyscale dE 2000 * | 7 | 4.7 33% | 5.1 27% | 4.44 37% | 2.8 60% | 3.7 47% |
| Gamma | 2.64 83% | 2.48 89% | 2.31 95% | 2.34 94% | 2.145 103% | 2.37 93% |
| CCT | 6440 101% | 6374 102% | 7569 86% | 7095 92% | 6441 101% | 7158 91% |
| Color Space (Percent of AdobeRGB 1998) (%) | 61.4 | 61.3 0% | 58.9 -4% | 60 -2% | 67 9% | 62.5 2% |
| Color Space (Percent of sRGB) (%) | 95.7 | 95.7 0% | 90.8 -5% | 93 -3% | 98 2% | 99.6 4% |
| Média Total (Programa/Configurações) | -8% /
11% | -10% /
-7% | -17% /
-6% | -3% /
10% | 4% /
11% |
* ... menor é melhor
Exibir tempos de resposta
| ↔ Tempo de resposta preto para branco | ||
|---|---|---|
| 24 ms ... ascensão ↗ e queda ↘ combinadas | ↗ 13.2 ms ascensão | 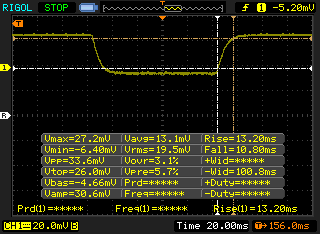 |
| ↘ 10.8 ms queda | ||
| A tela mostra boas taxas de resposta em nossos testes, mas pode ser muito lenta para jogadores competitivos. Em comparação, todos os dispositivos testados variam de 0.1 (mínimo) a 240 (máximo) ms. » 54 % de todos os dispositivos são melhores. Isso significa que o tempo de resposta medido é pior que a média de todos os dispositivos testados (19.8 ms). | ||
| ↔ Tempo de resposta 50% cinza a 80% cinza | ||
| 37.6 ms ... ascensão ↗ e queda ↘ combinadas | ↗ 18.8 ms ascensão | 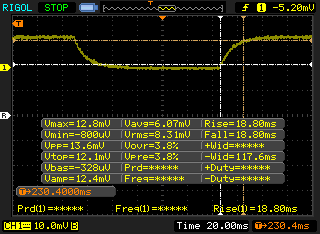 |
| ↘ 18.8 ms queda | ||
| A tela mostra taxas de resposta lentas em nossos testes e será insatisfatória para os jogadores. Em comparação, todos os dispositivos testados variam de 0.165 (mínimo) a 636 (máximo) ms. » 55 % de todos os dispositivos são melhores. Isso significa que o tempo de resposta medido é pior que a média de todos os dispositivos testados (31 ms). | ||
Cintilação da tela / PWM (modulação por largura de pulso)
| Tela tremeluzindo / PWM não detectado | 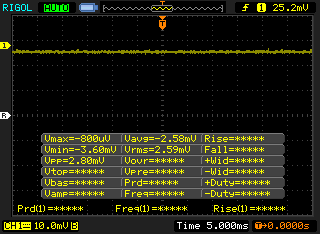 | ||
[pwm_comparison] Em comparação: 52 % de todos os dispositivos testados não usam PWM para escurecer a tela. Se PWM foi detectado, uma média de 7763 (mínimo: 5 - máximo: 343500) Hz foi medida. | |||
| Cinebench R15 | |
| CPU Single 64Bit | |
| Dell Latitude 7400 2-in-1 | |
| Dell Inspiron 13 7380 | |
| Dell G3 15 3579 | |
| Dell XPS 13 9370 i7 UHD | |
| Dell Latitude 13 5300 2-in-1 | |
| Dell XPS 13 9360 FHD i7 Iris | |
| Dell XPS 13 9380 2019 | |
| Dell Latitude 14 5495 | |
| Dell Latitude 13 3390 | |
| Dell XPS 13 9360-4764 | |
| HP 14-dk0008ng | |
| CPU Multi 64Bit | |
| Dell G3 15 3579 | |
| Dell Latitude 14 5495 | |
| Dell XPS 13 9380 2019 | |
| Dell XPS 13 9370 i7 UHD | |
| Dell Latitude 7400 2-in-1 | |
| Dell Latitude 13 5300 2-in-1 | |
| Dell Inspiron 13 7380 | |
| Dell Latitude 13 3390 | |
| HP 14-dk0008ng | |
| Dell XPS 13 9360-4764 | |
| Dell XPS 13 9360 FHD i7 Iris | |
| PCMark 8 Home Score Accelerated v2 | 3485 pontos | |
| PCMark 8 Work Score Accelerated v2 | 4911 pontos | |
| PCMark 10 Score | 3863 pontos | |
Ajuda | ||
| Dell Latitude 13 5300 2-in-1 SK hynix PC401 HFS256GD9TNG | Lenovo ThinkPad X390-20Q1S02M00 Intel SSD Pro 7600p SSDPEKKF512G8L | Huawei MateBook 13 i7 Samsung SSD PM981 MZVLB512HAJQ | HP Spectre x360 13t-ae000 Lite-On CA1-8D256-HP | HP EliteBook x360 1030 G3 45X96UT Samsung SSD PM981 MZVLB512HAJQ | |
|---|---|---|---|---|---|
| AS SSD | 93% | 123% | 5% | 89% | |
| Seq Read (MB/s) | 1236 | 2689 118% | 1889 53% | 2133 73% | 1798 45% |
| Seq Write (MB/s) | 500 | 1462 192% | 1812 262% | 945 89% | 1374 175% |
| 4K Read (MB/s) | 40.1 | 63.8 59% | 55.5 38% | 29.84 -26% | 46.05 15% |
| 4K Write (MB/s) | 115.7 | 139.8 21% | 118.4 2% | 91.4 -21% | 104.3 -10% |
| 4K-64 Read (MB/s) | 474.1 | 865 82% | 1257 165% | 725 53% | 1408 197% |
| 4K-64 Write (MB/s) | 350.4 | 1041 197% | 1571 348% | 404.1 15% | 790 125% |
| Access Time Read * (ms) | 0.04 | 0.037 7% | 0.041 -2% | 0.121 -203% | 0.041 -2% |
| Access Time Write * (ms) | 0.051 | 0.024 53% | 0.032 37% | 0.13 -155% | 0.036 29% |
| Score Read (Points) | 638 | 1198 88% | 1502 135% | 968 52% | 1634 156% |
| Score Write (Points) | 516 | 1328 157% | 1871 263% | 590 14% | 1032 100% |
| Score Total (Points) | 1456 | 3095 113% | 4147 185% | 1998 37% | 3484 139% |
| Copy ISO MB/s (MB/s) | 818 | 1290 58% | 1800 120% | 1492 82% | 1947 138% |
| Copy Program MB/s (MB/s) | 395.5 | 436.5 10% | 385.6 -3% | 300.9 -24% | 453.9 15% |
| Copy Game MB/s (MB/s) | 452.5 | 1147 153% | 982 117% | 839 85% | 990 119% |
* ... menor é melhor

| 3DMark | |
| 1280x720 Cloud Gate Standard Graphics | |
| Dell G3 15 3579 | |
| Huawei MateBook 13 i7 | |
| HP 14-dk0008ng | |
| Dell XPS 13 9360 FHD i7 Iris | |
| Dell Latitude 14 5495 | |
| Dell Inspiron 13 7380 | |
| Dell XPS 13 9380 2019 | |
| Dell XPS 13 9370 i7 UHD | |
| Média Intel UHD Graphics 620 (6205 - 16400, n=225) | |
| Dell Latitude 13 3390 | |
| Dell XPS 13 9360-4764 | |
| Dell Latitude 13 5300 2-in-1 | |
| HP ProBook 430 G6-5TJ89EA | |
| 1280x720 Cloud Gate Standard Score | |
| Dell G3 15 3579 | |
| Huawei MateBook 13 i7 | |
| HP 14-dk0008ng | |
| Dell XPS 13 9380 2019 | |
| Dell Latitude 14 5495 | |
| Dell Inspiron 13 7380 | |
| Dell XPS 13 9370 i7 UHD | |
| Média Intel UHD Graphics 620 (5358 - 10960, n=225) | |
| Dell Latitude 13 5300 2-in-1 | |
| Dell Latitude 13 3390 | |
| Dell XPS 13 9360 FHD i7 Iris | |
| HP ProBook 430 G6-5TJ89EA | |
| Dell XPS 13 9360-4764 | |
| 3DMark 11 | |
| 1280x720 Performance GPU | |
| Dell G3 15 3579 | |
| Huawei MateBook 13 i7 | |
| HP 14-dk0008ng | |
| Dell Latitude 14 5495 | |
| Dell XPS 13 9360 FHD i7 Iris | |
| Dell XPS 13 9370 i7 UHD | |
| Dell Inspiron 13 7380 | |
| Dell XPS 13 9380 2019 | |
| Média Intel UHD Graphics 620 (1144 - 3432, n=244) | |
| Dell Latitude 13 5300 2-in-1 | |
| HP ProBook 430 G6-5TJ89EA | |
| Dell XPS 13 9360-4764 | |
| Dell Latitude 13 3390 | |
| 1280x720 Performance Combined | |
| Dell G3 15 3579 | |
| Huawei MateBook 13 i7 | |
| HP 14-dk0008ng | |
| Dell Latitude 14 5495 | |
| Dell XPS 13 9360 FHD i7 Iris | |
| Dell XPS 13 9380 2019 | |
| Dell XPS 13 9370 i7 UHD | |
| Dell Inspiron 13 7380 | |
| Média Intel UHD Graphics 620 (927 - 2505, n=244) | |
| Dell XPS 13 9360-4764 | |
| Dell Latitude 13 3390 | |
| Dell Latitude 13 5300 2-in-1 | |
| HP ProBook 430 G6-5TJ89EA | |
| 3DMark 06 Standard Score | 10108 pontos | |
| 3DMark 11 Performance | 1896 pontos | |
| 3DMark Ice Storm Standard Score | 51629 pontos | |
| 3DMark Cloud Gate Standard Score | 8000 pontos | |
Ajuda | ||
| Dell Latitude 13 5300 2-in-1 UHD Graphics 620, i5-8365U, SK hynix PC401 HFS256GD9TNG | Lenovo ThinkPad X390-20Q1S02M00 UHD Graphics 620, i5-8265U, Intel SSD Pro 7600p SSDPEKKF512G8L | Huawei MateBook 13 i7 GeForce MX150, i7-8565U, Samsung SSD PM981 MZVLB512HAJQ | Samsung Notebook 9 NP930QAA UHD Graphics 620, i5-8550U, Samsung PM961 MZVLW256HEHP | HP Spectre x360 13t-ae000 UHD Graphics 620, i5-8550U, Lite-On CA1-8D256-HP | HP EliteBook x360 1030 G3 45X96UT UHD Graphics 620, i7-8650U, Samsung SSD PM981 MZVLB512HAJQ | |
|---|---|---|---|---|---|---|
| Noise | 2% | -1% | 2% | 7% | 6% | |
| desligado / ambiente * (dB) | 28.5 | 29.2 -2% | 28.6 -0% | 29 -2% | 28.2 1% | 28.5 -0% |
| Idle Minimum * (dB) | 28.5 | 29.2 -2% | 28.6 -0% | 29 -2% | 28.2 1% | 28.5 -0% |
| Idle Average * (dB) | 28.5 | 29.2 -2% | 28.6 -0% | 29 -2% | 28.2 1% | 28.5 -0% |
| Idle Maximum * (dB) | 28.5 | 29.2 -2% | 28.6 -0% | 29 -2% | 28.2 1% | 28.5 -0% |
| Load Average * (dB) | 35.5 | 34.8 2% | 34.2 4% | 32.6 8% | 30.7 14% | 30.8 13% |
| Load Maximum * (dB) | 42.1 | 34.8 17% | 47 -12% | 36.7 13% | 32.9 22% | 32.8 22% |
| Witcher 3 ultra * (dB) | 43 |
* ... menor é melhor
Barulho
| Ocioso |
| 28.5 / 28.5 / 28.5 dB |
| Carga |
| 35.5 / 42.1 dB |
 | ||
30 dB silencioso 40 dB(A) audível 50 dB(A) ruidosamente alto |
||
min: | ||
(-) A temperatura máxima no lado superior é 47.2 °C / 117 F, em comparação com a média de 34.3 °C / 94 F , variando de 21.2 a 62.5 °C para a classe Office.
(-) A parte inferior aquece até um máximo de 60 °C / 140 F, em comparação com a média de 36.8 °C / 98 F
(+) Em uso inativo, a temperatura média para o lado superior é 28.7 °C / 84 F, em comparação com a média do dispositivo de 29.5 °C / ### class_avg_f### F.
(+) Os apoios para as mãos e o touchpad são mais frios que a temperatura da pele, com um máximo de 31.2 °C / 88.2 F e, portanto, são frios ao toque.
(-) A temperatura média da área do apoio para as mãos de dispositivos semelhantes foi 27.5 °C / 81.5 F (-3.7 °C / -6.7 F).
Dell Latitude 13 5300 2-in-1 análise de áudio
(+) | os alto-falantes podem tocar relativamente alto (###valor### dB)
Graves 100 - 315Hz
(±) | graves reduzidos - em média 12.5% menor que a mediana
(±) | a linearidade dos graves é média (10.6% delta para a frequência anterior)
Médios 400 - 2.000 Hz
(+) | médios equilibrados - apenas 3.9% longe da mediana
(+) | médios são lineares (6.8% delta para frequência anterior)
Altos 2 - 16 kHz
(+) | agudos equilibrados - apenas 1.6% longe da mediana
(+) | os máximos são lineares (4.9% delta da frequência anterior)
Geral 100 - 16.000 Hz
(+) | o som geral é linear (14.5% diferença em relação à mediana)
Comparado com a mesma classe
» 12% de todos os dispositivos testados nesta classe foram melhores, 3% semelhantes, 85% piores
» O melhor teve um delta de 7%, a média foi 21%, o pior foi 53%
Comparado com todos os dispositivos testados
» 18% de todos os dispositivos testados foram melhores, 4% semelhantes, 78% piores
» O melhor teve um delta de 4%, a média foi 23%, o pior foi 134%
Apple MacBook 12 (Early 2016) 1.1 GHz análise de áudio
(+) | os alto-falantes podem tocar relativamente alto (###valor### dB)
Graves 100 - 315Hz
(±) | graves reduzidos - em média 11.3% menor que a mediana
(±) | a linearidade dos graves é média (14.2% delta para a frequência anterior)
Médios 400 - 2.000 Hz
(+) | médios equilibrados - apenas 2.4% longe da mediana
(+) | médios são lineares (5.5% delta para frequência anterior)
Altos 2 - 16 kHz
(+) | agudos equilibrados - apenas 2% longe da mediana
(+) | os máximos são lineares (4.5% delta da frequência anterior)
Geral 100 - 16.000 Hz
(+) | o som geral é linear (10.2% diferença em relação à mediana)
Comparado com a mesma classe
» 7% de todos os dispositivos testados nesta classe foram melhores, 2% semelhantes, 91% piores
» O melhor teve um delta de 5%, a média foi 18%, o pior foi 53%
Comparado com todos os dispositivos testados
» 5% de todos os dispositivos testados foram melhores, 1% semelhantes, 94% piores
» O melhor teve um delta de 4%, a média foi 23%, o pior foi 134%
| desligado | |
| Ocioso | |
| Carga |
|
Key:
min: | |
| Dell Latitude 13 5300 2-in-1 i5-8365U, UHD Graphics 620, SK hynix PC401 HFS256GD9TNG, IPS, 1920x1080, 13.3" | Lenovo ThinkPad X390-20Q1S02M00 i5-8265U, UHD Graphics 620, Intel SSD Pro 7600p SSDPEKKF512G8L, IPS LED, 1920x1080, 13.3" | Huawei MateBook 13 i7 i7-8565U, GeForce MX150, Samsung SSD PM981 MZVLB512HAJQ, IPS, 2160x1440, 13" | Samsung Notebook 9 NP930QAA i5-8550U, UHD Graphics 620, Samsung PM961 MZVLW256HEHP, IPS, 1920x1080, 13.3" | HP Spectre x360 13t-ae000 i5-8550U, UHD Graphics 620, Lite-On CA1-8D256-HP, IPS, 3840x2160, 13.3" | HP EliteBook 735 G5 3UN62EA R7 2700U, Vega 10, Toshiba KBG30ZMV256G, IPS, 1920x1080, 13.3" | HP EliteBook x360 1030 G3 45X96UT i7-8650U, UHD Graphics 620, Samsung SSD PM981 MZVLB512HAJQ, IPS, 1920x1080, 13.3" | |
|---|---|---|---|---|---|---|---|
| Power Consumption | -14% | -43% | -53% | -40% | -43% | -21% | |
| Idle Minimum * (Watt) | 2.8 | 3.4 -21% | 3.5 -25% | 4.4 -57% | 5.9 -111% | 5.5 -96% | 3.4 -21% |
| Idle Average * (Watt) | 5.1 | 5.6 -10% | 7.5 -47% | 11.8 -131% | 9.8 -92% | 9.4 -84% | 7.6 -49% |
| Idle Maximum * (Watt) | 7.1 | 8.7 -23% | 12.4 -75% | 15.5 -118% | 10.6 -49% | 11.6 -63% | 11.5 -62% |
| Load Average * (Watt) | 39.9 | 43.6 -9% | 64.2 -61% | 38 5% | 36.6 8% | 39 2% | 35.4 11% |
| Load Maximum * (Watt) | 60.3 | 65 -8% | 65.7 -9% | 39.8 34% | 34.3 43% | 45.6 24% | 51.9 14% |
| Witcher 3 ultra * (Watt) | 52.5 |
* ... menor é melhor
| Dell Latitude 13 5300 2-in-1 i5-8365U, UHD Graphics 620, 60 Wh | Lenovo ThinkPad X390-20Q1S02M00 i5-8265U, UHD Graphics 620, 48 Wh | Huawei MateBook 13 i7 i7-8565U, GeForce MX150, 41.7 Wh | Samsung Notebook 9 NP930QAA i5-8550U, UHD Graphics 620, 39 Wh | HP Spectre x360 13t-ae000 i5-8550U, UHD Graphics 620, 60 Wh | HP EliteBook x360 1030 G3 45X96UT i7-8650U, UHD Graphics 620, 56.2 Wh | |
|---|---|---|---|---|---|---|
| Duração da bateria | -22% | -43% | -43% | -19% | -6% | |
| Reader / Idle (h) | 28.3 | 15.4 -46% | 14.6 -48% | |||
| WiFi v1.3 (h) | 10.4 | 8.3 -20% | 7.6 -27% | 6.6 -37% | 7.1 -32% | 9.8 -6% |
| Load (h) | 2.1 | 1.6 -24% | 0.9 -57% | 1.2 -43% | 2 -5% |
Pro
Contra
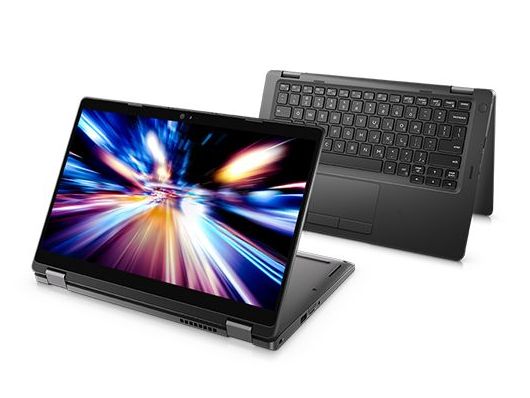
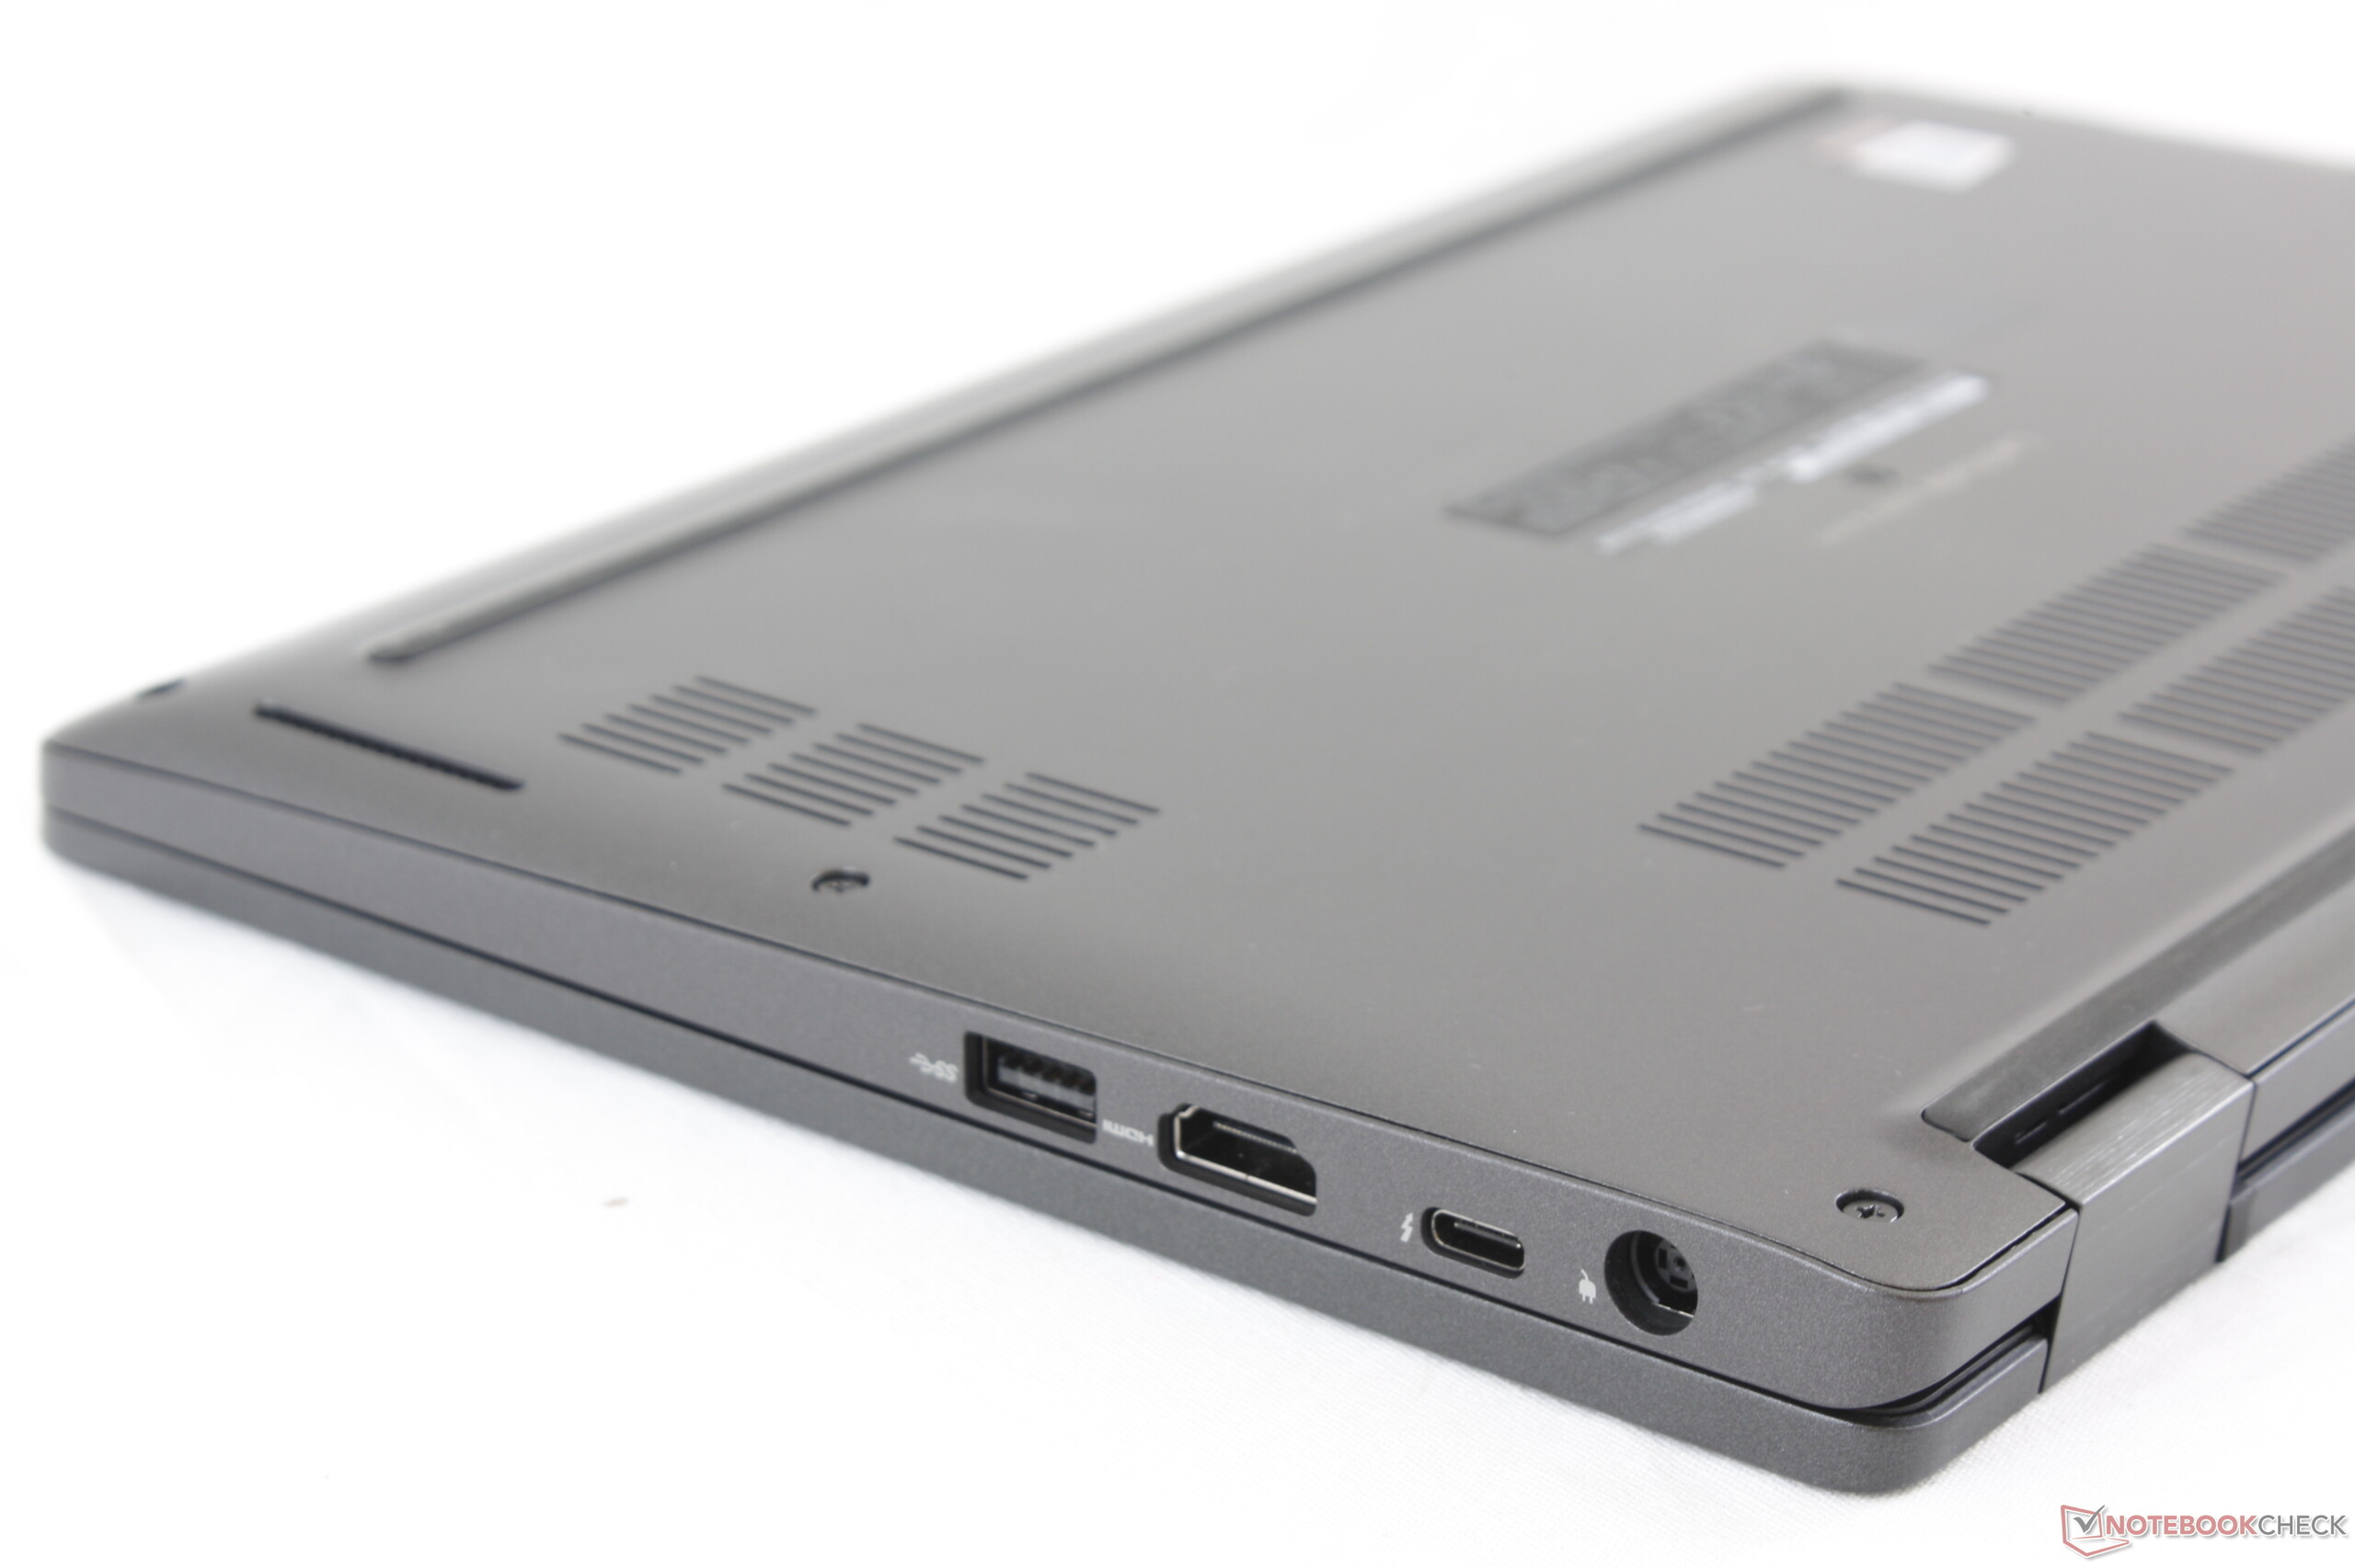
O Dell Latitude 13 5300 2-in-1 faz o trabalho, mas não faz nada melhor ou pior para se destacar entre outros subportáteis de empresariais. Suas dobradiças de 360 graus são úteis, mas também pesam um pouco mais do que as da Lenovo ou HP. Ele suporta uma caneta ativa, mas o suporte magnético é menos seguro do que uma alça física. Sua duração de bateria é longa, mas ainda vem com um adaptador de CA proprietário por padrão, em vez do USB Type-C mais universal.
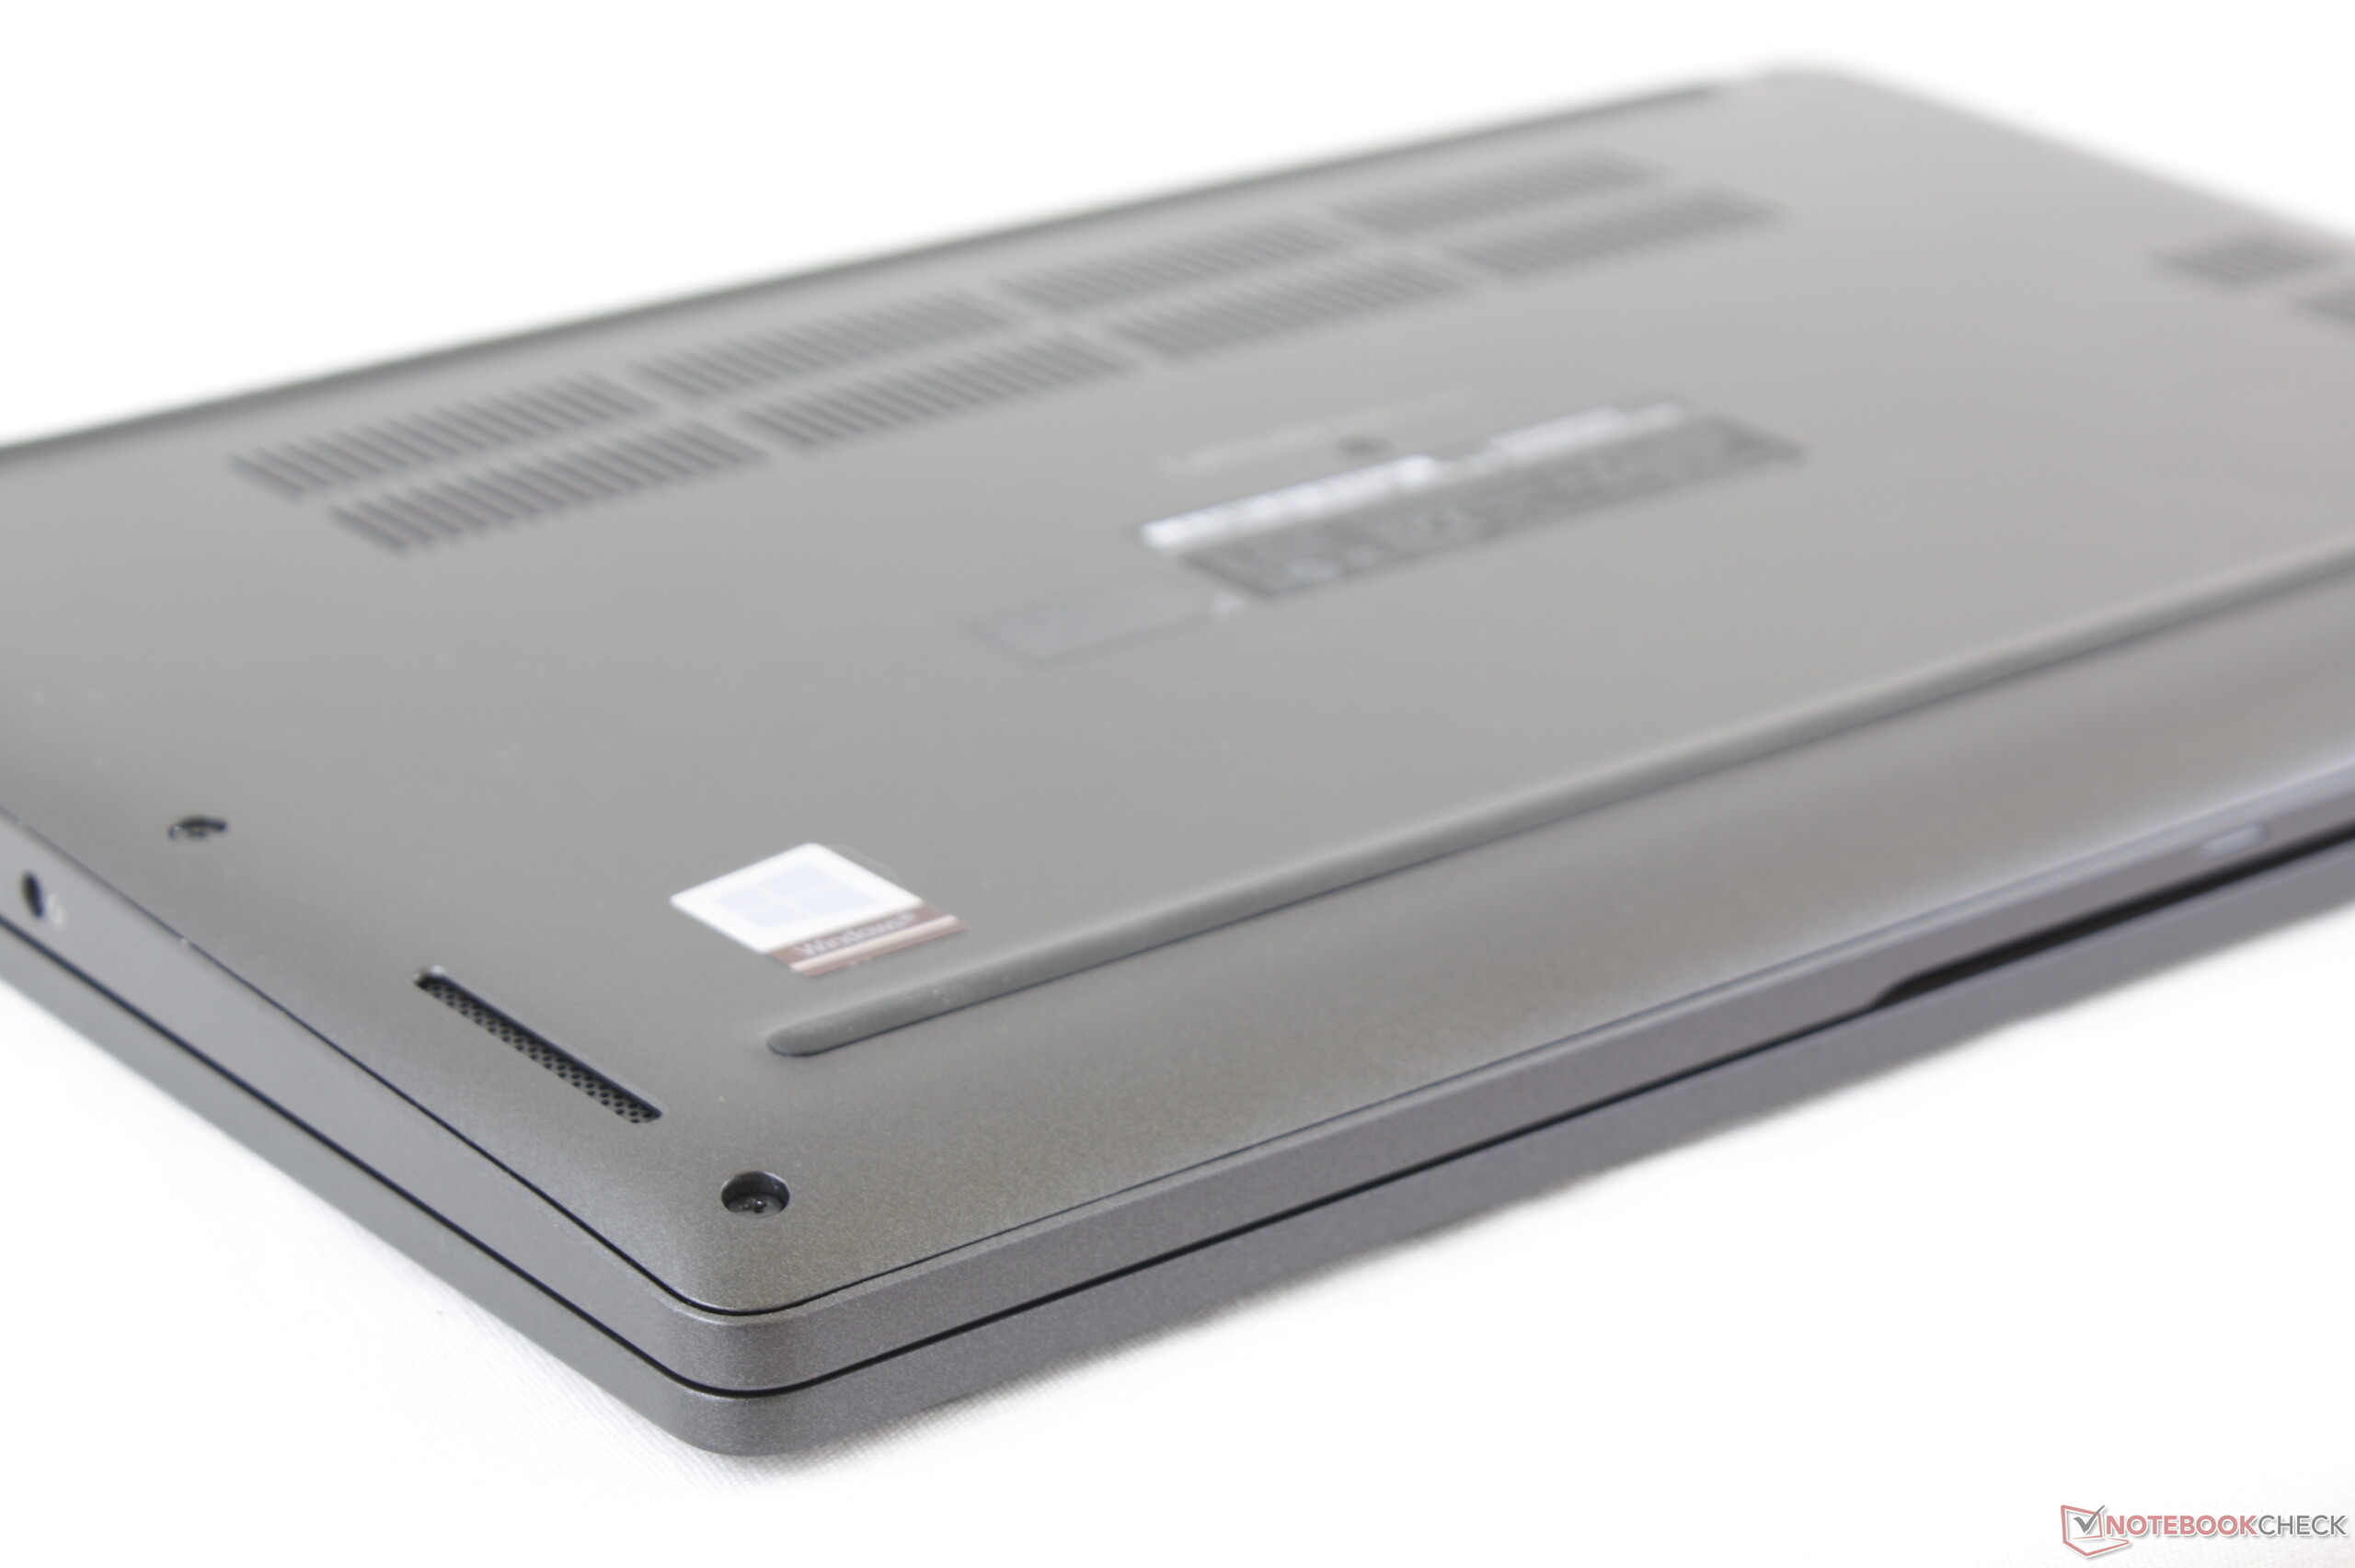
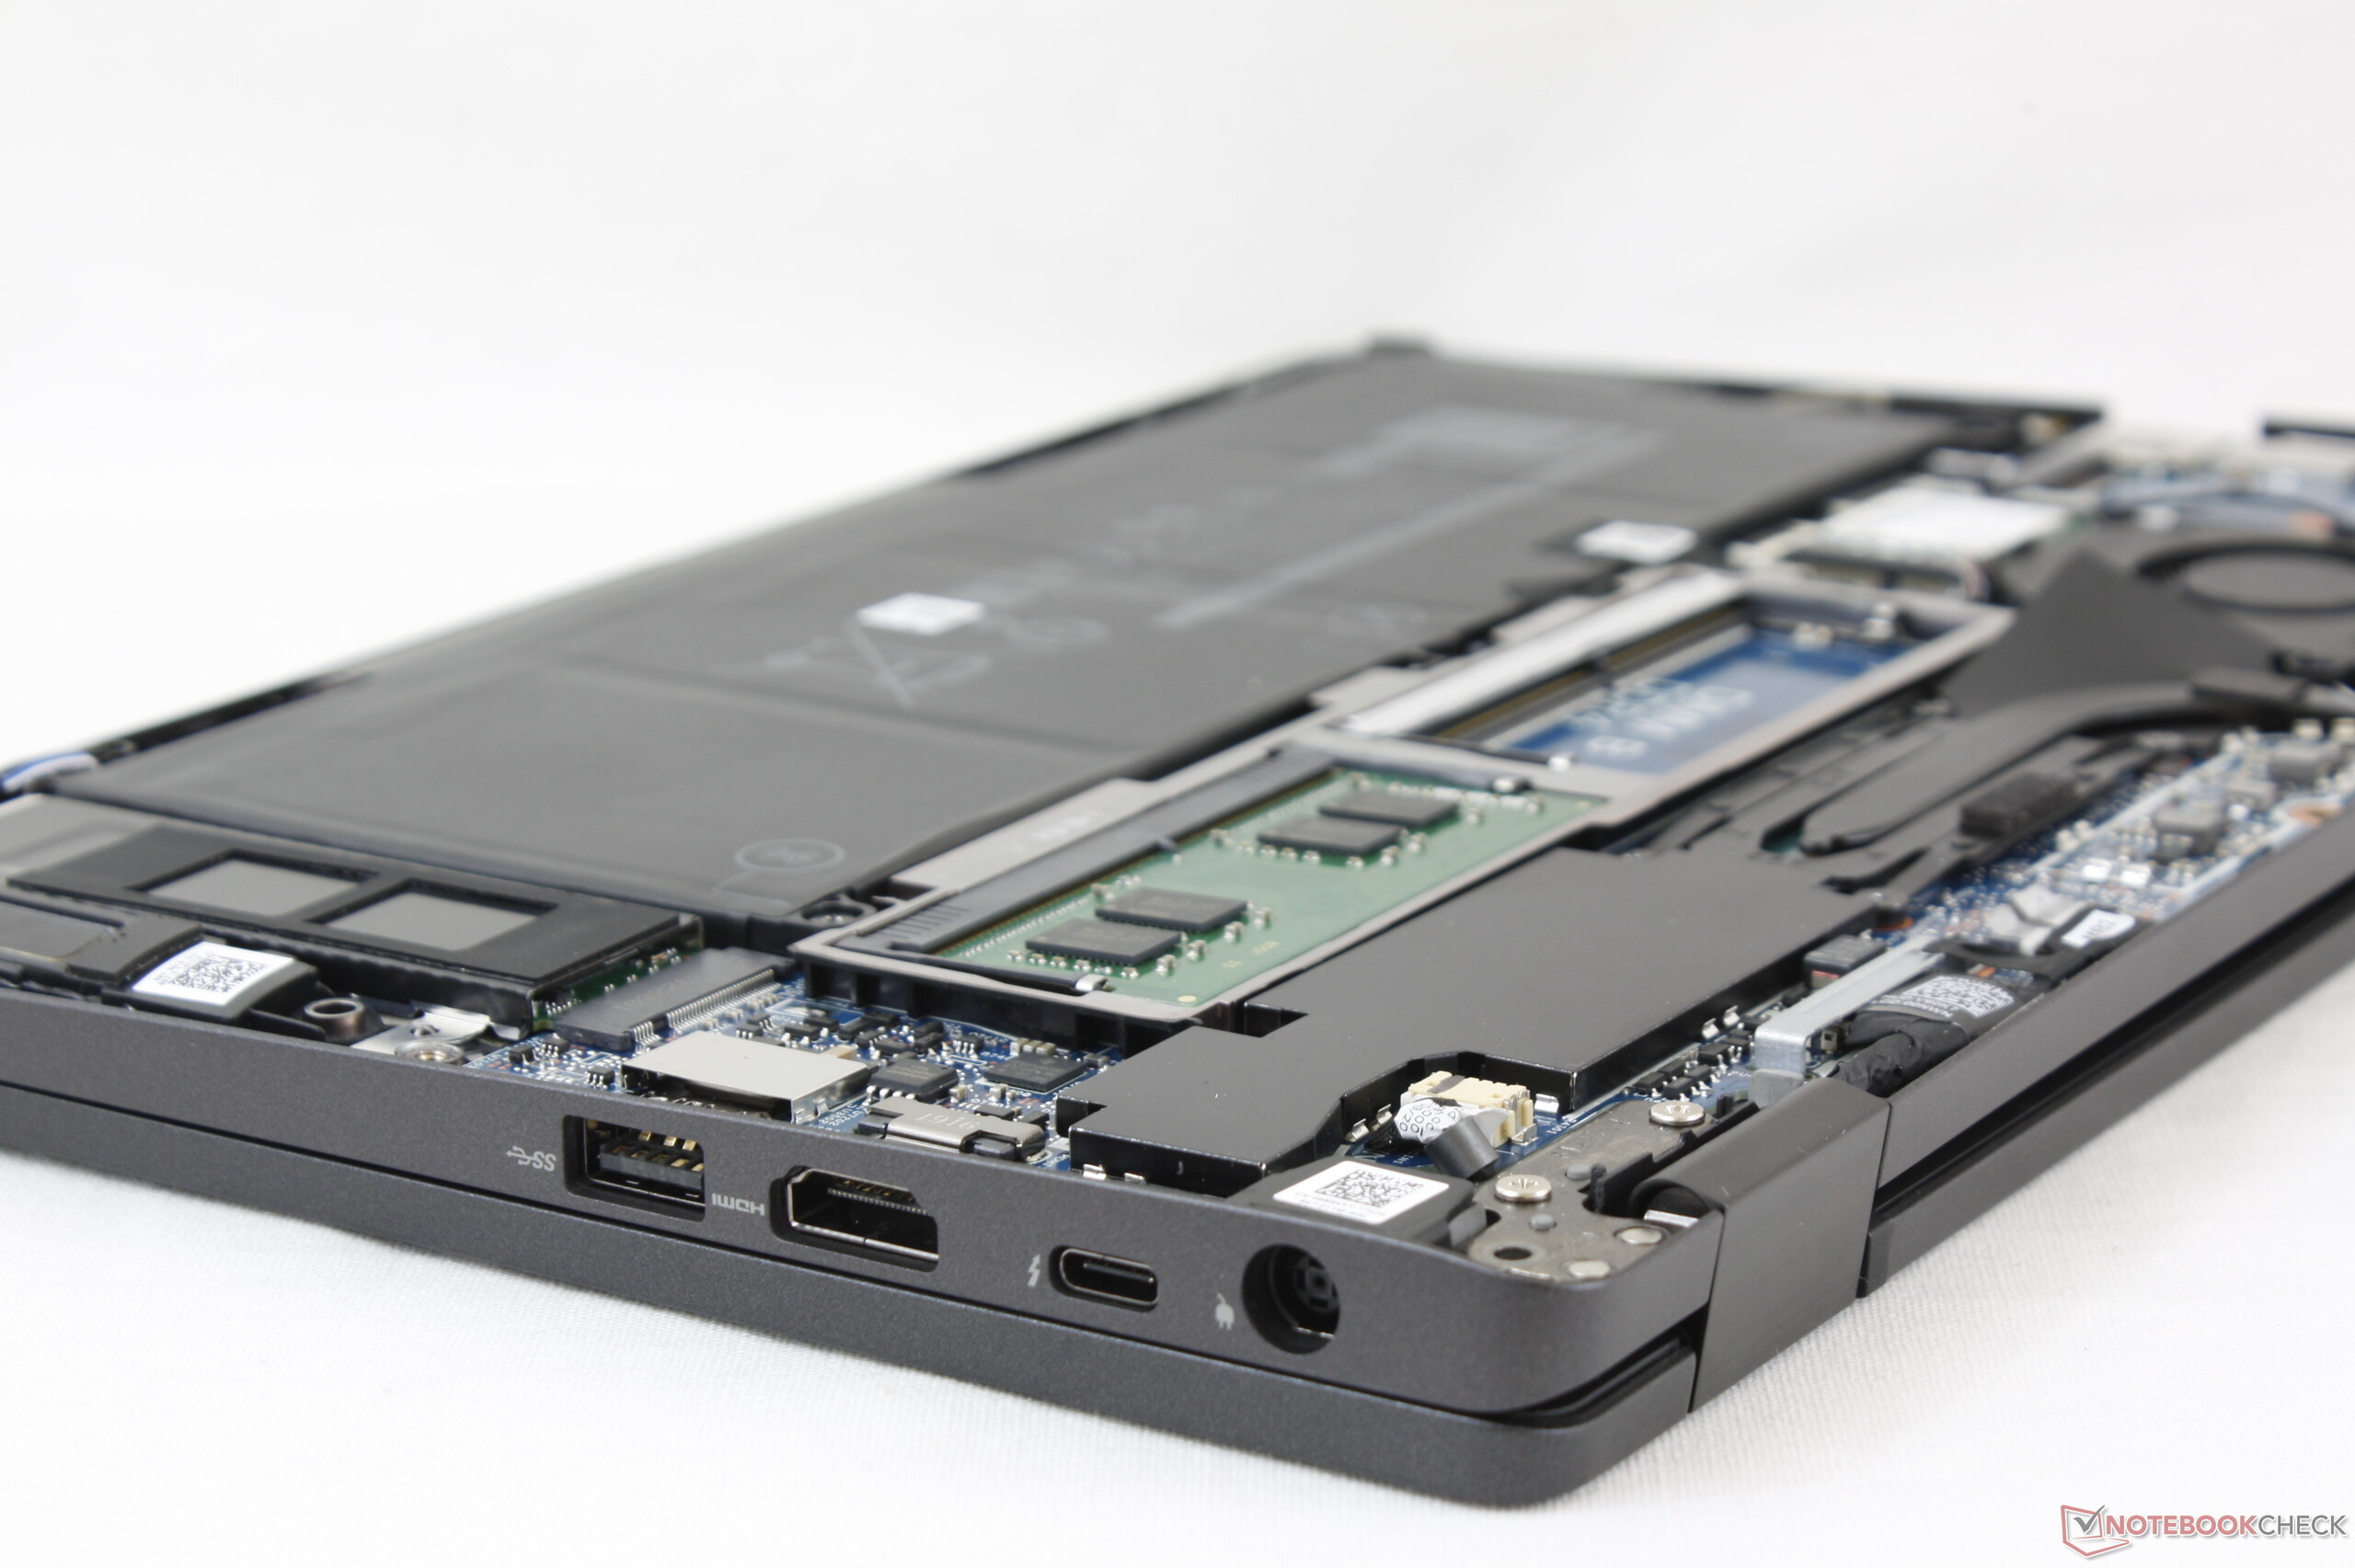
O melhor aspecto do conversível Latitude continua sendo a manutenção. A Dell torna muito fácil para os usuários finais atualizar componentes principais sem nada além de uma chave de fenda Philips. Recursos mais avançados, como o Thunderbolt 3, o leitor de Smart Card e o WWAN são todos opcionais, em vez de obrigatórios, para manter os preços baixos para os usuários que podem não precisar desses extras. Modelos de gama média sempre devem ter opções e certamente há muitas para a série Latitude 5000 para os usuários comprarem exatamente o que eles querem.
Se você está disposto a gastar um pouco mais, então o HP EliteBook x360 1030 G3 é a opção mais leve e mais brilhante com teclas mais firmes. De outra maneira, o Latitude 13 5300 2-em-1 é uma alternativa justa para o ThinkPad X390 Yoga dado que é o modelo ligeiramente mais forte e duradouro. Recomendamos ignorar a CPU Core i7 e investir em um SKU Core i5 com extras mais tangíveis, como WWAN, Thunderbolt 3, maior armazenamento ou proteção estendida.
É tudo sobre serviço, opções e conectividade. O Latitude 13 5300 2-em-1 tem os três pilares cobertos para os cenários típicos de escritório e fora do escritório. Ele ainda pode ser um pouco mais leve e brilhante para melhorar a usabilidade em exteriores e explorar ainda mais seu formato conversível.
Dell Latitude 13 5300 2-in-1
- 10/17/2019 v7 (old)
Allen Ngo
Price comparison
