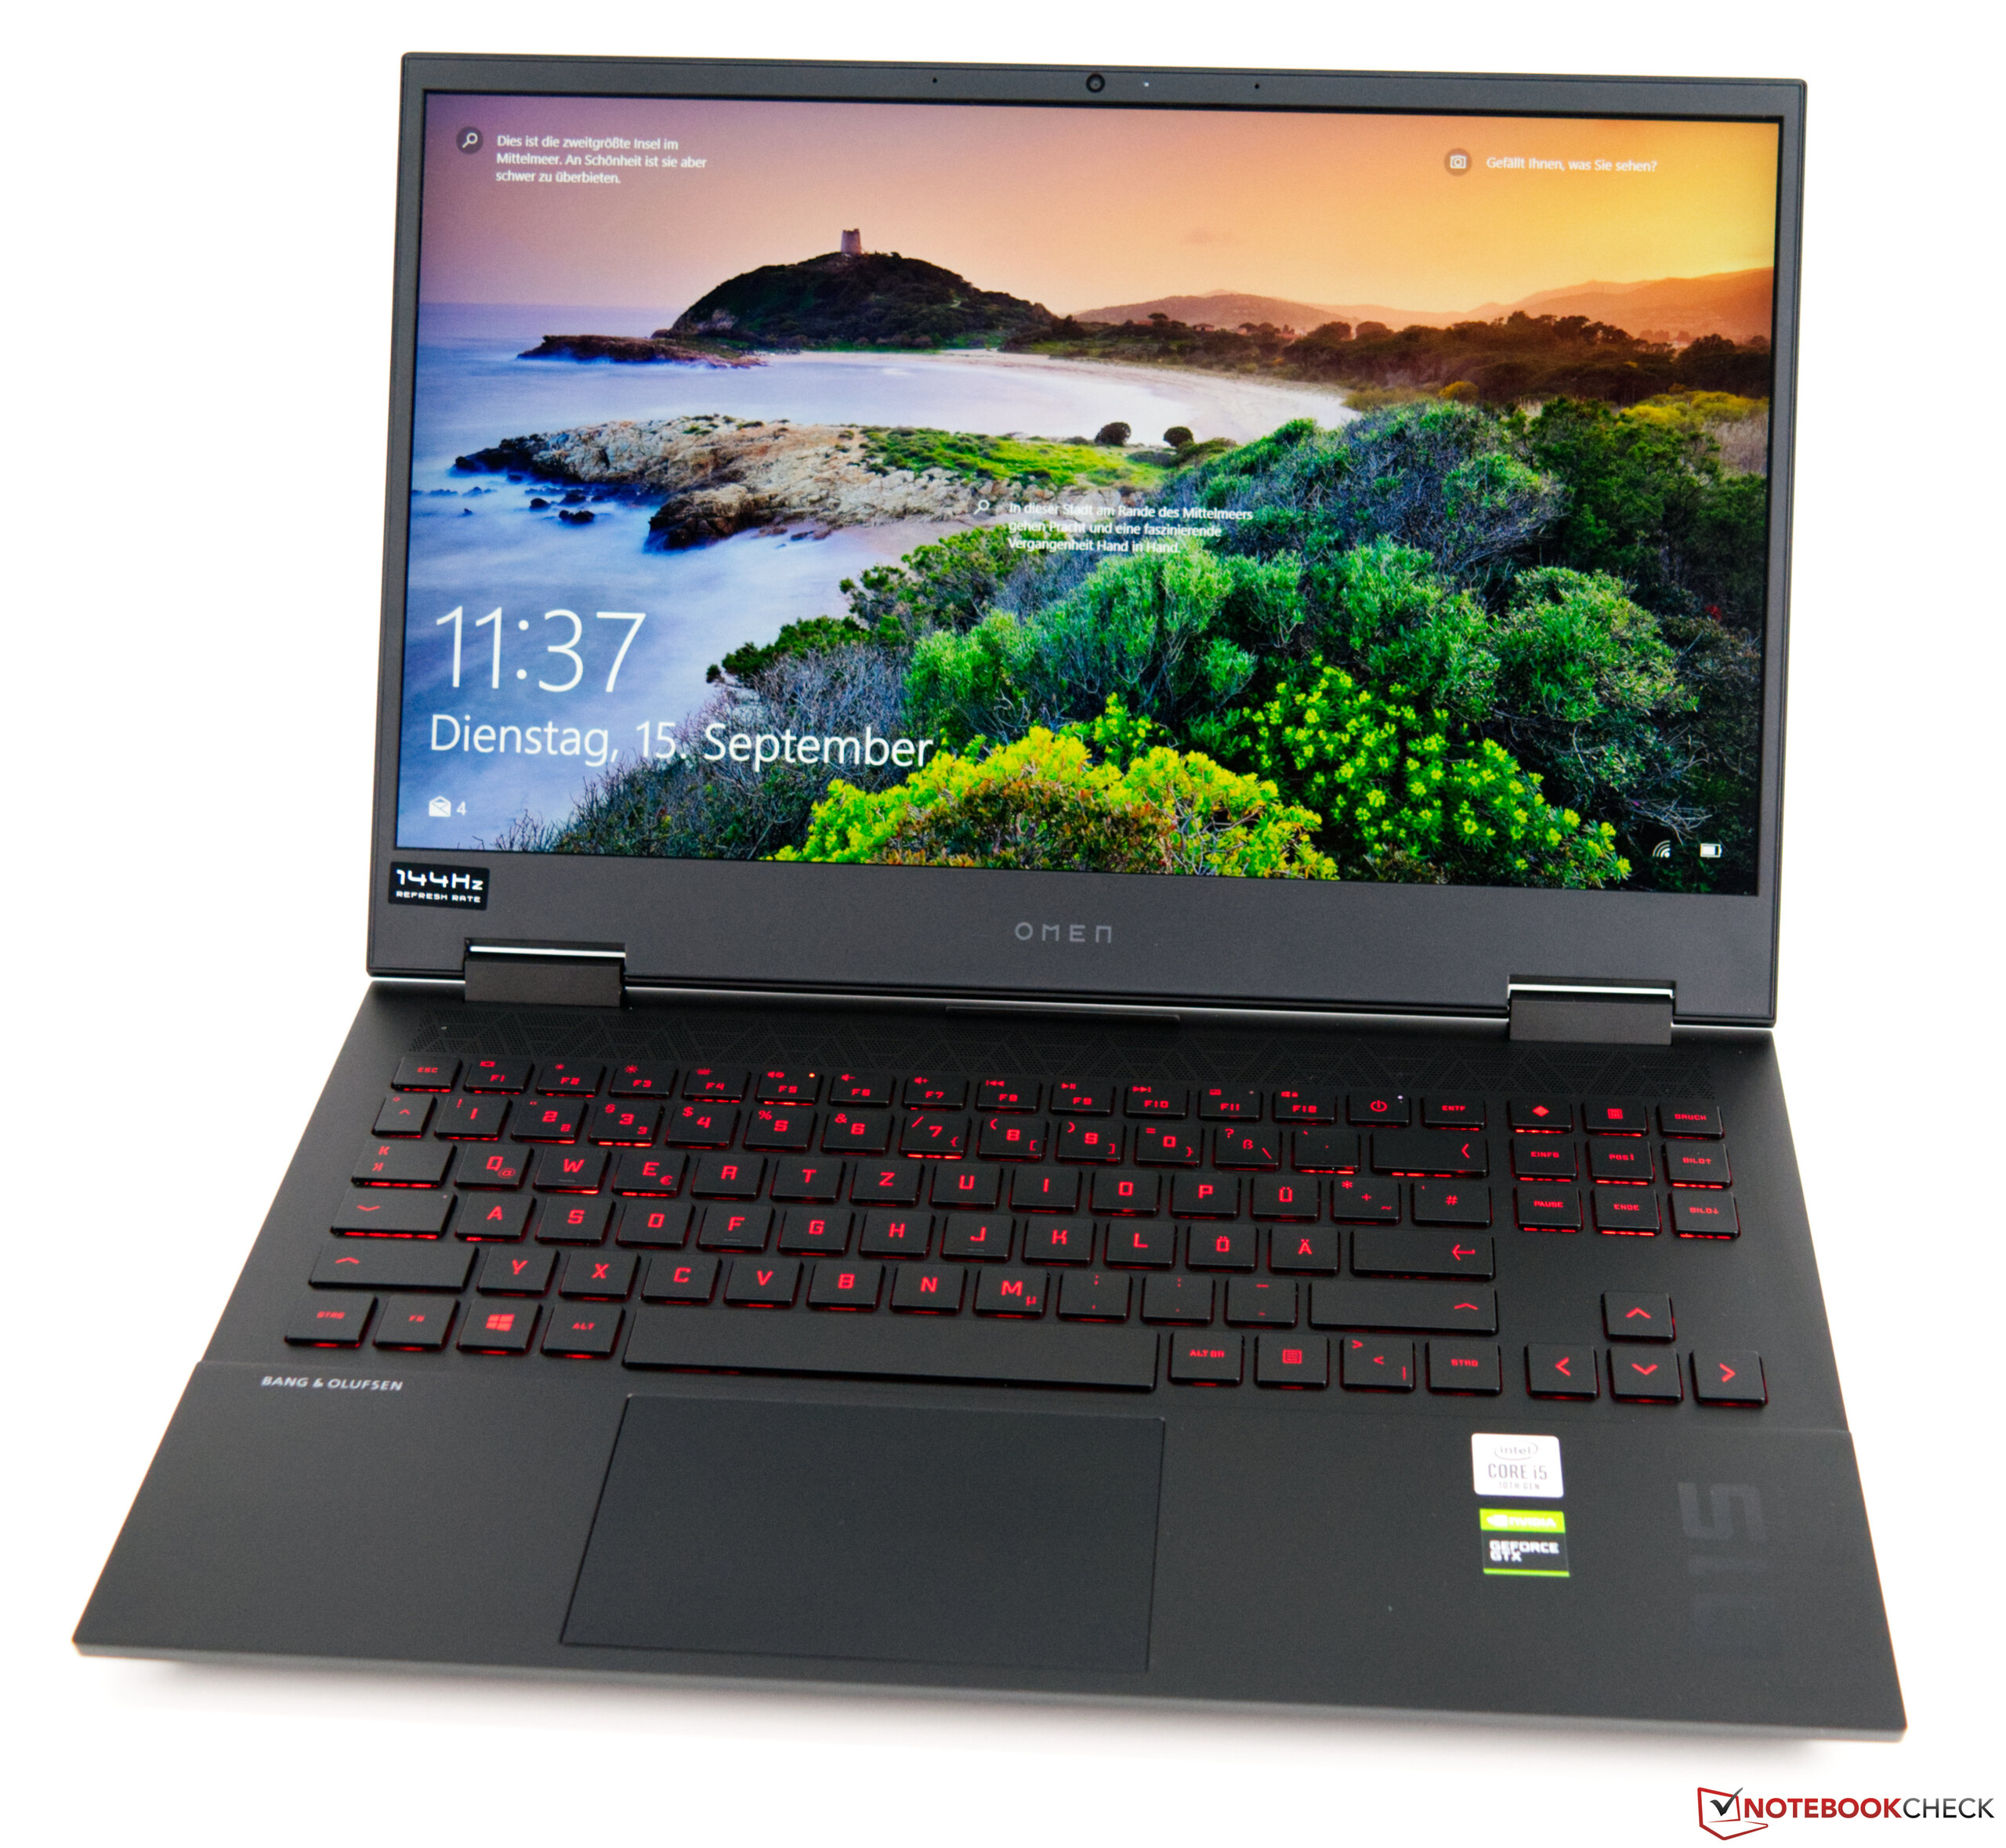
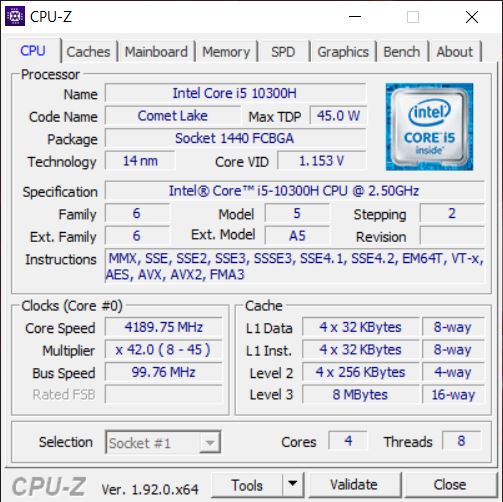
HP Omen 15: Portátil para jogos com boa duração de bateria
Avaliação | Data | Modelo | Peso | Altura | Size | Resolução | Preço |
|---|---|---|---|---|---|---|---|
| 82.1 % v7 (old) | 09/2020 | HP Omen 15-ek0456ng i5-10300H, GeForce GTX 1660 Ti Mobile | 2.1 kg | 32 mm | 15.60" | 1920x1080 | |
| 81.2 % v7 (old) | 09/2020 | Asus ROG Zephyrus G15 GA502IU-ES76 R7 4800HS, GeForce GTX 1660 Ti Max-Q | 2.1 kg | 19.9 mm | 15.60" | 1920x1080 | |
| 81.3 % v7 (old) | 02/2020 | Schenker XMG Core 15 GK5CP6V i7-9750H, GeForce GTX 1660 Ti Mobile | 2 kg | 26 mm | 15.60" | 1920x1080 | |
| 81.2 % v7 (old) | 08/2020 | Nexoc GH5 515IG i5-10300H, GeForce GTX 1650 Mobile | 2.1 kg | 24.9 mm | 15.60" | 1920x1080 | |
| 79.5 % v7 (old) | 07/2020 | MSI Bravo 15 A4DCR R7 4800H, Radeon RX 5300M | 2 kg | 22 mm | 15.60" | 1920x1080 | |
| 81.5 % v7 (old) | 07/2019 | HP Omen 15-dc1020ng i5-9300H, GeForce GTX 1650 Mobile | 2.3 kg | 25 mm | 15.60" | 1920x1080 |
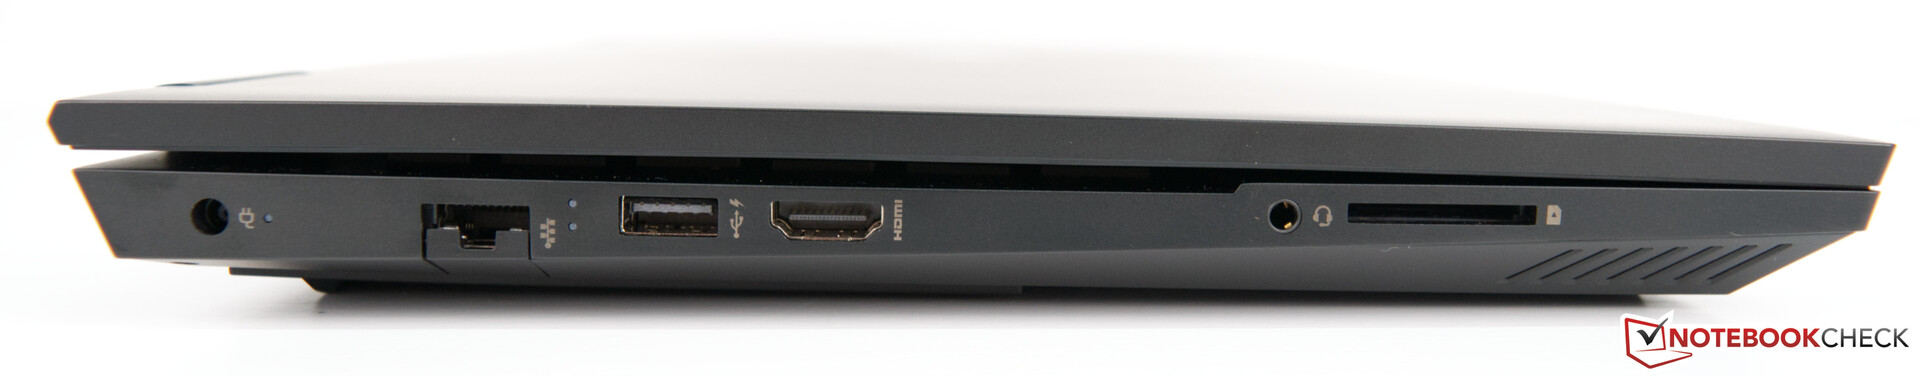
| SD Card Reader | |
| average JPG Copy Test (av. of 3 runs) | |
| Média da turma Gaming (20.9 - 210, n=55, últimos 2 anos) | |
| Nexoc GH5 515IG (Toshiba Exceria Pro SDXC 64 GB UHS-II) | |
| HP Omen 15-dc1020ng (Toshiba Exceria Pro SDXC 64 GB UHS-II) | |
| HP Omen 15-ek0456ng (Toshiba Exceria Pro SDXC 64 GB UHS-II) | |
| Schenker XMG Core 15 GK5CP6V (Toshiba Exceria Pro SDXC 64 GB UHS-II) | |
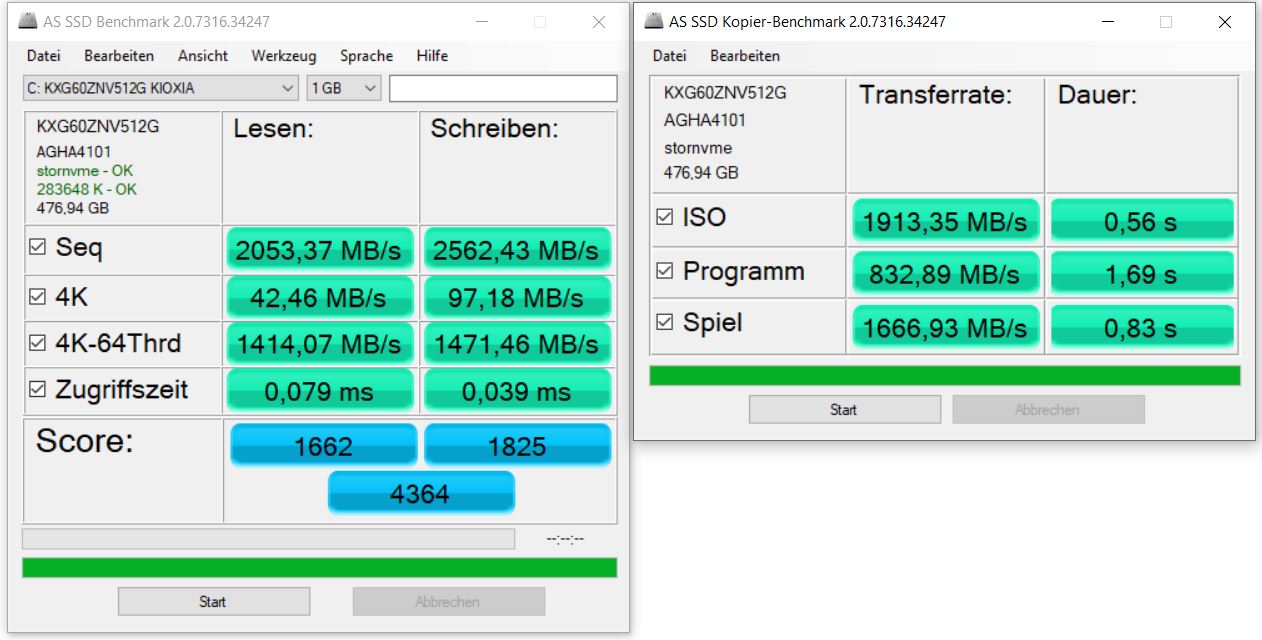
| maximum AS SSD Seq Read Test (1GB) | |
| Média da turma Gaming (25.5 - 261, n=52, últimos 2 anos) | |
| HP Omen 15-dc1020ng (Toshiba Exceria Pro SDXC 64 GB UHS-II) | |
| Nexoc GH5 515IG (Toshiba Exceria Pro SDXC 64 GB UHS-II) | |
| HP Omen 15-ek0456ng (Toshiba Exceria Pro SDXC 64 GB UHS-II) | |
| Schenker XMG Core 15 GK5CP6V (Toshiba Exceria Pro SDXC 64 GB UHS-II) | |


| |||||||||||||||||||||||||
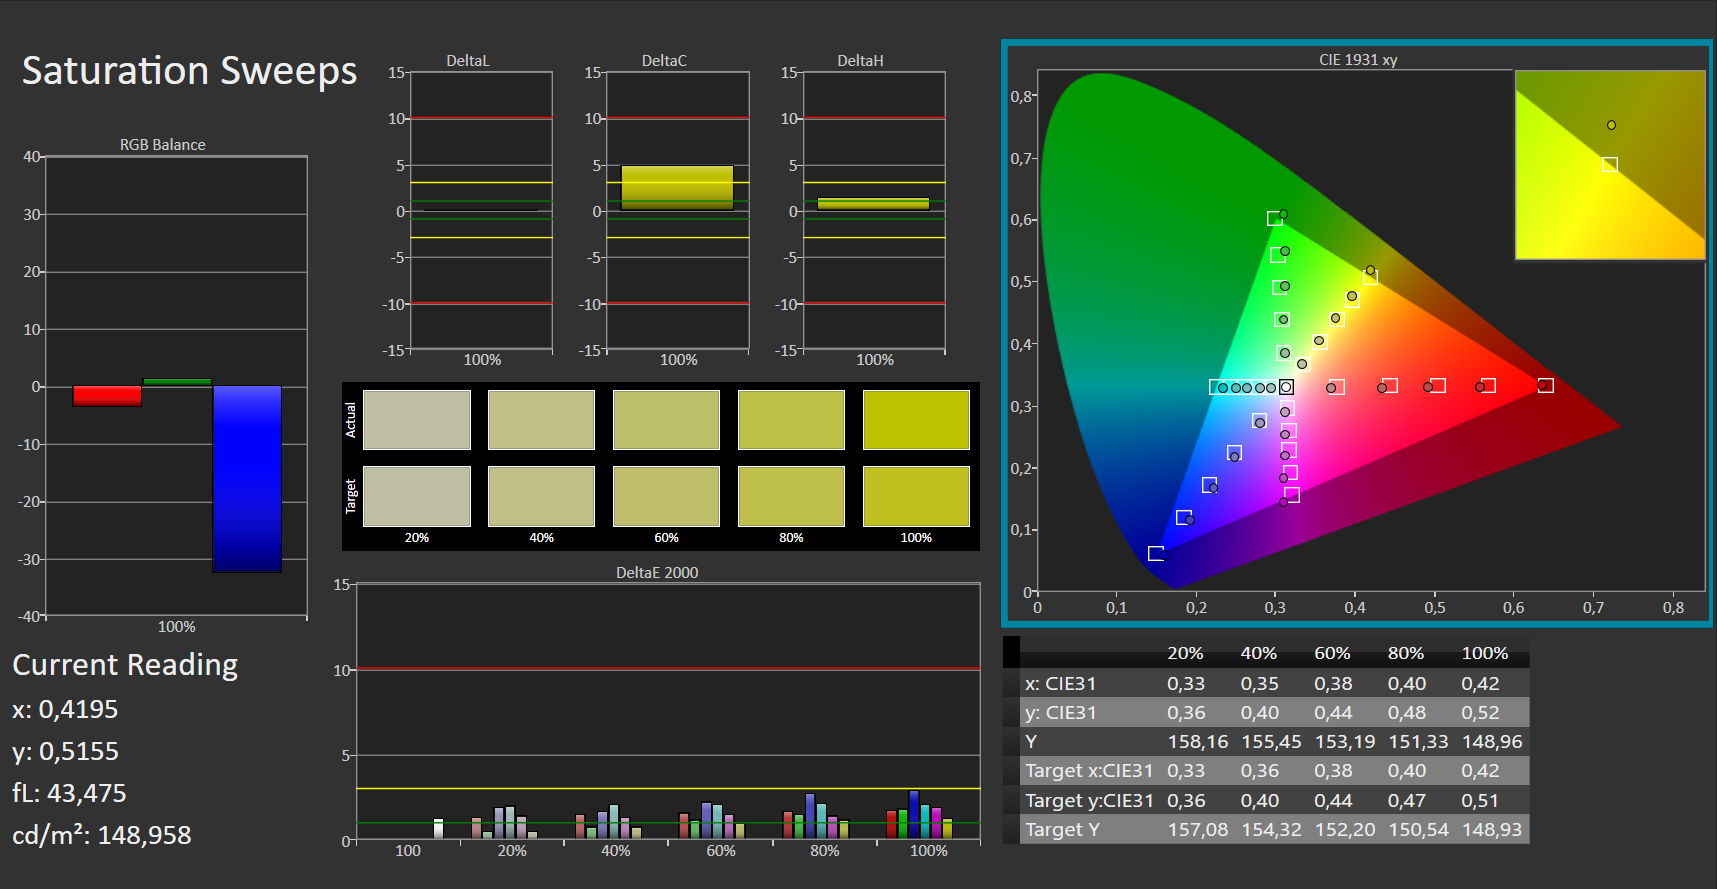
iluminação: 87 %
iluminação com acumulador: 269 cd/m²
Contraste: 1427:1 (Preto: 0.22 cd/m²)
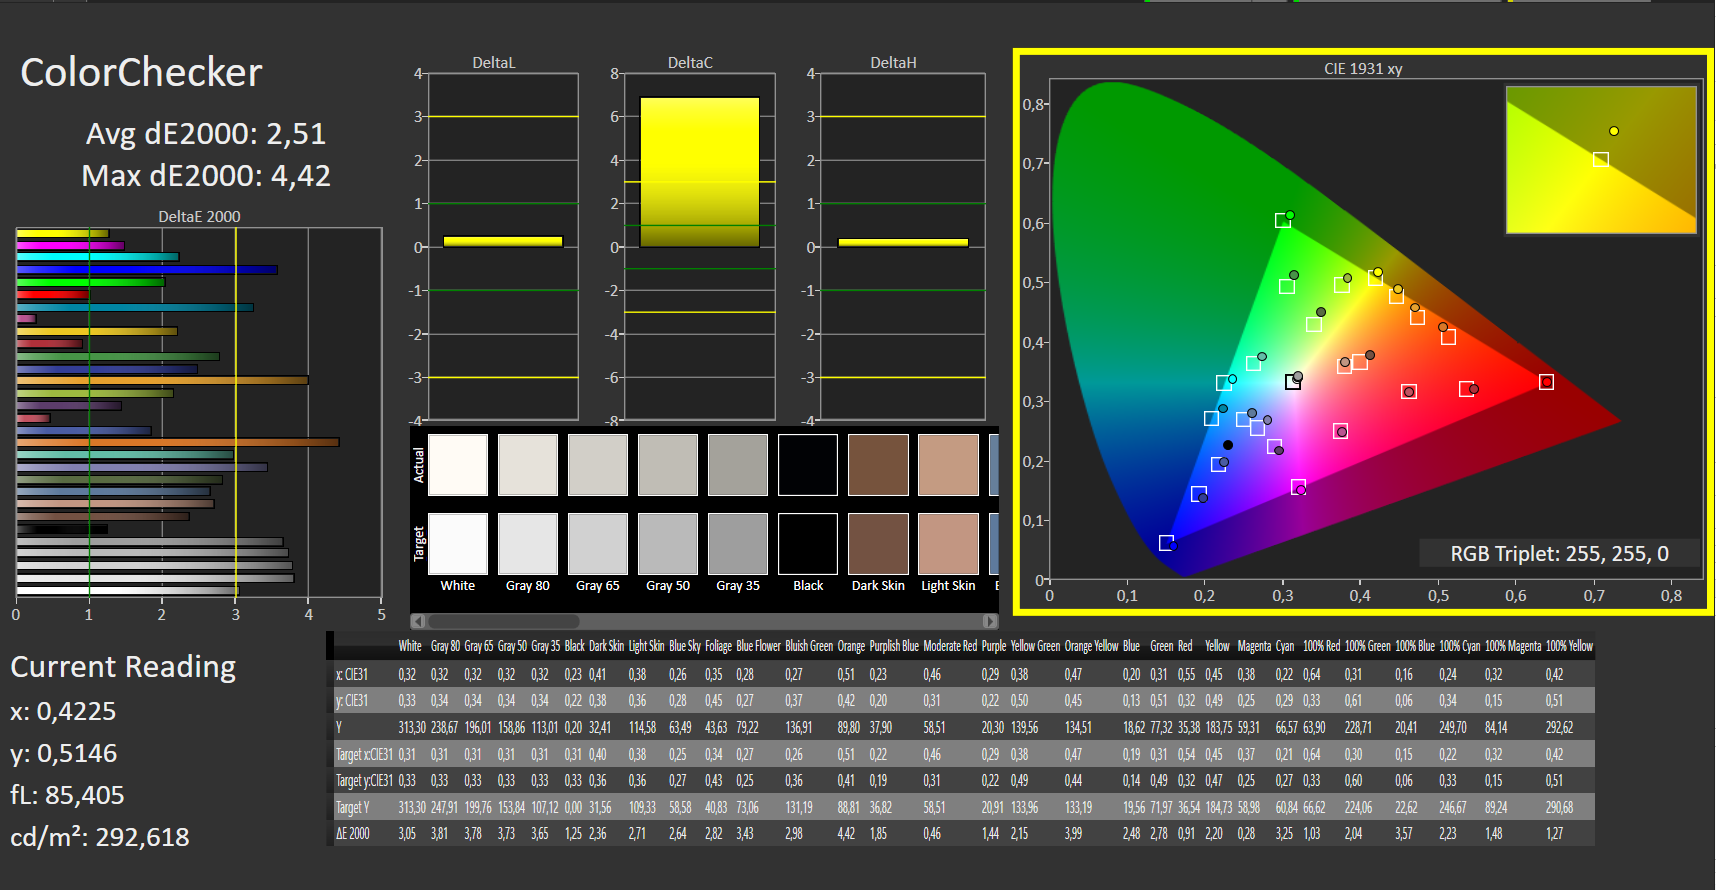
ΔE ColorChecker Calman: 2.51 | ∀{0.5-29.43 Ø4.73}
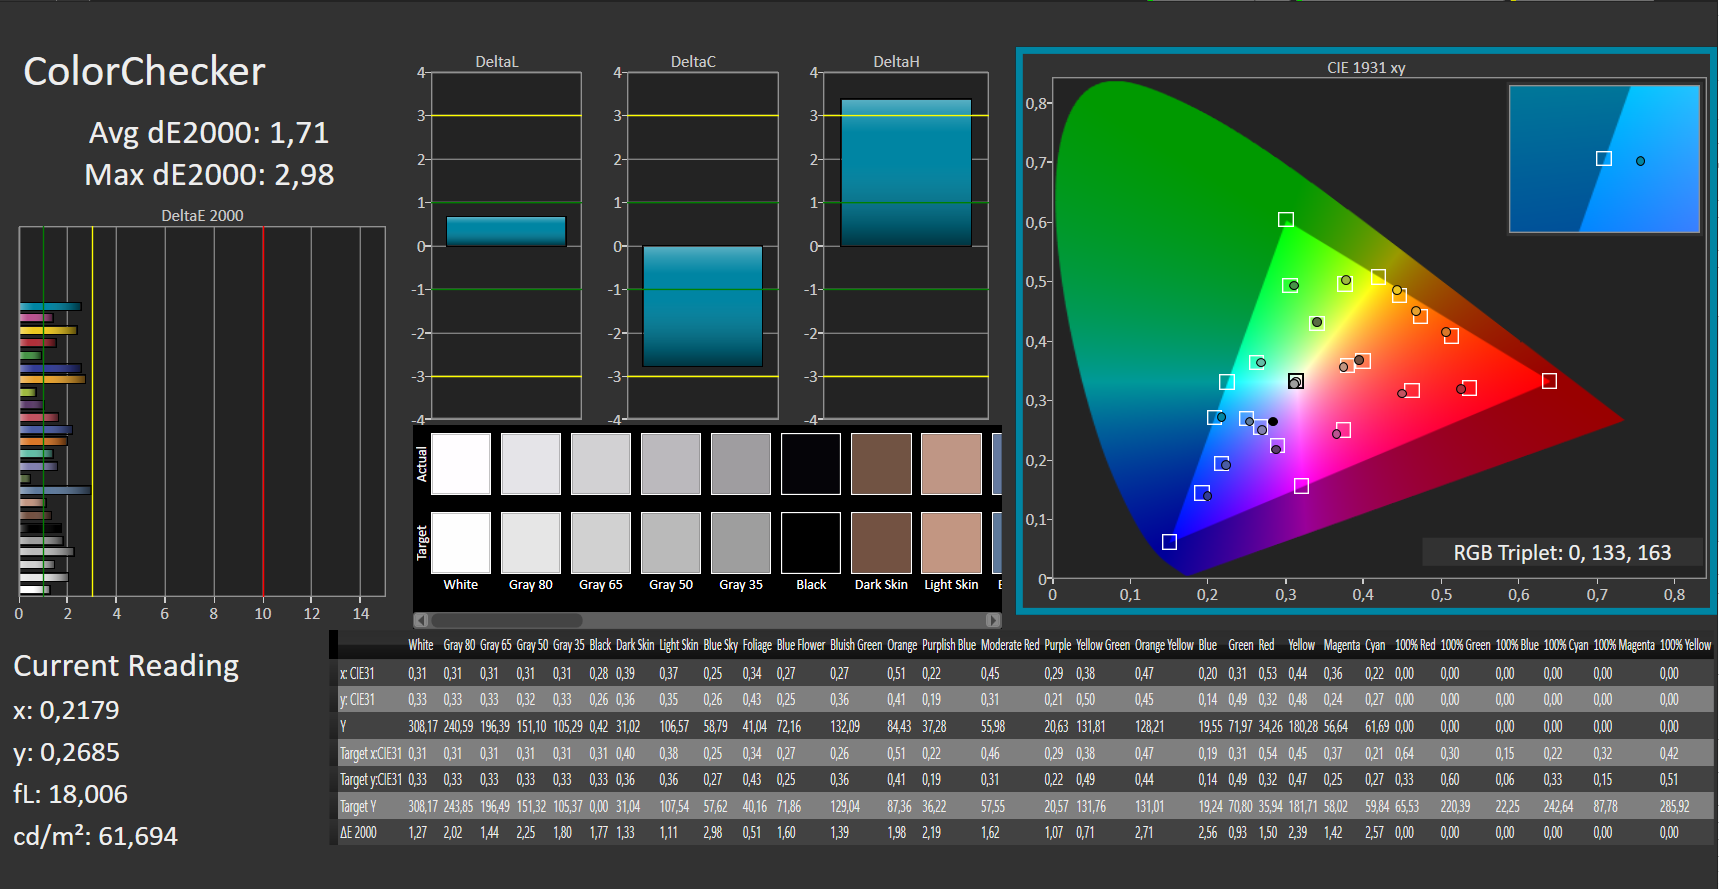
calibrated: 1.71
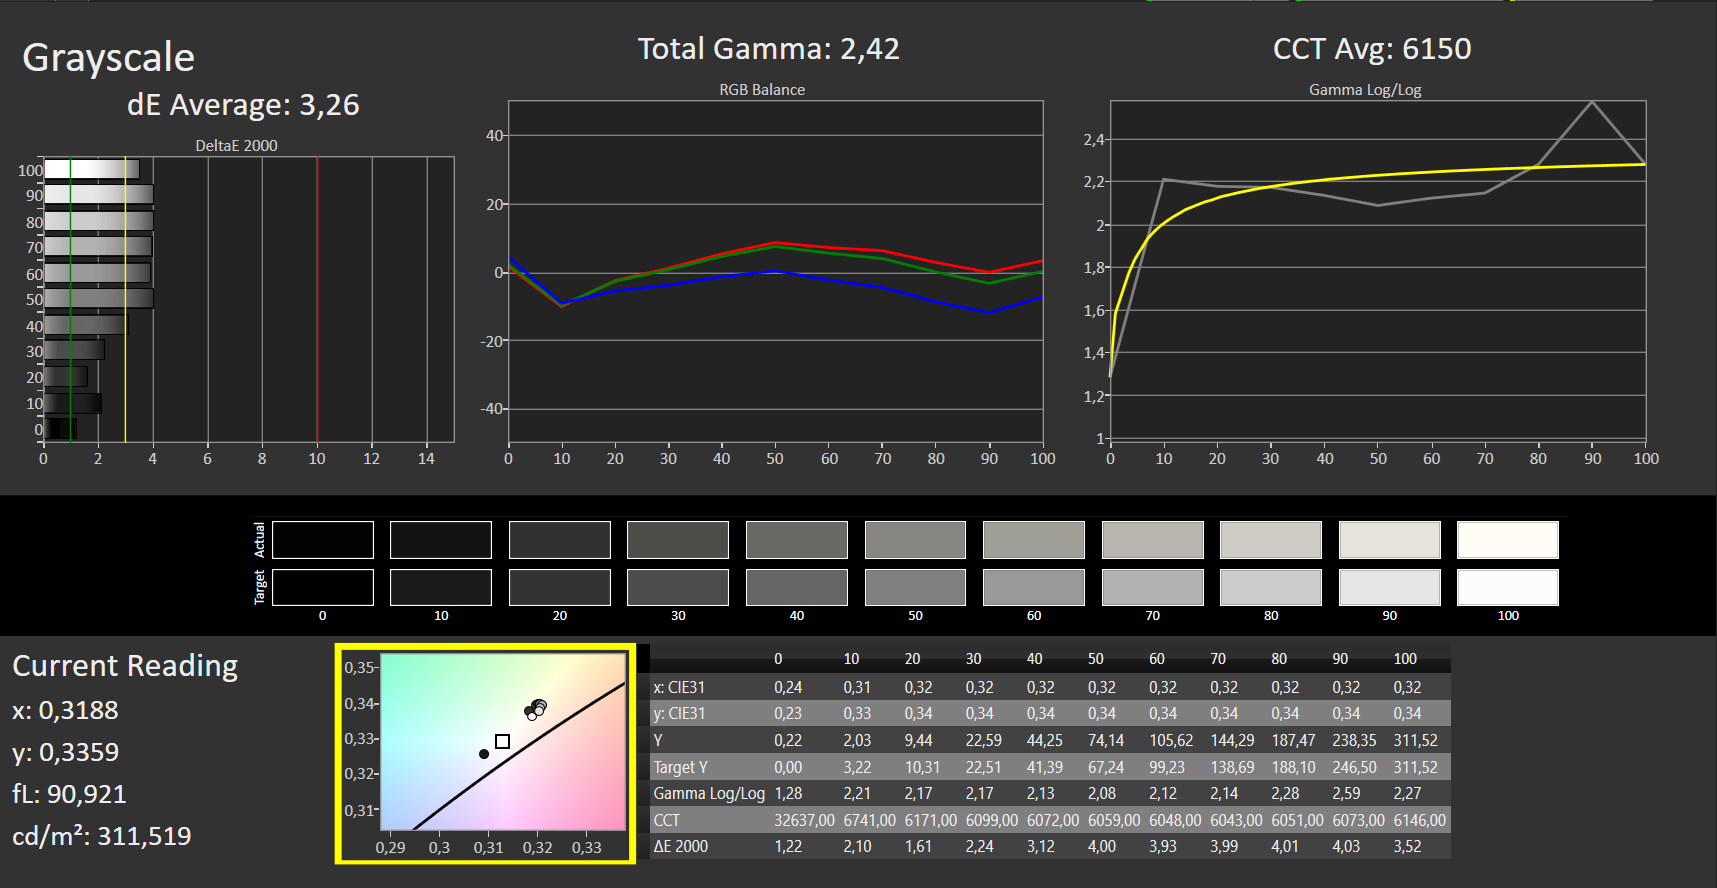
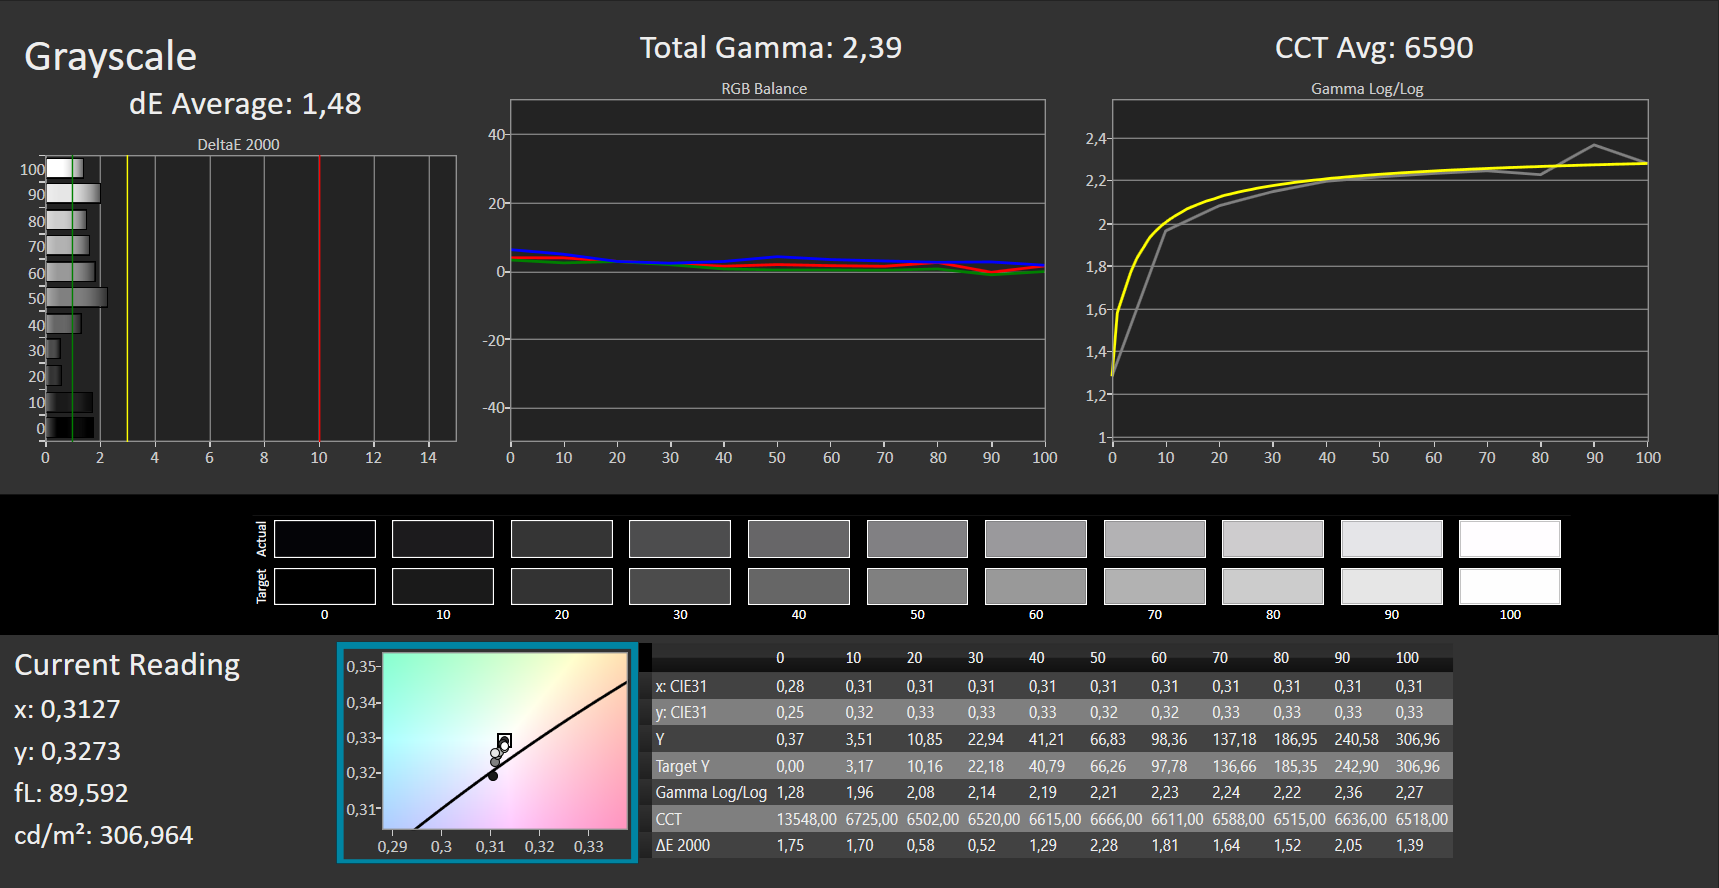
ΔE Greyscale Calman: 3.26 | ∀{0.09-98 Ø4.97}
Gamma: 2.42
CCT: 6150 K
| HP Omen 15-ek0456ng LGD05FE, IPS, 1920x1080, 15.6" | Asus ROG Zephyrus G15 GA502IU-ES76 Panda LM156LF-2F01, IPS, 1920x1080, 15.6" | Schenker XMG Core 15 GK5CP6V BOEhydis NV156FHM-N4G (BOE084D), IPS, 1920x1080, 15.6" | Nexoc GH5 515IG LG Philips LP156WFC-SPD1, IPS, 1920x1080, 15.6" | MSI Bravo 15 A4DCR AU Optronics B156HAN08.0 (AUO80ED), IPS-Level, 1920x1080, 15.6" | HP Omen 15-dc1020ng LGD05CE, IPS, 1920x1080, 15.6" | |
|---|---|---|---|---|---|---|
| Display | ||||||
| Display P3 Coverage (%) | 38.9 | 63.3 | 37.91 | 62 | 38.37 | |
| sRGB Coverage (%) | 58.5 | 91.2 | 57 | 86.8 | 57.6 | |
| AdobeRGB 1998 Coverage (%) | 40.22 | 65 | 39.19 | 62.7 | 39.69 | |
| Response Times | -89% | 27% | -117% | 6% | -152% | |
| Response Time Grey 50% / Grey 80% * (ms) | 17 ? | 24.4 ? -44% | 8.8 ? 48% | 34.8 ? -105% | 16 ? 6% | 40 ? -135% |
| Response Time Black / White * (ms) | 11 ? | 25.6 ? -133% | 10.4 ? 5% | 25.2 ? -129% | 10.4 ? 5% | 29.6 ? -169% |
| PWM Frequency (Hz) | ||||||
| Screen | -73% | -17% | -34% | -39% | -78% | |
| Brightness middle (cd/m²) | 314 | 255.9 -19% | 324 3% | 261 -17% | 311 -1% | 251 -20% |
| Brightness (cd/m²) | 293 | 246 -16% | 296 1% | 254 -13% | 313 7% | 232 -21% |
| Brightness Distribution (%) | 87 | 89 2% | 88 1% | 93 7% | 88 1% | 76 -13% |
| Black Level * (cd/m²) | 0.22 | 0.22 -0% | 0.27 -23% | 0.23 -5% | 0.43 -95% | 0.17 23% |
| Contrast (:1) | 1427 | 1163 -19% | 1200 -16% | 1135 -20% | 723 -49% | 1476 3% |
| Colorchecker dE 2000 * | 2.51 | 5.15 -105% | 4.07 -62% | 4.71 -88% | 4.5 -79% | 6.2 -147% |
| Colorchecker dE 2000 max. * | 4.42 | 17.11 -287% | 6.39 -45% | 7.6 -72% | 7.97 -80% | 18.6 -321% |
| Colorchecker dE 2000 calibrated * | 1.71 | 4.83 -182% | 1.49 13% | 3.67 -115% | 2.65 -55% | 4.8 -181% |
| Greyscale dE 2000 * | 3.26 | 4.2 -29% | 4.01 -23% | 2.76 15% | 3.3 -1% | 4.2 -29% |
| Gamma | 2.42 91% | 2.16 102% | 2.6 85% | 2.42 91% | 2.129 103% | 2.32 95% |
| CCT | 6150 106% | 7500 87% | 7350 88% | 7090 92% | 7227 90% | 7454 87% |
| Color Space (Percent of AdobeRGB 1998) (%) | 36.9 | 59 | 36 | 63 | 36.5 | |
| Color Space (Percent of sRGB) (%) | 58 | 91 | 56 | 86 | 57.4 | |
| Média Total (Programa/Configurações) | -81% /
-76% | 5% /
-9% | -76% /
-49% | -17% /
-31% | -115% /
-92% |
* ... menor é melhor
Exibir tempos de resposta
| ↔ Tempo de resposta preto para branco | ||
|---|---|---|
| 11 ms ... ascensão ↗ e queda ↘ combinadas | ↗ 7 ms ascensão | 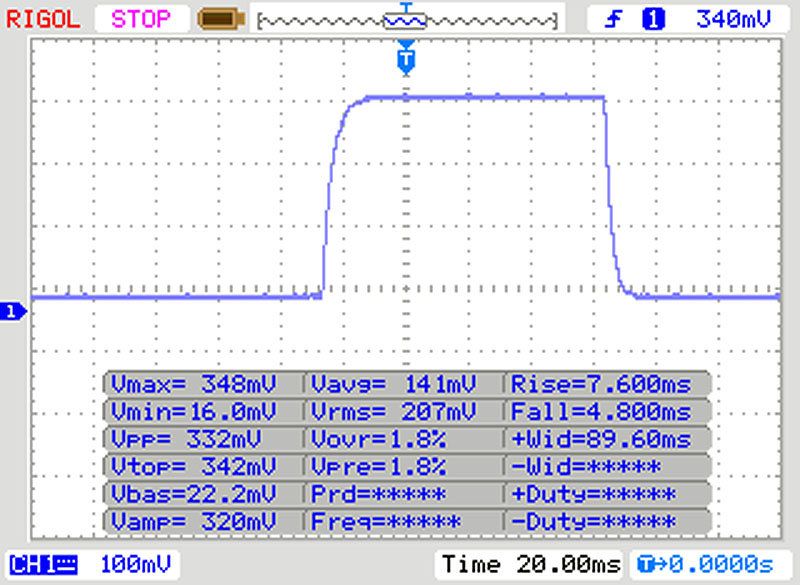 |
| ↘ 4 ms queda | ||
| A tela mostra boas taxas de resposta em nossos testes, mas pode ser muito lenta para jogadores competitivos. Em comparação, todos os dispositivos testados variam de 0.1 (mínimo) a 240 (máximo) ms. » 29 % de todos os dispositivos são melhores. Isso significa que o tempo de resposta medido é melhor que a média de todos os dispositivos testados (19.9 ms). | ||
| ↔ Tempo de resposta 50% cinza a 80% cinza | ||
| 17 ms ... ascensão ↗ e queda ↘ combinadas | ↗ 9 ms ascensão | 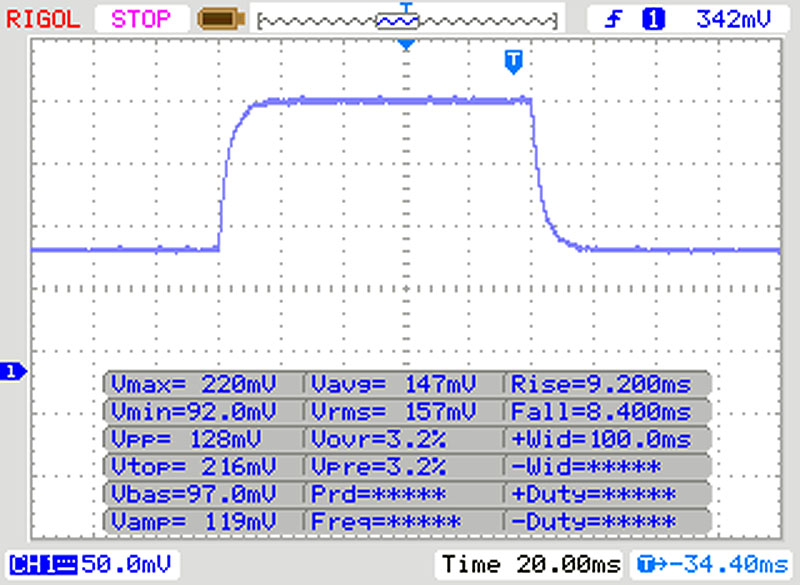 |
| ↘ 8 ms queda | ||
| A tela mostra boas taxas de resposta em nossos testes, mas pode ser muito lenta para jogadores competitivos. Em comparação, todos os dispositivos testados variam de 0.165 (mínimo) a 636 (máximo) ms. » 31 % de todos os dispositivos são melhores. Isso significa que o tempo de resposta medido é melhor que a média de todos os dispositivos testados (31.1 ms). | ||
Cintilação da tela / PWM (modulação por largura de pulso)
| Tela tremeluzindo / PWM não detectado | 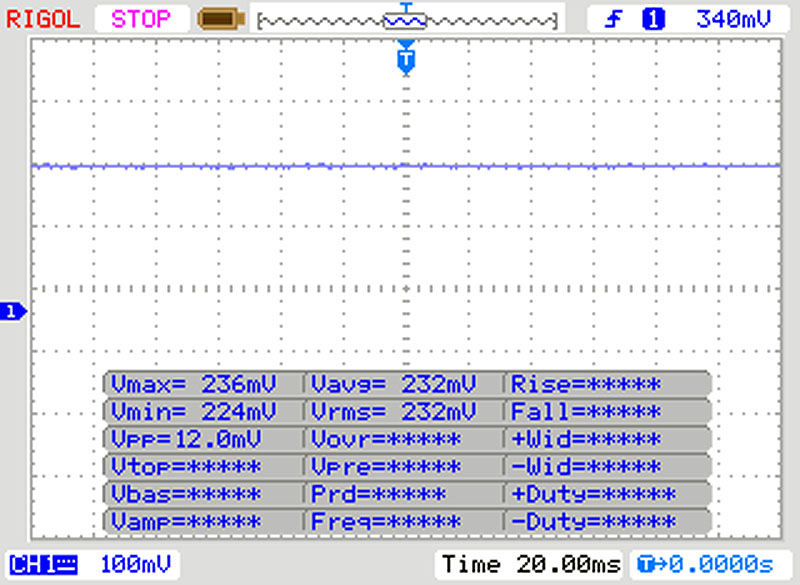 | ||
[pwm_comparison] Em comparação: 52 % de todos os dispositivos testados não usam PWM para escurecer a tela. Se PWM foi detectado, uma média de 7801 (mínimo: 5 - máximo: 343500) Hz foi medida. | |||

Cinebench R15: CPU Single 64Bit | CPU Multi 64Bit
Blender: v2.79 BMW27 CPU
7-Zip 18.03: 7z b 4 -mmt1 | 7z b 4
Geekbench 5.5: Single-Core | Multi-Core
HWBOT x265 Benchmark v2.2: 4k Preset
LibreOffice : 20 Documents To PDF
R Benchmark 2.5: Overall mean
| Cinebench R20 / CPU (Single Core) | |
| Média da turma Gaming (442 - 895, n=112, últimos 2 anos) | |
| Asus ROG Zephyrus G15 GA502IU-ES76 | |
| MSI Bravo 15 A4DCR | |
| Nexoc GH5 515IG | |
| HP Omen 15-ek0456ng | |
| Schenker XMG Core 15 GK5CP6V | |
| Média Intel Core i5-10300H (312 - 470, n=15) | |
| HP Omen 15-dc1020ng | |
| Cinebench R20 / CPU (Multi Core) | |
| Média da turma Gaming (4029 - 16108, n=112, últimos 2 anos) | |
| MSI Bravo 15 A4DCR | |
| Asus ROG Zephyrus G15 GA502IU-ES76 | |
| HP Omen 15-ek0456ng | |
| Schenker XMG Core 15 GK5CP6V | |
| Média Intel Core i5-10300H (1397 - 2240, n=15) | |
| Nexoc GH5 515IG | |
| HP Omen 15-dc1020ng | |
| Cinebench R15 / CPU Single 64Bit | |
| Média da turma Gaming (188.8 - 343, n=112, últimos 2 anos) | |
| Schenker XMG Core 15 GK5CP6V | |
| HP Omen 15-ek0456ng | |
| MSI Bravo 15 A4DCR | |
| Nexoc GH5 515IG | |
| Asus ROG Zephyrus G15 GA502IU-ES76 | |
| Média Intel Core i5-10300H (108 - 194, n=17) | |
| HP Omen 15-dc1020ng | |
| Cinebench R15 / CPU Multi 64Bit | |
| Média da turma Gaming (1578 - 6271, n=113, últimos 2 anos) | |
| MSI Bravo 15 A4DCR | |
| Asus ROG Zephyrus G15 GA502IU-ES76 | |
| Schenker XMG Core 15 GK5CP6V | |
| HP Omen 15-ek0456ng | |
| Nexoc GH5 515IG | |
| Média Intel Core i5-10300H (536 - 921, n=17) | |
| HP Omen 15-dc1020ng | |
| Blender / v2.79 BMW27 CPU | |
| HP Omen 15-dc1020ng | |
| Nexoc GH5 515IG | |
| Média Intel Core i5-10300H (479 - 555, n=14) | |
| HP Omen 15-ek0456ng | |
| Schenker XMG Core 15 GK5CP6V | |
| MSI Bravo 15 A4DCR | |
| Asus ROG Zephyrus G15 GA502IU-ES76 | |
| Média da turma Gaming (80 - 330, n=110, últimos 2 anos) | |
| 7-Zip 18.03 / 7z b 4 -mmt1 | |
| Média da turma Gaming (4199 - 7436, n=111, últimos 2 anos) | |
| HP Omen 15-ek0456ng | |
| Nexoc GH5 515IG | |
| Schenker XMG Core 15 GK5CP6V | |
| Média Intel Core i5-10300H (2945 - 4956, n=14) | |
| Asus ROG Zephyrus G15 GA502IU-ES76 | |
| HP Omen 15-dc1020ng | |
| MSI Bravo 15 A4DCR | |
| 7-Zip 18.03 / 7z b 4 | |
| Média da turma Gaming (33491 - 148086, n=111, últimos 2 anos) | |
| Asus ROG Zephyrus G15 GA502IU-ES76 | |
| MSI Bravo 15 A4DCR | |
| Schenker XMG Core 15 GK5CP6V | |
| HP Omen 15-ek0456ng | |
| Média Intel Core i5-10300H (15146 - 24841, n=14) | |
| Nexoc GH5 515IG | |
| HP Omen 15-dc1020ng | |
| Geekbench 5.5 / Single-Core | |
| Média da turma Gaming (986 - 2474, n=111, últimos 2 anos) | |
| HP Omen 15-ek0456ng | |
| HP Omen 15-ek0456ng | |
| Nexoc GH5 515IG | |
| Asus ROG Zephyrus G15 GA502IU-ES76 | |
| Média Intel Core i5-10300H (703 - 1241, n=16) | |
| Schenker XMG Core 15 GK5CP6V | |
| MSI Bravo 15 A4DCR | |
| Geekbench 5.5 / Multi-Core | |
| Média da turma Gaming (6460 - 27010, n=111, últimos 2 anos) | |
| Asus ROG Zephyrus G15 GA502IU-ES76 | |
| MSI Bravo 15 A4DCR | |
| Schenker XMG Core 15 GK5CP6V | |
| Nexoc GH5 515IG | |
| HP Omen 15-ek0456ng | |
| HP Omen 15-ek0456ng | |
| Média Intel Core i5-10300H (2783 - 4728, n=16) | |
| HWBOT x265 Benchmark v2.2 / 4k Preset | |
| Média da turma Gaming (11.5 - 44.3, n=111, últimos 2 anos) | |
| Asus ROG Zephyrus G15 GA502IU-ES76 | |
| MSI Bravo 15 A4DCR | |
| Schenker XMG Core 15 GK5CP6V | |
| HP Omen 15-ek0456ng | |
| Média Intel Core i5-10300H (6.13 - 7.78, n=14) | |
| Nexoc GH5 515IG | |
| HP Omen 15-dc1020ng | |
| LibreOffice / 20 Documents To PDF | |
| MSI Bravo 15 A4DCR | |
| Média Intel Core i5-10300H (23.9 - 94, n=14) | |
| Nexoc GH5 515IG | |
| Asus ROG Zephyrus G15 GA502IU-ES76 | |
| Média da turma Gaming (19 - 88.8, n=111, últimos 2 anos) | |
| HP Omen 15-ek0456ng | |
| R Benchmark 2.5 / Overall mean | |
| Média Intel Core i5-10300H (0.625 - 1.088, n=14) | |
| Schenker XMG Core 15 GK5CP6V | |
| HP Omen 15-ek0456ng | |
| Nexoc GH5 515IG | |
| MSI Bravo 15 A4DCR | |
| Asus ROG Zephyrus G15 GA502IU-ES76 | |
| Média da turma Gaming (0.3439 - 0.759, n=112, últimos 2 anos) | |
* ... menor é melhor
| PCMark 8 Home Score Accelerated v2 | 4853 pontos | |
| PCMark 8 Creative Score Accelerated v2 | 7696 pontos | |
| PCMark 8 Work Score Accelerated v2 | 5507 pontos | |
| PCMark 10 Score | 5127 pontos | |
Ajuda | ||
| DPC Latencies / LatencyMon - interrupt to process latency (max), Web, Youtube, Prime95 | |
| HP Omen 15-ek0456ng | |
* ... menor é melhor
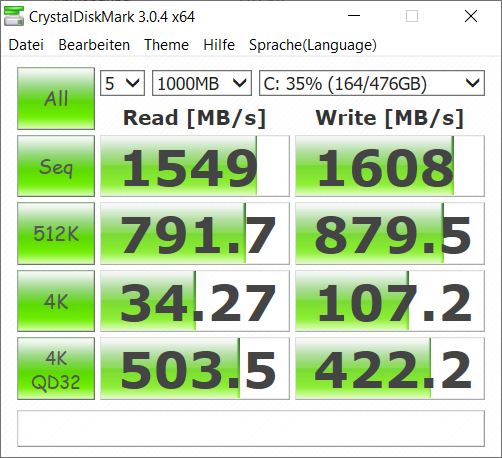
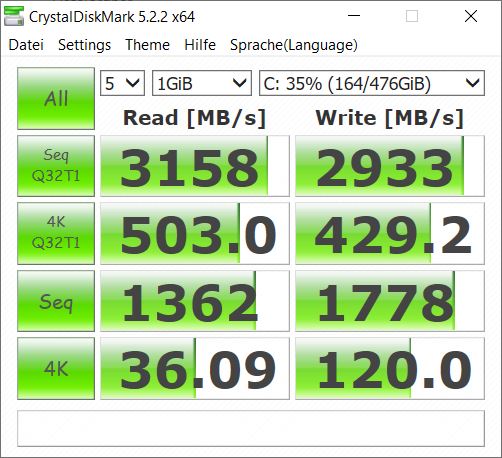
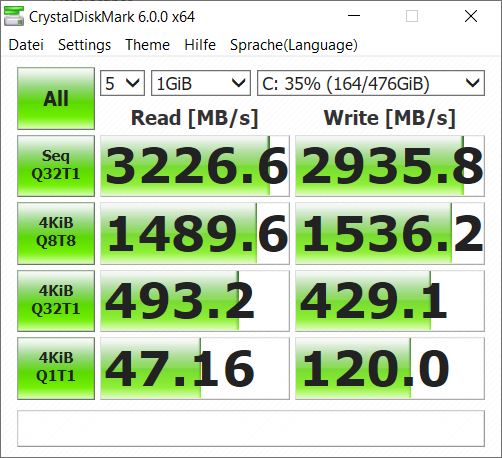
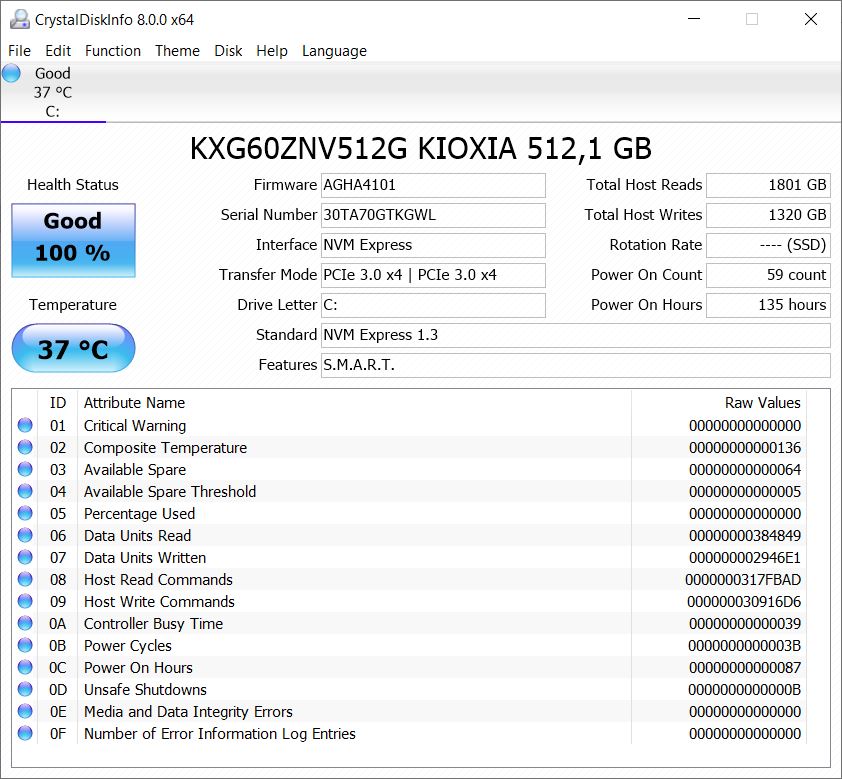
| HP Omen 15-ek0456ng Toshiba XG6 KXG60ZNV512G | Asus ROG Zephyrus G15 GA502IU-ES76 Intel SSD 660p 1TB SSDPEKNW010T8 | Schenker XMG Core 15 GK5CP6V Samsung SSD 970 EVO Plus 500GB | Nexoc GH5 515IG Samsung SSD 860 Evo 512GB | MSI Bravo 15 A4DCR Samsung PM981a MZVLB1T0HBLR | HP Omen 15-dc1020ng WDC PC SN720 SDAQNTW-512G | Média Toshiba XG6 KXG60ZNV512G | |
|---|---|---|---|---|---|---|---|
| CrystalDiskMark 5.2 / 6 | 10% | -3% | -46% | 21% | 3% | -10% | |
| Write 4K (MB/s) | 120 | 189.6 58% | 102 -15% | 89.6 -25% | 118.3 -1% | 112.1 -7% | 112.8 ? -6% |
| Read 4K (MB/s) | 36.09 | 61.7 71% | 41.39 15% | 40.88 13% | 43.73 21% | 42.01 16% | 42.7 ? 18% |
| Write Seq (MB/s) | 1778 | 1730 -3% | 1649 -7% | 518 -71% | 2854 61% | 1964 10% | 1489 ? -16% |
| Read Seq (MB/s) | 1362 | 1620 19% | 1367 0% | 539 -60% | 2302 69% | 2065 52% | 1771 ? 30% |
| Write 4K Q32T1 (MB/s) | 429.1 | 474.2 11% | 379 -12% | 304 -29% | 418.5 -2% | 318.2 -26% | 345 ? -20% |
| Read 4K Q32T1 (MB/s) | 493.2 | 528 7% | 401.2 -19% | 329 -33% | 517 5% | 406.7 -18% | 359 ? -27% |
| Write Seq Q32T1 (MB/s) | 2936 | 1795 -39% | 3276 12% | 529 -82% | 3008 2% | 2534 -14% | 2257 ? -23% |
| Read Seq Q32T1 (MB/s) | 3227 | 1880 -42% | 3417 6% | 561 -83% | 3568 11% | 3438 7% | 2926 ? -9% |
| Write 4K Q8T8 (MB/s) | 1536 | 1080 ? -30% | |||||
| Read 4K Q8T8 (MB/s) | 1490 | 1232 ? -17% | |||||
| AS SSD | -37% | 19% | -54% | 30% | -4% | -16% | |
| Seq Read (MB/s) | 2053 | 1197 -42% | 2261 10% | 524 -74% | 2730 33% | 2955 44% | 2456 ? 20% |
| Seq Write (MB/s) | 2562 | 1637 -36% | 2393 -7% | 495 -81% | 2513 -2% | 2440 -5% | 1493 ? -42% |
| 4K Read (MB/s) | 42.46 | 56.3 33% | 54.6 29% | 38.93 -8% | 61.4 45% | 40.56 -4% | 44.1 ? 4% |
| 4K Write (MB/s) | 97.2 | 159 64% | 118.4 22% | 87.3 -10% | 156.1 61% | 118.6 22% | 119.3 ? 23% |
| 4K-64 Read (MB/s) | 1414 | 583 -59% | 1376 -3% | 380 -73% | 1780 26% | 1283 -9% | 980 ? -31% |
| 4K-64 Write (MB/s) | 1471 | 838 -43% | 2299 56% | 335.7 -77% | 1920 31% | 1538 5% | 1180 ? -20% |
| Access Time Read * (ms) | 0.079 | 0.062 22% | 0.07 11% | 0.073 8% | 0.063 20% | 0.084 -6% | 0.08057 ? -2% |
| Access Time Write * (ms) | 0.039 | 0.128 -228% | 0.031 21% | 0.039 -0% | 0.025 36% | 0.032 18% | 0.055 ? -41% |
| Score Read (Points) | 1662 | 759 -54% | 1657 0% | 471 -72% | 2114 27% | 1619 -3% | 1269 ? -24% |
| Score Write (Points) | 1825 | 1160 -36% | 2657 46% | 472 -74% | 2327 28% | 1901 4% | 1449 ? -21% |
| Score Total (Points) | 4364 | 2350 -46% | 5175 19% | 1198 -73% | 5518 26% | 4323 -1% | 3326 ? -24% |
| Copy ISO MB/s (MB/s) | 1913 | 1376 -28% | 500 -74% | 1418 -26% | 1894 ? -1% | ||
| Copy Program MB/s (MB/s) | 833 | 568 -32% | 283.8 -66% | 392.5 -53% | 552 ? -34% | ||
| Copy Game MB/s (MB/s) | 1667 | 1180 -29% | 319.6 -81% | 907 -46% | 1187 ? -29% | ||
| Média Total (Programa/Configurações) | -14% /
-20% | 8% /
10% | -50% /
-51% | 26% /
26% | -1% /
-2% | -13% /
-13% |
* ... menor é melhor

Continuous load read: DiskSpd Read Loop, Queue Depth 8
| 3DMark 11 Performance | 16523 pontos | |
| 3DMark Ice Storm Standard Score | 119496 pontos | |
| 3DMark Cloud Gate Standard Score | 31686 pontos | |
| 3DMark Fire Strike Score | 12767 pontos | |
| 3DMark Fire Strike Extreme Score | 6478 pontos | |
| 3DMark Time Spy Score | 4946 pontos | |
Ajuda | ||
| baixo | média | alto | ultra | |
|---|---|---|---|---|
| BioShock Infinite (2013) | 309.5 | 277.4 | 258.1 | 137 |
| GTA V (2015) | 164 | 133 | 71.8 | |
| The Witcher 3 (2015) | 256 | 179 | 104 | 54.2 |
| Dota 2 Reborn (2015) | 143.5 | 126.8 | 119 | 113.6 |
| Rise of the Tomb Raider (2016) | 232 | 166 | 97.8 | 87.4 |
| Final Fantasy XV Benchmark (2018) | 133 | 81.4 | 59.9 | |
| X-Plane 11.11 (2018) | 85.7 | 77.8 | 67.1 | |
| Far Cry 5 (2018) | 124 | 97 | 90 | 85 |
| Strange Brigade (2018) | 292 | 144 | 114 | 97.4 |
| Far Cry New Dawn (2019) | 106 | 88 | 85 | 76 |
| Metro Exodus (2019) | 129 | 72.5 | 54.9 | 43.1 |
Barulho
| Ocioso |
| 32.4 / 32.4 / 32.4 dB |
| Carga |
| 32.5 / 51.9 dB |
 | ||
30 dB silencioso 40 dB(A) audível 50 dB(A) ruidosamente alto |
||
min: | ||
(±) A temperatura máxima no lado superior é 40.2 °C / 104 F, em comparação com a média de 40.4 °C / 105 F , variando de 21.2 a 68.8 °C para a classe Gaming.
(-) A parte inferior aquece até um máximo de 48.4 °C / 119 F, em comparação com a média de 43.2 °C / 110 F
(+) Em uso inativo, a temperatura média para o lado superior é 24.8 °C / 77 F, em comparação com a média do dispositivo de 33.9 °C / ### class_avg_f### F.
(±) Jogando The Witcher 3, a temperatura média para o lado superior é 32 °C / 90 F, em comparação com a média do dispositivo de 33.9 °C / ## #class_avg_f### F.
(+) Os apoios para as mãos e o touchpad são mais frios que a temperatura da pele, com um máximo de 29.9 °C / 85.8 F e, portanto, são frios ao toque.
(±) A temperatura média da área do apoio para as mãos de dispositivos semelhantes foi 28.8 °C / 83.8 F (-1.1 °C / -2 F).
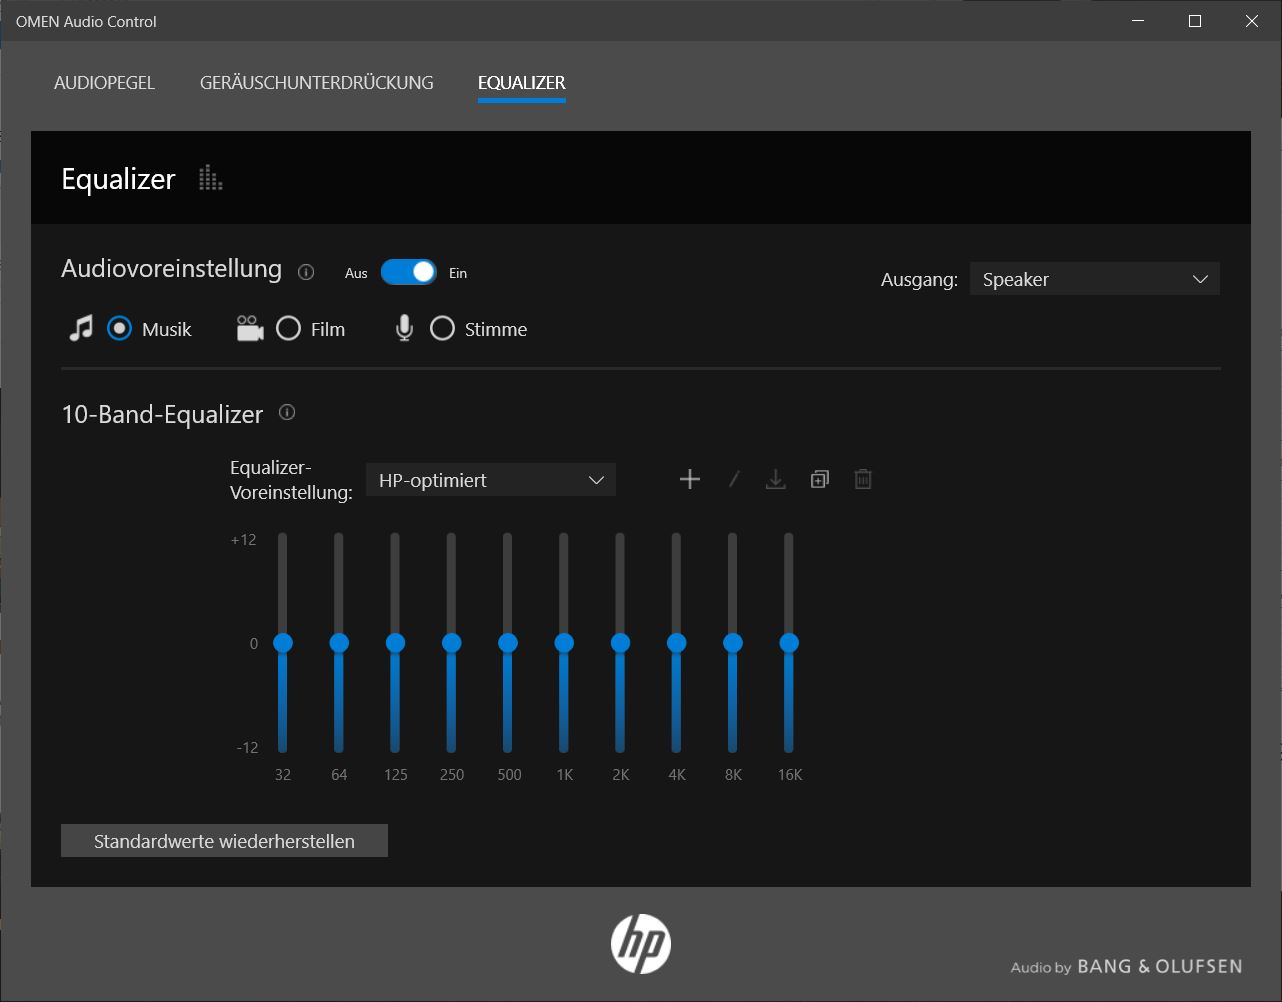
HP Omen 15-ek0456ng análise de áudio
(-) | alto-falantes não muito altos (###valor### dB)
Graves 100 - 315Hz
(-) | quase nenhum baixo - em média 17.3% menor que a mediana
(±) | a linearidade dos graves é média (13% delta para a frequência anterior)
Médios 400 - 2.000 Hz
(+) | médios equilibrados - apenas 3.4% longe da mediana
(±) | a linearidade dos médios é média (9.7% delta para frequência anterior)
Altos 2 - 16 kHz
(+) | agudos equilibrados - apenas 3.2% longe da mediana
(+) | os máximos são lineares (5.4% delta da frequência anterior)
Geral 100 - 16.000 Hz
(±) | a linearidade do som geral é média (22% diferença em relação à mediana)
Comparado com a mesma classe
» 79% de todos os dispositivos testados nesta classe foram melhores, 6% semelhantes, 15% piores
» O melhor teve um delta de 6%, a média foi 18%, o pior foi 132%
Comparado com todos os dispositivos testados
» 63% de todos os dispositivos testados foram melhores, 6% semelhantes, 30% piores
» O melhor teve um delta de 4%, a média foi 24%, o pior foi 134%
Asus ROG Zephyrus G15 GA502IU-ES76 análise de áudio
(±) | o volume do alto-falante é médio, mas bom (###valor### dB)
Graves 100 - 315Hz
(±) | graves reduzidos - em média 5.9% menor que a mediana
(±) | a linearidade dos graves é média (11.4% delta para a frequência anterior)
Médios 400 - 2.000 Hz
(+) | médios equilibrados - apenas 2.2% longe da mediana
(+) | médios são lineares (4% delta para frequência anterior)
Altos 2 - 16 kHz
(±) | máximos mais altos - em média 6.5% maior que a mediana
(+) | os máximos são lineares (6.5% delta da frequência anterior)
Geral 100 - 16.000 Hz
(+) | o som geral é linear (13.1% diferença em relação à mediana)
Comparado com a mesma classe
» 18% de todos os dispositivos testados nesta classe foram melhores, 4% semelhantes, 78% piores
» O melhor teve um delta de 6%, a média foi 18%, o pior foi 132%
Comparado com todos os dispositivos testados
» 13% de todos os dispositivos testados foram melhores, 3% semelhantes, 84% piores
» O melhor teve um delta de 4%, a média foi 24%, o pior foi 134%
| desligado | |
| Ocioso | |
| Carga |
|
Key:
min: | |
| HP Omen 15-ek0456ng i5-10300H, GeForce GTX 1660 Ti Mobile, Toshiba XG6 KXG60ZNV512G, IPS, 1920x1080, 15.6" | Asus ROG Zephyrus G15 GA502IU-ES76 R7 4800HS, GeForce GTX 1660 Ti Max-Q, Intel SSD 660p 1TB SSDPEKNW010T8, IPS, 1920x1080, 15.6" | Schenker XMG Core 15 GK5CP6V i7-9750H, GeForce GTX 1660 Ti Mobile, Samsung SSD 970 EVO Plus 500GB, IPS, 1920x1080, 15.6" | Nexoc GH5 515IG i5-10300H, GeForce GTX 1650 Mobile, Samsung SSD 860 Evo 512GB, IPS, 1920x1080, 15.6" | MSI Bravo 15 A4DCR R7 4800H, Radeon RX 5300M, Samsung PM981a MZVLB1T0HBLR, IPS-Level, 1920x1080, 15.6" | HP Omen 15-dc1020ng i5-9300H, GeForce GTX 1650 Mobile, WDC PC SN720 SDAQNTW-512G, IPS, 1920x1080, 15.6" | Média NVIDIA GeForce GTX 1660 Ti Mobile | Média da turma Gaming | |
|---|---|---|---|---|---|---|---|---|
| Power Consumption | 38% | 7% | 33% | 1% | 35% | -22% | -34% | |
| Idle Minimum * (Watt) | 9.2 | 5.1 45% | 9 2% | 3 67% | 11 -20% | 4.04 56% | 12.4 ? -35% | 13.3 ? -45% |
| Idle Average * (Watt) | 14.6 | 8.4 42% | 12 18% | 7 52% | 14 4% | 7.2 51% | 18 ? -23% | 19 ? -30% |
| Idle Maximum * (Watt) | 18.1 | 9.1 50% | 18 1% | 16 12% | 25 -38% | 11.4 37% | 25.3 ? -40% | 24.5 ? -35% |
| Load Average * (Watt) | 84 | 55.1 34% | 86 -2% | 85 -1% | 72 14% | 80.8 4% | 93.5 ? -11% | 108.1 ? -29% |
| Witcher 3 ultra * (Watt) | 142 | 97.5 31% | 126 11% | 86 39% | 100 30% | 93.6 34% | ||
| Load Maximum * (Watt) | 194 | 140.2 28% | 173 11% | 134 31% | 163 16% | 144.5 26% | 191.9 ? 1% | 254 ? -31% |
* ... menor é melhor
| HP Omen 15-ek0456ng i5-10300H, GeForce GTX 1660 Ti Mobile, 70.91 Wh | Asus ROG Zephyrus G15 GA502IU-ES76 R7 4800HS, GeForce GTX 1660 Ti Max-Q, 76 Wh | Schenker XMG Core 15 GK5CP6V i7-9750H, GeForce GTX 1660 Ti Mobile, 46 Wh | Nexoc GH5 515IG i5-10300H, GeForce GTX 1650 Mobile, 48.96 Wh | MSI Bravo 15 A4DCR R7 4800H, Radeon RX 5300M, 51 Wh | HP Omen 15-dc1020ng i5-9300H, GeForce GTX 1650 Mobile, 52.5 Wh | Média da turma Gaming | |
|---|---|---|---|---|---|---|---|
| Duração da bateria | -15% | -51% | -1% | -39% | 8% | -1% | |
| Reader / Idle (h) | 11.7 | 7.1 -39% | 6.1 -48% | 14.9 27% | 7 -40% | 15.9 36% | 8.71 ? -26% |
| H.264 (h) | 6.4 | 6.5 2% | 8 25% | 8.26 ? 29% | |||
| WiFi v1.3 (h) | 6.5 | 5.3 -18% | 3.6 -45% | 6.4 -2% | 4.5 -31% | 6.4 -2% | 7.01 ? 8% |
| Load (h) | 1.7 | 1.9 12% | 0.7 -59% | 1.2 -29% | 0.9 -47% | 1.2 -29% | 1.47 ? -14% |
| Witcher 3 ultra (h) | 1 |


Pro
Contra
Veredicto - Ligeiras deduções nos pontos de estilo
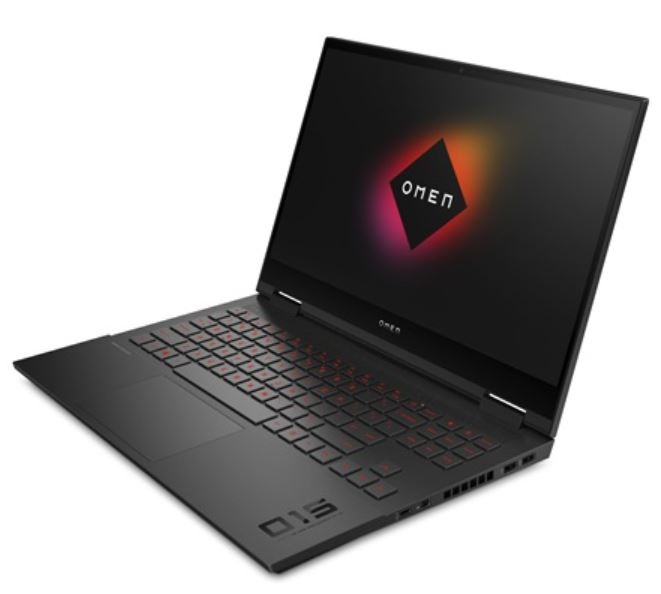
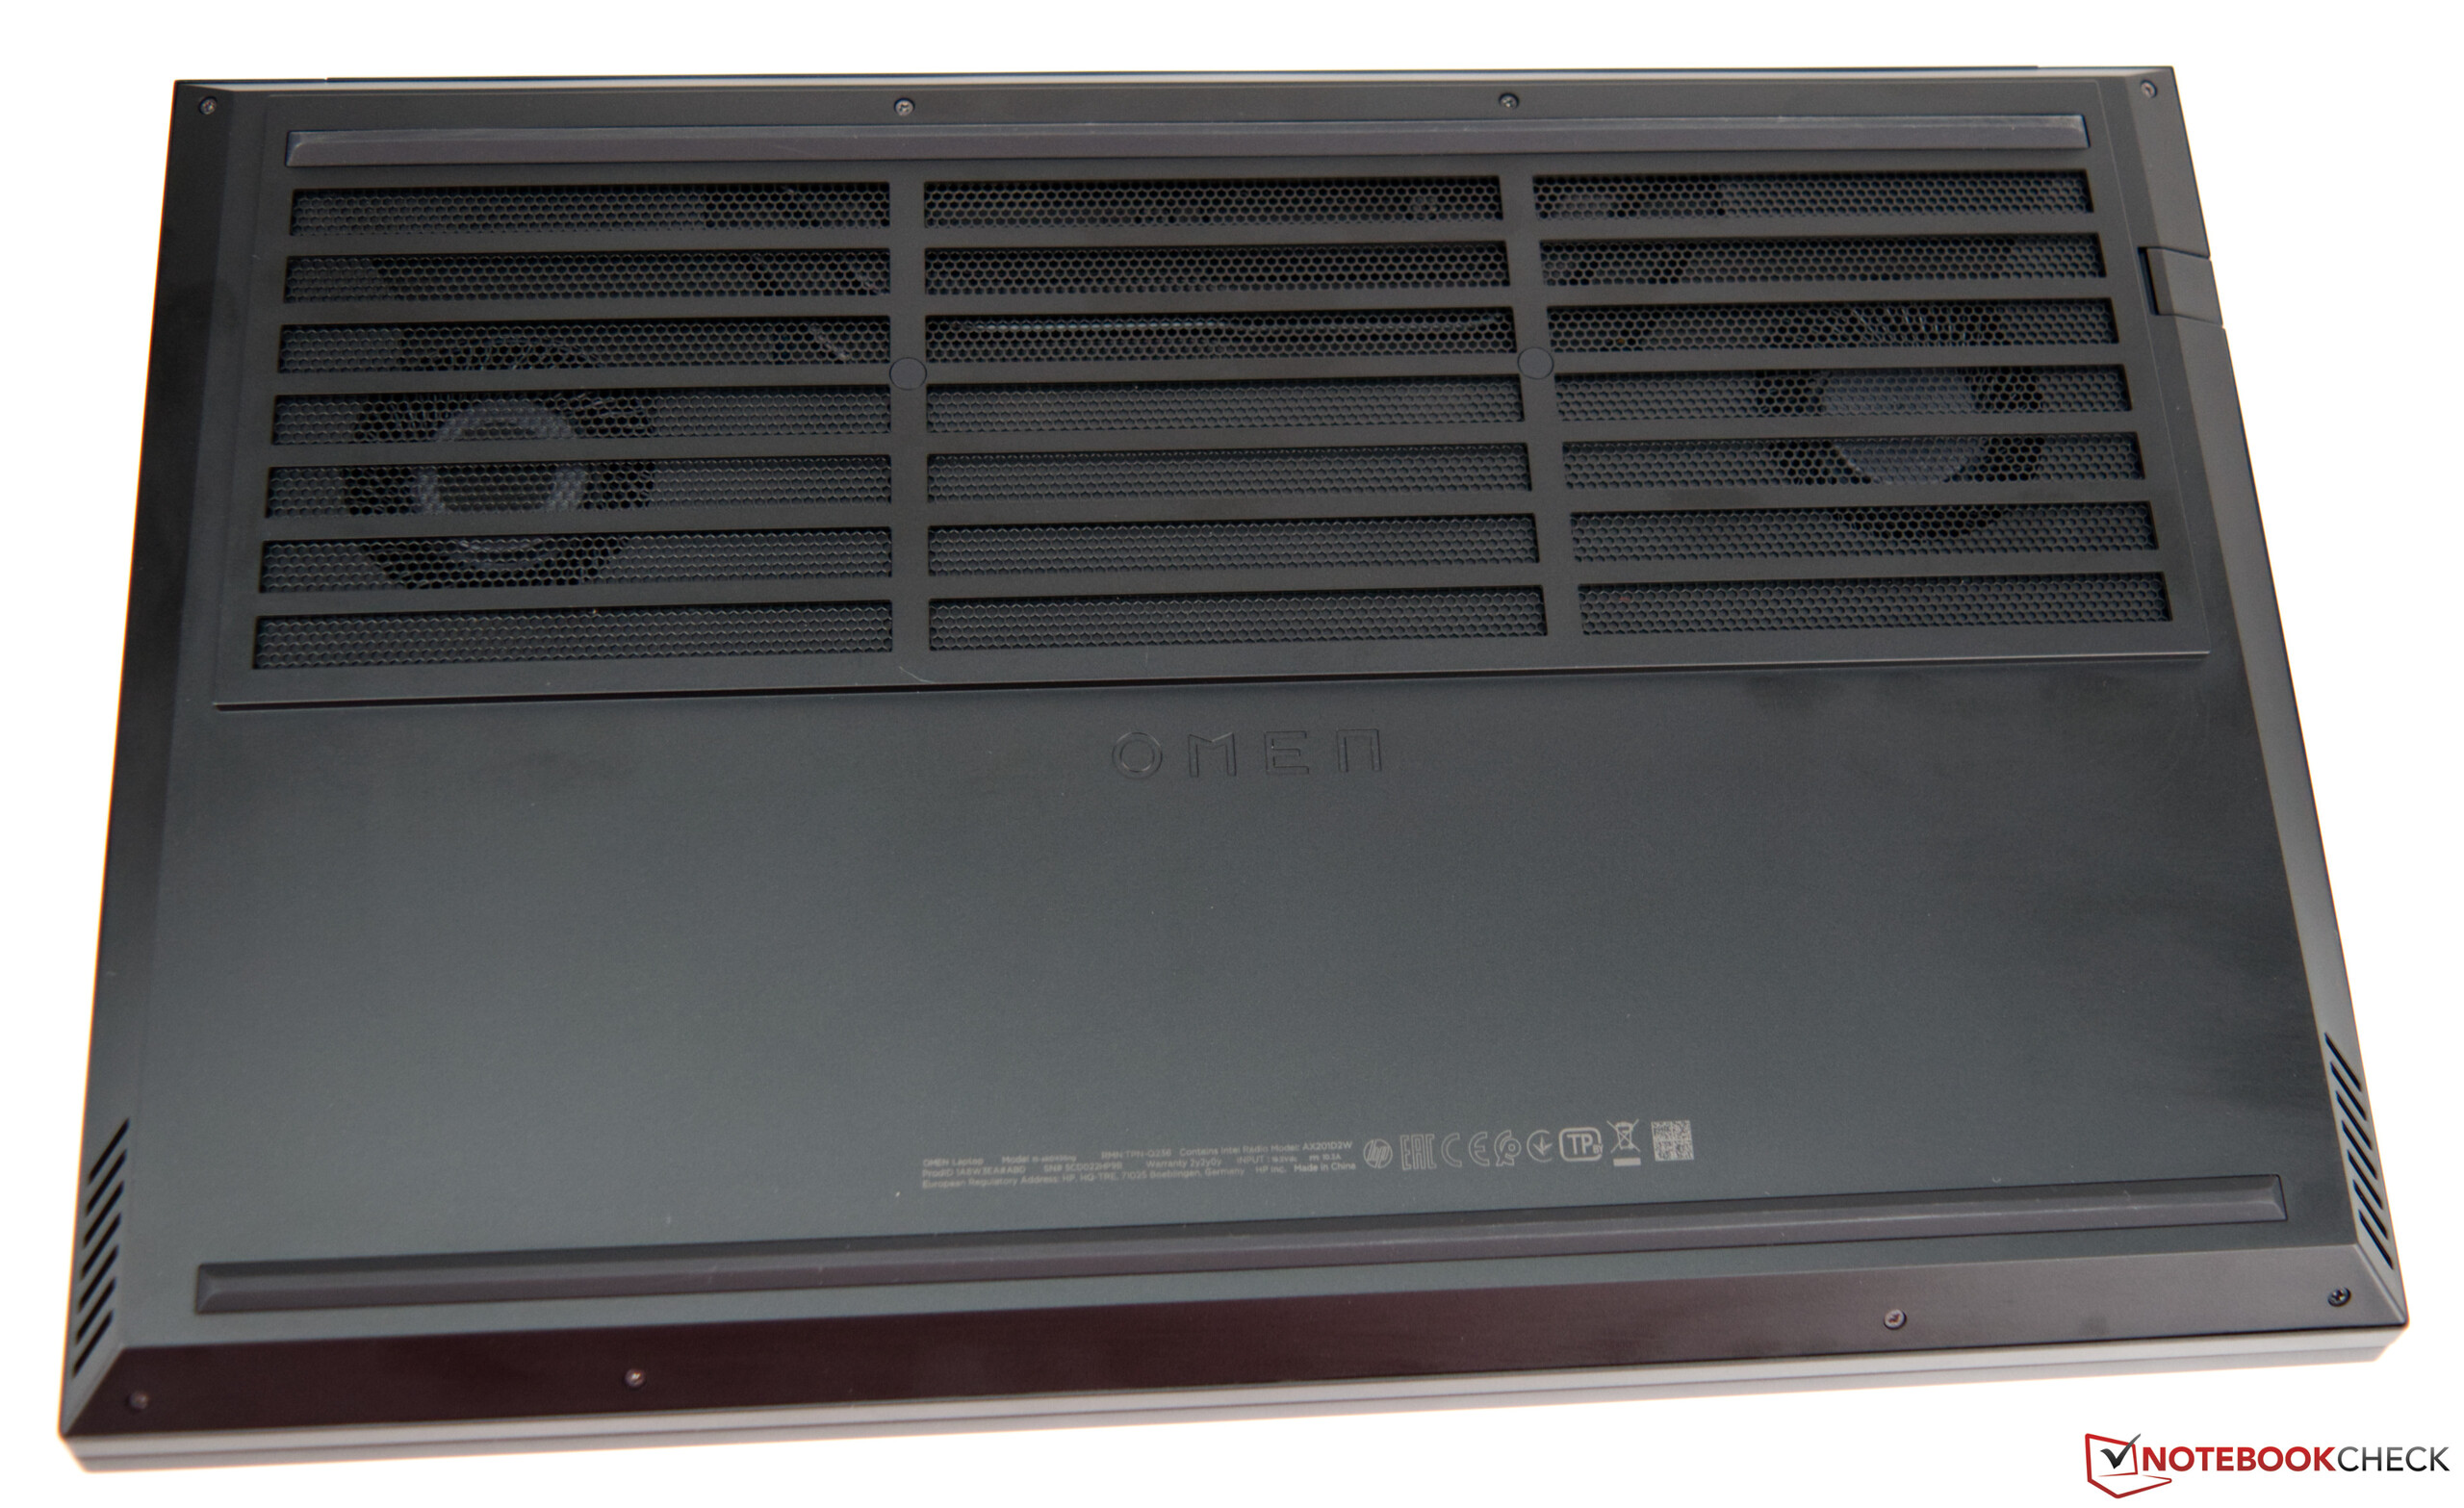
O HP Omen 15 é um bom portátil para jogos que não prejudica muito a sua carteira. E, no entanto, o aparelho oferece um ótimo desempenho com o qual você pode jogar até os títulos mais modernos. Nosso dispositivo de teste custa cerca de 1.250 euros (~$1.480) no momento do teste. O Core i5-10300H oferece apenas quatro núcleos em comparação com a concorrência, mas ainda pode se manter bem quando se trata de puro desempenho em jogos. Em uma comparação direta do desempenho da CPU, o Core i5-10300H tem que dar lugar aos processadores hexa-core e octa-core. Junto com a GeForce GTX 1660 Ti, jogar com o portátil é realmente divertido, o que também se deve à ótima tela. Com cerca de 300 nits, não é extremamente brilhante, mas é suficiente para o uso pretendido. Além disso, os desvios de espaço de cores, quase muito bons, fornecem uma boa avaliação no final. Por outro lado, você certamente pode criticar o dispositivo de armazenamento integrado, porque 512 GB não é o melhor hoje em dia. Felizmente, um segundo módulo M.2 pode ser usado para expandir o espaço de armazenamento. Isto também é feito rapidamente porque a tampa inferior pode ser removida sem muito esforço.
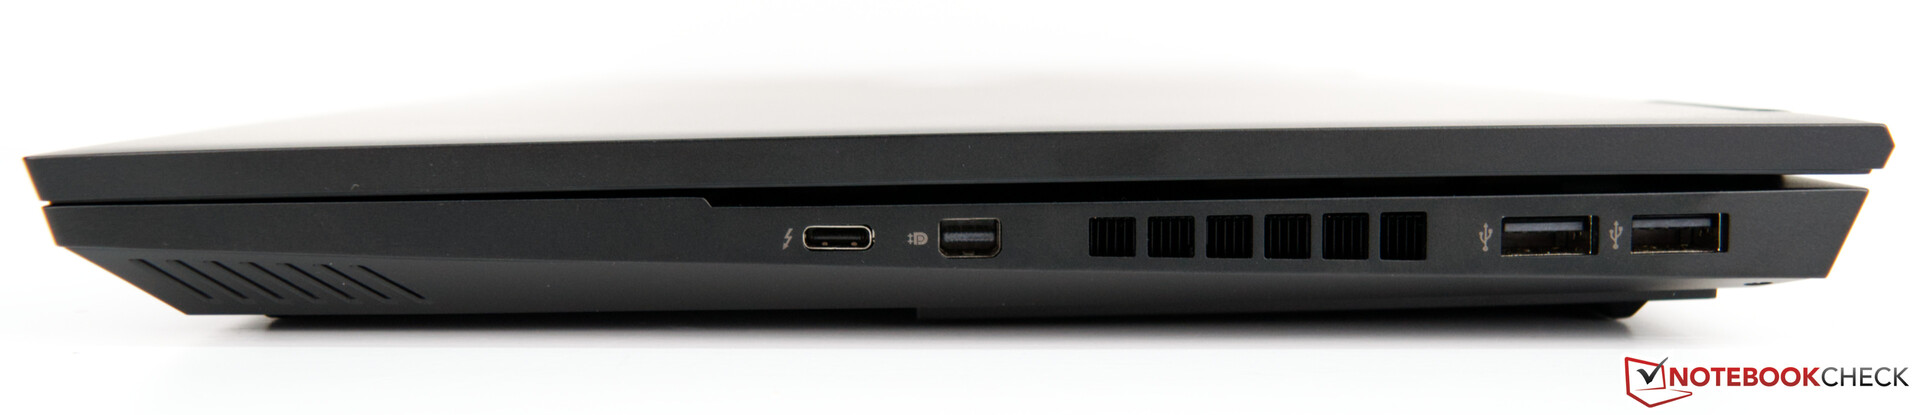
O HP Omen 15 é um bom portátil para jogos com uma boa configuração de portas e boa duração da bateria.
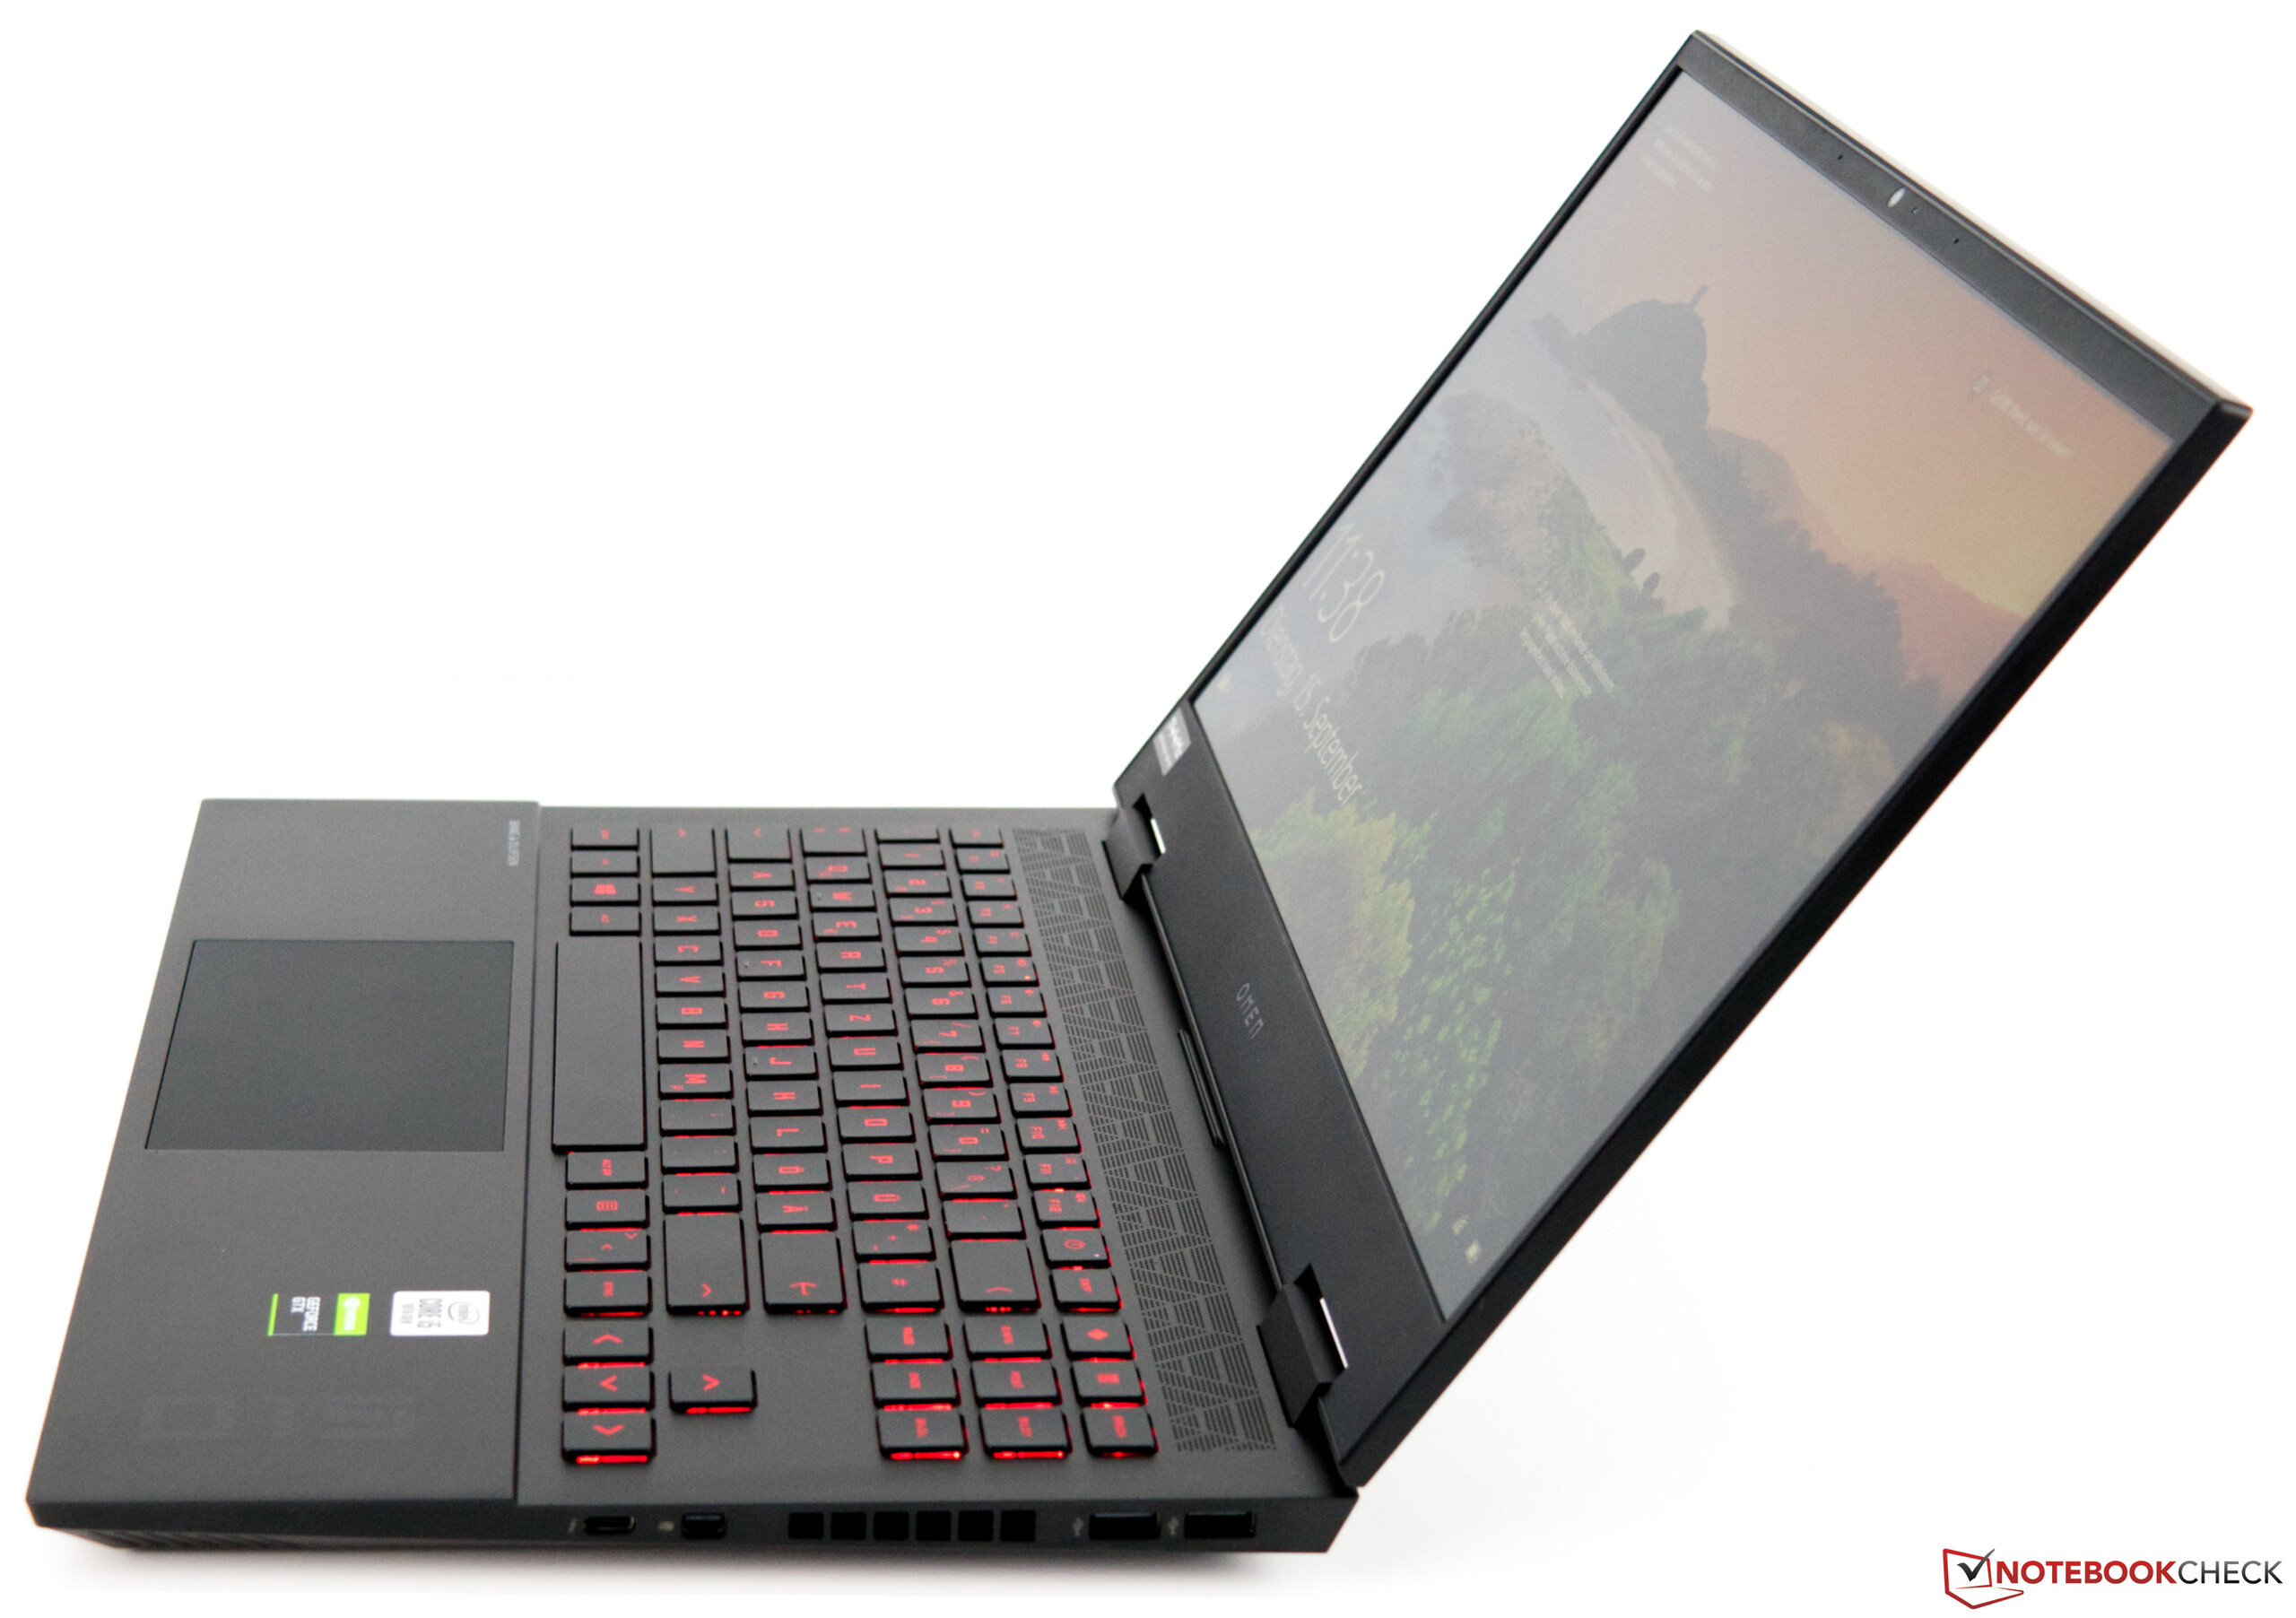
Quando se trata de volume, no entanto, os usuários precisam viver com ventilação permanente, que é sempre audível, mesmo em uso ocioso. Infelizmente, você também pode dizer, olhando para a carcaça, que este é um dispositivo econômico. No entanto, queremos elogiar as conexões múltiplas mais uma vez; a inclusão de uma porta Thunderbolt 3 faz com que o Omen 15 também esteja preparado para o futuro. Isso se aplica ao padrão mais recente de Wi-Fi 6 também, que não conseguiu fornecer seu desempenho completo no teste.
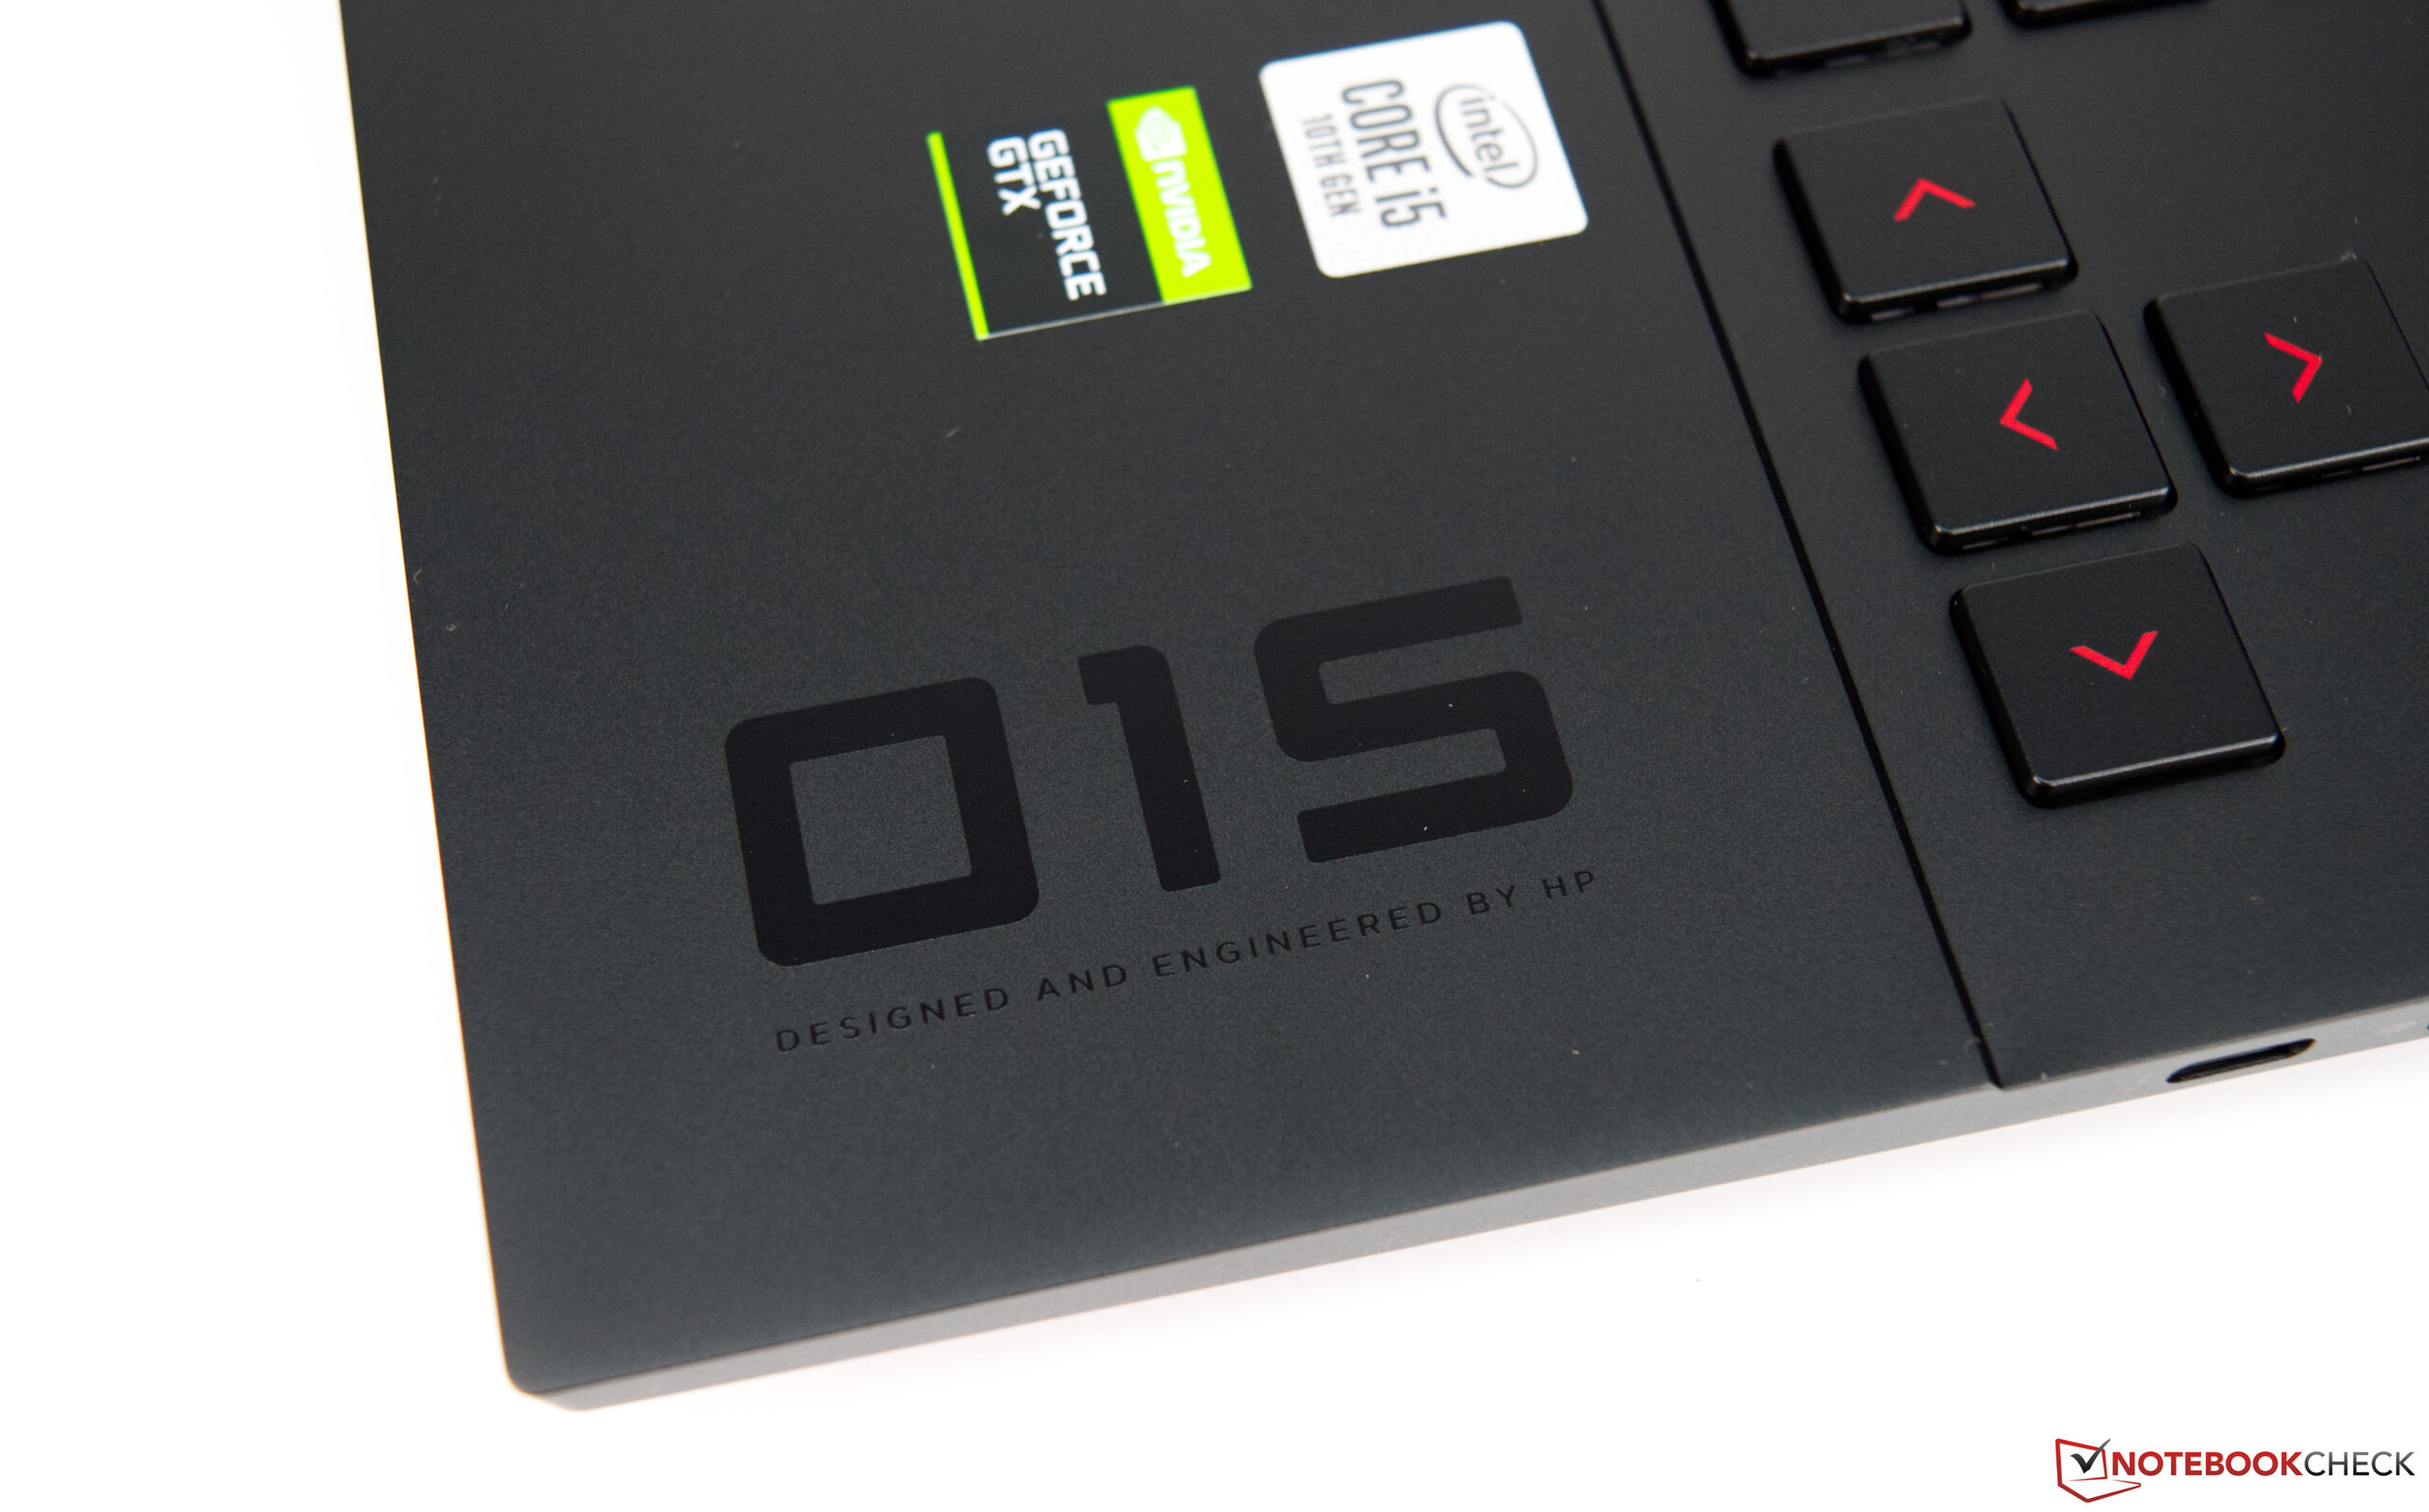
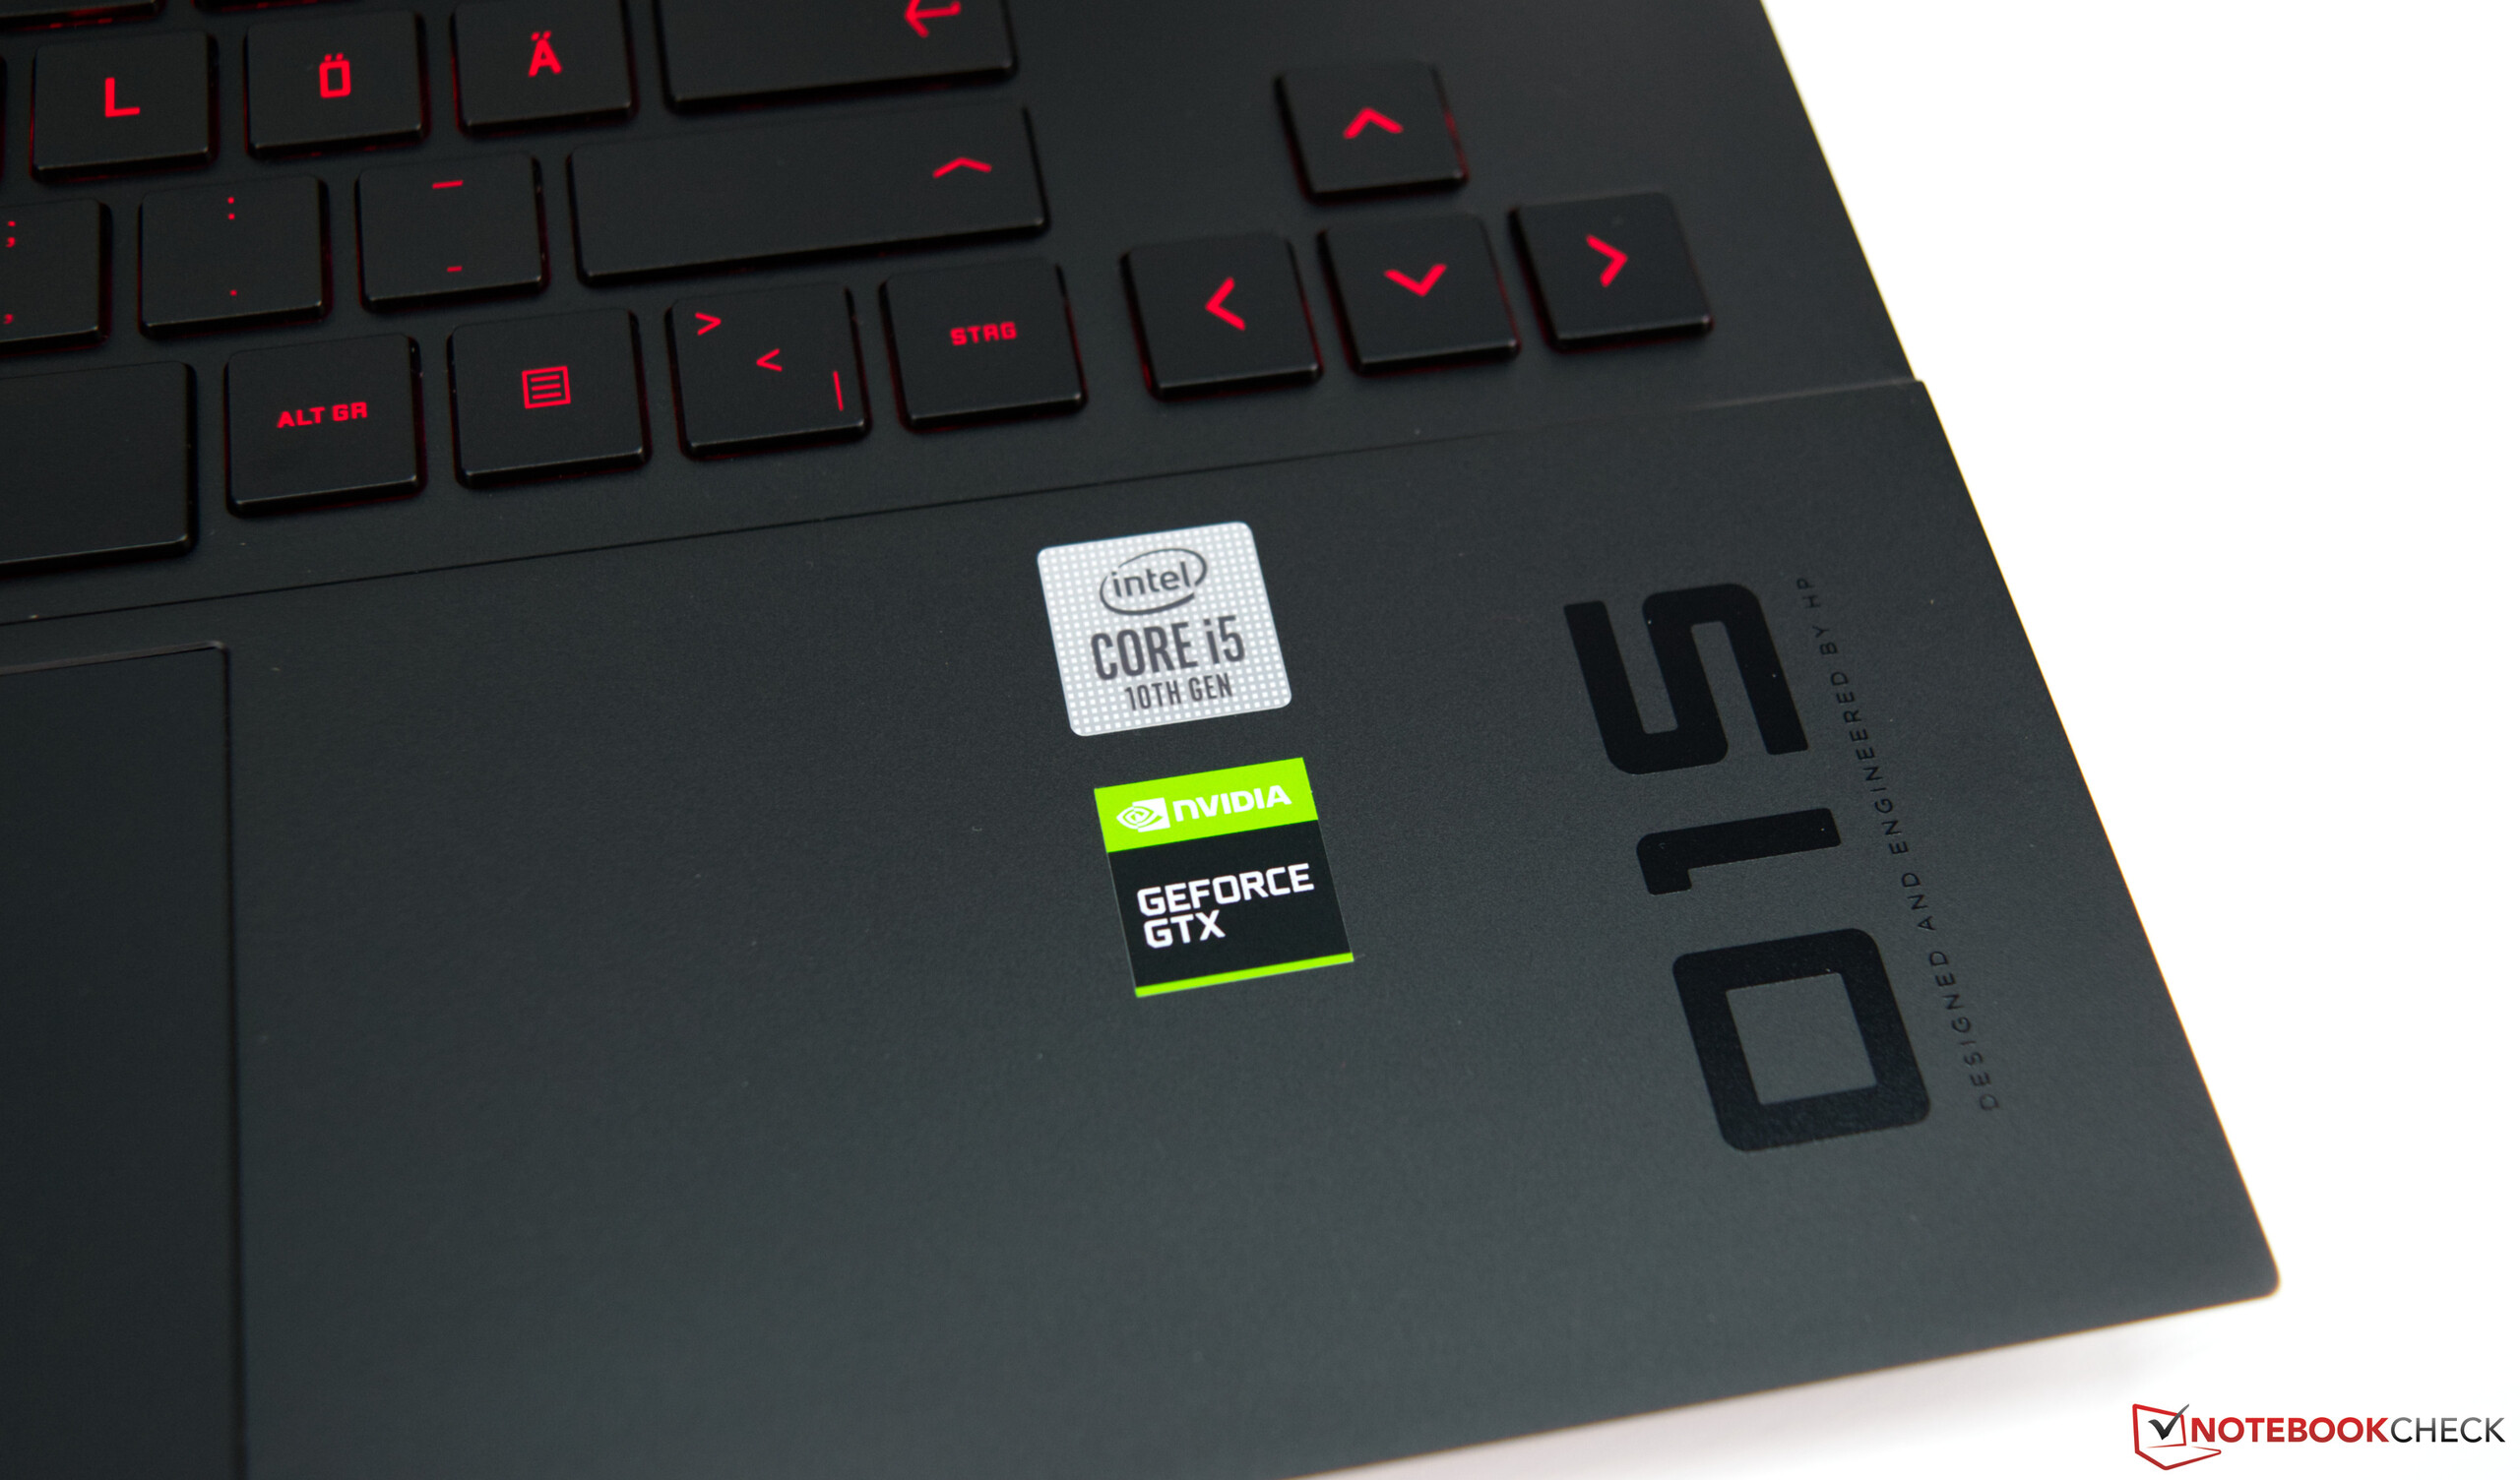
HP Omen 15-ek0456ng
- 09/18/2020 v7 (old)
Sebastian Bade
Price comparison
