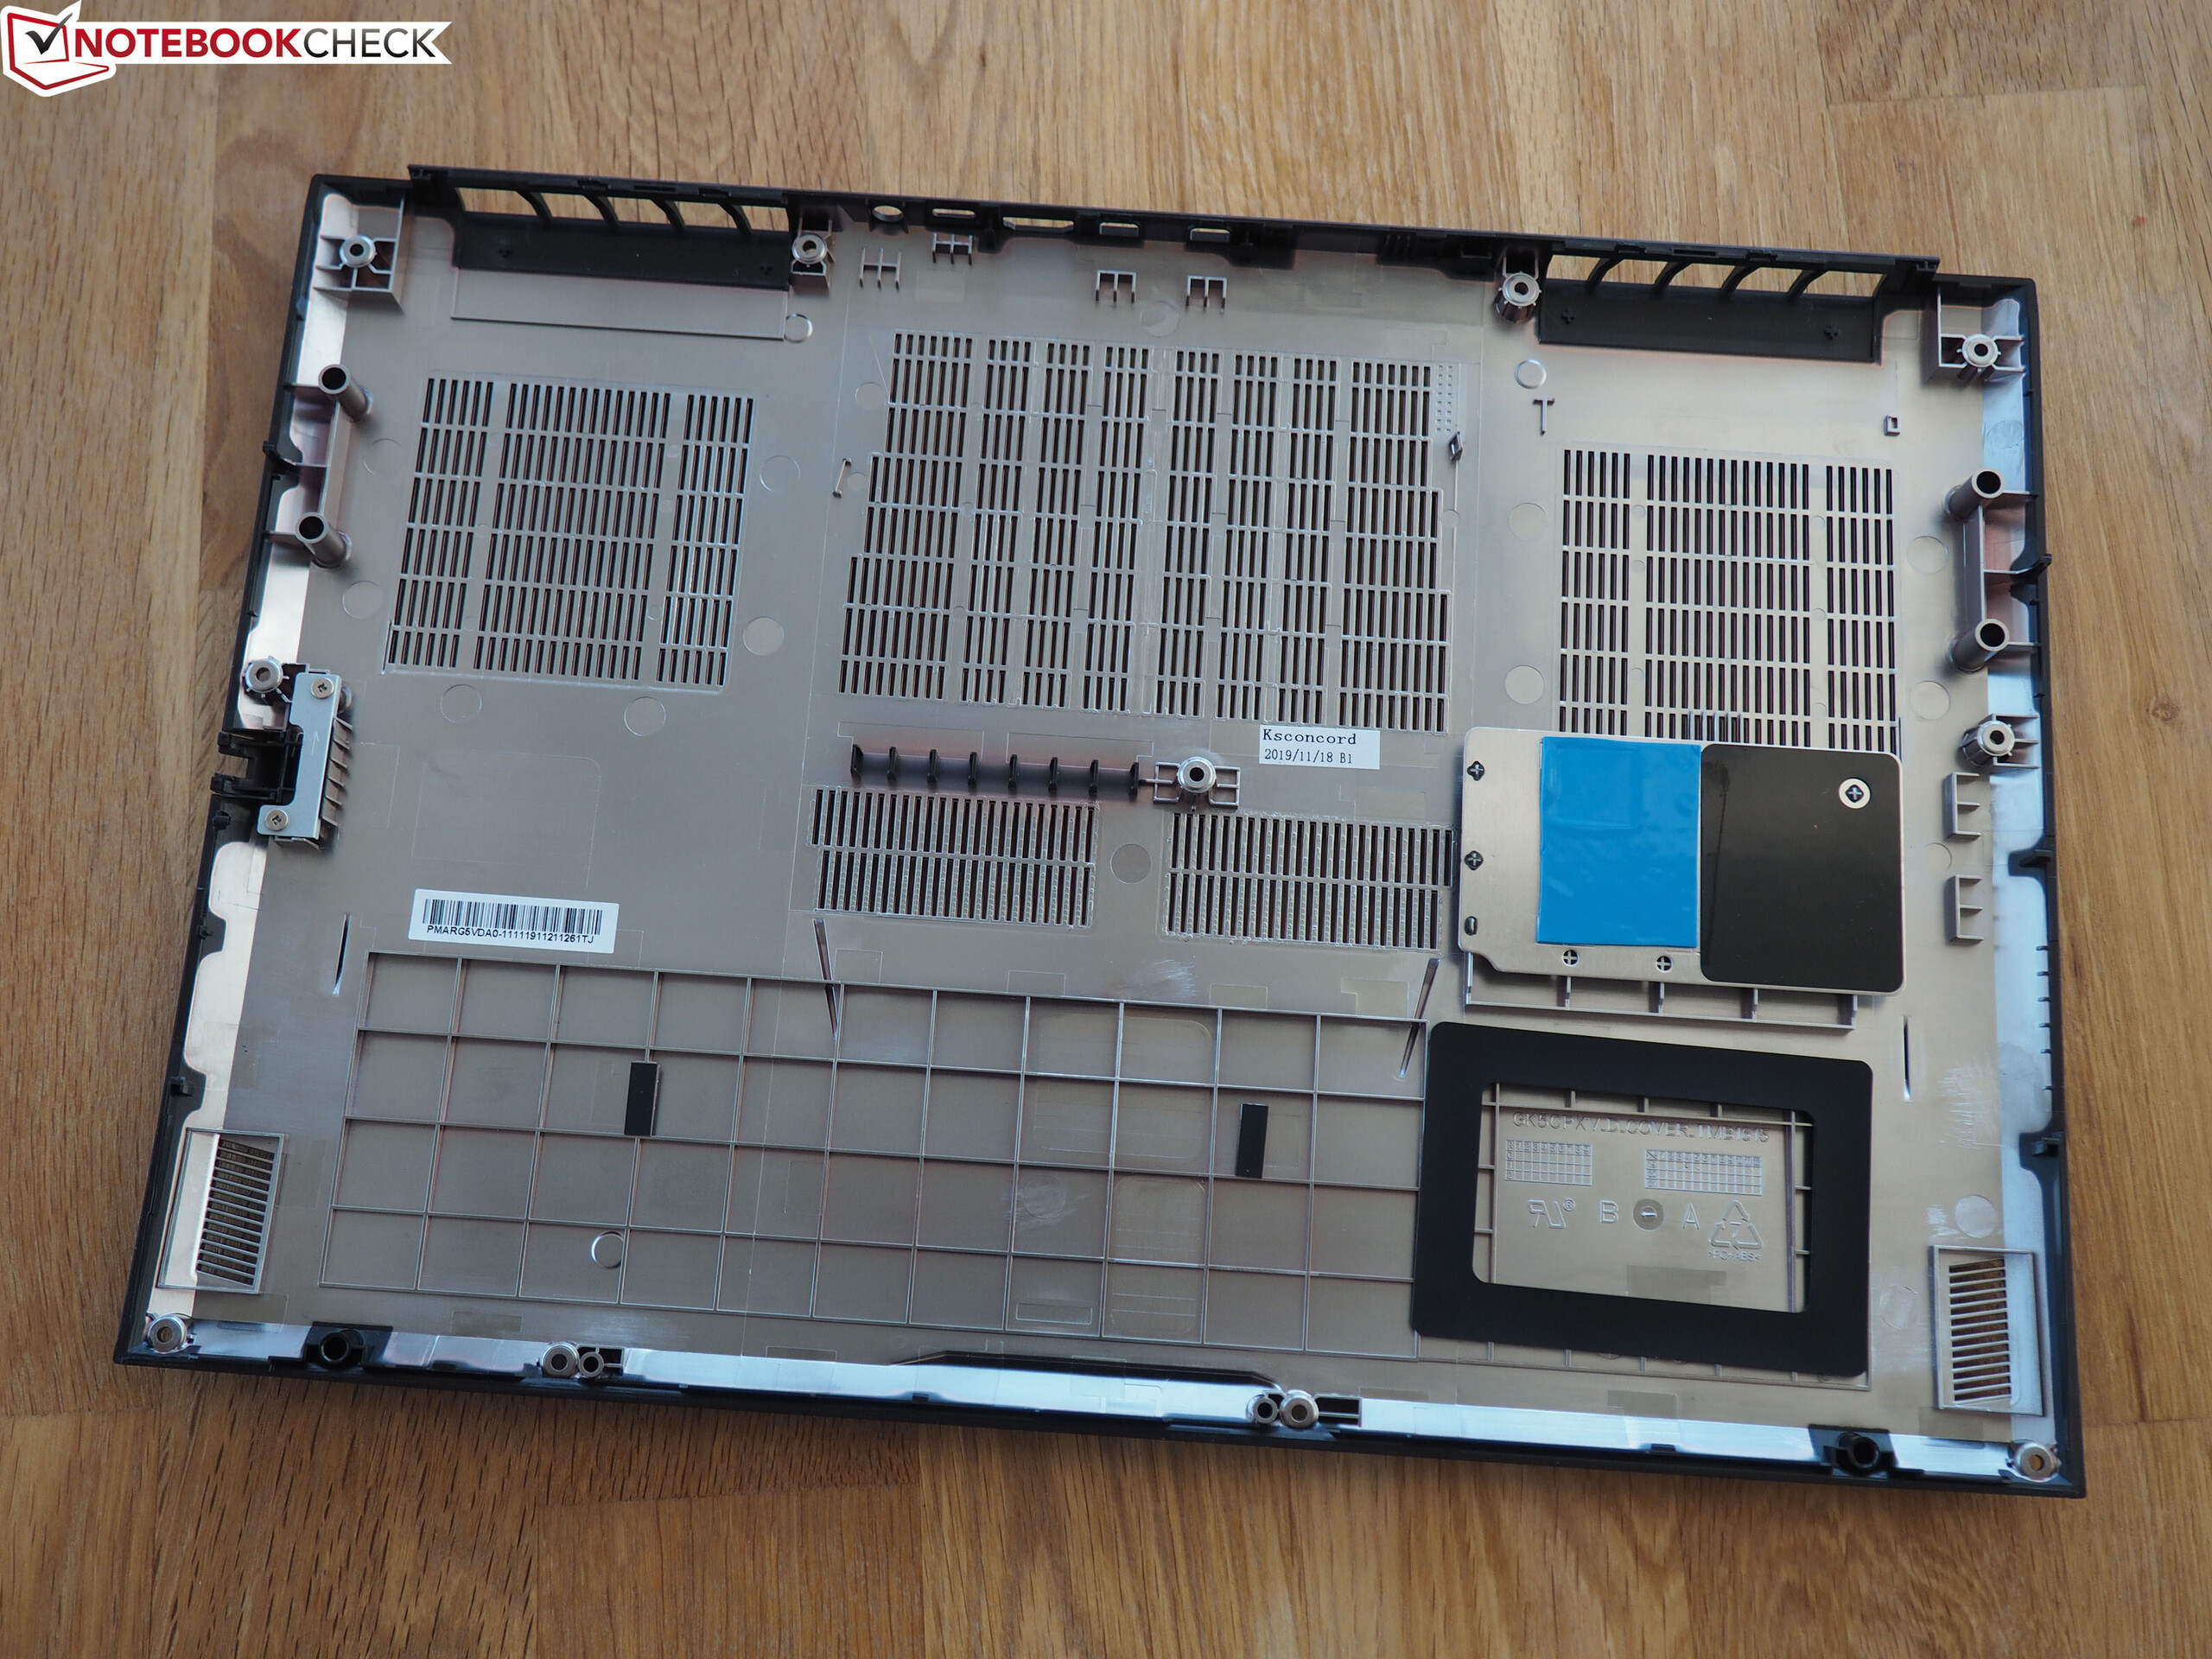
Breve Análise do Portátil Schenker XMG Core 15 (Tongfang GK5CP6V): Gamer econômico.
Avaliação | Data | Modelo | Peso | Altura | Size | Resolução | Preço |
|---|---|---|---|---|---|---|---|
| 81.3 % v7 (old) | 02/2020 | Schenker XMG Core 15 GK5CP6V i7-9750H, GeForce GTX 1660 Ti Mobile | 2 kg | 26 mm | 15.60" | 1920x1080 | |
| 84.2 % v7 (old) | 09/2019 | Razer Blade 15 GTX 1660 Ti i7-9750H, GeForce GTX 1660 Ti Mobile | 2.1 kg | 19.9 mm | 15.60" | 1920x1080 | |
| 82.9 % v7 (old) | 10/2019 | Asus ROG Zephyrus M15 GU502GU-XB74 i7-9750H, GeForce GTX 1660 Ti Mobile | 2 kg | 18.9 mm | 15.60" | 1920x1080 | |
| 85.5 % v6 (old) | 06/2019 | Aorus 15-SA i7-9750H, GeForce GTX 1660 Ti Mobile | 2.1 kg | 24.4 mm | 15.60" | 1920x1080 | |
| 82.3 % v7 (old) | 08/2019 | Lenovo Legion Y540-15IRH-81SX00B2GE i7-9750H, GeForce GTX 1660 Ti Mobile | 2.2 kg | 26 mm | 15.60" | 1920x1080 | |
| 82.1 % v7 (old) | 11/2019 | Acer Predator Helios 300 PH315-52-79TY i7-9750H, GeForce GTX 1660 Ti Mobile | 2.3 kg | 23.2 mm | 15.60" | 1920x1080 |
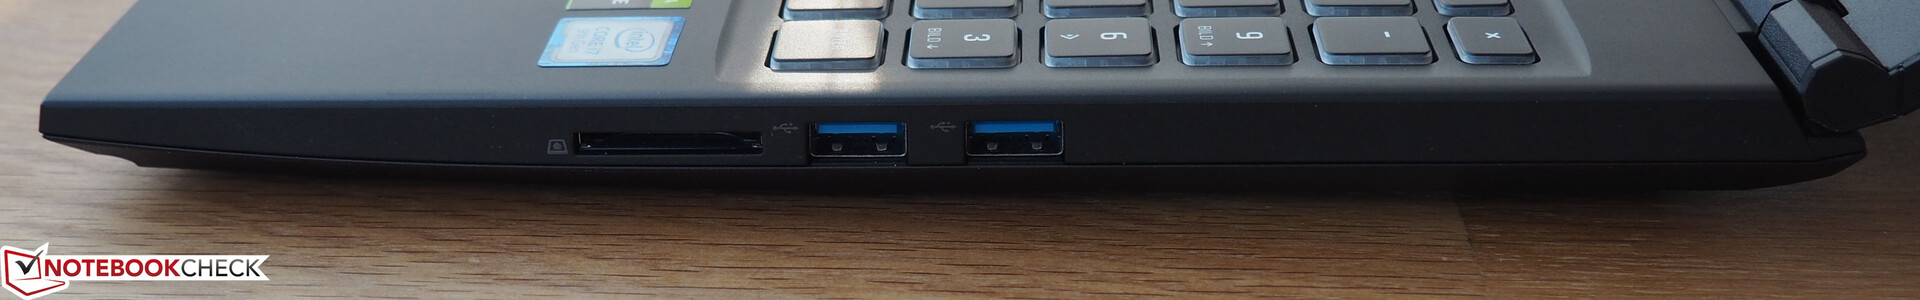
| SD Card Reader | |
| average JPG Copy Test (av. of 3 runs) | |
| Média da turma Gaming (20.9 - 210, n=54, últimos 2 anos) | |
| Schenker XMG Core 15 GK5CP6V (Toshiba Exceria Pro SDXC 64 GB UHS-II) | |
| maximum AS SSD Seq Read Test (1GB) | |
| Média da turma Gaming (25.5 - 261, n=51, últimos 2 anos) | |
| Schenker XMG Core 15 GK5CP6V (Toshiba Exceria Pro SDXC 64 GB UHS-II) | |

| |||||||||||||||||||||||||
iluminação: 88 %
iluminação com acumulador: 324 cd/m²
Contraste: 1200:1 (Preto: 0.27 cd/m²)
ΔE ColorChecker Calman: 4.07 | ∀{0.5-29.43 Ø4.71}
calibrated: 1.49
ΔE Greyscale Calman: 4.01 | ∀{0.09-98 Ø4.96}
91% sRGB (Argyll 1.6.3 3D)
59% AdobeRGB 1998 (Argyll 1.6.3 3D)
65% AdobeRGB 1998 (Argyll 3D)
91.2% sRGB (Argyll 3D)
63.3% Display P3 (Argyll 3D)
Gamma: 2.6
CCT: 7350 K
| Schenker XMG Core 15 GK5CP6V BOEhydis NV156FHM-N4G (BOE084D), IPS, 1920x1080 | Razer Blade 15 GTX 1660 Ti BOE NV156FHM-N4K, IPS, 1920x1080 | Asus ROG Zephyrus M15 GU502GU-XB74 AU Optronics B156HAN08.2, IPS, 1920x1080 | Aorus 15-SA LG Philips LP156WFG-SPB2 (LGD05E8), IPS, 1920x1080 | Lenovo Legion Y540-15IRH-81SX00B2GE BOE 084D, IPS, 1920x1080 | Acer Predator Helios 300 PH315-52-79TY AUO, B156HAN08.2, IPS, 1920x1080 | |
|---|---|---|---|---|---|---|
| Display | 2% | 2% | 2% | 0% | 1% | |
| Display P3 Coverage (%) | 63.3 | 65.3 3% | 66.5 5% | 64.3 2% | 63.6 0% | 64.1 1% |
| sRGB Coverage (%) | 91.2 | 91.8 1% | 90.8 0% | 93.6 3% | 91.7 1% | 93 2% |
| AdobeRGB 1998 Coverage (%) | 65 | 66.5 2% | 66.5 2% | 65.6 1% | 65.2 0% | 65.7 1% |
| Response Times | -26% | 21% | -50% | -8% | -29% | |
| Response Time Grey 50% / Grey 80% * (ms) | 8.8 ? | 13.6 ? -55% | 6.4 ? 27% | 15.6 ? -77% | 8.8 ? -0% | 15 ? -70% |
| Response Time Black / White * (ms) | 10.4 ? | 10 ? 4% | 8.8 ? 15% | 12.8 ? -23% | 12 ? -15% | 9 ? 13% |
| PWM Frequency (Hz) | 200 ? | |||||
| Screen | -11% | -15% | -1% | -6% | -4% | |
| Brightness middle (cd/m²) | 324 | 312.7 -3% | 297.7 -8% | 266 -18% | 299 -8% | 325 0% |
| Brightness (cd/m²) | 296 | 305 3% | 280 -5% | 254 -14% | 290 -2% | 310 5% |
| Brightness Distribution (%) | 88 | 90 2% | 84 -5% | 90 2% | 89 1% | 82 -7% |
| Black Level * (cd/m²) | 0.27 | 0.27 -0% | 0.43 -59% | 0.28 -4% | 0.29 -7% | 0.255 6% |
| Contrast (:1) | 1200 | 1158 -3% | 692 -42% | 950 -21% | 1031 -14% | 1275 6% |
| Colorchecker dE 2000 * | 4.07 | 4.57 -12% | 3.13 23% | 3.11 24% | 3.7 9% | 4.28 -5% |
| Colorchecker dE 2000 max. * | 6.39 | 6.81 -7% | 7.1 -11% | 5.84 9% | 7 -10% | 8.42 -32% |
| Colorchecker dE 2000 calibrated * | 1.49 | 2.91 -95% | 3.06 -105% | 1.37 8% | 2 -34% | 1.45 3% |
| Greyscale dE 2000 * | 4.01 | 4.3 -7% | 1.9 53% | 3.94 2% | 4.1 -2% | 5.01 -25% |
| Gamma | 2.6 85% | 2.29 96% | 2.23 99% | 2.53 87% | 2.19 100% | 2.6 85% |
| CCT | 7350 88% | 7098 92% | 6325 103% | 6210 105% | 7166 91% | 7678 85% |
| Color Space (Percent of AdobeRGB 1998) (%) | 59 | 59.4 1% | 59.2 0% | 60 2% | 59.3 1% | 60 2% |
| Color Space (Percent of sRGB) (%) | 91 | 91.3 0% | 90.5 -1% | 93 2% | 91.5 1% | 93 2% |
| Média Total (Programa/Configurações) | -12% /
-10% | 3% /
-7% | -16% /
-6% | -5% /
-5% | -11% /
-6% |
* ... menor é melhor
Exibir tempos de resposta
| ↔ Tempo de resposta preto para branco | ||
|---|---|---|
| 10.4 ms ... ascensão ↗ e queda ↘ combinadas | ↗ 5.2 ms ascensão | 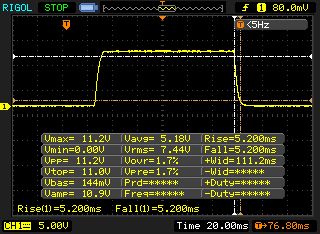 |
| ↘ 5.2 ms queda | ||
| A tela mostra boas taxas de resposta em nossos testes, mas pode ser muito lenta para jogadores competitivos. Em comparação, todos os dispositivos testados variam de 0.1 (mínimo) a 240 (máximo) ms. » 28 % de todos os dispositivos são melhores. Isso significa que o tempo de resposta medido é melhor que a média de todos os dispositivos testados (19.8 ms). | ||
| ↔ Tempo de resposta 50% cinza a 80% cinza | ||
| 8.8 ms ... ascensão ↗ e queda ↘ combinadas | ↗ 4.4 ms ascensão | 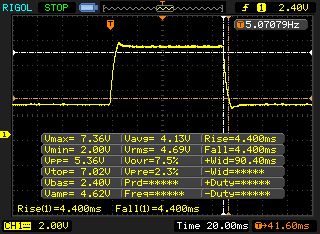 |
| ↘ 4.4 ms queda | ||
| A tela mostra taxas de resposta rápidas em nossos testes e deve ser adequada para jogos. Em comparação, todos os dispositivos testados variam de 0.165 (mínimo) a 636 (máximo) ms. » 22 % de todos os dispositivos são melhores. Isso significa que o tempo de resposta medido é melhor que a média de todos os dispositivos testados (31 ms). | ||
Cintilação da tela / PWM (modulação por largura de pulso)
| Tela tremeluzindo / PWM não detectado | 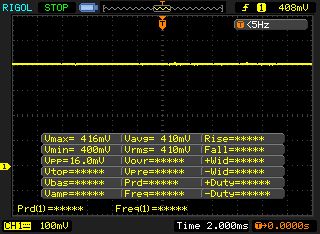 | ||
[pwm_comparison] Em comparação: 52 % de todos os dispositivos testados não usam PWM para escurecer a tela. Se PWM foi detectado, uma média de 7754 (mínimo: 5 - máximo: 343500) Hz foi medida. | |||
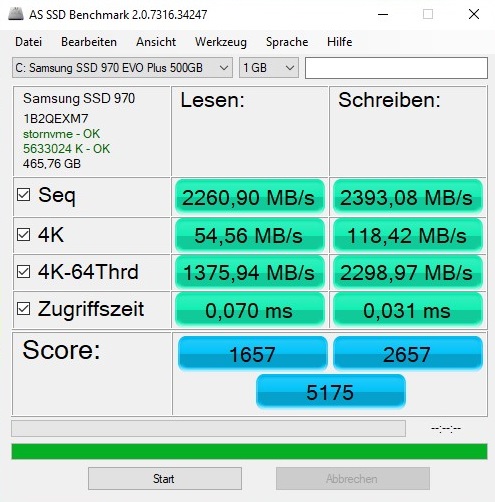
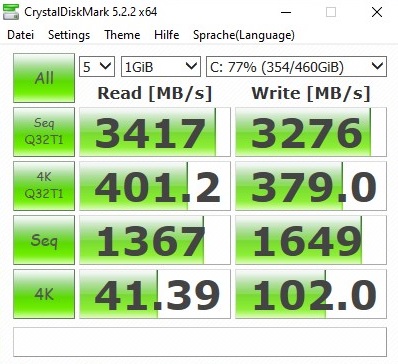
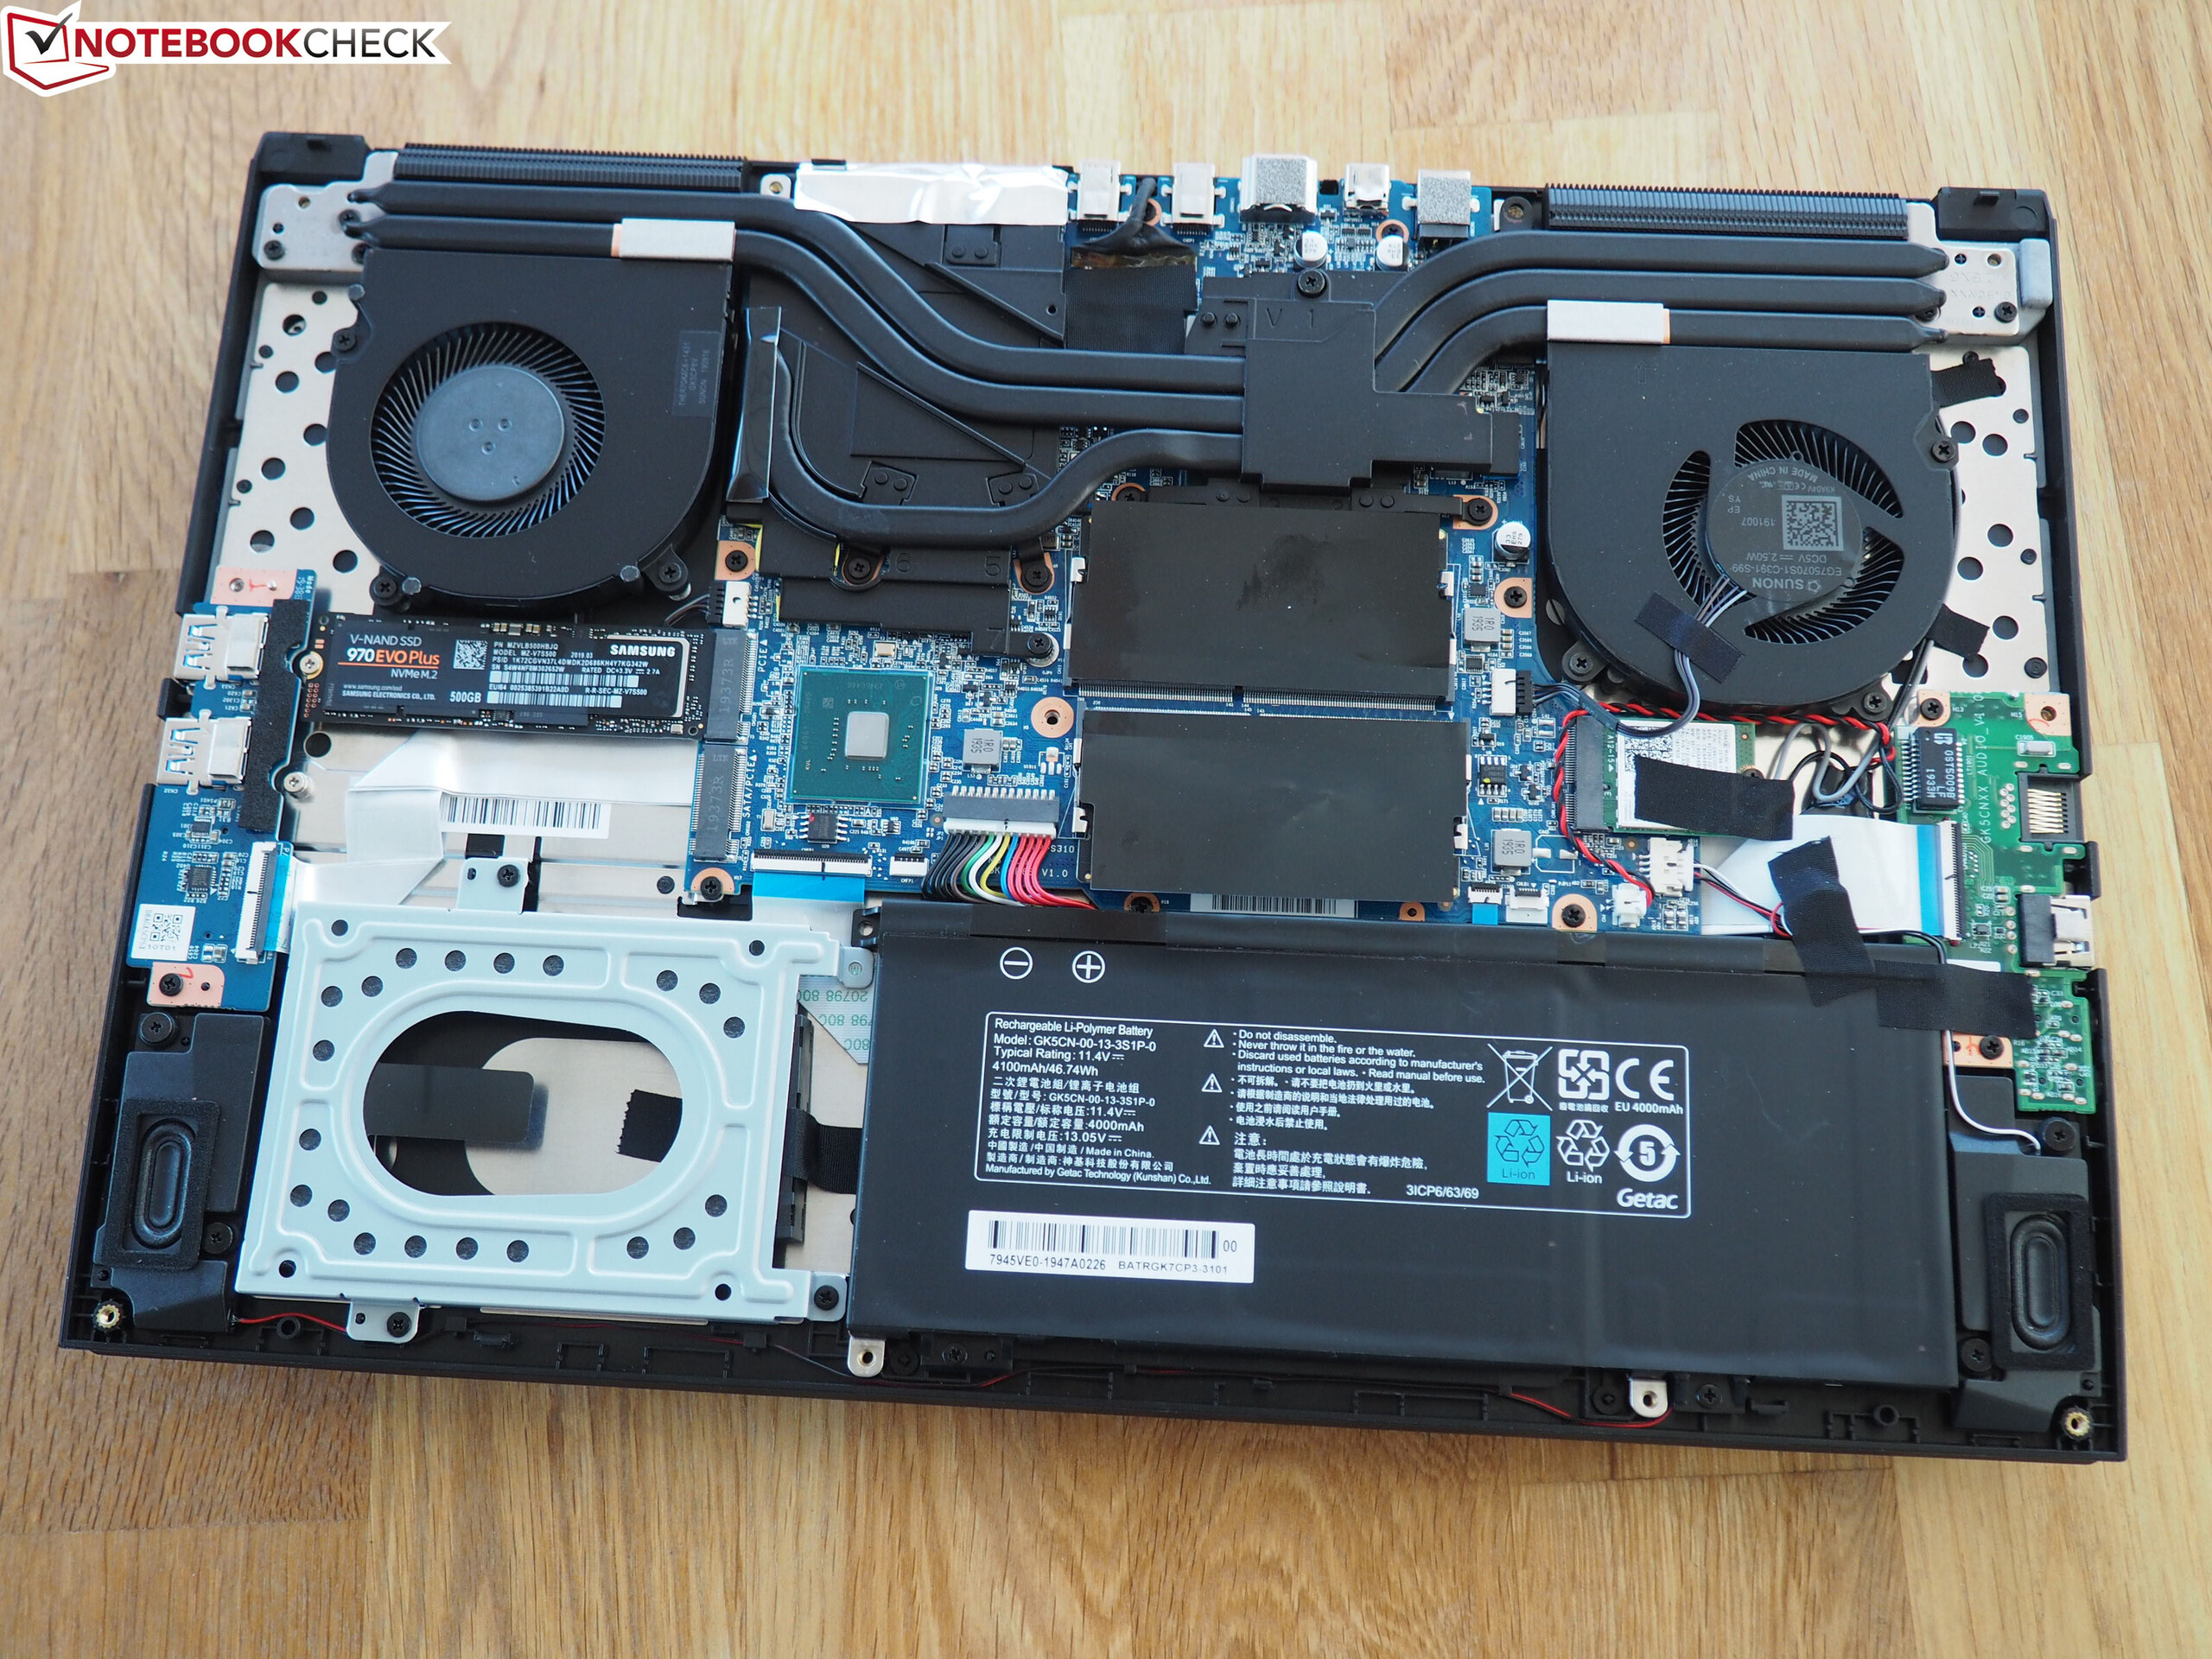
| Schenker XMG Core 15 GK5CP6V Samsung SSD 970 EVO Plus 500GB | Razer Blade 15 GTX 1660 Ti Samsung SSD PM981 MZVLB256HAHQ | Asus ROG Zephyrus M15 GU502GU-XB74 Intel SSD 660p SSDPEKNW512G8 | Aorus 15-SA Intel SSD 760p SSDPEKKW512G8 | Lenovo Legion Y540-15IRH-81SX00B2GE WDC PC SN720 SDAPNTW-512G | Acer Predator Helios 300 PH315-52-79TY WDC PC SN720 SDAPNTW-512G | |
|---|---|---|---|---|---|---|
| CrystalDiskMark 5.2 / 6 | 5% | -4% | 4% | 7% | 11% | |
| Write 4K (MB/s) | 102 | 135 32% | 156 53% | 104 2% | 158.8 56% | 108.7 7% |
| Read 4K (MB/s) | 41.39 | 41.1 -1% | 60.7 47% | 55.1 33% | 29.11 -30% | 44.91 9% |
| Write Seq (MB/s) | 1649 | 1427 -13% | 968 -41% | 1519 -8% | 1584 -4% | 2424 47% |
| Read Seq (MB/s) | 1367 | 1494 9% | 1619 18% | 2486 82% | 1694 24% | 1617 18% |
| Write 4K Q32T1 (MB/s) | 379 | 494.9 31% | 485 28% | 320.5 -15% | 536 41% | 356.9 -6% |
| Read 4K Q32T1 (MB/s) | 401.2 | 578 44% | 337.3 -16% | 431.8 8% | 363.9 -9% | 557 39% |
| Write Seq Q32T1 (MB/s) | 3276 | 1417 -57% | 969 -70% | 1498 -54% | 2536 -23% | 2542 -22% |
| Read Seq Q32T1 (MB/s) | 3417 | 3251 -5% | 1825 -47% | 2868 -16% | 3458 1% | 3218 -6% |

| 3DMark 11 Performance | 17351 pontos | |
| 3DMark Cloud Gate Standard Score | 35204 pontos | |
| 3DMark Fire Strike Score | 13267 pontos | |
| 3DMark Time Spy Score | 5724 pontos | |
Ajuda | ||
| The Witcher 3 | |
| 1920x1080 High Graphics & Postprocessing (Nvidia HairWorks Off) | |
| Aorus 15-SA | |
| Schenker XMG Core 15 GK5CP6V | |
| Razer Blade 15 GTX 1660 Ti | |
| Asus ROG Zephyrus M15 GU502GU-XB74 | |
| Acer Predator Helios 300 PH315-52-79TY | |
| 1920x1080 Ultra Graphics & Postprocessing (HBAO+) | |
| Aorus 15-SA | |
| Asus ROG Zephyrus M15 GU502GU-XB74 | |
| Acer Predator Helios 300 PH315-52-79TY | |
| Schenker XMG Core 15 GK5CP6V | |
| Lenovo Legion Y540-15IRH-81SX00B2GE | |
| Razer Blade 15 GTX 1660 Ti | |
| baixo | média | alto | ultra | |
|---|---|---|---|---|
| The Witcher 3 (2015) | 101 | 54.2 | ||
| Dota 2 Reborn (2015) | 144 | 131 | 124 | 118 |
| X-Plane 11.11 (2018) | 107 | 92.7 | 78.6 | |
| Apex Legends (2019) | 131 | 108 | 107 | |
| Anthem (2019) | 75.2 | 73.2 | 71 | |
| Dirt Rally 2.0 (2019) | 144 | 123 | 65.6 | |
| The Division 2 (2019) | 98 | 78 | 57 | |
| Control (2019) | 69.2 | 50.7 | ||
| Borderlands 3 (2019) | 91.7 | 61.7 | 46.6 | |
| FIFA 20 (2019) | 192 | 181 | 179 | |
| Ghost Recon Breakpoint (2019) | 79 | 70 | 51 | |
| GRID 2019 (2019) | 119 | 90.5 | 61.7 | |
| Call of Duty Modern Warfare 2019 (2019) | 99 | 88.1 | 71.9 | |
| Need for Speed Heat (2019) | 87.9 | 79.7 | 67.4 | |
| Star Wars Jedi Fallen Order (2019) | 94.7 | 84.9 | 77.7 | |
| Red Dead Redemption 2 (2019) | 75.3 | 50.5 | 31.2 |
Barulho
| Ocioso |
| 30 / 31 / 33 dB |
| Carga |
| 48 / 51 dB |
 | ||
30 dB silencioso 40 dB(A) audível 50 dB(A) ruidosamente alto |
||
min: | ||
| Schenker XMG Core 15 GK5CP6V i7-9750H, GeForce GTX 1660 Ti Mobile | Razer Blade 15 GTX 1660 Ti i7-9750H, GeForce GTX 1660 Ti Mobile | Asus ROG Zephyrus M15 GU502GU-XB74 i7-9750H, GeForce GTX 1660 Ti Mobile | Aorus 15-SA i7-9750H, GeForce GTX 1660 Ti Mobile | Lenovo Legion Y540-15IRH-81SX00B2GE i7-9750H, GeForce GTX 1660 Ti Mobile | Acer Predator Helios 300 PH315-52-79TY i7-9750H, GeForce GTX 1660 Ti Mobile | |
|---|---|---|---|---|---|---|
| Noise | 5% | 2% | -9% | 10% | 5% | |
| desligado / ambiente * (dB) | 30 | 28.5 5% | 28.2 6% | 29 3% | 29.3 2% | 30.2 -1% |
| Idle Minimum * (dB) | 30 | 30.3 -1% | 28.7 4% | 32 -7% | 29.3 2% | 31 -3% |
| Idle Average * (dB) | 31 | 30.5 2% | 30.5 2% | 35 -13% | 29.3 5% | 31 -0% |
| Idle Maximum * (dB) | 33 | 30.5 8% | 31 6% | 41 -24% | 29.3 11% | 31 6% |
| Load Average * (dB) | 48 | 41 15% | 39 19% | 54 -13% | 35.7 26% | 41.5 14% |
| Witcher 3 ultra * (dB) | 51 | 48 6% | 54.2 -6% | 52 -2% | 44.2 13% | 46.7 8% |
| Load Maximum * (dB) | 51 | 51.9 -2% | 59.6 -17% | 56 -10% | 45.6 11% | 46.9 8% |
* ... menor é melhor
(-) A temperatura máxima no lado superior é 48 °C / 118 F, em comparação com a média de 40.4 °C / 105 F , variando de 21.2 a 68.8 °C para a classe Gaming.
(-) A parte inferior aquece até um máximo de 59 °C / 138 F, em comparação com a média de 43.2 °C / 110 F
(+) Em uso inativo, a temperatura média para o lado superior é 25.7 °C / 78 F, em comparação com a média do dispositivo de 33.9 °C / ### class_avg_f### F.
(-) Jogando The Witcher 3, a temperatura média para o lado superior é 39.6 °C / 103 F, em comparação com a média do dispositivo de 33.9 °C / ## #class_avg_f### F.
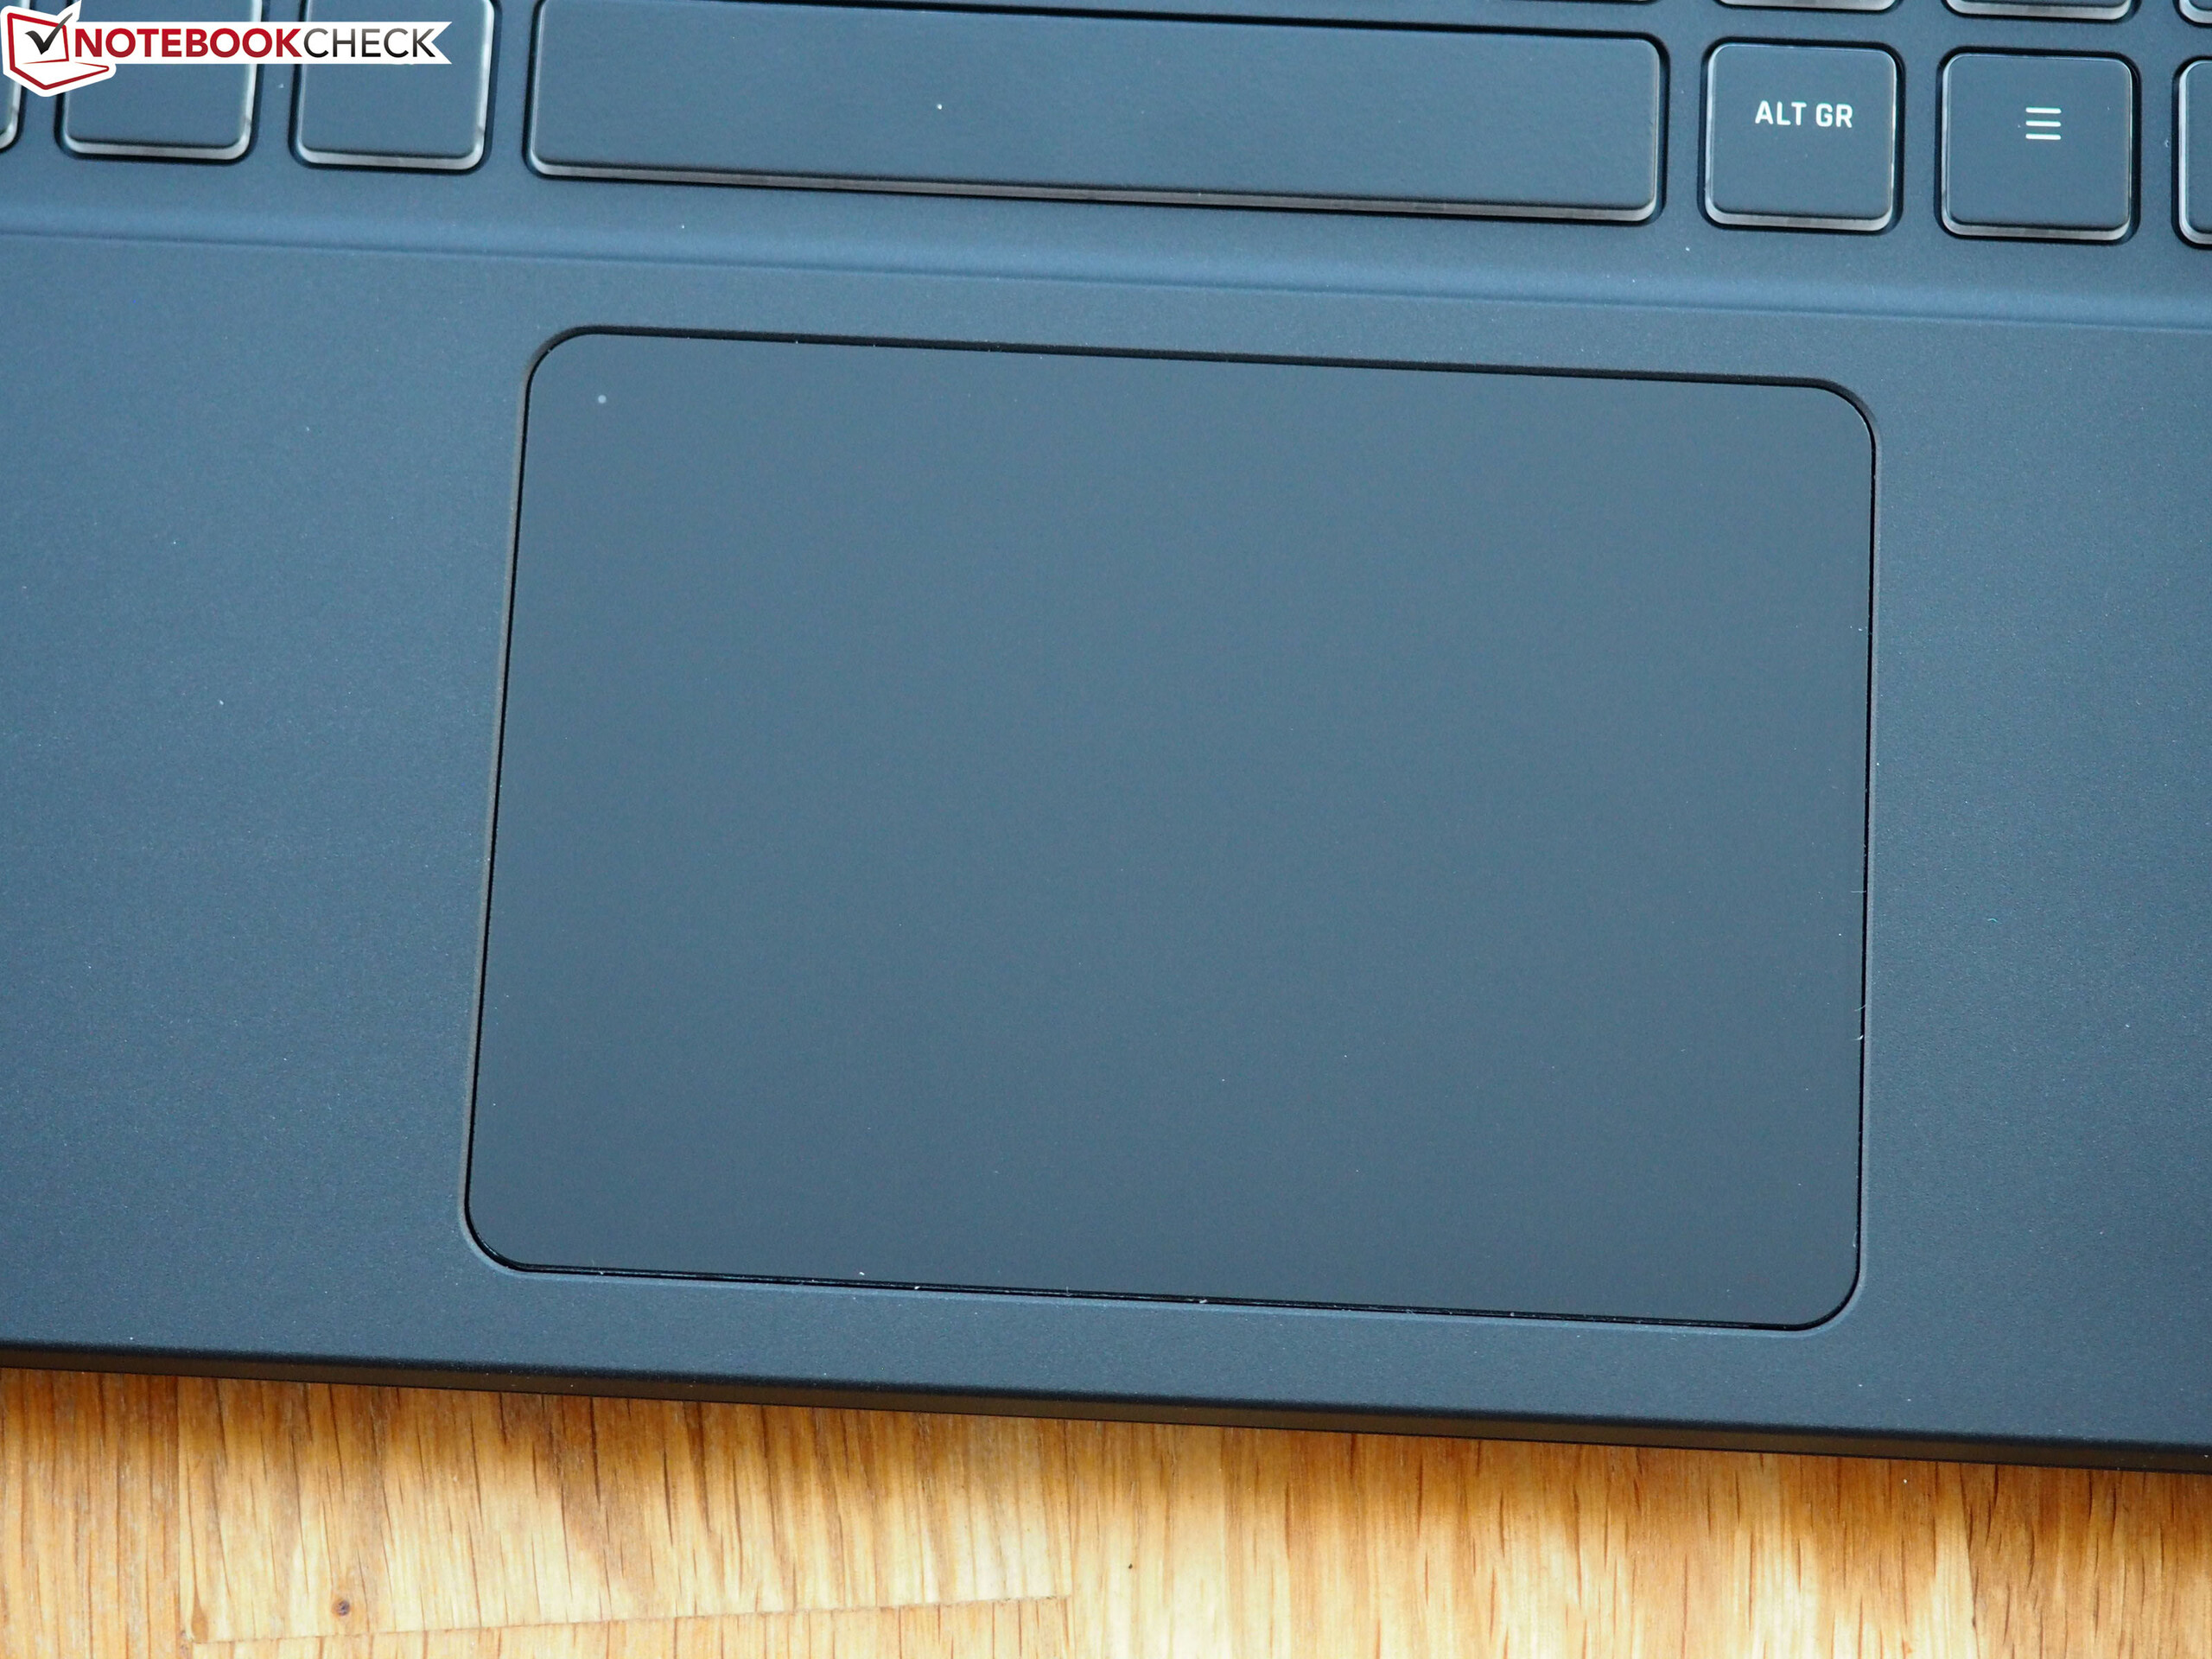
(±) Os apoios para as mãos e o touchpad podem ficar muito quentes ao toque, com um máximo de 37 °C / 98.6 F.
(-) A temperatura média da área do apoio para as mãos de dispositivos semelhantes foi 28.8 °C / 83.8 F (-8.2 °C / -14.8 F).
| Schenker XMG Core 15 GK5CP6V i7-9750H, GeForce GTX 1660 Ti Mobile | Razer Blade 15 GTX 1660 Ti i7-9750H, GeForce GTX 1660 Ti Mobile | Asus ROG Zephyrus M15 GU502GU-XB74 i7-9750H, GeForce GTX 1660 Ti Mobile | Aorus 15-SA i7-9750H, GeForce GTX 1660 Ti Mobile | Lenovo Legion Y540-15IRH-81SX00B2GE i7-9750H, GeForce GTX 1660 Ti Mobile | Acer Predator Helios 300 PH315-52-79TY i7-9750H, GeForce GTX 1660 Ti Mobile | |
|---|---|---|---|---|---|---|
| Heat | -20% | -15% | -6% | -12% | 8% | |
| Maximum Upper Side * (°C) | 48 | 52 -8% | 49.8 -4% | 44 8% | 42.7 11% | 52 -8% |
| Maximum Bottom * (°C) | 59 | 52.2 12% | 63.2 -7% | 58 2% | 52.7 11% | 46.3 22% |
| Idle Upper Side * (°C) | 27 | 38 -41% | 32 -19% | 30 -11% | 33.1 -23% | 24.8 8% |
| Idle Bottom * (°C) | 28 | 40.4 -44% | 36.2 -29% | 34 -21% | 41 -46% | 25.4 9% |
* ... menor é melhor
Schenker XMG Core 15 GK5CP6V análise de áudio
(±) | o volume do alto-falante é médio, mas bom (###valor### dB)
Graves 100 - 315Hz
(-) | quase nenhum baixo - em média 23.1% menor que a mediana
(±) | a linearidade dos graves é média (11.5% delta para a frequência anterior)
Médios 400 - 2.000 Hz
(+) | médios equilibrados - apenas 4.7% longe da mediana
(±) | a linearidade dos médios é média (9% delta para frequência anterior)
Altos 2 - 16 kHz
(+) | agudos equilibrados - apenas 1.5% longe da mediana
(+) | os máximos são lineares (4.6% delta da frequência anterior)
Geral 100 - 16.000 Hz
(±) | a linearidade do som geral é média (23.1% diferença em relação à mediana)
Comparado com a mesma classe
» 84% de todos os dispositivos testados nesta classe foram melhores, 4% semelhantes, 12% piores
» O melhor teve um delta de 6%, a média foi 18%, o pior foi 132%
Comparado com todos os dispositivos testados
» 69% de todos os dispositivos testados foram melhores, 5% semelhantes, 26% piores
» O melhor teve um delta de 4%, a média foi 23%, o pior foi 134%
Razer Blade 15 GTX 1660 Ti análise de áudio
(±) | o volume do alto-falante é médio, mas bom (###valor### dB)
Graves 100 - 315Hz
(±) | graves reduzidos - em média 13.5% menor que a mediana
(±) | a linearidade dos graves é média (13.2% delta para a frequência anterior)
Médios 400 - 2.000 Hz
(±) | médios mais altos - em média 5.3% maior que a mediana
(+) | médios são lineares (4.7% delta para frequência anterior)
Altos 2 - 16 kHz
(±) | máximos reduzidos - em média 5.1% menor que a mediana
(±) | a linearidade dos máximos é média (7.2% delta para frequência anterior)
Geral 100 - 16.000 Hz
(±) | a linearidade do som geral é média (25.2% diferença em relação à mediana)
Comparado com a mesma classe
» 90% de todos os dispositivos testados nesta classe foram melhores, 3% semelhantes, 7% piores
» O melhor teve um delta de 6%, a média foi 18%, o pior foi 132%
Comparado com todos os dispositivos testados
» 77% de todos os dispositivos testados foram melhores, 5% semelhantes, 18% piores
» O melhor teve um delta de 4%, a média foi 23%, o pior foi 134%
| desligado | |
| Ocioso | |
| Carga |
|
Key:
min: | |
| Schenker XMG Core 15 GK5CP6V i7-9750H, GeForce GTX 1660 Ti Mobile | Razer Blade 15 GTX 1660 Ti i7-9750H, GeForce GTX 1660 Ti Mobile | Asus ROG Zephyrus M15 GU502GU-XB74 i7-9750H, GeForce GTX 1660 Ti Mobile | Aorus 15-SA i7-9750H, GeForce GTX 1660 Ti Mobile | Lenovo Legion Y540-15IRH-81SX00B2GE i7-9750H, GeForce GTX 1660 Ti Mobile | Acer Predator Helios 300 PH315-52-79TY i7-9750H, GeForce GTX 1660 Ti Mobile | |
|---|---|---|---|---|---|---|
| Power Consumption | -67% | -77% | -47% | -24% | -45% | |
| Idle Minimum * (Watt) | 9 | 18.7 -108% | 17.6 -96% | 20 -122% | 14.5 -61% | 17.2 -91% |
| Idle Average * (Watt) | 12 | 30.7 -156% | 24.7 -106% | 23 -92% | 18.5 -54% | 22.6 -88% |
| Idle Maximum * (Watt) | 18 | 33.9 -88% | 56.3 -213% | 29 -61% | 20 -11% | 25.5 -42% |
| Load Average * (Watt) | 86 | 93.4 -9% | 111.1 -29% | 87 -1% | 81.6 5% | 88 -2% |
| Witcher 3 ultra * (Watt) | 126 | 158.9 -26% | 149 -18% | 136 -8% | 132 -5% | |
| Load Maximum * (Watt) | 173 | 195.3 -13% | 170 2% | 173 -0% | 208.1 -20% | 177 -2% |
* ... menor é melhor
| Schenker XMG Core 15 GK5CP6V i7-9750H, GeForce GTX 1660 Ti Mobile, 46 Wh | Razer Blade 15 GTX 1660 Ti i7-9750H, GeForce GTX 1660 Ti Mobile, 65 Wh | Asus ROG Zephyrus M15 GU502GU-XB74 i7-9750H, GeForce GTX 1660 Ti Mobile, 76 Wh | Aorus 15-SA i7-9750H, GeForce GTX 1660 Ti Mobile, 62 Wh | Lenovo Legion Y540-15IRH-81SX00B2GE i7-9750H, GeForce GTX 1660 Ti Mobile, 57 Wh | Acer Predator Helios 300 PH315-52-79TY i7-9750H, GeForce GTX 1660 Ti Mobile, 58.75 Wh | |
|---|---|---|---|---|---|---|
| Duração da bateria | 53% | 61% | 40% | 6% | 17% | |
| Reader / Idle (h) | 6.1 | 7.1 16% | 3.5 -43% | 4 -34% | 5 -18% | |
| WiFi v1.3 (h) | 3.6 | 5.5 53% | 4.5 25% | 2.8 -22% | 2.4 -33% | 3.5 -3% |
| Load (h) | 0.7 | 1.7 143% | 2 186% | 1.3 86% | 1.2 71% | |
| H.264 (h) | 2.8 | 3.4 |
Pro
Contra

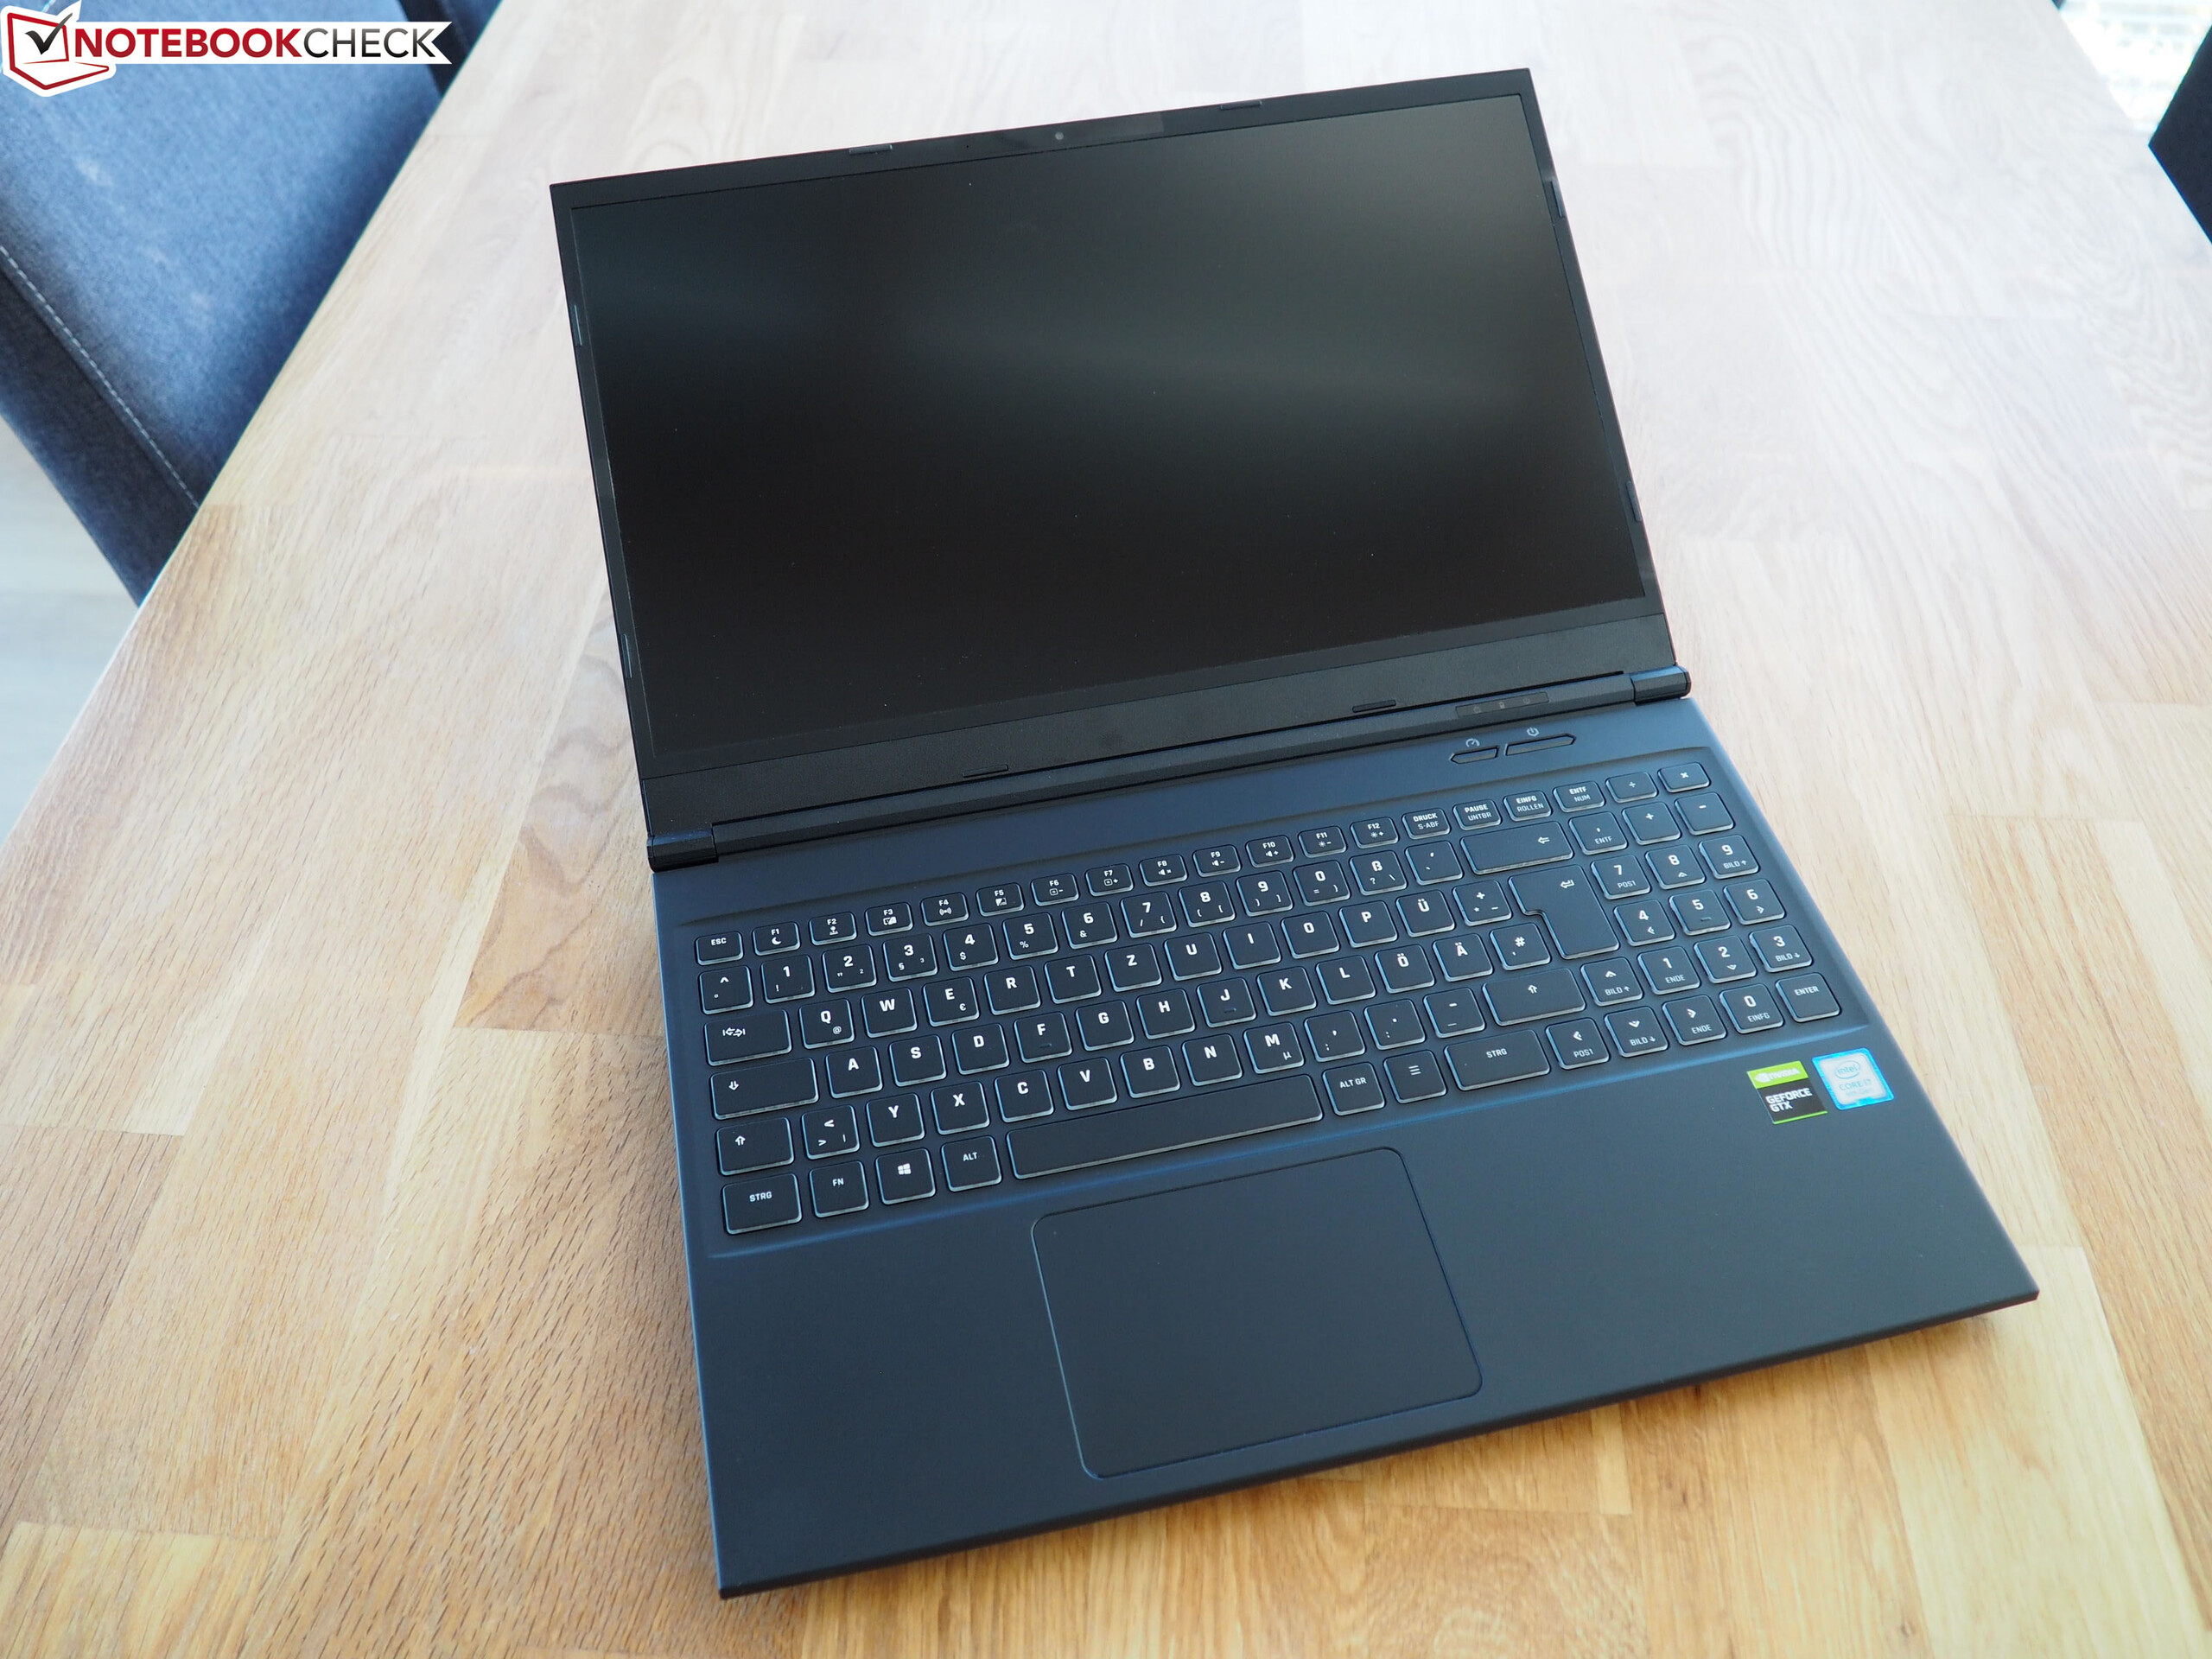
Em nosso teste, o XMG Core 15 provou ser uma alternativa real aos produtos de fabricantes maiores (Acer, Asus, Lenovo, etc.).
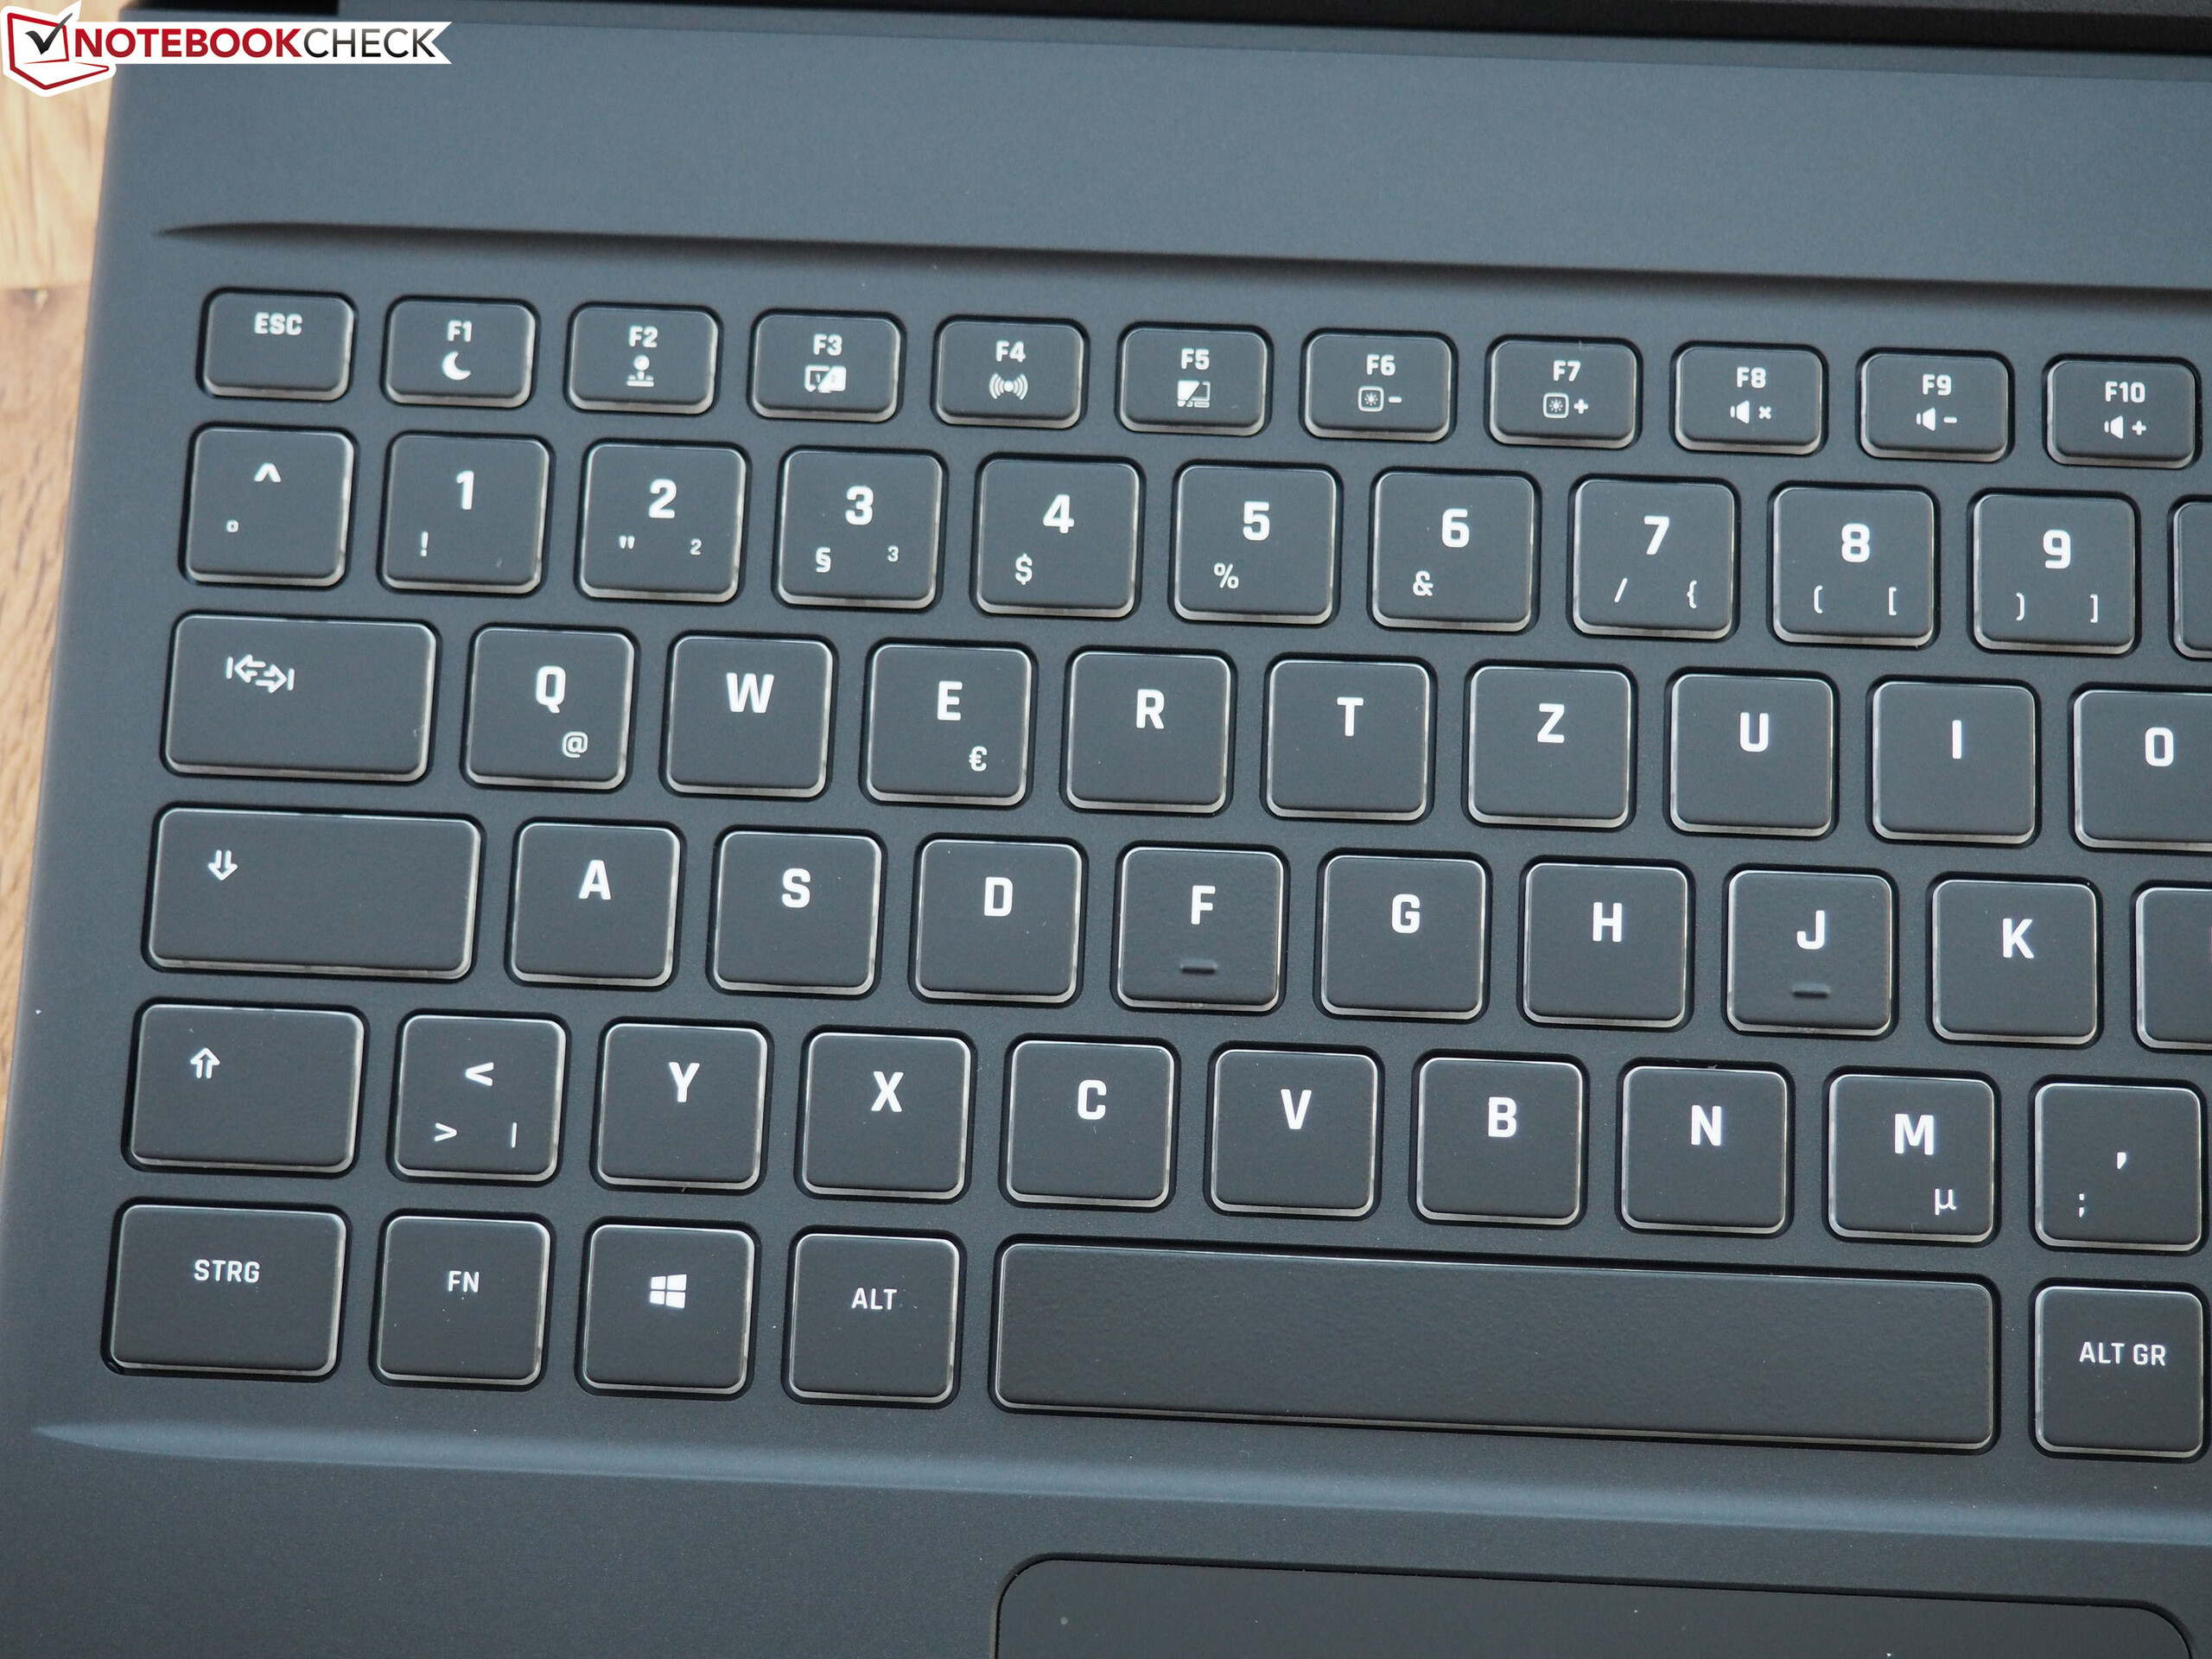
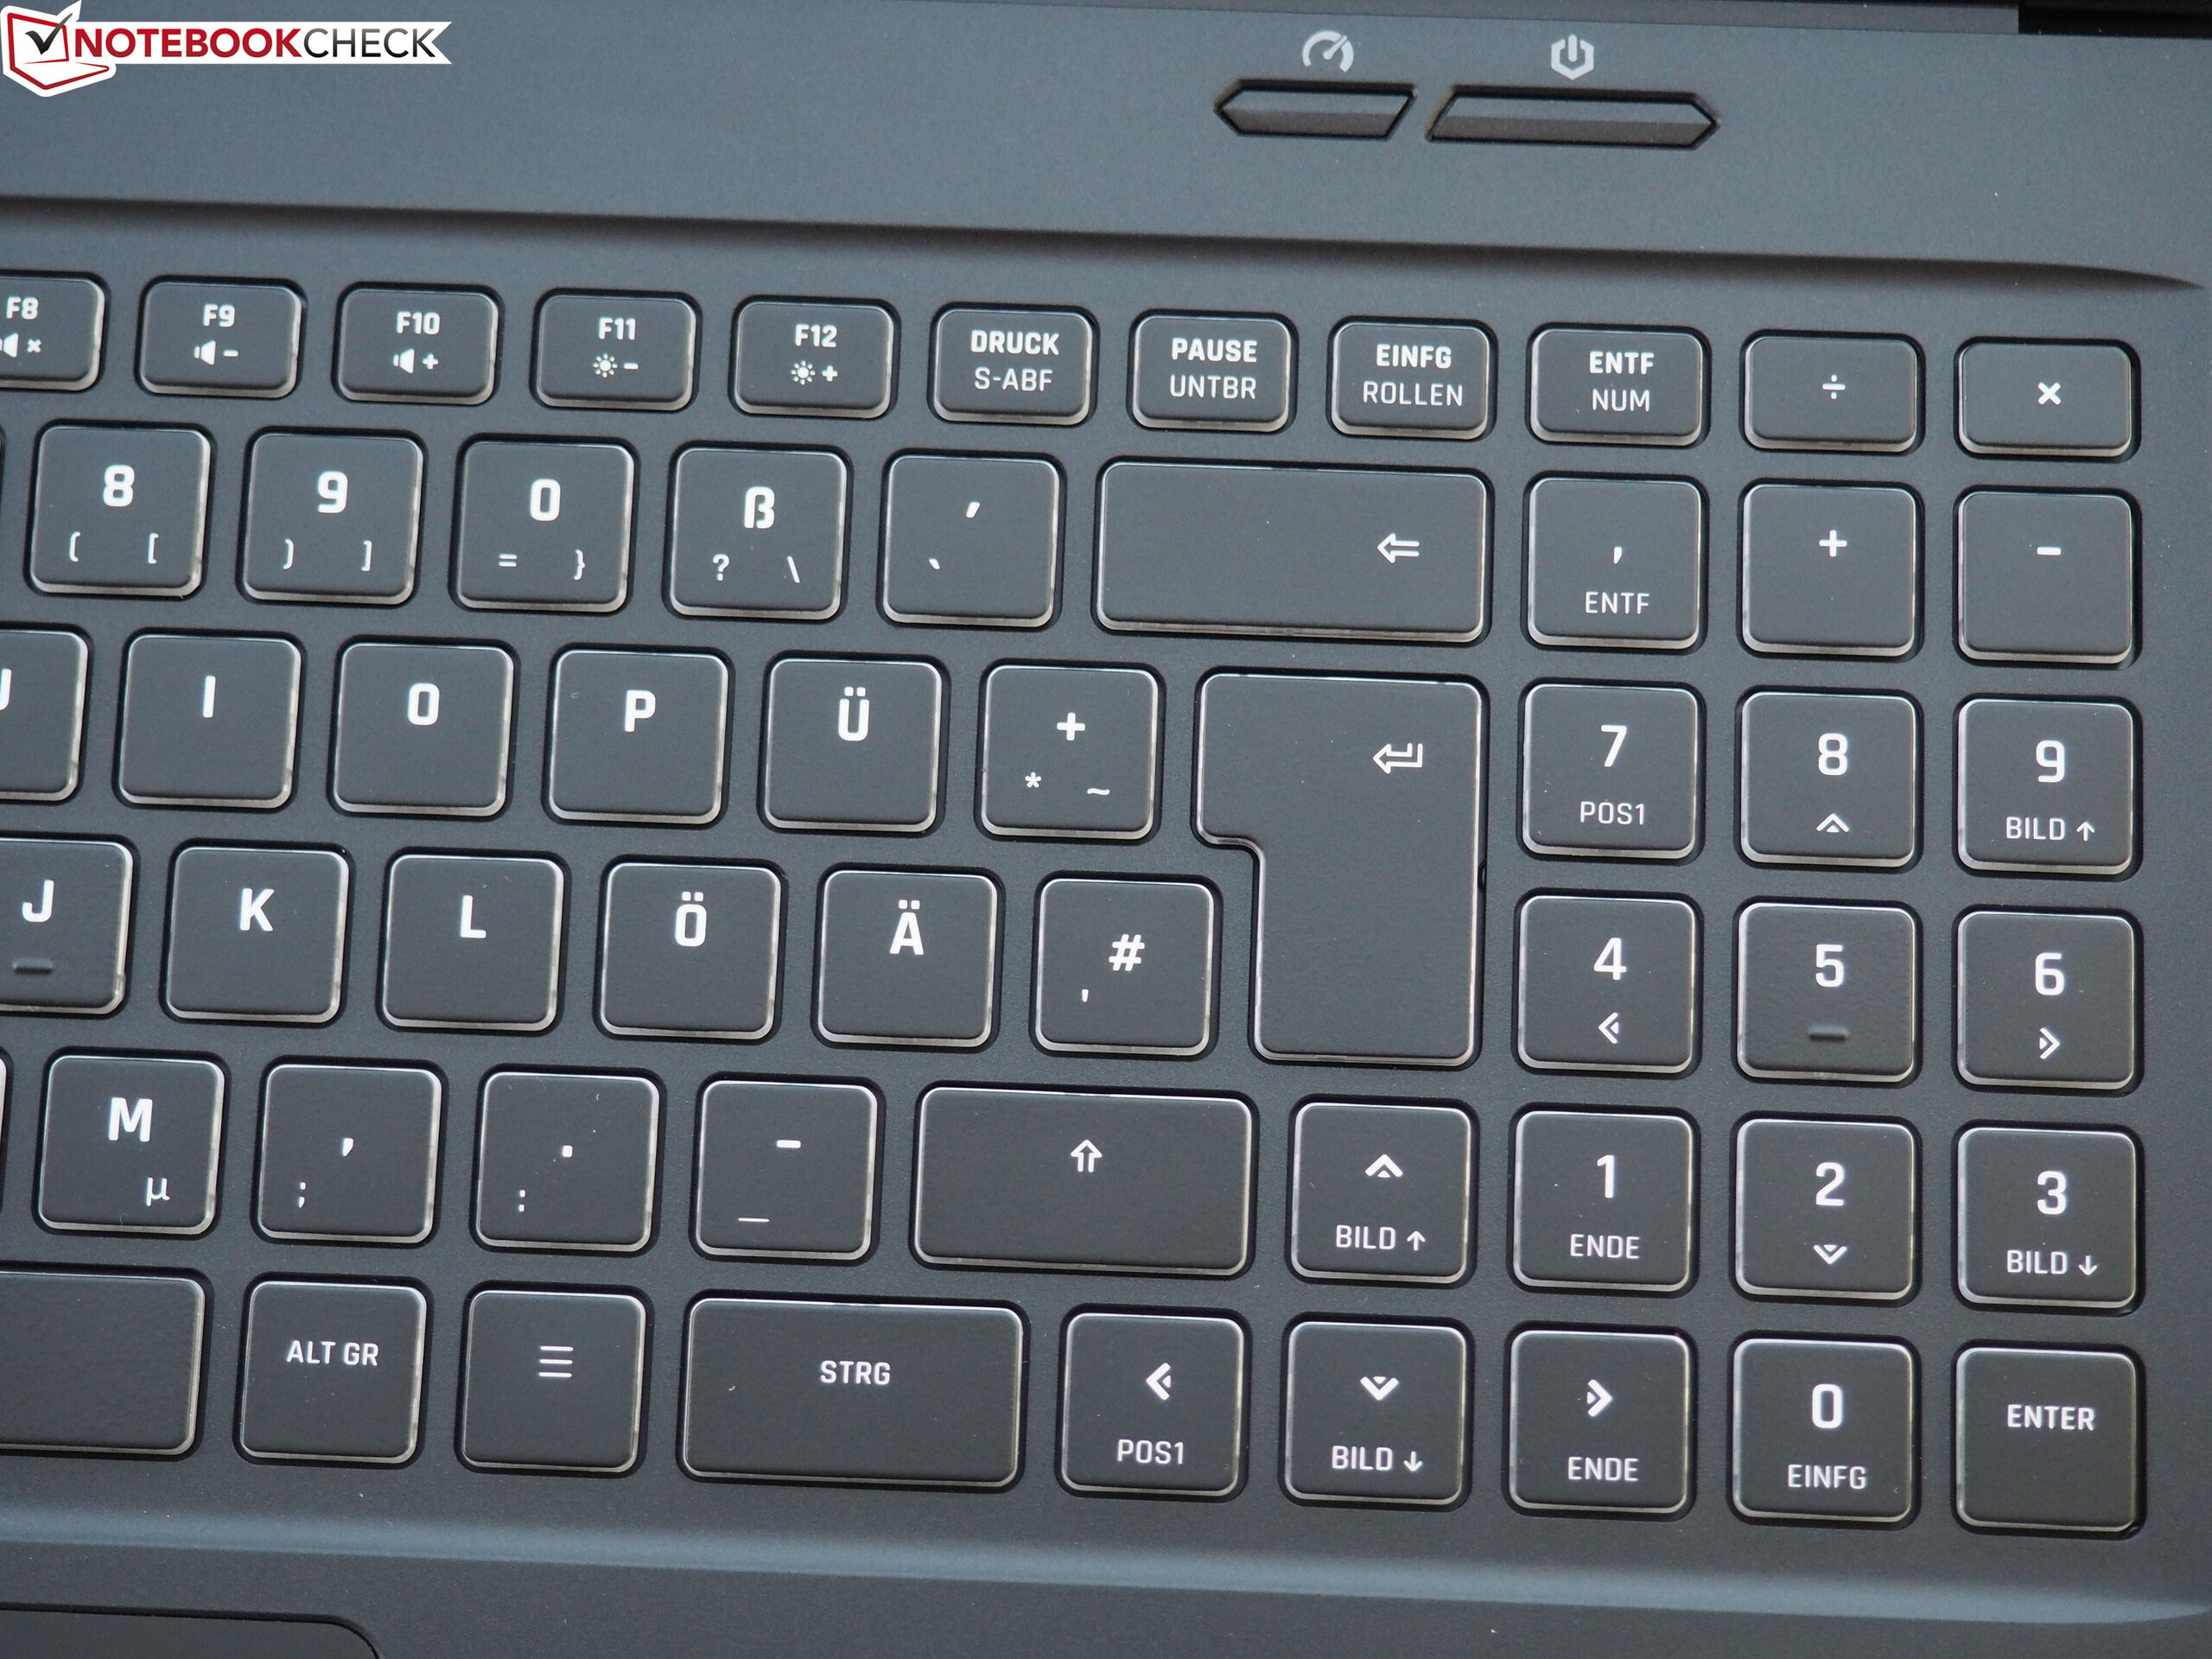
A um preço acessível, a Schenker Technologies oferece um portátil de 15 polegadas adequado para jogos que também oferece um painel IPS bom e responsivo. A iluminação RGB do teclado também agradará aos jogadores. Graças ao seu baixo peso e dimensões compactas, o Core 15 também é surpreendentemente móvel, se você desconsiderar a duração medíocre da bateria.
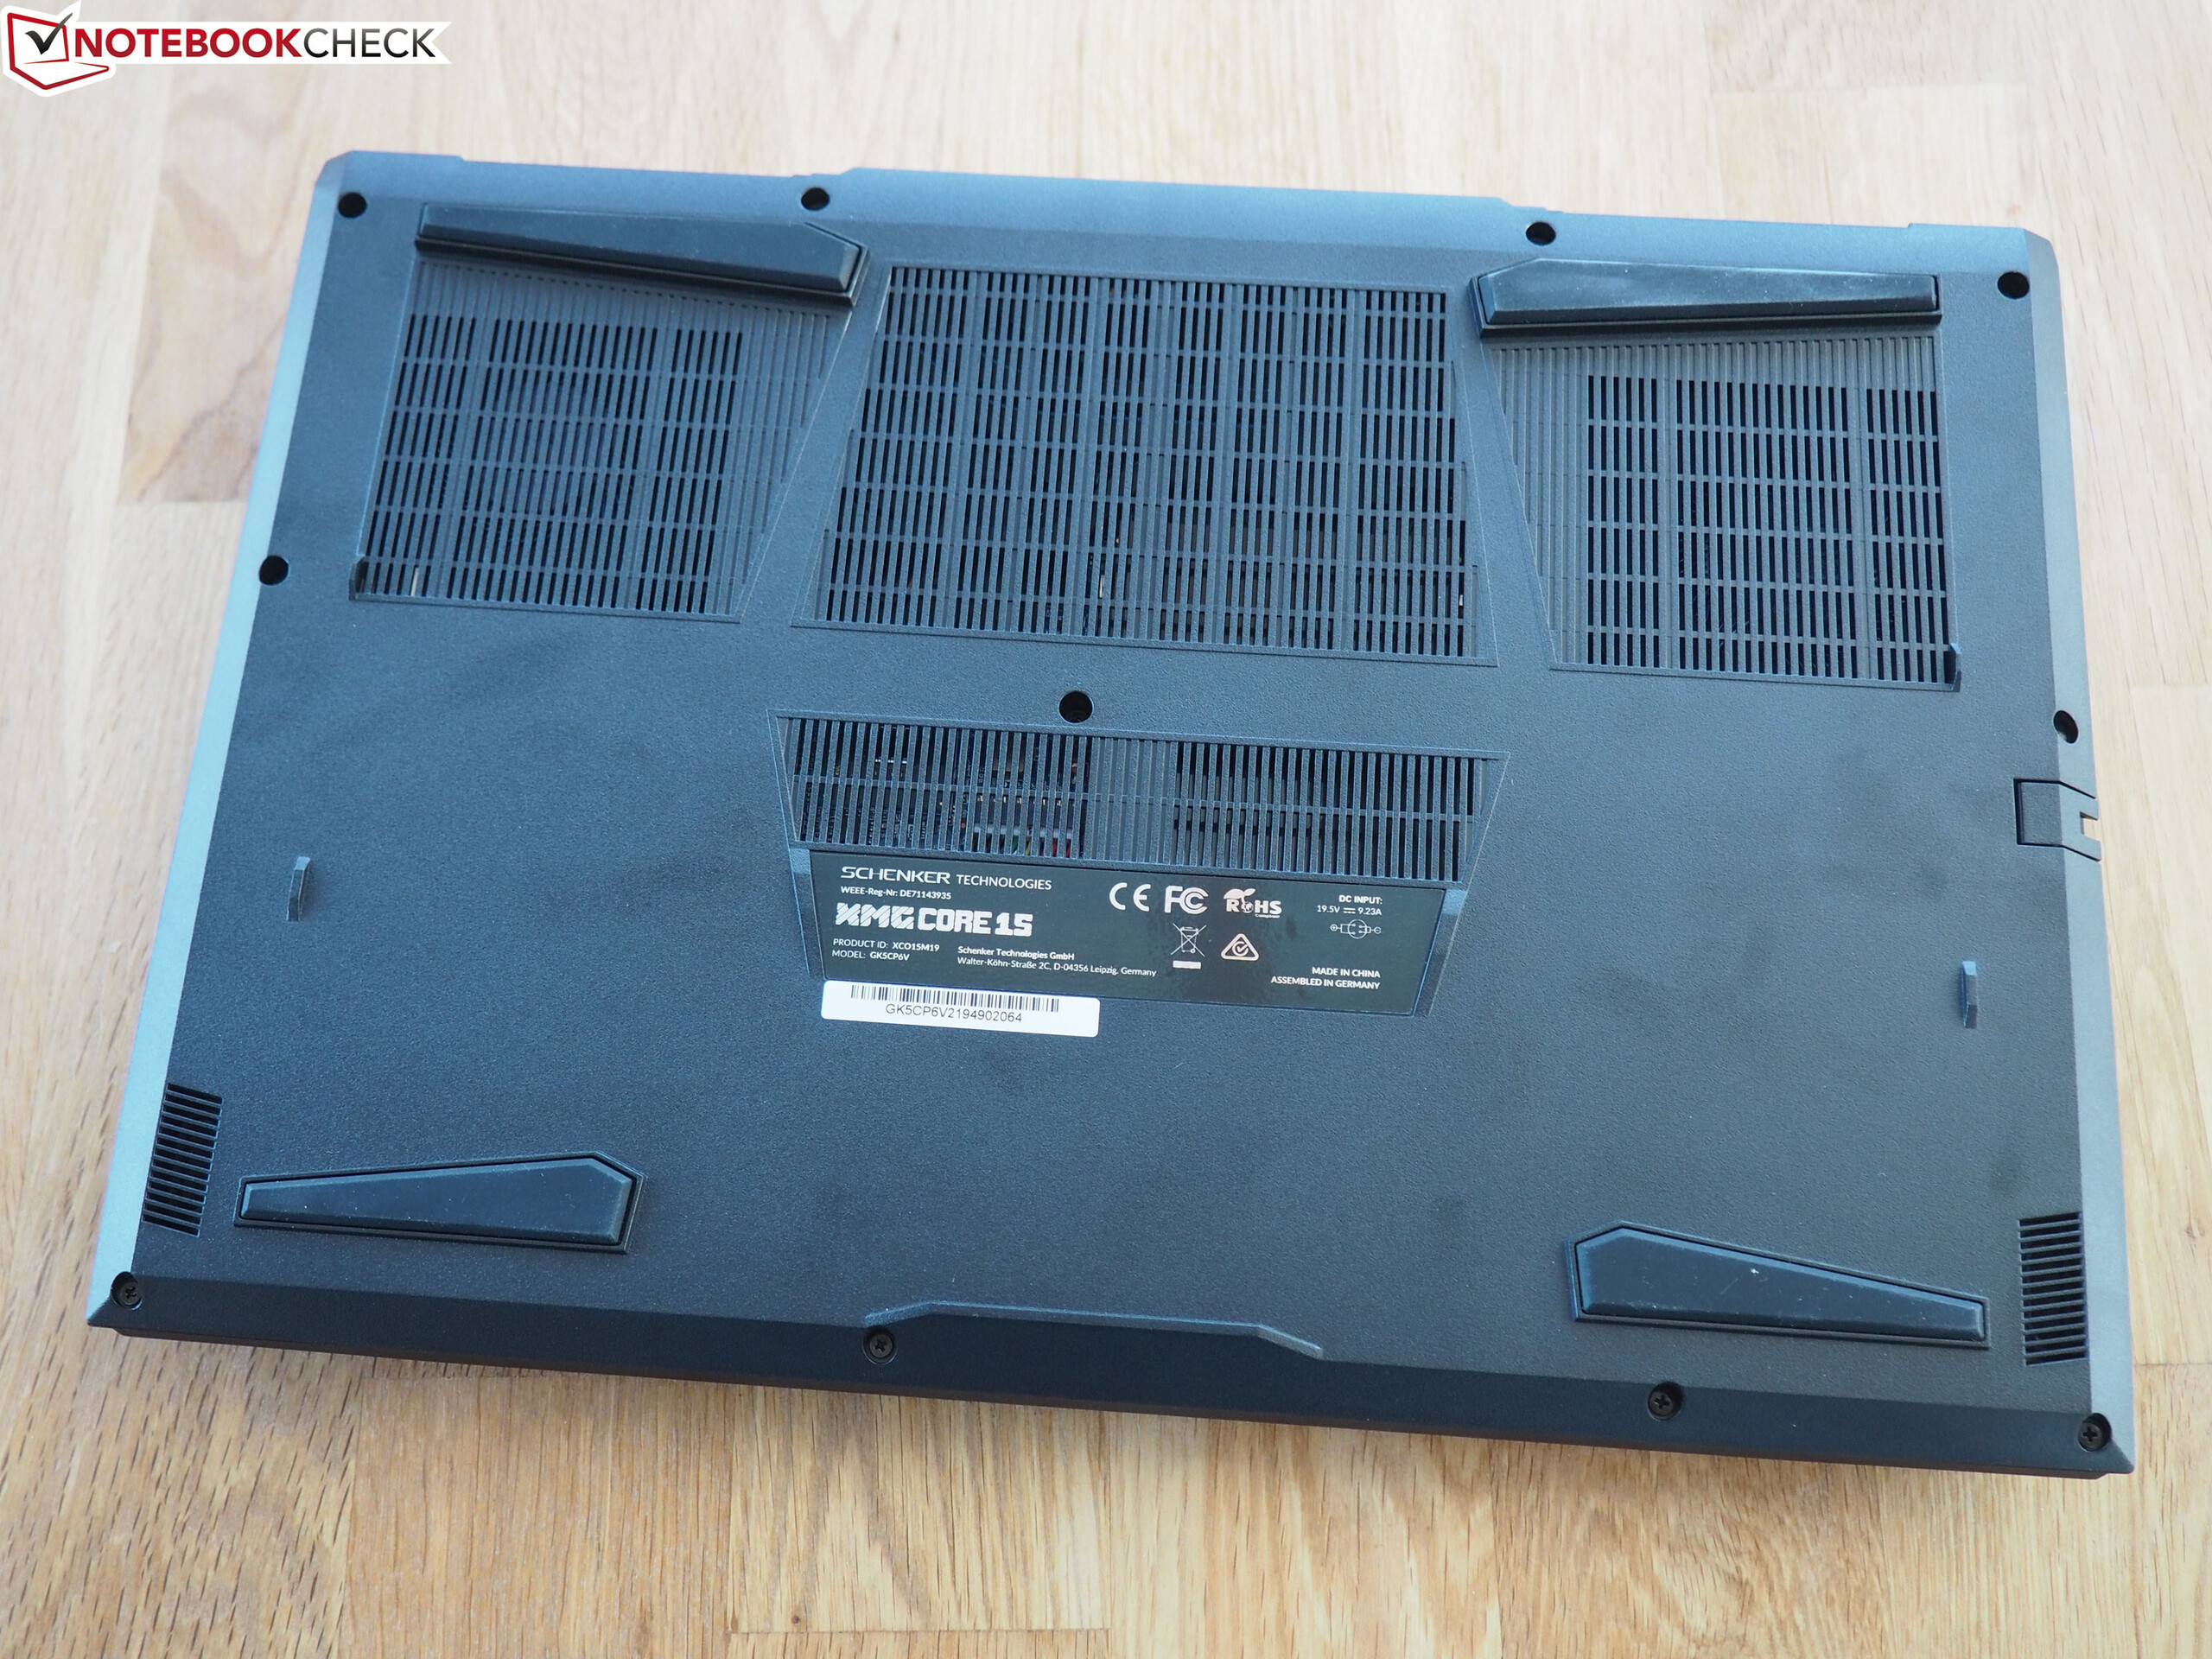
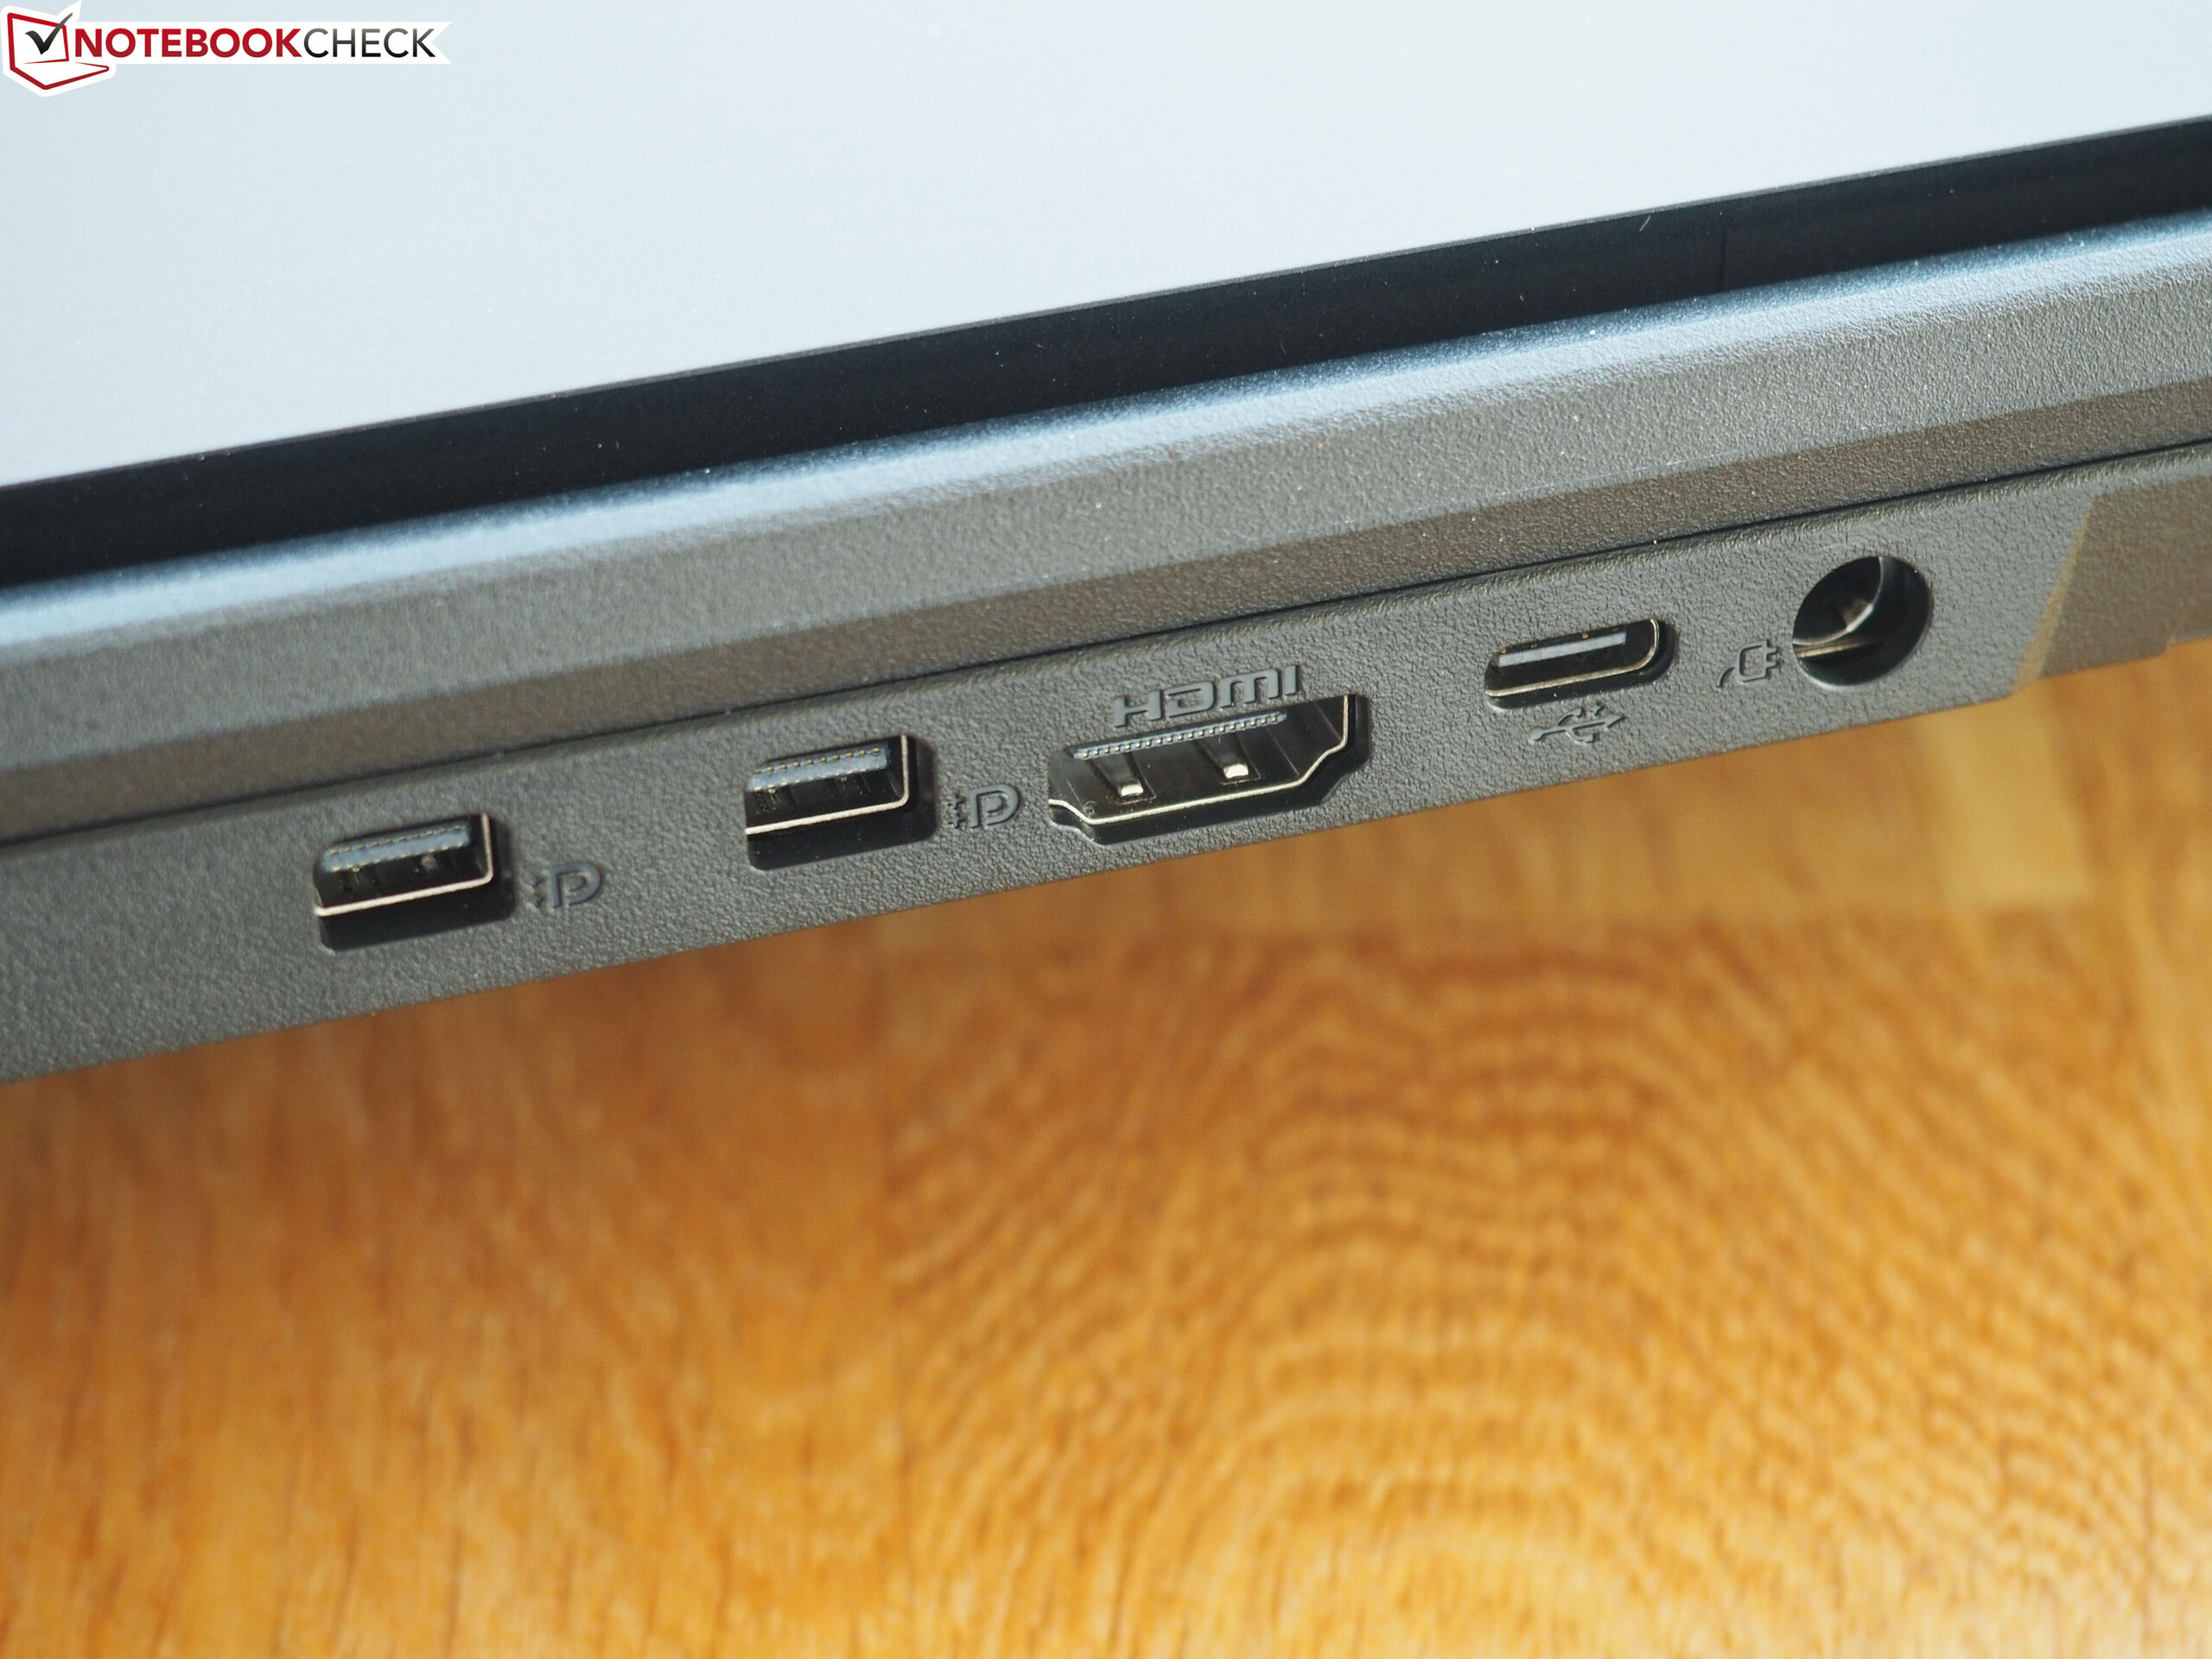
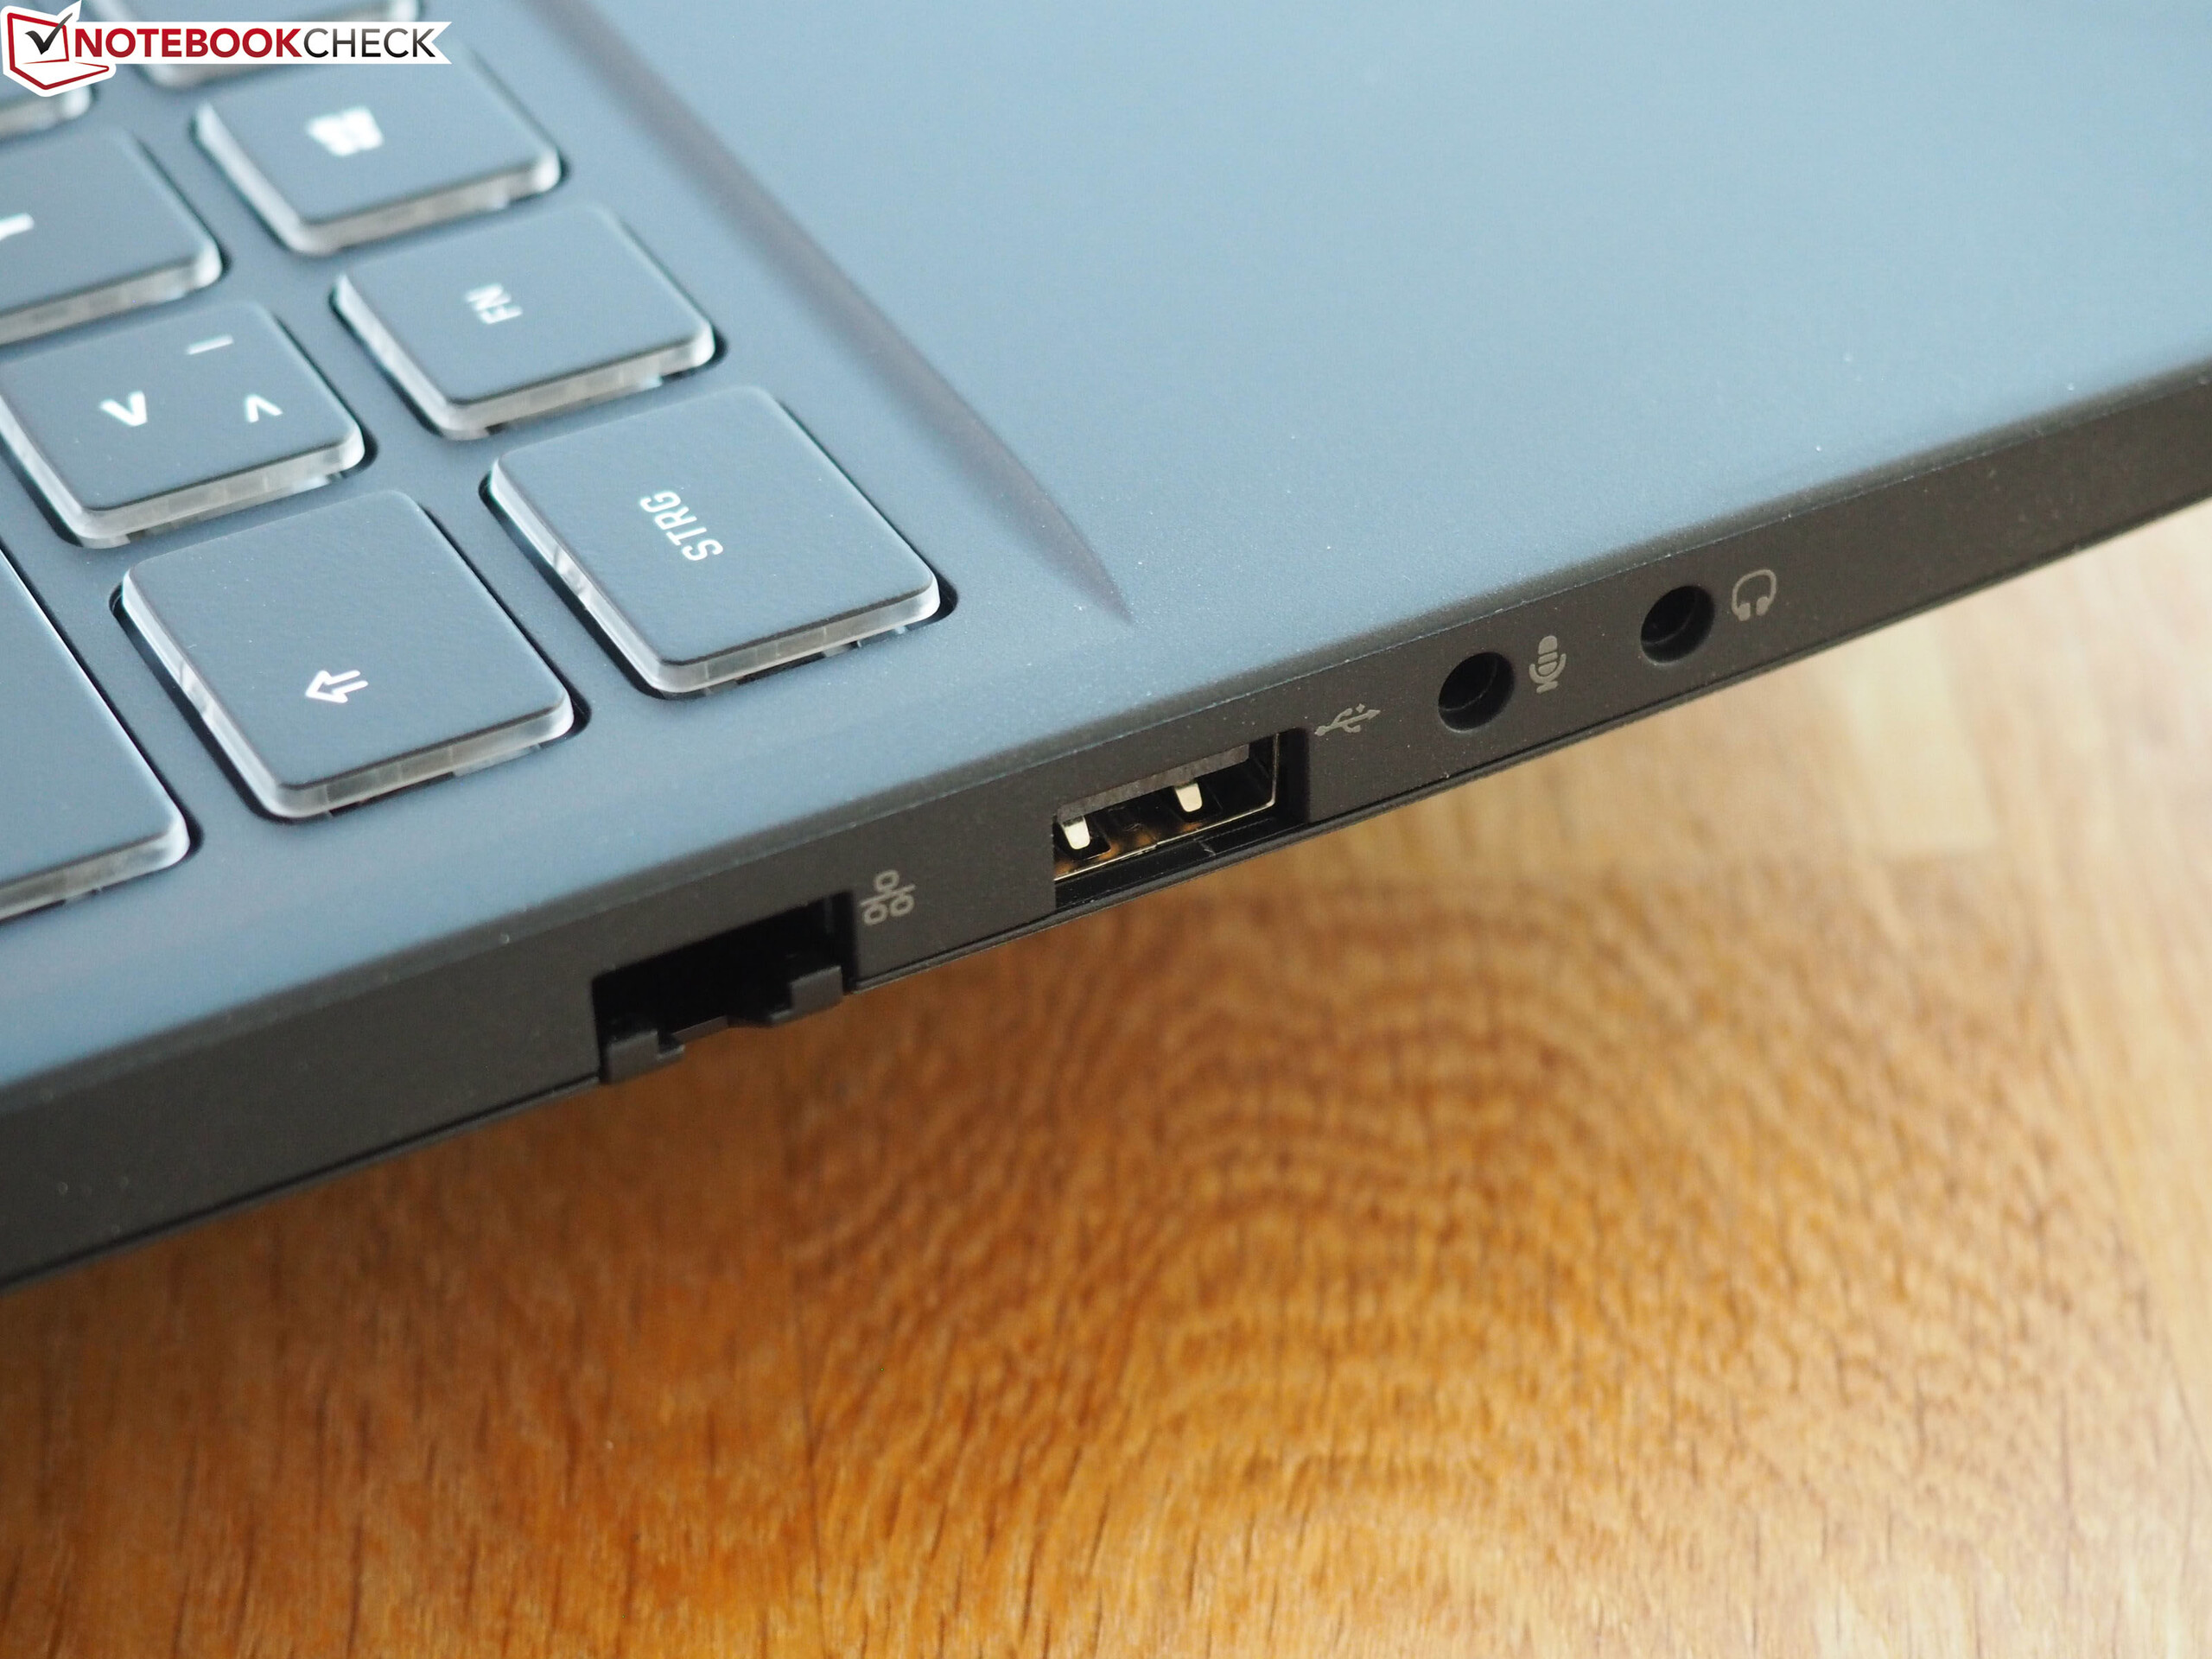
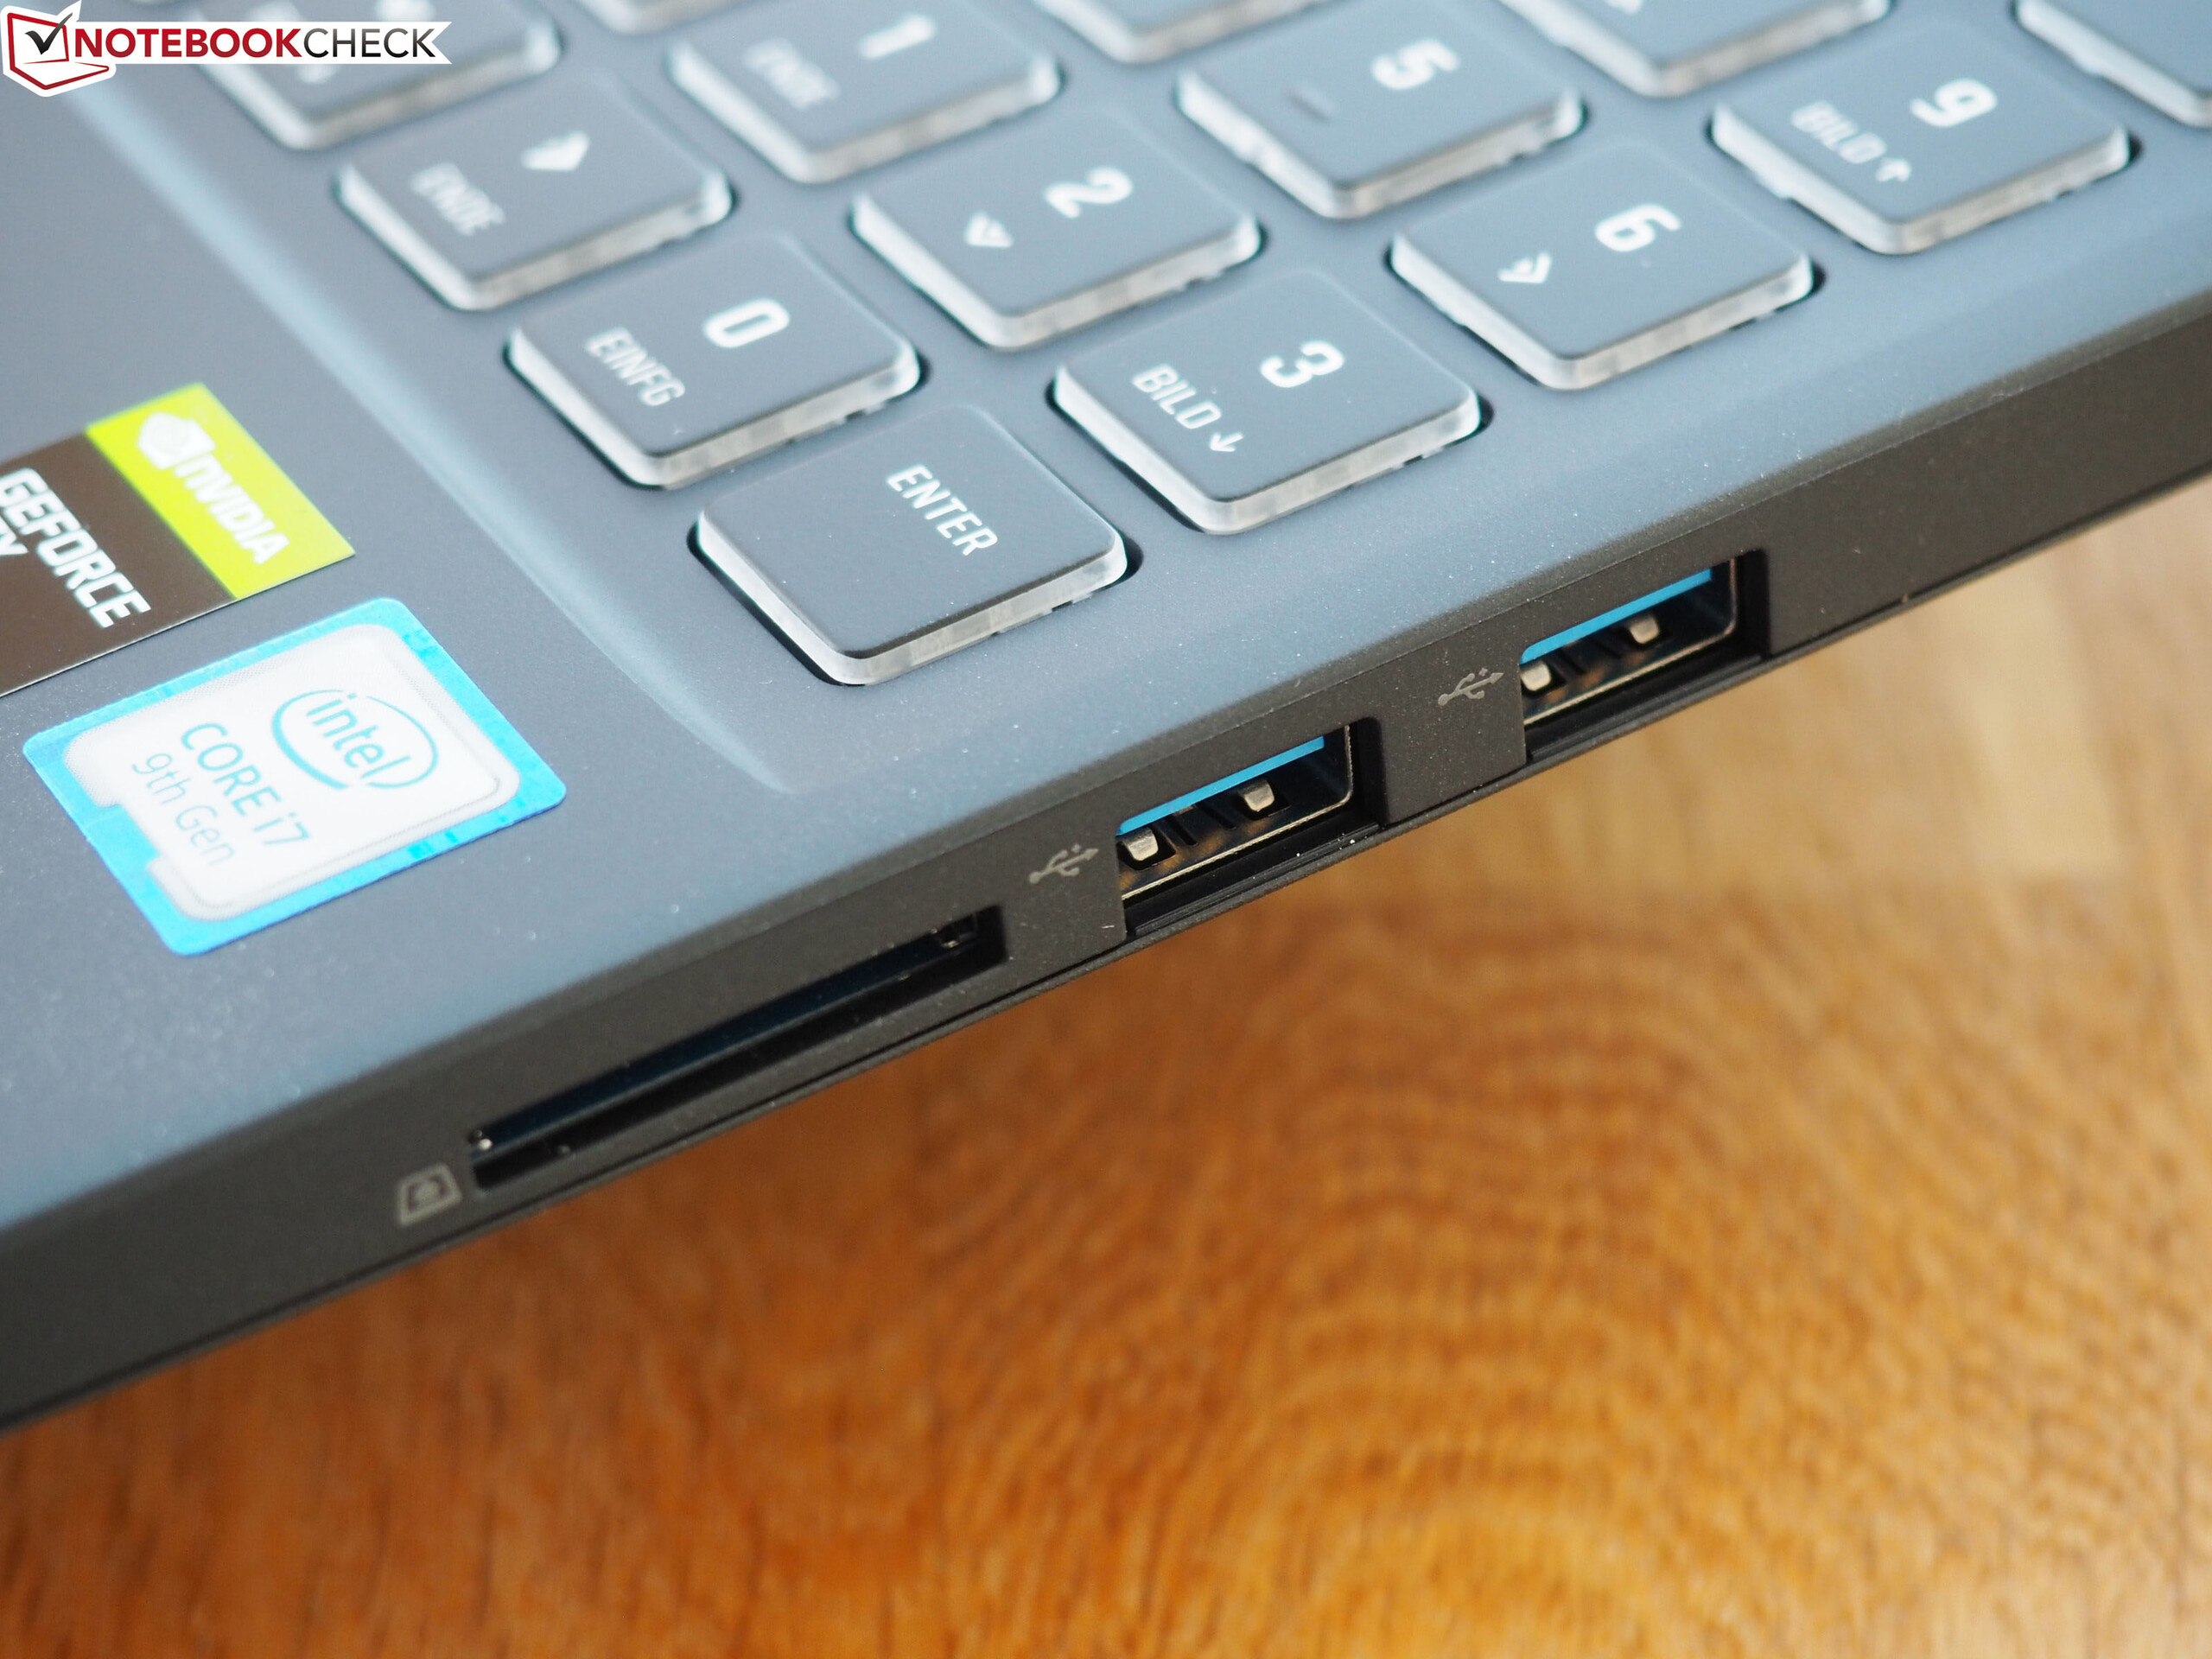
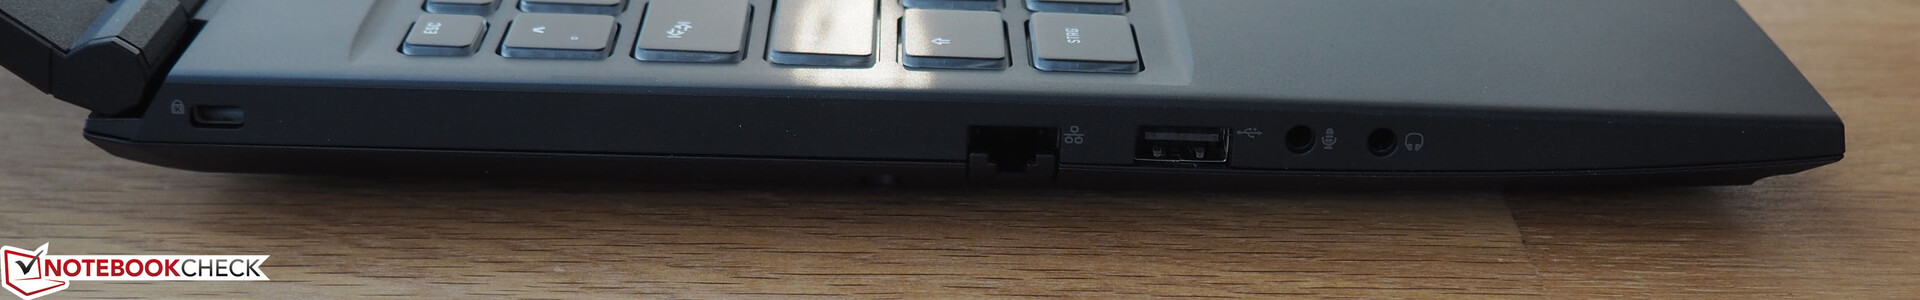
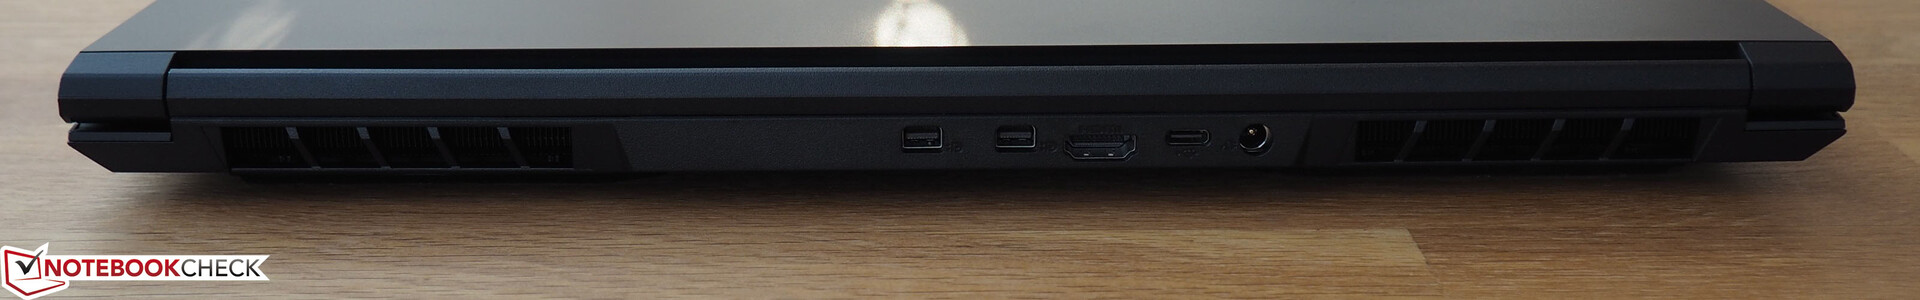
O produtor de Barebone, Tongfang, poderia fazer algumas melhorias no equipamento de conexões (já que não há Thunderbolt 3 nem USB-3.1 Gen2) e - como muitas vezes no segmento de jogos - o desenvolvimento de ruído sob uso intenso também poderia ganhar algumas melhorias.
Schenker XMG Core 15 GK5CP6V
- 02/09/2020 v7 (old)
Florian Glaser
Price comparison