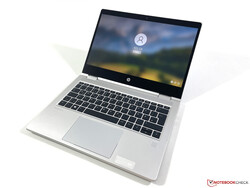
HP ProBook x360 435 G8 AMD em revisão - Entrada de negócios conversível com CPU Zen 3 Ryzen
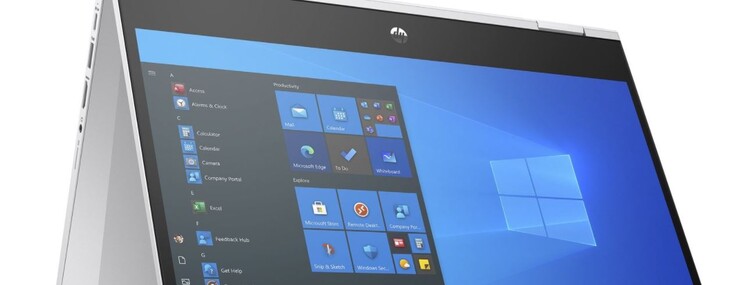
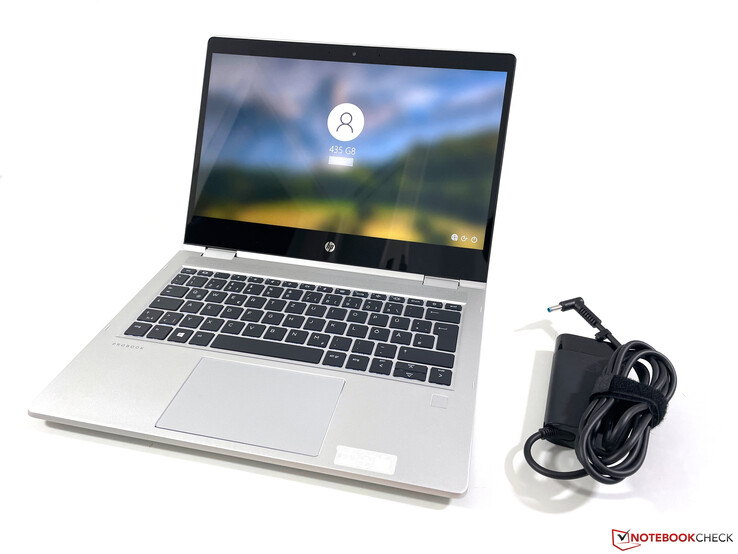
O ProBook x360 435 é um negócio básico conversível da HP que depende de processadores AMD (a contraparte Intel tem o sufixo 430). Agora em sua 8ª geração, é apenas uma atualização menor, porque nem o invólucro nem os portos mudaram. Entretanto, os novos processadores móveis Ryzen 5000 da AMD proporcionam um aumento significativo de desempenho que transforma o conversível compacto em uma verdadeira casa de força. Testamos o modelo 32N18EA#ABD por cerca de 1.100 Euros (~$1305), que está equipado com o rápido Ryzen 7 5800UA versão mais barata está disponível a partir de 880 euros (~$1044), 16 GB de RAM, um PCIe-SSD de 512 GB e a brilhante tela tátil de 1080p; as versões mais baratas estão disponíveis a partir de 880 euros (~$1044).
Possible competitors in comparison
Avaliação | Data | Modelo | Peso | Altura | Size | Resolução | Preço |
|---|---|---|---|---|---|---|---|
| 85.7 % v7 (old) | 08/2021 | HP ProBook x360 435 G8 R7-5800U R7 5800U, Vega 8 | 1.5 kg | 18 mm | 13.30" | 1920x1080 | |
| 88.3 % v7 (old) | 04/2021 | Lenovo ThinkPad L13 Yoga Gen2-20VK000VGE i5-1135G7, Iris Xe G7 80EUs | 1.5 kg | 17.6 mm | 13.30" | 1920x1080 | |
| 86.2 % v7 (old) | Fujitsu LifeBook U9310X i5-10210U, UHD Graphics 620 | 1 kg | 17 mm | 13.30" | 1920x1080 | ||
| 85.7 % v7 (old) | 06/2021 | Acer Spin 3 SP313-51N-56YV i5-1135G7, Iris Xe G7 80EUs | 1.4 kg | 16 mm | 13.30" | 2560x1600 |
Os Top 10
» Os Top 10 Portáteis Multimídia
» Os Top 10 Portáteis de Jogos
» Os Top 10 Portáteis Leves para Jogos
» Os Top 10 Portáteis Acessíveis de Escritório/Empresariais
» Os Top 10 Portáteis Premium de Escritório/Empresariais
» Os Top 10 dos Portáteis Workstation
» Os Top 10 Subportáteis
» Os Top 10 Ultrabooks
» Os Top 10 Conversíveis
» Os Top 10 Tablets
» Os Top 10 Smartphones
» A melhores Telas de Portáteis Analisadas Pela Notebookcheck
» Top 10 dos portáteis abaixo dos 500 Euros da Notebookcheck
» Top 10 dos Portáteis abaixo dos 300 Euros
Estojo e equipamento
Nada mudou no caso do alumínio. De fora, o dispositivo causa uma impressão de alta qualidade e não se vê nenhuma diferença para os EliteBooks mais caros da HP, à primeira vista. Isto também se aplica à estabilidade e ao acabamento, que são ambos excelentes. A unidade base não é afetada pela pressão e a tela, que é protegida por um painel de vidro adicional, dificilmente pode ser deformada. Somente a pressão por trás se torna rapidamente visível como ondulações no painel. Nesta categoria, o ProBook também tem uma clara vantagem sobre seu concorrente direto da Lenovo, a ThinkPad L13 Yoga G2.
As dobradiças também fazem um bom trabalho, mas você vê imediatamente as bordas muito largas da tela quando abre a tela, e é por isso que o dispositivo não parece particularmente moderno. Uma atualização do fator de forma 16:10 parece ser apenas uma questão de tempo.
A tampa inferior pode ser removida facilmente. A memória de trabalho e o SSD M.2-2280 estão sob uma tampa extra e o módulo WLAN também pode ser substituído.
Equipamento de conexão
Todas as portas estão disponíveis, incluindo conectores USB-C e USB-A normais. No entanto, você tem que fazer sem Thunderbolt ou um leitor SmartCard. O leitor microSD atinge uma velocidade média. Nossa amostra de revisão ainda foi enviada com um adaptador de energia antigo com uma ficha redonda, mas a fonte de alimentação também é possível via USB-C.
O módulo Wi-Fi é da Intel (AX200) e suporta o rápido padrão Wi-Fi 6. Em nosso teste padronizado com o roteador Netgear Nighthawk RAX120, o ProBook alcançou taxas de transferência muito boas.
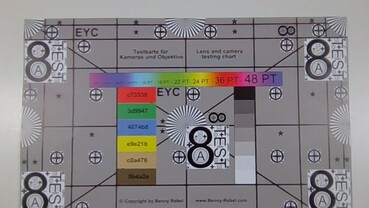
A HP instala uma webcam normal de 720p incluindo um obturador mecânico. A qualidade da imagem é muito fraca, mesmo em boas condições de iluminação. Serve seu propósito, mas você não deve esperar mais.
| SD Card Reader | |
| average JPG Copy Test (av. of 3 runs) | |
| Fujitsu LifeBook U9310X (Toshiba Exceria Pro SDXC 64 GB UHS-II) | |
| Lenovo ThinkPad L13 Yoga Gen2-20VK000VGE (AV PRO V60) | |
| HP ProBook x360 435 G7, Ryzen 5 4500U (Toshiba Exceria Pro M501 64 GB UHS-II) | |
| Média da turma Convertible (28.1 - 209, n=23, últimos 2 anos) | |
| HP ProBook x360 435 G8 R7-5800U (AV Pro UHS-II V60) | |
| Acer Spin 3 SP313-51N-56YV (AV PRO microSD 128 GB V60) | |
| maximum AS SSD Seq Read Test (1GB) | |
| Média da turma Convertible (28.9 - 253, n=22, últimos 2 anos) | |
| Fujitsu LifeBook U9310X (Toshiba Exceria Pro SDXC 64 GB UHS-II) | |
| HP ProBook x360 435 G8 R7-5800U (AV Pro UHS-II V60) | |
| HP ProBook x360 435 G7, Ryzen 5 4500U (Toshiba Exceria Pro M501 64 GB UHS-II) | |
| Lenovo ThinkPad L13 Yoga Gen2-20VK000VGE (AV PRO V60) | |
| Acer Spin 3 SP313-51N-56YV (AV PRO microSD 128 GB V60) | |
| Networking | |
| iperf3 transmit AX12 | |
| HP ProBook x360 435 G8 R7-5800U | |
| Lenovo ThinkPad L13 Yoga Gen2-20VK000VGE | |
| Média Intel Wi-Fi 6 AX200 (447 - 1645, n=127) | |
| HP ProBook x360 435 G7, Ryzen 5 4500U | |
| Acer Spin 3 SP313-51N-56YV | |
| Fujitsu LifeBook U9310X | |
| iperf3 receive AX12 | |
| Lenovo ThinkPad L13 Yoga Gen2-20VK000VGE | |
| HP ProBook x360 435 G8 R7-5800U | |
| Média Intel Wi-Fi 6 AX200 (523 - 1684, n=128) | |
| Fujitsu LifeBook U9310X | |
| Acer Spin 3 SP313-51N-56YV | |
| HP ProBook x360 435 G7, Ryzen 5 4500U | |
Dispositivos de entrada - Teclado repelente de água
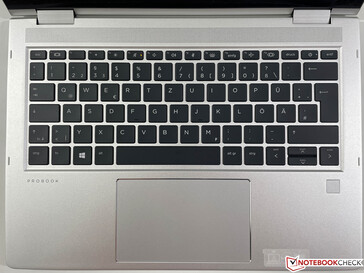
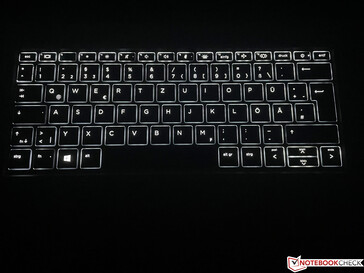
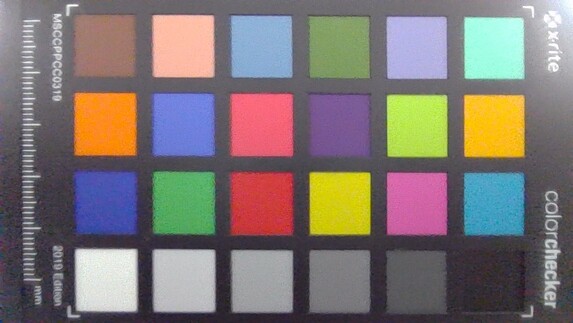
Não há mudanças nos dispositivos de entrada, o que não é um problema de forma alguma. As chaves oferecem viagens suficientes e feedback preciso. Mesmo textos longos podem ser digitados confortavelmente neste teclado. A luz de fundo branca de dois estágios é desativada por padrão após alguns segundos quando não se usa o teclado, mas esta configuração pode ser ajustada na BIOS
O ClickPad suporta o padrão Microsoft Precision e o controle normal do ponteiro funciona perfeitamente. O teclado pode ser pressionado na área inferior, que é reconhecida com um ruído bastante alto e abafado. Como é um conversível, há também, é claro, a tela capacitiva sensível ao toque. Também não podemos ver nenhuma restrição aqui.
Tela - Full HD 1080p espelhada touchscreen
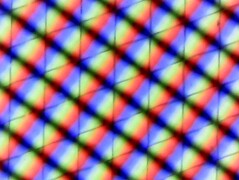
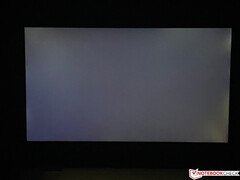
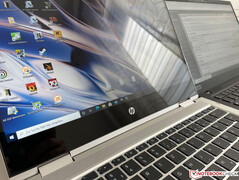
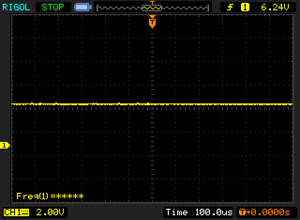
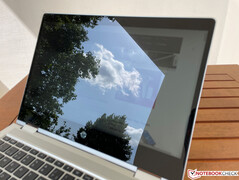
A HP oferece várias telas IPS. Nosso dispositivo de teste utiliza a pior variante nominalmente com um brilho de 250 cd/m². Nosso painel vem da AU Optronics e atinge uma luminosidade média de pelo menos 290 cd/m². Em princípio, a impressão subjetiva da imagem é decente, também graças à boa relação de contraste, mas a superfície de vidro extremamente reflexiva da tela tátil capacitiva já é um problema em ambientes internos. Ao ar livre, quase não se vê nada e dificilmente é possível trabalhar adequadamente. Não conseguimos determinar a tremulação da PWM, o sangramento da tela não é um grande problema no uso diário e a estabilidade do ângulo de visão também é boa, mas os reflexos são muitas vezes o maior obstáculo na prática.
| |||||||||||||||||||||||||
iluminação: 89 %
iluminação com acumulador: 304 cd/m²
Contraste: 1322:1 (Preto: 0.23 cd/m²)
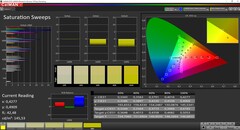
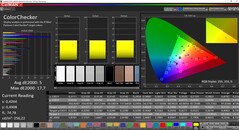
ΔE ColorChecker Calman: 5 | ∀{0.5-29.43 Ø4.77}
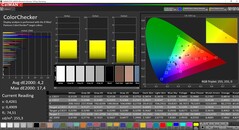
calibrated: 4.2
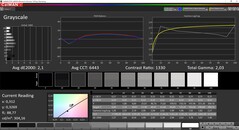
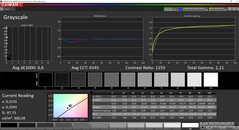
ΔE Greyscale Calman: 2.1 | ∀{0.09-98 Ø5}
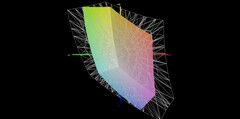
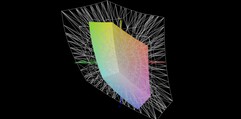
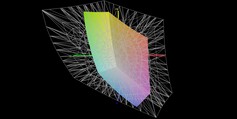
41.4% AdobeRGB 1998 (Argyll 3D)
59.9% sRGB (Argyll 3D)
40.1% Display P3 (Argyll 3D)
Gamma: 2.03
CCT: 6443 K
| HP ProBook x360 435 G8 R7-5800U AUO4B2D, IPS, 1920x1080, 13.3" | Lenovo ThinkPad L13 Yoga Gen2-20VK000VGE N133HCE-EP2, IPS, 1920x1080, 13.3" | Fujitsu LifeBook U9310X LQ133M1JW48, IPS, 1920x1080, 13.3" | Acer Spin 3 SP313-51N-56YV AU Optronics AUOB493, IPS, 2560x1600, 13.3" | HP ProBook x360 435 G7, Ryzen 5 4500U LGD0675, IPS LED, 1920x1080, 13.3" | |
|---|---|---|---|---|---|
| Display | 69% | 64% | 84% | 55% | |
| Display P3 Coverage (%) | 40.1 | 68.5 71% | 66.4 66% | 78.8 97% | 63.1 57% |
| sRGB Coverage (%) | 59.9 | 99.4 66% | 96.9 62% | 99.8 67% | 90.8 52% |
| AdobeRGB 1998 Coverage (%) | 41.4 | 70.7 71% | 67.4 63% | 77.6 87% | 64.5 56% |
| Response Times | -1% | -27% | -17% | -2% | |
| Response Time Grey 50% / Grey 80% * (ms) | 42.8 ? | 44.4 ? -4% | 62.4 ? -46% | 52 ? -21% | 45.6 ? -7% |
| Response Time Black / White * (ms) | 32 ? | 31.2 ? 2% | 34.4 ? -8% | 36 ? -13% | 30.8 ? 4% |
| PWM Frequency (Hz) | 25000 ? | 211.9 ? | |||
| Screen | 21% | 18% | -14% | 18% | |
| Brightness middle (cd/m²) | 304 | 316 4% | 345 13% | 338 11% | 354 16% |
| Brightness (cd/m²) | 292 | 299 2% | 317 9% | 307 5% | 344 18% |
| Brightness Distribution (%) | 89 | 92 3% | 86 -3% | 83 -7% | 83 -7% |
| Black Level * (cd/m²) | 0.23 | 0.25 -9% | 0.24 -4% | 0.27 -17% | 0.16 30% |
| Contrast (:1) | 1322 | 1264 -4% | 1438 9% | 1252 -5% | 2213 67% |
| Colorchecker dE 2000 * | 5 | 1.7 66% | 2.7 46% | 4.63 7% | 3.4 32% |
| Colorchecker dE 2000 max. * | 17.7 | 3.8 79% | 4.2 76% | 9.99 44% | 5.8 67% |
| Colorchecker dE 2000 calibrated * | 4.2 | 0.7 83% | 1 76% | 1.64 61% | 2 52% |
| Greyscale dE 2000 * | 2.1 | 2.8 -33% | 3.3 -57% | 6.76 -222% | 4.5 -114% |
| Gamma | 2.03 108% | 2.25 98% | 2.31 95% | 2.37 93% | 2.29 96% |
| CCT | 6443 101% | 6654 98% | 7188 90% | 5934 110% | 6046 108% |
| Color Space (Percent of AdobeRGB 1998) (%) | 64.5 | 62.4 | 68 | 59 | |
| Color Space (Percent of sRGB) (%) | 99.4 | 96.9 | 98 | 90.6 | |
| Média Total (Programa/Configurações) | 30% /
28% | 18% /
22% | 18% /
7% | 24% /
23% |
* ... menor é melhor
Exibir tempos de resposta
| ↔ Tempo de resposta preto para branco | ||
|---|---|---|
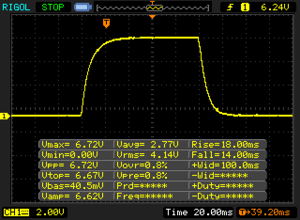
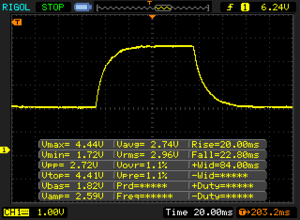
| 32 ms ... ascensão ↗ e queda ↘ combinadas | ↗ 18 ms ascensão | |
| ↘ 14 ms queda | ||
| A tela mostra taxas de resposta lentas em nossos testes e será insatisfatória para os jogadores. Em comparação, todos os dispositivos testados variam de 0.1 (mínimo) a 240 (máximo) ms. » 85 % de todos os dispositivos são melhores. Isso significa que o tempo de resposta medido é pior que a média de todos os dispositivos testados (20.2 ms). | ||
| ↔ Tempo de resposta 50% cinza a 80% cinza | ||
| 42.8 ms ... ascensão ↗ e queda ↘ combinadas | ↗ 20 ms ascensão | |
| ↘ 22.8 ms queda | ||
| A tela mostra taxas de resposta lentas em nossos testes e será insatisfatória para os jogadores. Em comparação, todos os dispositivos testados variam de 0.165 (mínimo) a 636 (máximo) ms. » 70 % de todos os dispositivos são melhores. Isso significa que o tempo de resposta medido é pior que a média de todos os dispositivos testados (31.5 ms). | ||
Cintilação da tela / PWM (modulação por largura de pulso)
| Tela tremeluzindo / PWM não detectado | |||
[pwm_comparison] Em comparação: 53 % de todos os dispositivos testados não usam PWM para escurecer a tela. Se PWM foi detectado, uma média de 8070 (mínimo: 5 - máximo: 343500) Hz foi medida. | |||
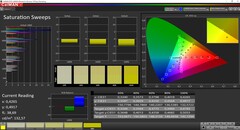
Não apenas em termos de brilho, mas também em termos de reprodução de cores e do espaço de cor exibível, o painel no dispositivo de teste é significativamente mais fraco do que nosso modelo anterior do ProBook x360 435 G7. Nossa análise com o software profissional CalMAN não mostra nenhum elenco de cores e a escala de cinza em particular já é convincente no ex-works. Entretanto, não podemos corrigir os altos desvios nas cores mesmo com nossa calibração (X-Rite i1 Pro 2); o painel simplesmente não pode representar as cores com mais precisão. O espaço de cor sRGB também só é coberto por pouco menos de 60%, portanto este painel não é adequado para edição de imagens/videos. Entretanto, não há restrições para aplicações de escritório bastante normais.
Desempenho - Mais potência do que muitas estações de trabalho
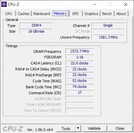
Além dos chips regulares Ryzen 5000 (Ryzen 3, 5 & 7), a HP também oferece o ProBook x360 435 G8 com as CPUs Ryzen Pro, que oferecem mais características de segurança (comparáveis às características vPro da Intel). Há dois slots para a memória de trabalho, mas apenas uma barra de 16 GB é instalada em nosso dispositivo de teste (canal único). Assim, se você quiser utilizar o máximo desempenho gráfico da iGPU, você tem que instalar outro módulo de RAM.
Processador - AMD Ryzen 7 5800U
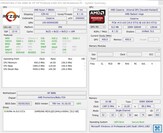
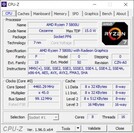
Com o Ryzen 7 5800U o descapotável compacto parece quase dominado. Com seus oito núcleos, o processador móvel da AMD compete até mesmo com estações de trabalho de crescimento completo com as CPUs Intel de 45 watts da 10ª geração. Somente implementações rápidas das CPUs da Intel Tiger Lake têm uma ligeira vantagem em aplicações single-core, mas a diferença é pequena e não perceptível no uso diário.
Cinebench R15 Multi Endurance test
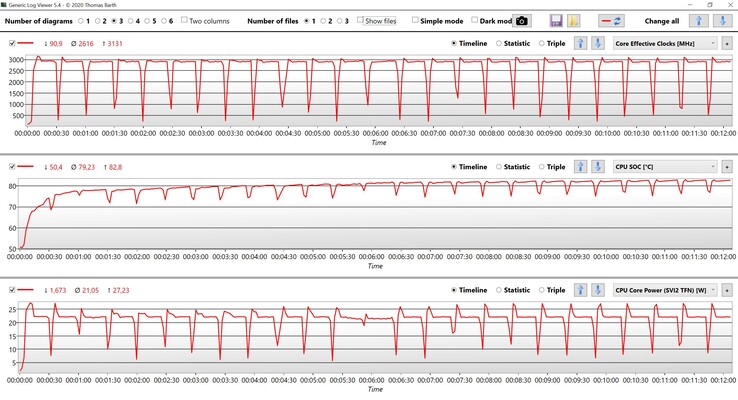
O desempenho também permanece bastante estável e a forte queda após os primeiros segundos, que é exibida nas CPUs Intel, não existe aqui. Entretanto, é preciso dizer que os limites de potência da HP são bastante conservadores (máximo 27 watts por alguns segundos, depois ~22 watts), razão pela qual o Ryzen 7 5800U poderia teoricamente ser ainda mais rápido. O desempenho não é reduzido no modo de bateria.
Cinebench R20: CPU (Single Core) | CPU (Multi Core)
Cinebench R15: CPU Single 64Bit | CPU Multi 64Bit
Blender: v2.79 BMW27 CPU
7-Zip 18.03: 7z b 4 -mmt1 | 7z b 4
Geekbench 5.5: Single-Core | Multi-Core
HWBOT x265 Benchmark v2.2: 4k Preset
LibreOffice : 20 Documents To PDF
R Benchmark 2.5: Overall mean
| Cinebench R23 / Single Core | |
| Média da turma Convertible (740 - 2163, n=57, últimos 2 anos) | |
| Lenovo ThinkPad X13 G2 20WK0024GE | |
| Média AMD Ryzen 7 5800U (1415 - 1430, n=5) | |
| HP ProBook x360 435 G8 R7-5800U | |
| Acer Spin 3 SP313-51N-56YV | |
| Lenovo ThinkPad L13 Yoga Gen2-20VK000VGE | |
| Cinebench R23 / Multi Core | |
| Média da turma Convertible (1317 - 29063, n=57, últimos 2 anos) | |
| HP ProBook x360 435 G8 R7-5800U | |
| Média AMD Ryzen 7 5800U (7872 - 10624, n=5) | |
| Lenovo ThinkPad X13 G2 20WK0024GE | |
| Acer Spin 3 SP313-51N-56YV | |
| Lenovo ThinkPad L13 Yoga Gen2-20VK000VGE | |
| Cinebench R20 / CPU (Single Core) | |
| Média da turma Convertible (273 - 827, n=57, últimos 2 anos) | |
| Lenovo ThinkPad X13 G2 20WK0024GE | |
| HP ProBook x360 435 G8 R7-5800U | |
| Média AMD Ryzen 7 5800U (551 - 560, n=5) | |
| Lenovo ThinkPad L13 Yoga Gen2-20VK000VGE | |
| Acer Spin 3 SP313-51N-56YV | |
| HP ProBook x360 435 G7, Ryzen 5 4500U | |
| Fujitsu LifeBook U9310X | |
| Cinebench R20 / CPU (Multi Core) | |
| Média da turma Convertible (595 - 11357, n=57, últimos 2 anos) | |
| HP ProBook x360 435 G8 R7-5800U | |
| Média AMD Ryzen 7 5800U (2995 - 3691, n=5) | |
| HP ProBook x360 435 G7, Ryzen 5 4500U | |
| Lenovo ThinkPad X13 G2 20WK0024GE | |
| Acer Spin 3 SP313-51N-56YV | |
| Lenovo ThinkPad L13 Yoga Gen2-20VK000VGE | |
| Fujitsu LifeBook U9310X | |
| Cinebench R15 / CPU Single 64Bit | |
| Média da turma Convertible (149.8 - 317, n=56, últimos 2 anos) | |
| HP ProBook x360 435 G8 R7-5800U | |
| Média AMD Ryzen 7 5800U (227 - 229, n=4) | |
| Lenovo ThinkPad X13 G2 20WK0024GE | |
| Acer Spin 3 SP313-51N-56YV | |
| Lenovo ThinkPad L13 Yoga Gen2-20VK000VGE | |
| HP ProBook x360 435 G7, Ryzen 5 4500U | |
| Fujitsu LifeBook U9310X | |
| Cinebench R15 / CPU Multi 64Bit | |
| Média da turma Convertible (478 - 4830, n=59, últimos 2 anos) | |
| Média AMD Ryzen 7 5800U (1390 - 1925, n=5) | |
| HP ProBook x360 435 G8 R7-5800U | |
| Lenovo ThinkPad X13 G2 20WK0024GE | |
| HP ProBook x360 435 G7, Ryzen 5 4500U | |
| Acer Spin 3 SP313-51N-56YV | |
| Lenovo ThinkPad L13 Yoga Gen2-20VK000VGE | |
| Fujitsu LifeBook U9310X | |
| Blender / v2.79 BMW27 CPU | |
| Fujitsu LifeBook U9310X | |
| Lenovo ThinkPad L13 Yoga Gen2-20VK000VGE | |
| Acer Spin 3 SP313-51N-56YV | |
| HP ProBook x360 435 G7, Ryzen 5 4500U | |
| Lenovo ThinkPad X13 G2 20WK0024GE | |
| Média AMD Ryzen 7 5800U (319 - 391, n=4) | |
| Média da turma Convertible (107 - 1051, n=55, últimos 2 anos) | |
| HP ProBook x360 435 G8 R7-5800U | |
| 7-Zip 18.03 / 7z b 4 -mmt1 | |
| HP ProBook x360 435 G8 R7-5800U | |
| Média AMD Ryzen 7 5800U (5285 - 5405, n=4) | |
| Lenovo ThinkPad X13 G2 20WK0024GE | |
| Média da turma Convertible (3672 - 6540, n=56, últimos 2 anos) | |
| Lenovo ThinkPad L13 Yoga Gen2-20VK000VGE | |
| Acer Spin 3 SP313-51N-56YV | |
| HP ProBook x360 435 G7, Ryzen 5 4500U | |
| Fujitsu LifeBook U9310X | |
| 7-Zip 18.03 / 7z b 4 | |
| HP ProBook x360 435 G8 R7-5800U | |
| Média da turma Convertible (12977 - 121368, n=56, últimos 2 anos) | |
| Média AMD Ryzen 7 5800U (39618 - 45985, n=4) | |
| Lenovo ThinkPad X13 G2 20WK0024GE | |
| HP ProBook x360 435 G7, Ryzen 5 4500U | |
| Acer Spin 3 SP313-51N-56YV | |
| Lenovo ThinkPad L13 Yoga Gen2-20VK000VGE | |
| Fujitsu LifeBook U9310X | |
| Geekbench 5.5 / Single-Core | |
| Média da turma Convertible (806 - 2275, n=56, últimos 2 anos) | |
| Lenovo ThinkPad X13 G2 20WK0024GE | |
| Média AMD Ryzen 7 5800U (1411 - 1450, n=4) | |
| HP ProBook x360 435 G8 R7-5800U | |
| Lenovo ThinkPad L13 Yoga Gen2-20VK000VGE | |
| Acer Spin 3 SP313-51N-56YV | |
| HP ProBook x360 435 G7, Ryzen 5 4500U | |
| Fujitsu LifeBook U9310X | |
| Geekbench 5.5 / Multi-Core | |
| Média da turma Convertible (1608 - 22023, n=56, últimos 2 anos) | |
| Média AMD Ryzen 7 5800U (6093 - 7026, n=4) | |
| HP ProBook x360 435 G8 R7-5800U | |
| Lenovo ThinkPad X13 G2 20WK0024GE | |
| Acer Spin 3 SP313-51N-56YV | |
| Lenovo ThinkPad L13 Yoga Gen2-20VK000VGE | |
| HP ProBook x360 435 G7, Ryzen 5 4500U | |
| Fujitsu LifeBook U9310X | |
| HWBOT x265 Benchmark v2.2 / 4k Preset | |
| Média da turma Convertible (3.43 - 36.2, n=56, últimos 2 anos) | |
| HP ProBook x360 435 G8 R7-5800U | |
| Média AMD Ryzen 7 5800U (9.68 - 11, n=4) | |
| Lenovo ThinkPad X13 G2 20WK0024GE | |
| HP ProBook x360 435 G7, Ryzen 5 4500U | |
| Acer Spin 3 SP313-51N-56YV | |
| Lenovo ThinkPad L13 Yoga Gen2-20VK000VGE | |
| Fujitsu LifeBook U9310X | |
| LibreOffice / 20 Documents To PDF | |
| HP ProBook x360 435 G7, Ryzen 5 4500U | |
| HP ProBook x360 435 G8 R7-5800U | |
| Lenovo ThinkPad L13 Yoga Gen2-20VK000VGE | |
| Média AMD Ryzen 7 5800U (50.9 - 60.2, n=4) | |
| Fujitsu LifeBook U9310X | |
| Média da turma Convertible (42.5 - 84.3, n=55, últimos 2 anos) | |
| Acer Spin 3 SP313-51N-56YV | |
| Lenovo ThinkPad X13 G2 20WK0024GE | |
| R Benchmark 2.5 / Overall mean | |
| Fujitsu LifeBook U9310X | |
| HP ProBook x360 435 G7, Ryzen 5 4500U | |
| Acer Spin 3 SP313-51N-56YV | |
| Lenovo ThinkPad L13 Yoga Gen2-20VK000VGE | |
| Lenovo ThinkPad X13 G2 20WK0024GE | |
| Média AMD Ryzen 7 5800U (0.54 - 0.546, n=4) | |
| HP ProBook x360 435 G8 R7-5800U | |
| Média da turma Convertible (0.3985 - 0.84, n=55, últimos 2 anos) | |
* ... menor é melhor
Desempenho do sistema
O desempenho do sistema é muito bom e os resultados de referência também estão muitas vezes à frente dos rivais. No entanto, todos os laptops modernos são muito ágeis no uso diário e quase não se nota uma diferença. Nosso dispositivo de teste teve alguns problemas com o modo standby (palavra-chave: Modern Standby) e muitas vezes ainda estava ativo (assim como o ventilador) quando fechamos a tampa, por exemplo. É claro que isto não restringe o uso, mas ainda assim deve ser notado.
| PCMark 10 / Score | |
| Média da turma Convertible (3229 - 9125, n=53, últimos 2 anos) | |
| Média AMD Ryzen 7 5800U, AMD Radeon RX Vega 8 (Ryzen 4000/5000) (5334 - 6090, n=4) | |
| HP ProBook x360 435 G8 R7-5800U | |
| Acer Spin 3 SP313-51N-56YV | |
| Lenovo ThinkPad L13 Yoga Gen2-20VK000VGE | |
| HP ProBook x360 435 G7, Ryzen 5 4500U | |
| Fujitsu LifeBook U9310X | |
| PCMark 10 / Essentials | |
| Média da turma Convertible (7233 - 12222, n=53, últimos 2 anos) | |
| Média AMD Ryzen 7 5800U, AMD Radeon RX Vega 8 (Ryzen 4000/5000) (9476 - 10182, n=4) | |
| Lenovo ThinkPad L13 Yoga Gen2-20VK000VGE | |
| Acer Spin 3 SP313-51N-56YV | |
| HP ProBook x360 435 G8 R7-5800U | |
| Fujitsu LifeBook U9310X | |
| HP ProBook x360 435 G7, Ryzen 5 4500U | |
| PCMark 10 / Productivity | |
| Média AMD Ryzen 7 5800U, AMD Radeon RX Vega 8 (Ryzen 4000/5000) (8336 - 9657, n=4) | |
| Média da turma Convertible (5062 - 10643, n=53, últimos 2 anos) | |
| HP ProBook x360 435 G8 R7-5800U | |
| Fujitsu LifeBook U9310X | |
| HP ProBook x360 435 G7, Ryzen 5 4500U | |
| Acer Spin 3 SP313-51N-56YV | |
| Lenovo ThinkPad L13 Yoga Gen2-20VK000VGE | |
| PCMark 10 / Digital Content Creation | |
| Média da turma Convertible (2496 - 16551, n=53, últimos 2 anos) | |
| Média AMD Ryzen 7 5800U, AMD Radeon RX Vega 8 (Ryzen 4000/5000) (5214 - 6235, n=4) | |
| HP ProBook x360 435 G8 R7-5800U | |
| Acer Spin 3 SP313-51N-56YV | |
| Lenovo ThinkPad L13 Yoga Gen2-20VK000VGE | |
| HP ProBook x360 435 G7, Ryzen 5 4500U | |
| Fujitsu LifeBook U9310X | |
| PCMark 10 Score | 5334 pontos | |
Ajuda | ||
Latências DPC
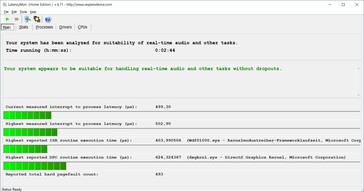
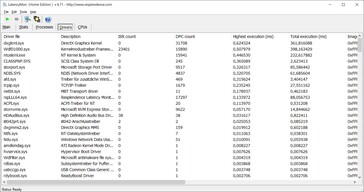
| DPC Latencies / LatencyMon - interrupt to process latency (max), Web, Youtube, Prime95 | |
| HP ProBook x360 435 G7, Ryzen 5 4500U | |
| Fujitsu LifeBook U9310X | |
| Acer Spin 3 SP313-51N-56YV | |
| Lenovo ThinkPad L13 Yoga Gen2-20VK000VGE | |
| HP ProBook x360 435 G8 R7-5800U | |
* ... menor é melhor
Armazenamento em massa
O SSD M.2-2280 é conectado via PCIe-3.0-x4 e um drive Samsung (PM991) com uma capacidade de armazenamento de 512 GB é usado em nosso dispositivo de teste, dos quais 425 GB ainda estão disponíveis para o usuário após a primeira partida. As taxas de transferência são boas e não há restrições no uso diário no escritório, mas também há unidades mais rápidas no mercado. Mais referências SSD estão disponíveis aqui.
| HP ProBook x360 435 G8 R7-5800U Samsung PM991 MZVLQ512HALU | Lenovo ThinkPad L13 Yoga Gen2-20VK000VGE WDC PC SN730 SDBPNTY-256G | Fujitsu LifeBook U9310X Toshiba KBG40ZNS512G NVMe | Acer Spin 3 SP313-51N-56YV Kingston OM8PCP3512F-AB | HP ProBook x360 435 G7, Ryzen 5 4500U WDC PC SN520 SDAPNUW-512G | Média Samsung PM991 MZVLQ512HALU | Média da turma Convertible | |
|---|---|---|---|---|---|---|---|
| CrystalDiskMark 5.2 / 6 | 33% | 21% | 32% | 8% | 17% | 97% | |
| Write 4K (MB/s) | 86.7 | 119.7 38% | 134.2 55% | 286.1 230% | 94.1 9% | 131.8 ? 52% | 136.8 ? 58% |
| Read 4K (MB/s) | 32.45 | 38.54 19% | 53.4 65% | 48.89 51% | 41.01 26% | 44.9 ? 38% | 64.4 ? 98% |
| Write Seq (MB/s) | 1235 | 1754 42% | 1216 -2% | 982 -20% | 1465 19% | 1162 ? -6% | 2516 ? 104% |
| Read Seq (MB/s) | 1417 | 1709 21% | 1291 -9% | 1301 -8% | 1453 3% | 1473 ? 4% | 2904 ? 105% |
| Write 4K Q32T1 (MB/s) | 390.8 | 461.9 18% | 401.5 3% | 625 60% | 322.6 -17% | 399 ? 2% | 422 ? 8% |
| Read 4K Q32T1 (MB/s) | 291 | 390.5 34% | 491.4 69% | 301 3% | 421.8 45% | 426 ? 46% | 548 ? 88% |
| Write Seq Q32T1 (MB/s) | 1384 | 2185 58% | 1224 -12% | 981 -29% | 1463 6% | 1348 ? -3% | 3931 ? 184% |
| Read Seq Q32T1 (MB/s) | 2350 | 3118 33% | 2314 -2% | 1631 -31% | 1751 -25% | 2398 ? 2% | 5439 ? 131% |
| AS SSD | 86% | 10% | 30% | 43% | 58% | 161% | |
| Seq Read (MB/s) | 1936 | 2387 23% | 2030 5% | 1748 -10% | 1491 -23% | 1921 ? -1% | 4138 ? 114% |
| Seq Write (MB/s) | 1237 | 2000 62% | 1071 -13% | 941 -24% | 1306 6% | 1128 ? -9% | 2738 ? 121% |
| 4K Read (MB/s) | 40.35 | 41.18 2% | 49.16 22% | 44.06 9% | 41.2 2% | 47.6 ? 18% | 58 ? 44% |
| 4K Write (MB/s) | 99.5 | 169.6 70% | 117.3 18% | 77.7 -22% | 118.1 19% | 137.9 ? 39% | 164.8 ? 66% |
| 4K-64 Read (MB/s) | 645 | 681 6% | 1268 97% | 451.1 -30% | 1033 60% | 878 ? 36% | 890 ? 38% |
| 4K-64 Write (MB/s) | 365.8 | 571 56% | 699 91% | 926 153% | 1007 175% | 782 ? 114% | 1761 ? 381% |
| Access Time Read * (ms) | 0.104 | 0.051 51% | 0.067 36% | 0.188 -81% | 0.103 1% | 0.09367 ? 10% | 0.07514 ? 28% |
| Access Time Write * (ms) | 0.038 | 0.025 34% | 0.168 -342% | 0.043 -13% | 0.031 18% | 0.03708 ? 2% | 0.08482 ? -123% |
| Score Read (Points) | 879 | 961 9% | 1520 73% | 670 -24% | 1223 39% | 1118 ? 27% | 1361 ? 55% |
| Score Write (Points) | 589 | 941 60% | 923 57% | 1098 86% | 1256 113% | 1033 ? 75% | 2200 ? 274% |
| Score Total (Points) | 1892 | 2384 26% | 3179 68% | 2084 10% | 3102 64% | 2694 ? 42% | 4200 ? 122% |
| Copy ISO MB/s (MB/s) | 708 | 1855 162% | 969 37% | 1347 ? 90% | 2567 ? 263% | ||
| Copy Program MB/s (MB/s) | 132.1 | 565 328% | 609 361% | 421 ? 219% | 763 ? 478% | ||
| Copy Game MB/s (MB/s) | 326.7 | 1360 316% | 232.4 -29% | 825 ? 153% | 1604 ? 391% | ||
| Média Total (Programa/Configurações) | 60% /
67% | 16% /
15% | 31% /
31% | 26% /
28% | 38% /
43% | 129% /
138% |
* ... menor é melhor
Continuous load read: DiskSpd Read Loop, Queue Depth 8
Placa gráfica
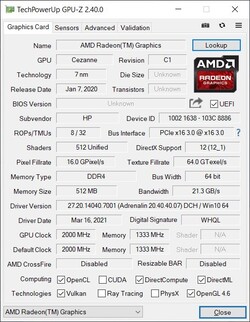
O Ryzen 7 5800U está equipado com o sistema integrado de Radeon RX Vega 8. Em comparação com a última geração, há principalmente melhorias nos detalhes. O desempenho é comparável em geral, embora nossa amostra de revisão não possa explorar todo o potencial do Vega 8 com a configuração de RAM de canal único. A atual Intel Xe Gráfica G7 (com 80 ou 96 EUs) é ligeiramente mais rápido nos testes sintéticos, mas o ProBook poderia reduzir a lacuna com outro módulo RAM.
Uma vantagem das novas iGPUs nos chips Ryzen 5000 é principalmente a maior eficiência durante a reprodução de vídeo, que então também tem um impacto positivo sobre o tempo de funcionamento da bateria. A carga da GPU durante a reprodução de um vídeo de 4K YouTube está apenas na faixa percentual de um dígito, enquanto que ainda estava ~60% nos predecessores (Gráficos Iris Xe ~30%).
Pelo menos títulos mais antigos ou alguns títulos mais exigentes podem ser jogados sem problemas com o iGPU, embora normalmente você esteja limitado a detalhes baixos a médios aqui.
No modo bateria, a performance da GPU não é reduzida e a performance permanece estável mesmo sob carga mais longa. Mais referências de GPU estão disponíveis em nossa seção de tecnologia
| 3DMark 11 Performance | 4663 pontos | |
| 3DMark Cloud Gate Standard Score | 18062 pontos | |
| 3DMark Fire Strike Score | 2356 pontos | |
| 3DMark Time Spy Score | 991 pontos | |
Ajuda | ||
Witcher 3 FPS-Diagram
| GTA V | |
| 1920x1080 Highest AA:4xMSAA + FX AF:16x | |
| Média da turma Convertible (7.14 - 83.5, n=41, últimos 2 anos) | |
| Média AMD Radeon RX Vega 8 (Ryzen 4000/5000) (6 - 18.2, n=42) | |
| HP ProBook x360 435 G8 R7-5800U | |
| Acer Spin 3 SP313-51N-56YV | |
| 1920x1080 High/On (Advanced Graphics Off) AA:2xMSAA + FX AF:8x | |
| Média da turma Convertible (6.88 - 166.9, n=42, últimos 2 anos) | |
| Média AMD Radeon RX Vega 8 (Ryzen 4000/5000) (13.8 - 40.6, n=45) | |
| Acer Spin 3 SP313-51N-56YV | |
| HP ProBook x360 435 G8 R7-5800U | |
| 1366x768 Normal/Off AF:4x | |
| Média da turma Convertible (46.6 - 162.2, n=37, últimos 2 anos) | |
| Média AMD Radeon RX Vega 8 (Ryzen 4000/5000) (34 - 148, n=43) | |
| Acer Spin 3 SP313-51N-56YV | |
| HP ProBook x360 435 G8 R7-5800U | |
| 1024x768 Lowest Settings possible | |
| Média da turma Convertible (50.6 - 172, n=42, últimos 2 anos) | |
| Média AMD Radeon RX Vega 8 (Ryzen 4000/5000) (53.6 - 160, n=48) | |
| Acer Spin 3 SP313-51N-56YV | |
| HP ProBook x360 435 G8 R7-5800U | |
| baixo | média | alto | ultra | |
|---|---|---|---|---|
| GTA V (2015) | 69.8 | 64.5 | 17.2 | 7.36 |
| The Witcher 3 (2015) | 42 | 14 | 9.33 | |
| Dota 2 Reborn (2015) | 108 | 79.2 | 38.6 | 36.4 |
| Final Fantasy XV Benchmark (2018) | 24.4 | 12 | 7.97 | |
| X-Plane 11.11 (2018) | 40 | 29.9 | 26.2 | |
| Strange Brigade (2018) | 48 | 18.7 | 15.8 | 13.9 |
Emissions & Energy
Emissões sonoras
O ventilador único do ProBook não é desagradavelmente alto mesmo sob carga, mas o problema é o controle do ventilador um tanto imaturo. Especialmente no perfil de alto desempenho do Windows, o ventilador começa de vez em quando, mesmo quando ocioso, sem nenhuma razão aparente. Aqui, o problema com o modo standby ocorre novamente, porque às vezes ficamos surpresos de que o ventilador também tenha começado. Nesses casos, o laptop simplesmente não entrou no modo standby corretamente. Não conseguíamos ouvir nenhum outro ruído eletrônico.
Barulho
| Ocioso |
| 23.7 / 27.5 / 34.4 dB |
| Carga |
| 36.2 / 38.7 dB |
 | ||
30 dB silencioso 40 dB(A) audível 50 dB(A) ruidosamente alto |
||
min: | ||
Temperatura
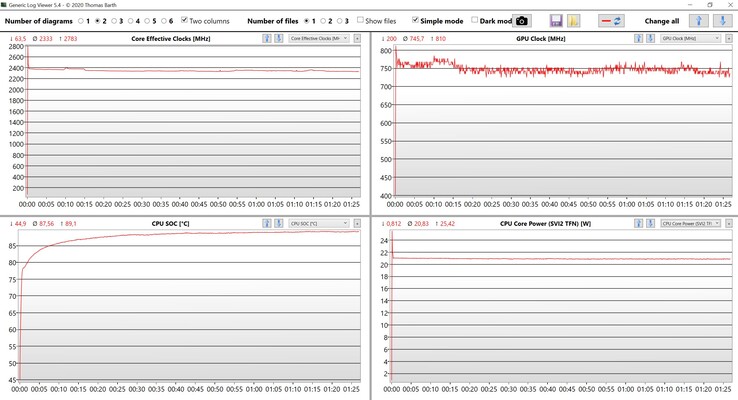
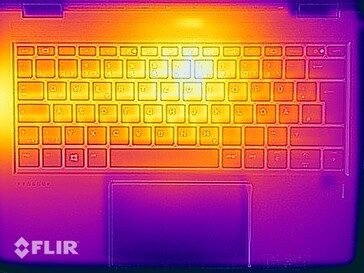
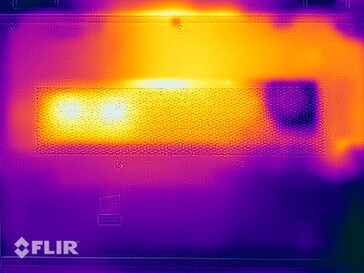
Sob carga, o estojo fica visivelmente quente em alguns lugares (<45 °C, 113 °F ) e o contato direto com a pele pode ser desagradável, mas não é de forma alguma crítico. De qualquer forma, não há restrições para tarefas normais de escritório. Como com a carga pura do processador, o consumo do SoC se fixa rapidamente em ~21 watts, o que ainda é suficiente para 8x 2,4 GHz (CPU) e ~750 MHz (iGPU). Não há perdas de desempenho diretamente após o teste de estresse.
(±) A temperatura máxima no lado superior é 43.8 °C / 111 F, em comparação com a média de 35.3 °C / 96 F , variando de 19.6 a 60 °C para a classe Convertible.
(-) A parte inferior aquece até um máximo de 47.4 °C / 117 F, em comparação com a média de 36.8 °C / 98 F
(+) Em uso inativo, a temperatura média para o lado superior é 24.2 °C / 76 F, em comparação com a média do dispositivo de 30.3 °C / ### class_avg_f### F.
(±) Jogando The Witcher 3, a temperatura média para o lado superior é 34.2 °C / 94 F, em comparação com a média do dispositivo de 30.3 °C / ## #class_avg_f### F.
(+) Os apoios para as mãos e o touchpad são mais frios que a temperatura da pele, com um máximo de 31.9 °C / 89.4 F e, portanto, são frios ao toque.
(-) A temperatura média da área do apoio para as mãos de dispositivos semelhantes foi 27.9 °C / 82.2 F (-4 °C / -7.2 F).
Orador
HP ProBook x360 435 G8 R7-5800U análise de áudio
(±) | o volume do alto-falante é médio, mas bom (###valor### dB)
Graves 100 - 315Hz
(-) | quase nenhum baixo - em média 25.4% menor que a mediana
(-) | graves não são lineares (15.6% delta para frequência anterior)
Médios 400 - 2.000 Hz
(+) | médios equilibrados - apenas 1.1% longe da mediana
(+) | médios são lineares (3% delta para frequência anterior)
Altos 2 - 16 kHz
(+) | agudos equilibrados - apenas 2.9% longe da mediana
(+) | os máximos são lineares (3.8% delta da frequência anterior)
Geral 100 - 16.000 Hz
(±) | a linearidade do som geral é média (18% diferença em relação à mediana)
Comparado com a mesma classe
» 38% de todos os dispositivos testados nesta classe foram melhores, 7% semelhantes, 55% piores
» O melhor teve um delta de 6%, a média foi 20%, o pior foi 57%
Comparado com todos os dispositivos testados
» 37% de todos os dispositivos testados foram melhores, 8% semelhantes, 55% piores
» O melhor teve um delta de 4%, a média foi 24%, o pior foi 134%
Lenovo ThinkPad L13 Yoga Gen2-20VK000VGE análise de áudio
(±) | o volume do alto-falante é médio, mas bom (###valor### dB)
Graves 100 - 315Hz
(-) | quase nenhum baixo - em média 19.4% menor que a mediana
(±) | a linearidade dos graves é média (10.4% delta para a frequência anterior)
Médios 400 - 2.000 Hz
(+) | médios equilibrados - apenas 3.9% longe da mediana
(+) | médios são lineares (3.7% delta para frequência anterior)
Altos 2 - 16 kHz
(±) | máximos reduzidos - em média 6.9% menor que a mediana
(+) | os máximos são lineares (6.2% delta da frequência anterior)
Geral 100 - 16.000 Hz
(±) | a linearidade do som geral é média (19.5% diferença em relação à mediana)
Comparado com a mesma classe
» 47% de todos os dispositivos testados nesta classe foram melhores, 7% semelhantes, 47% piores
» O melhor teve um delta de 6%, a média foi 20%, o pior foi 57%
Comparado com todos os dispositivos testados
» 48% de todos os dispositivos testados foram melhores, 7% semelhantes, 45% piores
» O melhor teve um delta de 4%, a média foi 24%, o pior foi 134%
Fujitsu LifeBook U9310X análise de áudio
(±) | o volume do alto-falante é médio, mas bom (###valor### dB)
Graves 100 - 315Hz
(-) | quase nenhum baixo - em média 15.4% menor que a mediana
(±) | a linearidade dos graves é média (11.9% delta para a frequência anterior)
Médios 400 - 2.000 Hz
(±) | médios mais altos - em média 11.1% maior que a mediana
(±) | a linearidade dos médios é média (12.5% delta para frequência anterior)
Altos 2 - 16 kHz
(±) | máximos mais altos - em média 8.7% maior que a mediana
(±) | a linearidade dos máximos é média (10.1% delta para frequência anterior)
Geral 100 - 16.000 Hz
(-) | o som geral não é linear (39.7% diferença em relação à mediana)
Comparado com a mesma classe
» 97% de todos os dispositivos testados nesta classe foram melhores, 1% semelhantes, 2% piores
» O melhor teve um delta de 6%, a média foi 20%, o pior foi 57%
Comparado com todos os dispositivos testados
» 95% de todos os dispositivos testados foram melhores, 0% semelhantes, 5% piores
» O melhor teve um delta de 4%, a média foi 24%, o pior foi 134%
Acer Spin 3 SP313-51N-56YV análise de áudio
(±) | o volume do alto-falante é médio, mas bom (###valor### dB)
Graves 100 - 315Hz
(-) | quase nenhum baixo - em média 30.2% menor que a mediana
(±) | a linearidade dos graves é média (10.3% delta para a frequência anterior)
Médios 400 - 2.000 Hz
(+) | médios equilibrados - apenas 4.1% longe da mediana
(±) | a linearidade dos médios é média (7.8% delta para frequência anterior)
Altos 2 - 16 kHz
(±) | máximos mais altos - em média 7.7% maior que a mediana
(+) | os máximos são lineares (6.9% delta da frequência anterior)
Geral 100 - 16.000 Hz
(-) | o som geral não é linear (31.9% diferença em relação à mediana)
Comparado com a mesma classe
» 91% de todos os dispositivos testados nesta classe foram melhores, 2% semelhantes, 7% piores
» O melhor teve um delta de 6%, a média foi 20%, o pior foi 57%
Comparado com todos os dispositivos testados
» 91% de todos os dispositivos testados foram melhores, 2% semelhantes, 8% piores
» O melhor teve um delta de 4%, a média foi 24%, o pior foi 134%
Consumo de energia
Sob carga leve, o ProBook é um pouco mais frugal do que seu Predecessor. Além do processador mais eficiente, a tela um pouco mais escura naturalmente desempenha um papel aqui. Vemos um máximo de 47,5 watts sob carga, que se fixa rapidamente em ~40 watts. A fonte de alimentação incluída de 65 watts é, portanto, perfeitamente suficiente.
| HP ProBook x360 435 G8 R7-5800U Vega 8, R7 5800U, Samsung PM991 MZVLQ512HALU | Lenovo ThinkPad L13 Yoga Gen2-20VK000VGE Iris Xe G7 80EUs, i5-1135G7, WDC PC SN730 SDBPNTY-256G | Fujitsu LifeBook U9310X UHD Graphics 620, i5-10210U, Toshiba KBG40ZNS512G NVMe | Acer Spin 3 SP313-51N-56YV Iris Xe G7 80EUs, i5-1135G7, Kingston OM8PCP3512F-AB | HP ProBook x360 435 G7, Ryzen 5 4500U Vega 6, R5 4500U, WDC PC SN520 SDAPNUW-512G | |
|---|---|---|---|---|---|
| Power Consumption | -27% | -10% | -3% | -6% | |
| Idle Minimum * (Watt) | 3.2 | 4.6 -44% | 2.9 9% | 3.5 -9% | 3.8 -19% |
| Idle Average * (Watt) | 5.5 | 7.3 -33% | 5.8 -5% | 6.6 -20% | 5.7 -4% |
| Idle Maximum * (Watt) | 6.4 | 10.2 -59% | 9.6 -50% | 8.5 -33% | 7.9 -23% |
| Load Average * (Watt) | 35.5 | 32.3 9% | 34.6 3% | 32.2 9% | 29.3 17% |
| Witcher 3 ultra * (Watt) | 36.4 | 35 4% | 32.5 11% | ||
| Load Maximum * (Watt) | 47.5 | 65.3 -37% | 50.7 -7% | 34.5 27% | 48.6 -2% |
* ... menor é melhor
| desligado | |
| Ocioso | |
| Carga |
|
Key:
min: | |
Power consumption Witcher 3 / Stress test
Duração da bateria
Os tempos de funcionamento da bateria com a bateria 45 Wh são muito bons, pois nosso teste WLAN funciona por cerca de 9,5 horas (~8 horas em pleno brilho) e o teste de vídeo ainda mais de 10 horas.
| Battery Runtime | |
| WiFi Websurfing | |
| Fujitsu LifeBook U9310X | |
| Média da turma Convertible (5.08 - 22, n=58, últimos 2 anos) | |
| HP ProBook x360 435 G7, Ryzen 5 4500U | |
| HP ProBook x360 435 G8 R7-5800U | |
| Acer Spin 3 SP313-51N-56YV | |
| Lenovo ThinkPad L13 Yoga Gen2-20VK000VGE | |
| WiFi Websurfing max. Brightness | |
| Fujitsu LifeBook U9310X | |
| HP ProBook x360 435 G7, Ryzen 5 4500U | |
| Média da turma Convertible (4.07 - 11.3, n=21, últimos 2 anos) | |
| HP ProBook x360 435 G8 R7-5800U | |
| Acer Spin 3 SP313-51N-56YV | |
| Lenovo ThinkPad L13 Yoga Gen2-20VK000VGE | |
Pro
Contra
Veredicto - Muito desempenho, mas uma exibição fraca
Com o novo processador Ryzen 5000, a oitava geração do ProBook x360 435 recebe uma atualização maciça de desempenho e o conversível compacto pode facilmente acompanhar muitas estações de trabalho de pleno direito em termos de desempenho multi-core. No entanto, se ele realmente precisa do modelo top, o Ryzen 7 5800Uousamos duvidar. Considerando a classificação como um modelo básico, um Ryzen 5 ou no máximo o Ryzen 7 5700U seria perfeitamente suficiente.
No uso diário, o ProBook faz muitas coisas bem, porque há bons dispositivos de entrada, todas as portas importantes e os tempos de funcionamento da bateria também são bons. Além disso, a caixa é de muito alta qualidade e dificilmente se distingue dos EliteBooks mais caros. A este respeito, o ProBook também tem uma vantagem sobre seus rivais, tais como o Lenovo ThinkPad L13 Yoga G2
O desempenho, a caixa e os dispositivos de entrada são os melhores, mas o visor padrão é muito reflexivo e o controle do ventilador é irritante. Os interessados no ProBook x360 435 G8 devem economizar o preço extra para o processador high-end e, ao invés disso, colocar o dinheiro em um dos displays opcionais (e mais brilhantes)
Os dois maiores problemas são a tela e o comportamento do ventilador. A tela padrão oferece basicamente uma boa qualidade de imagem para uso em escritório, mas o brilho simplesmente não é suficiente para compensar os reflexos do próprio painel refletor. Além disso, o ventilador freqüentemente inicia mesmo quando está ocioso, o que rapidamente se torna irritante. Com certeza você estaria melhor com uma configuração diferente (Ryzen 5000 e um visor mais brilhante)
Preço e disponibilidade
Nosso dispositivo de teste, o ProBook x360 435 G8, está atualmente disponível em Cyberport por pouco menos de 1.100 Euros(~$1305) disponível. Uma configuração mais barata com o Ryzen 5 5600U e menos memória está disponível a partir de 880 Euros (~$1044) na Notebooksbilliger.
HP ProBook x360 435 G8 R7-5800U
- 07/28/2021 v7 (old)
Andreas Osthoff


